QCC and SS in the Japanese Small and Mid-size Manufacturing · 37 QCC and SS in the Japanese Small...
19
37 QCC and SS in the Japanese Small and Mid-size Manufacturing Lumbidi Kupanhy 1. Does your company have QCC? 1.1. Who takes part in QCC activities? 1.2. Are QCC activities conducted after work? 1.3. QCC activities as overtime 1.4. QCC activities frequency and duration 2. Does your company use SS? 2.1. Number of suggestion per company per year 2.2. Number of suggestions per individual per year 2.3. Yen value of suggestions 3. Improvement 4. Discussion and conclusive suggestions 4.1. QCC 4.2. SS 4.3. Improvement and QCC 4.4. Improvement and SS 4.5. Improvement, QCC & SS 4.6. Improvement architects 4.7. Summary Based on a survey,1) the following analysis examines not only the extent to which quality control circles (QCC) and suggestions- systems (88) as JIT-supporting elements 2 ) have penetrated the Japanese small and mid-size manufacturing but also their possible contribution to improvement, i.e., the relationship between QCC, 88 and improvement. In addition, it deals with matters relating to improvements architects, the number of suggestions a company may get per year and the amount of money suggestions for improvement may be worth. After the presentation of the survey data, the conclusion tries to shed the light on the trend of the penetration of QCC and 88 in the small and mid-size manufacturing, on the relation between QCC, 88 and improvement; and on the financial advantage that may result from setting up QCC and 88 in a company. key words: QCC, SS, improvement, IC,Japanese small and mid-size manufacturing
Transcript of QCC and SS in the Japanese Small and Mid-size Manufacturing · 37 QCC and SS in the Japanese Small...
37
QCC and SS in the Japanese Small and Mid-size Manufacturing
Lumbidi Kupanhy
1. Does your company have QCC?
1.1. Who takes part in QCC activities?
1.2. Are QCC activities conducted after work?
1.3. QCC activities as overtime
1.4. QCC activities frequency and duration
2. Does your company use SS?
2.1. Number of suggestion per company per year
2.2. Number of suggestions per individual per year
2.3. Yen value of suggestions
3. Improvement
4. Discussion and conclusive suggestions
4.1. QCC
4.2. SS
4.3. Improvement and QCC
4.4. Improvement and SS
4.5. Improvement, QCC & SS
4.6. Improvement architects
4.7. Summary
Based on a survey,1) the following analysis examines not only the extent to which
quality control circles (QCC) and suggestions- systems (88) as JIT-supporting elements 2)
have penetrated the Japanese small and mid-size manufacturing but also their possible
contribution to improvement, i.e., the relationship between QCC, 88 and improvement. In
addition, it deals with matters relating to improvements architects, the number of
suggestions a company may get per year and the amount of money suggestions for
improvement may be worth. After the presentation of the survey data, the conclusion tries
to shed the light on the trend of the penetration of QCC and 88 in the small and mid-size
manufacturing, on the relation between QCC, 88 and improvement; and on the financial
advantage that may result from setting up QCC and 88 in a company.
key words: QCC, SS, improvement, IC,Japanese small and mid-size manufacturing

38
VI 80Q.t
.~ 600-E 40o(;I 20
o
A~EJYeS!Nol
~C91.47% 51.:%~310
Figure 1 Do you have QCC?
1. Does your company have QCC?
Does your company have QCC? 118 of a total of 129 companies covered by the survey
replied positively or negatively to the question. That represents 91.47% of the companies
(see Figure 1 A & B). Among that large majority (91.47%), a large minority of 48.31%
said they do use QCC (see Figure 1 A & C). Though 57 companies were identified as
possessing QCC, 54 clearly state to. To that number were added three others obtained by
deduction as the latter did not mention to have QCC: two of them specified that QCC
activities concern both their office and line workers while the third one specified that QCC
activities were conducted by office workers only.
Careful attention was paid to that large minority possessing QCC in order to deal with
the following questions: 1) Who takes part in QCC? 2) Are QCC activities conducted after
work? 3) Can QCC activities be considered overtime 4) How long does a QCC meeting last?
1.1. Who takes part in QCC activities?
87.72% of the 57 QCC companies (i.e. those that have QCC) gave details as to who is
involved in such activities. In 37 companies, QCC involves everyone, that is what in Japan
is referred to as total quality control (TQC) or company wide quality control (CWQC). 3)
Six companies mentioned office workers as those concerned by QCC while four companies
said those activities are reserved for line workers. For three companies, QCC is a matter of
office and line workers. The distribution of those involved in QCC is shown in Figure 2.
40:i: 30·c~ 20E 10ou 0
fb Everybody (74%) '~"""""--ls.:..!II Office workers (12%) ~: ~::III Line workers (8%) :::::::~~~~~:i~ Office & line workers (6%) <:;;::::::........______ , :J
Figure 2 Who takes part in QCC activities?
QCC and SS in the Japanese Small and Mid-size Manufacturing CL. Kupanhy) 39
1.2. Are QCC activities conducted after work?
Are QCC activities conducted after work? Among the 57 QCC companies, 25 said yes,
seven did not pay any attention to that question while the other 25 replied negatively.
Among the respondents, the average number of companies conducting such activities during
working hours is therefore 50%.
This reminds me of Daikin, a major air-conditioning manufacturing company where
production operators stop working for a half hour and devote that time to QCC activi
ties. 4)
1.3. QCC activities as overtime
If QCC activities take place after work, IS the time devoted to them considered
overtime (and duly paid)?
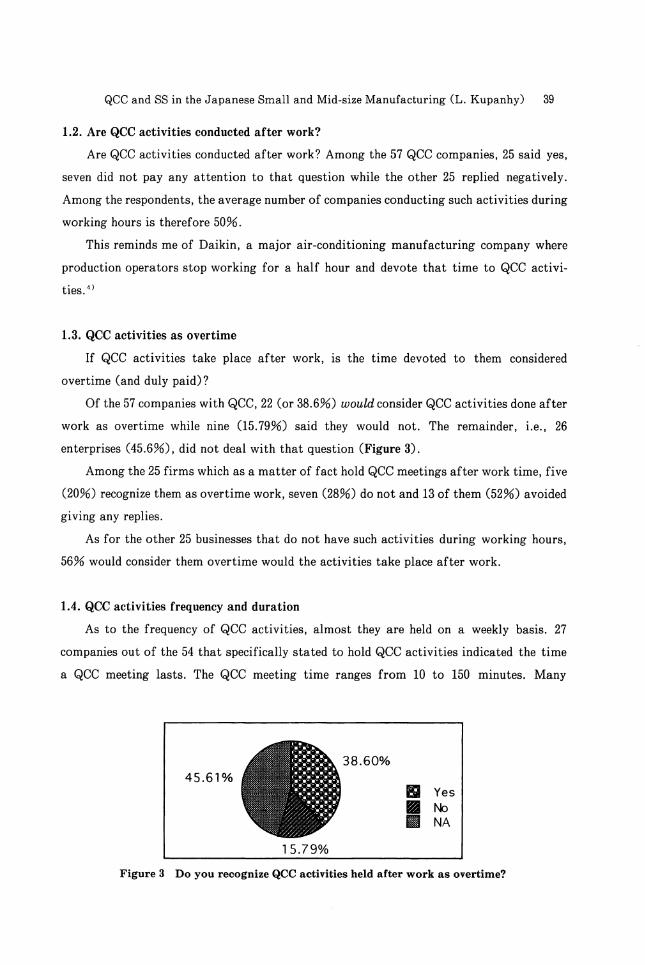
Of the 57 companies with QCC, 22 (or 38.6%) would consider QCC activities done after
work as overtime while nine (15.79%) said they would not. The remainder, i.e., 26
enterprises (45.6%), did not deal with that question (Figure 3).
Among the 25 firms which as a matter of fact hold QCC meetings after work time, five
(20%) recognize them as overtime work, seven (28%) do not and 13 of them (52%) avoided
giving any replies.
As for the other 25 businesses that do not have such activities during working hours,
56% would consider them overtime would the activities take place after work.
1.4. QCC activities frequency and duration
As to the frequency of QCC activities, almost they are held on a weekly basis. 27
companies out of the 54 that specifically stated to hold QCC activities indicated the time
a QCC meeting lasts. The QCC meeting time ranges from 10 to 150 minutes. Many
45.61 %38.60%
iGC1if'8G~
15.79%
BIt YesII Notil NA
Figure 3 Do you recognize QCC activities held after work as overtime?
40
200
,-..150VI
GJ....:1c:'§ 100,S.....,.GJ SOEt=
00 10 20
Companies30
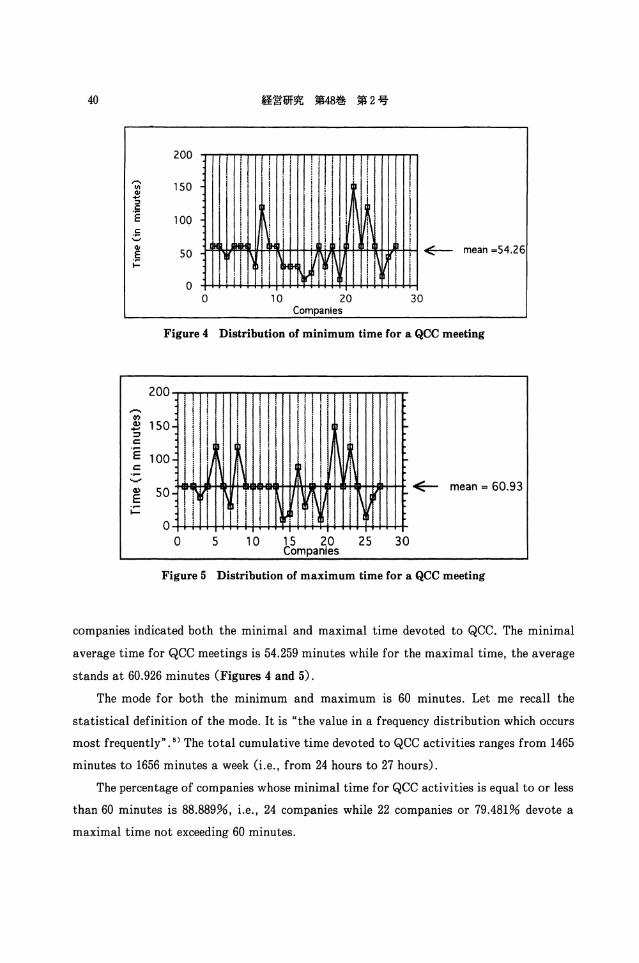
Figure 4 Distribution of minimum time for a QCC meeting
3015 20 25Companies
105O......~I-+-+-+-+-+-++-i-+-+-t~~l-t-t-+-++-+-+-t-+-+-+-+-
o
~
~ 50 ~8+lII-HlIHf-l-mRNINI~-H+t"""+&o~~~I-I-++ ~ mean = 60.93E~
,-..0')
~ 150:;,c:
'E 100
Figure 5 Distribution of maximum time for a QCC meeting
companies indicated both the minimal and maximal time devoted to QCC. The minimal
average time for QCC meetings is 54.259 minutes while for the maximal time, the average
stands at 60.926 minutes (Figures 4 and 5).
The mode for both the minimum and maximum is 60 minutes. Let me recall the
statistical definition of the mode. It is "the value in a frequency distribution which occurs
most frequently". 5) The total cumulative time devoted to QCC activities ranges from 1465
minutes to 1656 minutes a week (i.e., from 24 hours to 27 hours).
The percentage of companies whose minimal time for QCC activities is equal to or less
than 60 minutes is 88.889%, Le., 24 companies while 22 companies or 79.481% devote a
maximal time not exceeding 60 minutes.
QCC and SS in the Japanese Small and Mid-size Manufacturing (L. Kupanhy) 41
ADYes/No I
10.85%*.:-~~~:: B 3043%~:::::.:::;: • 0 69.57%:::<~~:' 89.15%)
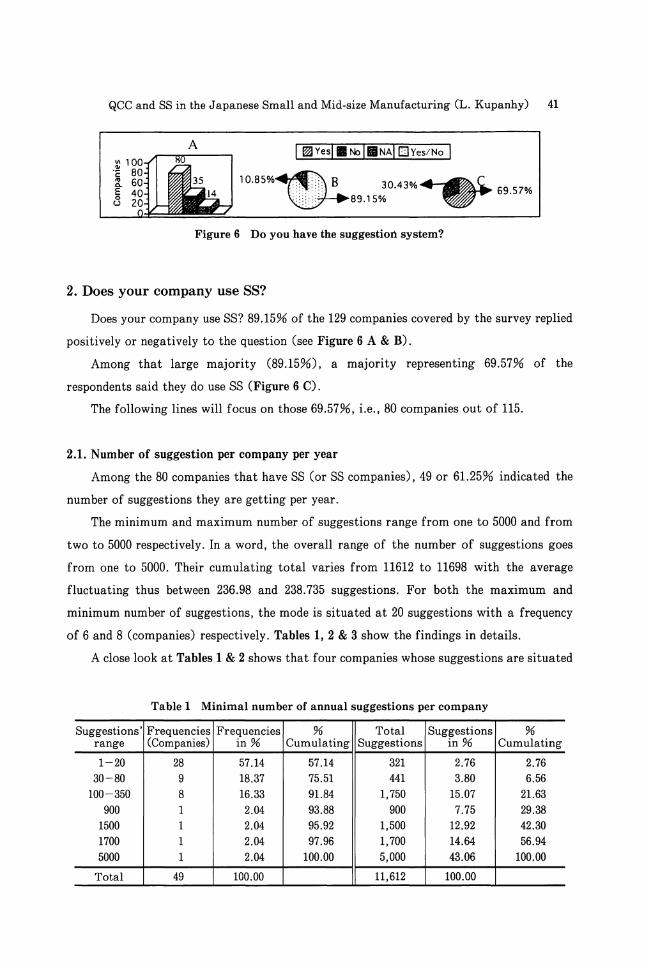
Figure 6 Do you have the suggestion system?
2. Does your company use SS?
Does your company use SS? 89.15% of the 129 companies covered by the survey replied
positively or negatively to the question (see Figure 6 A & B).
Among that large majority (89.15%), a majority representing 69.57% of the
respondents said they do use SS (Figure 6 C).
The following lines will focus on those 69.57%, i.e., 80 companies out of 115.
2.1. Number of suggestion per company per year
Among the 80 companies that have SS (or SS companies), 49 or 61.25% indicated the
number of suggestions they are getting per year.
The minimum and maximum number of suggestions range from one to 5000 and from
two to 5000 respectively. In a word, the overall range of the number of suggestions goes
from one to 5000. Their cumulating total varies from 11612 to 11698 with the average
fluctuating thus between 236.98 and 238.735 suggestions. For both the maximum and
minimum number of suggestions, the mode is situated at 20 suggestions with a frequency
of 6 and 8 (companies) respectively. Tables 1, 2 & 3 show the findings in details.
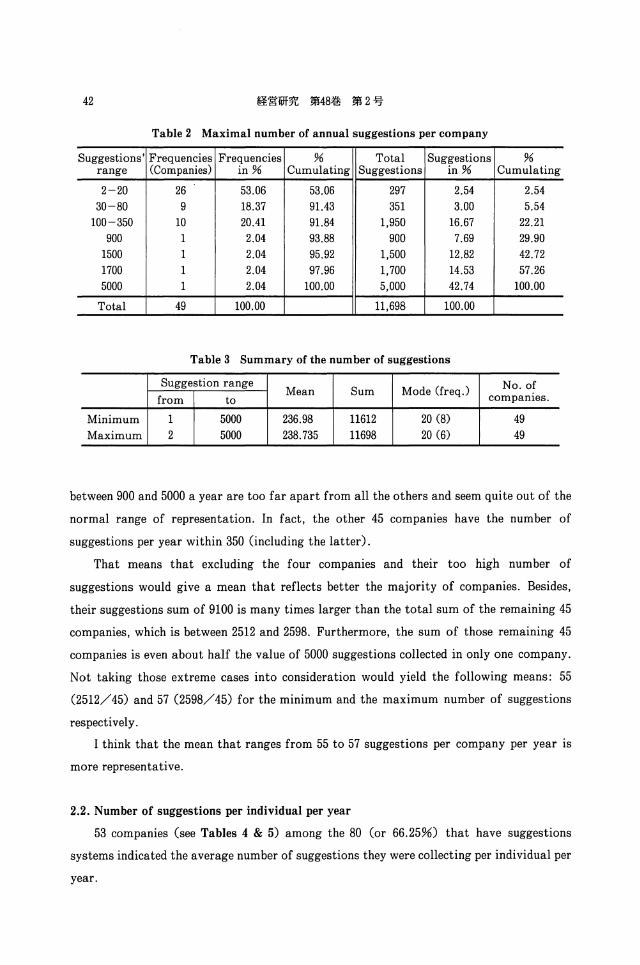
A close look at Tables 1 & 2 shows that four companies whose suggestions are situated
Table 1 Minimal number of annual suggestions per company
Suggestions' Frequencies Frequencies % Total Suggestions %range (Companies) in % Cumulating Suggestions in % Cumulating
1-20 28 57.14 57.14 321 2.76 2.7630-80 9 18.37 75.51 441 3.80 6.56
100-350 8 16.33 91.84 1,750 15.07 21.63
900 1 2.04 93.88 900 7.75 29.38
1500 1 2.04 95.92 1,500 12.92 42.30
1700 1 2.04 97.96 1,700 14.64 56.94
5000 1 2.04 100.00 5,000 43.06 100.00
Total 49 100.00 11,612 100.00
42
Table 2 Maximal number of annual suggestions per company
Suggestions' Frequencies Frequencies % Total Suggestions %range (Companies) in % Cumulating Suggestions in % Cumulating
2-20 26 53.06 53.06 297 2.54 2.5430-80 9 18.37 91.43 351 3.00 5.54
100-350 10 20.41 91.84 1,950 16.67 22.21900 1 2.04 93.88 900 7.69 29.90
1500 1 2.04 95.92 1,500 12.82 42.721700 1 2.04 97.96 1,700 14.53 57.265000 1 2.04 100.00 5,000 42.74 100.00
Total 49 100.00 11,698 100.00
Table 3 Summary of the number of suggestions
Suggestion rangeMean Sum Mode (freq.) No. of
from to companies.
Minimum 1 5000 236.98 11612 20 (8) 49Maximum 2 5000 238.735 11698 20 (6) 49
between 900 and 5000 a year are too far apart from all the others and seem quite out of the
normal range of representation. In fact, the other 45 companies have the number of
suggestions per year within 350 (including the latter).
That means that excluding the four companies and their too high number of
suggestions would give a mean that reflects better the majority of companies. Besides,
their suggestions sum of 9100 is many times larger than the total sum of the remaining 45
companies, which is between 2512 and 2598. Furthermore, the sum of those remaining 45
companies is even about half the value of 5000 suggestions collected in only one company.
Not taking those extreme cases into consideration would yield the following means: 55
(2512/45) and 57 (2598/45) for the minimum and the maximum number of suggestions
respectively.
I think that the mean that ranges from 55 to 57 suggestions per company per year is
more representative.
2.2. Number of suggestions per individual per year
53 companies (see Tables 4 & 5) among the 80 (or 66.25%) that have suggestions
systems indicated the average number of suggestions they were collecting per individual per
year.

QCC and SS in the Japanese Small and Mid-size Manufacturing (L. Kupanhy) 43
Table 4 Minimum individual suggestions per company
Suggestions' Frequencies Frequenciesranges (companies) in %
0.0-1.0 23 43.391.5-5.0 22 41.51
10.0-20.0 5 9.4330.0 1 1.8970.0 1 1.8985.0 1 1.89
Total 53 100.00
Table 5 Maximum individual suggestions per company
Suggestions' Frequencies Frequenciesranges (companies) in %
0.1-1.0 19 35.851.5-5.0 26 49.05
10.0-20.0 5 9.4330.0 1 1.8970.0 1 1.8985.0 1 1.89
Total 53 100.00
The number of individual suggestions ranges from zero to 85. The mode for the
minimum individual number of suggestions is one with a frequency recurrence of eleven.
The value two has the second highest frequency of ten. Concerning the maximum number of
suggestions, the mode is two but with a frequency of eleven. In the second position, there
are two values, that is one and three which have each a frequency of eight. Three companies
get each on average thirty, seventy, eighty-five individual suggestions respectively. That
seems to be so out of the normal range that they may be excluded in order to extrapolate
the result. The bulk of companies have the number of suggestions per individual varying
between zero and twenty (see Tables 4 & 5).
2.3. Yen value of suggestions
Those suggestions are worth some savings, of course. Of the 80 SS companies, 26 or
32.5% (see Tables 6 & 7) stated the amount of yen suggestions are worth.
The yen value of suggestions ranges from 1,000 yen (three companies) to 5,000,000 yen
(one company). The average varies from 696,538 to 718,077 yen. All together, the total
value for those suggestions ranges from 18,110,000 to 18,670,000 yen as one can see in Tables
44
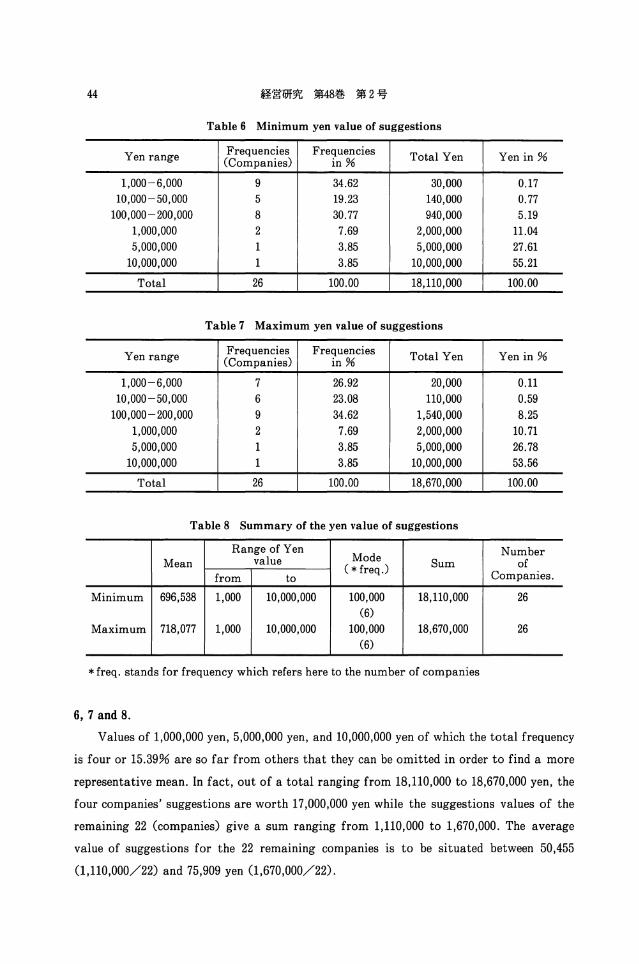
Table 6 Minimum yen value of suggestions
Yen range Frequencies Frequencies Total Yen Yen in %(Companies) in %
1,000-6,000 9 34.62 30,000 0.1710,000-50,000 5 19.23 140,000 0.77
100,000- 200,000 8 30.77 940,000 5.191,000,000 2 7.69 2,000,000 11.045,000,000 1 3.85 5,000,000 27.61
10,000,000 1 3.85 10,000,000 55.21
Total 26 100.00 18,110,000 100.00
Table 7 Maximum yen value of suggestions
Yen range Frequencies Frequencies Total Yen Yen in %(Companies) in %
1,000-6,000 7 26.92 20,000 0.1110,000-50,000 6 23.08 110,000 0.59
100,000- 200,000 9 34.62 1,540,000 8.251,000,000 2 7.69 2,000,000 10.715,000,000 1 3.85 5,000,000 26.78
10,000,000 1 3.85 10,000,000 53.56
Total 26 100.00 18,670,000 100.00
Table 8 Summary of the yen value of suggestions
Range of YenMode Number
Mean value Sum offrom to
(* freq.) Companies.
Minimum 696,538 1,000 10,000,000 100,000 18,110,000 26(6)
Maximum 718,077 1,000 10,000,000 100,000 18,670,000 26(6)
*freq. stands for frequency which refers here to the number of companies
6,7 and 8.
Values of 1,000,000 yen, 5,000,000 yen, and 10,000,000 yen of which the total frequency
is four or 15.39% are so far from others that they can be omitted in order to find a more
representative mean. In fact, out of a total ranging from 18,110,000 to 18,670,000 yen, the
four companies' suggestions are worth 17,000,000 yen while the suggestions values of the
remaining 22 (companies) give a sum ranging from 1,110,000 to 1,670,000. The average
value of suggestions for the 22 remaining companies is to be situated between 50,455
(1,110,000/22) and 75,909 yen (1,670,000/22).

QCC and SS in the Japanese Small and Mid-size Manufacturing (L. Kupanhy) 45
A ~!3NAI0Yes/Nol
_C;:.~:~8%66.67%
33.33%
Figure 7 Have you made any improvement thanks to QCC/SS?
VI.~c...,CLEou
o Engineers• OperatorsIII Consultatns
3. Improvement
Figure 8 Contribution to improvement
The questionnaire wanted to know whether some improvements were realized thanks to
QCC and/or SS. 86 companies dealt with the question about improvement and the
remaining 43 paid no attention to it. The number of respondents represents 66.67 % (Figure
7 A & B) among which 83.7% or 72 companies made some kind of improvement. 14
companies or 16.21% said no improvements were accomplished (Figure 7 A & C).
I will dig in the group of those 72 improvement companies (IC) , Le., companies with
some kind of improvement to their credit, in order to know their authors. In fact, 67 IC out
of 72 or 93.06% answered the question concerning the architects of improvement. The
contribution to improvement has the following configuration. Engineers participated in 38,
operators contributed in 47 and consultants in five companies as shown in Figure 8. That
represents 56.71%; 70.15% and 7.46% respectively.
It is worth noting that the total frequencies (38+47+5) of 90 exceed the total of 67 Ie
which dealt with the question about improvement authors. The same holds also for the
total of their percentages (56.71 + 70.15 + 7.46 = 134.32) that exceeds 100%.
The fact that the arithmetic summation fails to reflect correctly the reality means
that no one is allowed to perform this operation at that stage of the analysis because doing
so necessarily implies that some companies where more than one category of workers have
26
46
~ 30.~
fa 20
~u 10
o
Improvement by
D Engineers only
II Operators only
II Consultatnts only~ Eng. & operatorsbJ Eng., oper. & consultants
iI&lP'......../~~AI'~--~. Consultants & operators
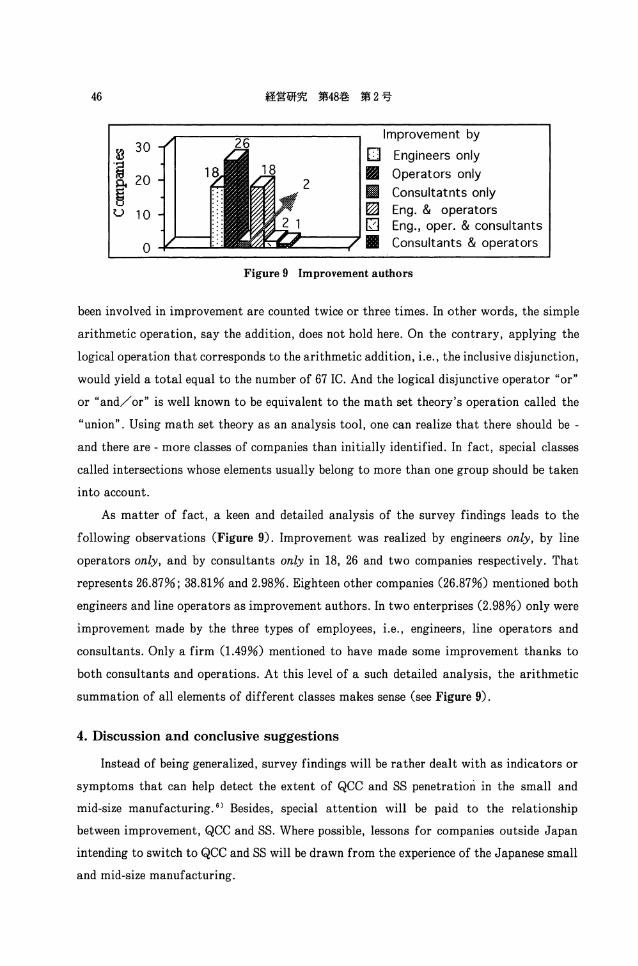
Figure 9 Improvement authors
been involved in improvement are counted twice or three times. In other words, the simple
arithmetic operation, say the addition, does not hold here. On the contrary, applying the
logical operation that corresponds to the arithmetic addition, i.e., the inclusive disjunction,
would yield a total equal to the number of 67 IC. And the logical disjunctive operator "or"
or "and/or" is well known to be equivalent to the math set theory's operation called the
"union". Using math set theory as an analysis tool, one can realize that there should be
and there are - more classes of companies than initially identified. In fact, special classes
called intersections whose elements usually belong to more than one group should be taken
into account.
As matter of fact, a keen and detailed analysis of the survey findings leads to the
following observations (Figure 9). Improvement was realized by engineers only, by line
operators only, and by consultants only in 18, 26 and two companies respectively. That
represents 26.87%; 38.81% and 2.98%. Eighteen other companies (26.87%) mentioned both
engineers and line operators as improvement authors. In two enterprises (2.98%) only were
improvement made by the three types of employees, Le., engineers, line operators and
consultants. Only a firm (1.49%) mentioned to have made some improvement thanks to
both consultants and operations. At this level of a such detailed analysis, the arithmetic
summation of all elements of different classes makes sense (see Figure 9).
4. Discussion and conclusive suggestions
Instead of being generalized, survey findings will be rather dealt with as indicators or
symptoms that can help detect the extent of QCC and SS penetration in the small and
mid-size manufacturing. 6) Besides, special attention will be paid to the relationship
between improvement, QCC and SSe Where possible, lessons for companies outside Japan
intending to switch to QCC and SS will be drawn from the experience of the Japanese small
and mid-size manufacturing.
QCC and SS in the Japanese Small and Mid-size Manufacturing CL. Kupanhy) 47
4.1. QCC
Of the 129 companies covered by the survey, 57 have QCC and 61 do not (Figure 1). As
one can see it, the forces of changes toward QCC, i.e. JIT,7) are almost equal to those of
stagnation. If this tendency is real as the paper would like to suggest, it seems foreseeable
that, in the future, most small and mid-size manufacturing enterprises will feature QCC.
37 companies out of 50 said QCC activities involve everyone (Figure 2). That reminds
of Toyota where they are part of the duty of all workers, including management people.
QCC activities are conducted after work ( in 50% of the companies) or during work time.
A company trying to implement QCC outside Japan would better think of conducting
such activities during the working hours. If conducted after work, such activities should be
considered overtime as does the minority (38.6%) of surveyed companies (Figure 3).
No best suggestions could be made about the length of time for a QCC meeting:
depending on the good the company is getting from QCC activities, both extremities of 10
and 150 minutes sound acceptable. If 10 minutes seem too short, the time may be extended
and if 150 minutes look too long so that there is a lot of "waiting time" for ideas to come
out, the time may be shortened. As to the frequency of QCC meetings, once a week may be
a good thing as is the case for most of surveyed companies.
4.2. SS
The findings of the survey suggest that more and more companies of the small and
mid-size manufacturing are heading for SS and that even most of them are already SS
companies. In fact, the forces of resistance to becoming SS companies have been detected in
a minority of about 30% among the enterprises covered by the survey ( see Figure 6).
The number of suggestions per year ranges from one to 5000 though most companies
(34 companies out of 49 or 69.4%) are getting 50 suggestions or less. The minimal number
of one suggestion per year (in two companies, see Table 1) should be considered as the
starting point which should not last for a long time. That is almost the zero level. The
numbers 5000; 1500; 1700 and 900 suggestions, each with a frequency of one, which, I
thought, would better be excluded in order to find a more representative mean should be
regarded as showing the trends or the new orientations of companies that are succeeding in
implementing JIT. In fact, big JIT-corporations are collecting millions of suggestions (see
Table 9).
The least performing companies get less than one suggestion per individual while the
three most performing ones have respectively 30, 70 and 85 suggestions per individual. The

48
Table 9 The ten most active kaizen programs in Japan, 1990
Company
1. Kawasaki Heavy2. Nissan3. Toshiba4. Matsushita5. Mazda6. Toyota7. Otu tire8. Nihon Victor9. Nissan Diesel
10. Fuji Heavy Ind.
Total suggestions
6,980,8706,043,3444,166,8644,114,3982,417,2642,003,6461,475,7071,247,5231,169,745
998,359
Ideas per person
426.5126.976.443.7
113.035.0 8
1,185.383.1
226.888.1
Source: The Japan Human Relations Association, Summary of JapaneseSuggestions Activities Survey, 1991. See S Alan G. Robinson & DeanM. Schroeder "Training, continuous improvement and humanrelations: the US TWI programs and the Japanese Style", CaliforniaManagement Review, Vo1.35, no.2, Winter 1993, p.35-57
Table 10 Yen value of suggestions at Nissan Chemical and Canon
Period Company Investment in SS cost savings (yield)
1978'-'82 Nissan Chemicals * 125,000 600,000 yen
1981; 1987 Nissan Chemicals * 160,000 630,000 yen
1983 Canon * 250,000 19,300,000 yen
1986 Toyota** NA 230,000,000 US $
* Adapted from Imai, Kaizen. The key to Japan's competitive success, Singapore:McGraw-Hill, 1991, pp.107-120
** Adapted from K. Ohmae, The mind of the strategist, NY. :Penguin Books, 1983,p.207
company getting 85 suggestions is almost as good as some big JIT corporations that are
among the ten-top leaders as regards the number of collected suggestions (see Table 9).
The company benefiting the most from suggestions earned 5,000,000 yen. Toyota - and
probably all big JIT-corporations - with tens of thousands of workers and millions of
suggestions earns hundreds of millions 9) (see Table 10). The amount of 5,000,000 yen was
excluded in order to satisfy the requirements of the pure statistician who sticks to the
meaningness of a representative mean. But in a field under change like the manufacturing
sector facing the challenge of JIT, this big amount is full of meaning since it tells anyone
wanting to implement JIT that suggestions are a source of revenues. The clear message is
that a company can earn millions from the ideas of its work force.
Improvements in the JIT production environment are made through QCC and/or
QCC and SS in the Japanese Small and Mid-size Manufacturing CL. Kupanhy) 49
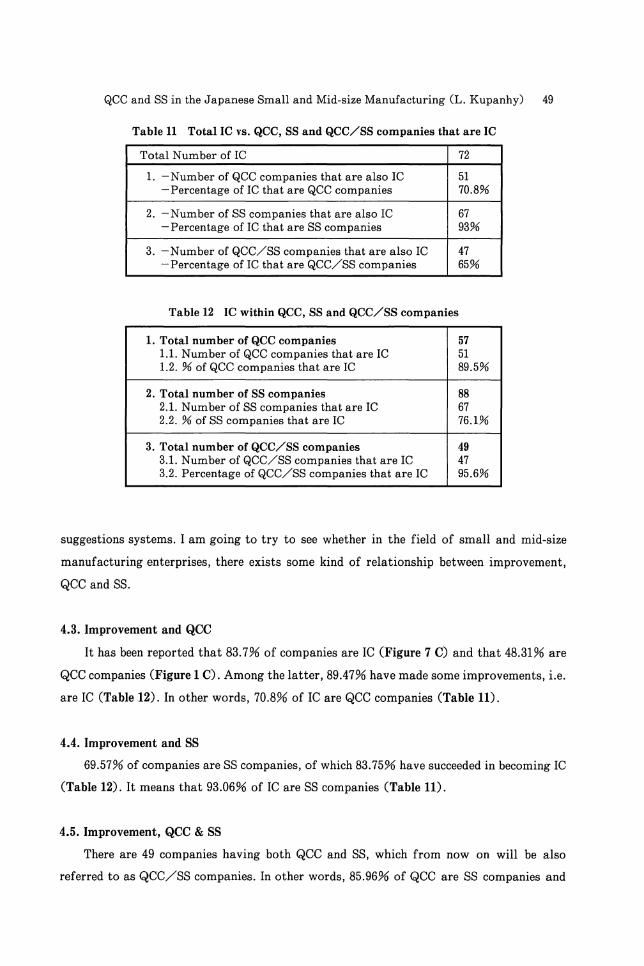
Table 11 Total IC vs. QCC, SS and QCC/SS companies that are IC
Total Number of IC 72
1. - Number of QCC companies that are also IC 51- Percentage of IC that are QCC companies 70.8%
2. -Number of SS companies that are also IC 67- Percentage of IC that are SS companies 93%
3. - Number of QCC/SS companies that are also IC 47- Percentage of IC that are QCC/SS companies 65%
Table 12 Ie within QCC, SS and QCC/SS companies
1. Total number of QCC companies 571.1. Number of QCC companies that are IC 511.2. % of QCC companies that are IC 89.5%
2. Total number of SS companies 882.1. Number of SS companies that are IC 672.2. % of SS companies that are IC 76.1%
3. Total number of QCC/SS companies 493.1. Number of QCC/SS companies that are IC 473.2. Percentage of QCC/SS companies that are IC 95.6%
suggestions systems. I am going to try to see whether in the field of small and mid-size
manufacturing enterprises, there exists some kind of relationship between improvement,
QCC and SSe
4.3. Improvement and QCC
It has been reported that 83.7% of companies are IC (Figure 7 C) and that 48.31% are
QCC companies (Figure 1 C). Among the latter, 89.47% have made some improvements, i.e.
are IC (Table 12). In other words, 70.8% of IC are QCC companies (Table 11).
4.4. Improvement and SS
69.57% of companies are SS companies, of which 83.75% have succeeded in becoming IC
(Table 12). It means that 93.06% of IC are SS companies (Table 11).
4.5. Improvement, QCC & SS
There are 49 companies having both QCC and SS, which from now on will be also
referred to as QCC/SS companies. In other words, 85.96% of QCC are SS companies and
50
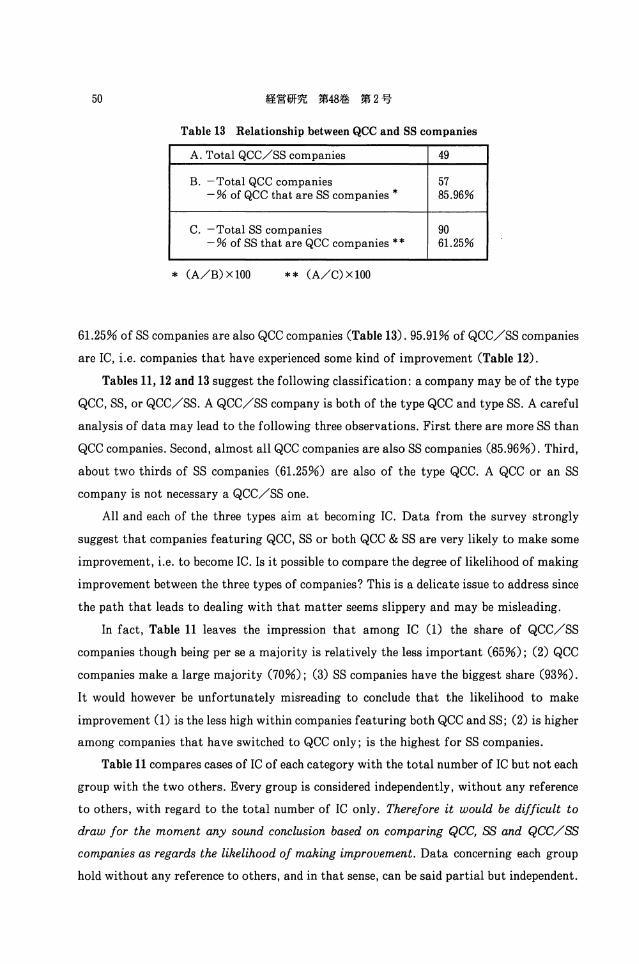
Table 13 Relationship between QCC and SS companies
A. Total QCC/SS companies 49
B. -Total QCC companies 57- % of QCC that are SS companies * 85.96%
C. -Total SS companies 90- % of SS that are QCC companies ** 61.25%
* (A/B) xl00 ** (A/C) X 100
61.25% of SS companies are also QCC companies (Table 13).95.91% of QCC/SS companies
are IC, i.e. companies that have experienced some kind of improvement (Table 12).
Tables 11, 12 and 13 suggest the following classification: a company may be of the type
QCC, SS, or QCC/SS. A QCC/SS company is both of the type QCC and type SSe A careful
analysis of data may lead to the following three observations. First there are more SS than
QCC companies. Second, almost all QCC companies are also SS companies (85.96%). Third,
about two thirds of SS companies (61.25%) are also of the type QCC. A QCC or an SS
company is not necessary a QCC/SS one.
All and each of the three types aim at becoming IC. Data from the survey strongly
suggest that companies featuring QCC, SS or both QCC & SS are very likely to make some
improvement, i.e. to become IC. Is it possible to compare the degree of likelihood of making
improvement between the three types of companies? This is a delicate issue to address since
the path that leads to dealing with that matter seems slippery and may be misleading.
In fact, Table 11 leaves the impression that among IC (1) the share of QCC/SS
companies though being per se a majority is relatively the less important (65%); (2) QCC
companies make a large majority (70%); (3) SS companies have the biggest share (93%).
It would however be unfortunately misreading to conclude that the likelihood to make
improvement (1) is the less high within companies featuring both QCC and SS; (2) is higher
among companies that have switched to QCC only; is the highest for SS companies.
Table 11 compares cases of IC of each category with the total number of IC but not each
group with the two others. Every group is considered independently, without any reference
to others, with regard to the total number of IC only. Therefore it would be difficult to
draw for the moment any sound conclusion based on comparing QCC, SS and QCC/SS
companies as regards the likelihood of making improvement. Data concerning each group
hold without any reference to others, and in that sense, can be said partial but independent.

QCC and SS in the Japanese Small and Mid-size Manufacturing (L. Kupanhy) 51
, .39%
5.56%
o QCC & SS companiesE3 QCC companies only18 S5 companies only• Unspecified
Figure 10 Distribution of IC with regard to QCC and/or SS
Based on these data, no sound correlation can easily be established between the groups.
Table 12 displays the results of digging in each category to see how many of its
members made some improvement. At this level, the most revealing fact is that most
QCC/SS companies credited themselves with improvement (95.6%). Furthermore, Figure
10 which can be thought of as the integrated level of Tables 11 & 12 reveals that the large
majority of companies with improvement are those featuring both QCC and SS (65%). In
other words, the probability of making some improvement seems the highest in companies
featuring both QCC & SSe While Table 12 shows that there are more IC among QCC
companies (89.5%) than among SS ones (76%), Figure 10 suggests that, when things are
integrated, the likelihood for companies to turn IC is far higher in SS companies (27%)
than in QCC enterprises (5.5%). But this may be due to the fact that, so far as the survey
is concerned, there are numerically speaking more SS companies than QCC companies. Why
are there more SS firms than QCC ones?
I think it may be so because SS are easier to carry out. What is needed is just to install
suggestions boxes and to motivate people to suggest. SS require neither special structures
nor special time. That may be also the first step to implement for a company outside Japan
that wants to switch to continuous improvement. Introducing QCC can come next as the
latter would probably need to be given more thought to: when should QCC activities take
part? How long should QCC meeting last? etc. I think SS can be carried out without QCC
but the latter should be always accompanied by the former. That explanation sheds the
light on the fact that the number of SS companies that are also QCC companies is lower
(61%) than that of QCC enterprises that feature also SS (85.96%).
Anyway, the most important thing to remember is that if a company carries out both
SS and QCC programs, it has more chances of making improvements and even of sustaining
52
them because QCC and SS are permanent structures.
4.6. Improvement architects
One would have surely realized that the base of improvement seems to be the line
workers. In fact, the majority of companies with improvement are those where line workers
contributed.
Though I know from my experience of the JIT study that line workers are the real
architects of improvement, I do not feel one can from the preceding facts confirm the same
at this level of the present study. Does the quantitative superiority of IC where line workers
participated (see Figure 8) mean that on the whole those cases of improvement are also
qualitatively superior? If I have to keep my trust in JIT theories and practice, the
importance of line workers cannot be neglected and is out of any doubt. lO) But for the case
of the survey, one should not forget that the survey focused mainly on the number of
companies that have made some kinds of improvement and not the nature or value of
improvement itself which is much close to the field of industrial engineering and/or value
engineering.
However, in order to get a glimpse of the real architects of improvement, let us try to
find out whether there is a correlation between improvements, their yen values, their
authors and the number of companies in which they occurred. The yen values of improve
ment were obtained indirectly by the yen values of suggestions because an improvement is
a result of applying suggestions for improvement.
24 companies out of the only 26 that indicated the yen values of their suggestions (
Tables 6, 7 and 8) will be considered because two companies whose total yen values vary
from 150,000 to 200,000 yen will not be taken into account. In fact, one of the two did not
answer the question about improvement while the other said it made no improvement
though it indicated however the yen value of its suggestions.
As for the yen values of improvement, engineers contributed in 12 companies for a
total amount varying between 16,243,000 and 16,653,000 yen, operators in 17 companies for
a sum situated between 16,747,000 and 17,257,000 Yen. Consultants contributed to
improvement in one company for a total of 30,000 Yen. As one sees, the total number of
contribution and that of companies in which those improvement values are mentioned
exceed the total number of amount of yen contribution and that of companies. That can be
seen in comparing Table 14 with Tables 6, 7 & 8. It means that a more detailed analysis of
data is needed, groups should redefined and new ones constituted before one can perform the

QCC and SS in the Japanese Small and Mid-size Manufacturing (L. Kupanhy) 53
Table 14 Total value of improvement by job category
Job category companiesRange (in yen)
from to
Engineers 12 16,243,000 16,653,000Operators 17 16,747,000 17,257,000Consultants 1 30,000 30,000Others 1 100,000 100,000Total 31 33,120,000 34,040,000
Table 15 Exclusive contribution by category of workers
Category of workers companiesRange (in yen)
from to
Engineers only 6 1,113,000 1,113,000Operators only 10 1,587,000 1,687,000Consultants only 0 0 0Others 1 100,000 100,000Both engineers & operators 6 15,130,000 15,540,000Both operators & consultants 1 30,000 30,000
Total 24 17,960,000 18,470,000
addition of their elements.
Table 15 shows the detailed and exclusive contributions by each category of employees.
In six companies, contribution to improvement was by engineers only and that represents
an amount of 1,113,000 yen. In 10 companies, only operators did make improvements worth
1,587,000"'-1,687,000 yen. There is not a single case of improvement by consultants only. In
the nine remaining companies, the contribution were by both operators & engineers or
operators & consultants (see Table 15).
If one subtracts the three extreme values of 10,000,000, 5,000,000 and 1,000,000 yen the
contribution by both operators and engineers falls to 130,000 yen and 540,000 yen
respectively. But everybody knows that there is no need to do so because this indicates an
orientation toward progress.
Numerically speaking, only consultants seem not to play an important role in
improvement. In fact, it seems that the least involved people concerning improvements
companies have realized are consultants. Is that due to the fact that, because of the lack of
sufficient funds small companies usually suffer from, the small and mid-size manufactur
ing can hardly afford to hire consultants? Or does it mean that consultants do not really
play any important role in improvements made at the work place? Both questions can
54
accept a yes- or a no-answer since both options are and remain possible because either is
worth defending.
However, it would be wise, because there are no sufficient data, not to draw any firm
conclusions about small and mid-size manufacturing concerning the real architects of
improvement between engineers, line workers and consultants though Table 14 suggests
strongly the importance of those people who have their hands on the machine every day,
Le., line workers (over engineers who work in air-conditioned rooms or laboratories and
over consultants who do not know the work place very well).
4.7. Summary
QCC, SS and improvement as JIT features are not absent in the Japanese small and
mid-size manufacturing. On the contrary, their presence is strongly felt there, with the
extent of SS penetration being seemingly far larger than that of QCC.
Improvement can be made without QCC or SSe However QCC and SS being by their
nature and purpose permanent instances for improvement, it seems almost impossible to
sustain continuous improvement without them. Besides, the paper has (1) suggested
strongly that companies featuring both QCC and SS are the most likely to make
improvement, i.e. they have a very high probability to turn IC; (2) seemed to justify two
important JIT principles: (a) improvement activities are more effective when involving
everyone concerned with the company; and (b) the most valuable source of improvement
is in all probabilities made up of those people who have their hands and mind on the
machine/process every day, Le., line workers.
1) Concerning the survey, please refer to L. Kupanhy, (a) "Japanese Management in the
Small and Mid-size Manufacturing: a survey", Keieikenkyu (Osaka City University), Vol.
43, No.3, 1992; (b) Japanese Manufacturing Company: JIT production method and manage
ment strategies, doctoral dissertation, Graduate School of Business Administration, Osaka
City University, Nov. 1993, Ann Arbor, Mich.: UMI Dissertation Services, 1994; (c) "Does the
Japanese small and mid-size manufacturing use JIT? - A survey-based study" , Osaka City
University Business Review, No.5, 1994
2) This paper, though looking like a stand-alone one, may be read as complementary to
"Does the Japanese Small and Mid-size Manufacturing Use JIT? - A Survey-based Study"
3) M. Imai, Kaizen. The key Japan's competitive success, 1991, notes that "TQC is often
understood in the West as part of QC activities, and it has often been thought to be the job for
quality control engineers. Given the danger that the name TQC might be misleading and
might fail to clearly communicate the scope of Japanese-style TQC, the term company-wide
quality control (CWQC) was coined as a more precise term to use in explaining Japanese
QCC and SS in the Japanese Small and Mid-size Manufacturing (L. Kupanhy) 55
quality control to overseas observers" , P .43
4) I visited two factories of that company in Sakai City, Osaka Prefecture (in 1990)
5) The Living Webster. Encyclopedic Dictionary of the English Language, Charles E, Tuttle
Co., Tokyo, 1975
6) The paper tries to detect trends toward JIT among the small and mid-size manufacturing.
Please refer also to L.Kupanhy, (a) Japanese Manufacturing Company: JIT production
method and management strategies, and (b) "Does the Japanese small and mid-size
manufacturing use JIT? - A survey-based study" .
7) According to L. Kupanhy, QCC as well as SS are JIT elements. See L. Kupanhy, Japanese
Manufacturing Company: JIT production method and management strategies; and "Does
the Japanese small and mid-size manufacturing use JIT? -- A survey-based study"
8) It is curious to notice that there is a decline in suggestions at Toyota. In 1986, there were
2,650,000 suggestions in total averaging 48 suggestions per employee (Production at Toyota.
-Our basic philosophy, Toyota TMC, without data), p.27
9) According to K. Ohmae, The mind of the strategist, N.Y.: Penguin Books, 1983, Toyota
was getting suggestions worth $ 230 million, p. 207
10) See D. A. Garvin, "Quality on the line" , Harvard Business Review, Sept./Oct. 1983, pp.
65-75; R. J. Schonberger, "Production workers bear major quality responsibility in
Japanese industry" , Industrial Engineering, December 1982, pp. 34-40