Paradigm Shift in Comparability Assessment - QbD and PAT can improve SAR evaluation

QbD Track 2: Real Time Release Testing/New Technologies IFPAC-2016
QbD/PAT/RTRT application and regulatory interaction in Japan
Hiroshi Nakagawa, Ph.D Formulation Technology Research Laboratories, Daiichi Sankyo Co., Ltd. January 26, 2016

2
RTRT approval in April 2011 (DVT: Deep vein thrombosis)
Appearance, ID, UDU, Dissolution and Assay
Edoxaban Tablets (Lixiana®: Japan)
15-mg tablets 30-mg tablets
RTRT approval in September 2014 (AF: Atrial Fibrillation/VTE: Venous thromboembolism)
Dose addition and Dissolution design space change
60-mg tablets
3
CQA
MA MA MA MA MA MA MA p-CMA
PP PP PP PP PP PP PP PP PP
p-CPP
p-CPP
p-CPP
p-CPP
MA MA MA MA
MA MA
p-CMA
p-CMA
p-CMA
CMA
CMA
CPP
PP
PP
Fish bone, PHA, FMEA
FMEA
Fish bone, PHA, FMEA
FMEA
PAT
CPP
Attribute based design space
RTRT
CMA (Critical Material Attribute) Based Approach
Enhanced QbD Approach in Edoxaban Tablets
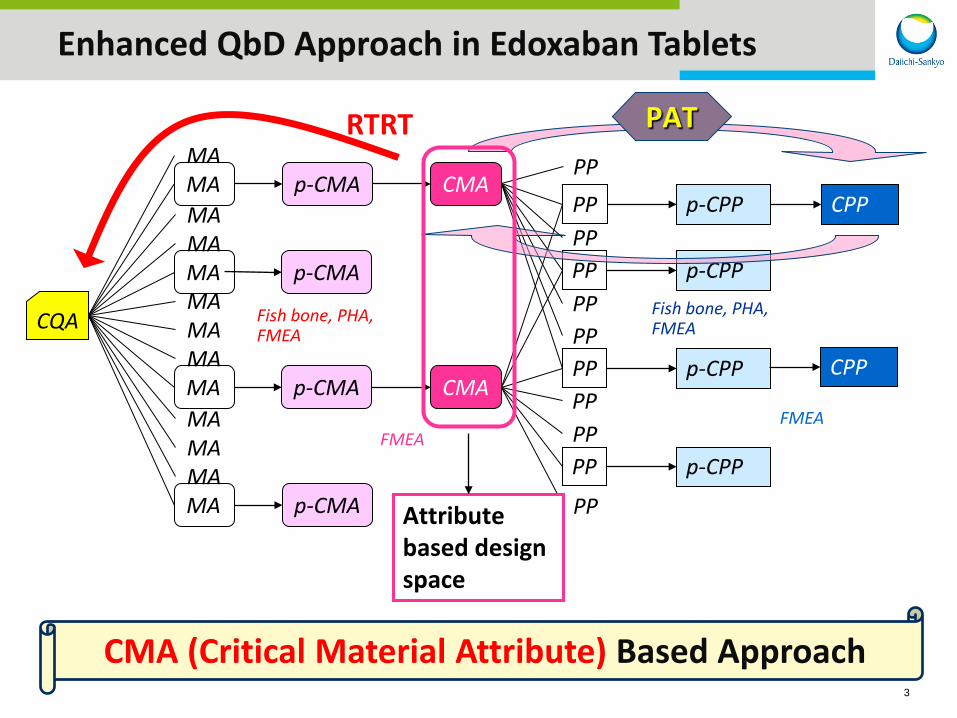
Advantage of CMA Based Approach
Design space
Tableting Pressure Rotational Speed Feed Rate Turn Table Rotational Speed
API particle size Tablet Hardness
Dissolution Equipment A Equipment B
PAT PAT
CPP CPP Milling Tableting
Ex. In case that two CMAs of API particle size and tablet hardness affect CQA of dissolution (General example)
CMA
Pros Cons Design space portability for manufacturing site/equipment change Scale independent
Finding CMA with comprehensive risk assessment
CMA monitoring method development
5
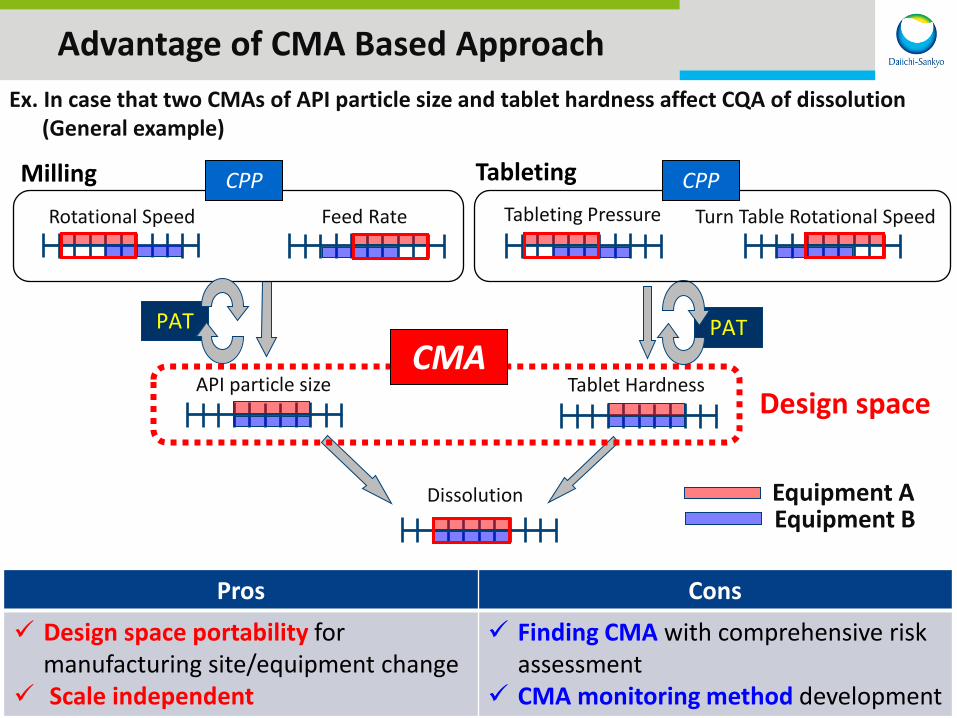
Control Strategy in Edoxaban Tablets Manufacturing
Film-Coating
Drug Product
Drug Substance
Packaging
Blending
Tableting
Granulation
Assay Uniformity of Dosage Units (UDU) Dissolution
RTRT has been applied to all spec. items for Edoxaban Tablets in Japan market.
RTRT is applied when CMAs are controlled within design spaces.
RTRT is applied when the test items are assured in the manufacturing area.
Appearance Identification

6
Risk Assessment for Assay and UDU
Risk Assessment of CMAs affecting CQAs of Assay and UDU
Reference: 2.3 Quality Overall Summary; Sakura Tablet (2008)
CQA UDU/Assay p-CMA
Blend uniformity
Blending
Tableting
p-CMA API content in granules
p-CMA Tablet weight
p-CMA Tablet weight Variation
p-CMA Granule segregation
CQA of UDU = f (CMA of blend uniformity, API content in granules, tablet weight/variation)
Low risk
No need of individual tablet assay approach (e.g. Large N)
CQA of Assay = f (CMA of API content, tablet weight)
First principle model
NIR
7
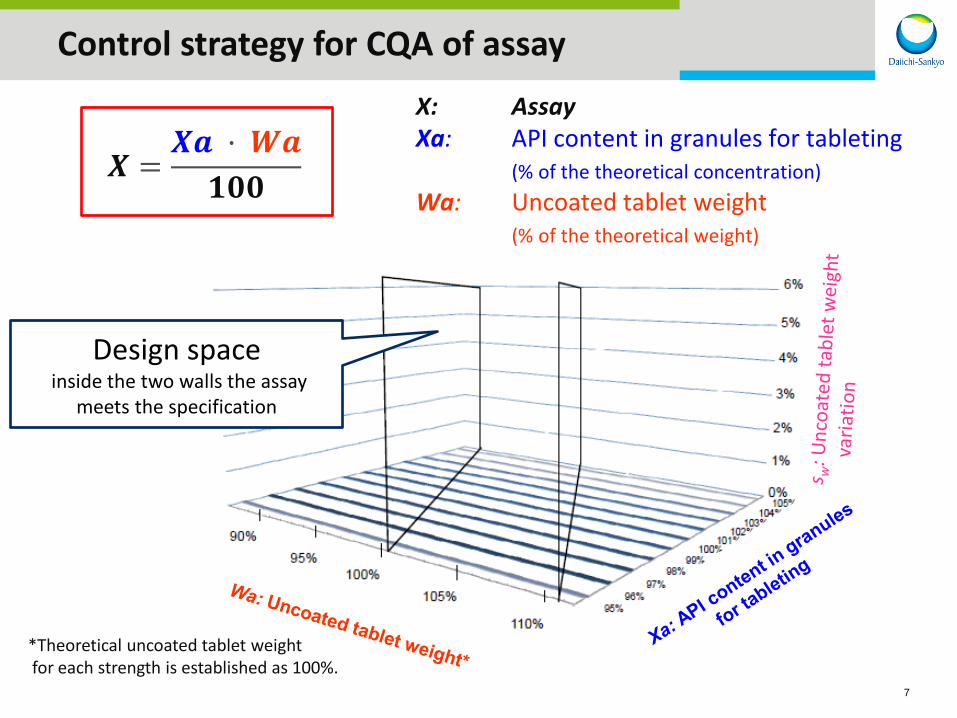
Control strategy for CQA of assay
X: Assay Xa: API content in granules for tableting (% of the theoretical concentration) Wa: Uncoated tablet weight (% of the theoretical weight)
𝑿 =𝑿𝑿 · 𝑾𝑿𝟏𝟏𝟏
Design space inside the two walls the assay
meets the specification
*Theoretical uncoated tablet weight for each strength is established as 100%.
8
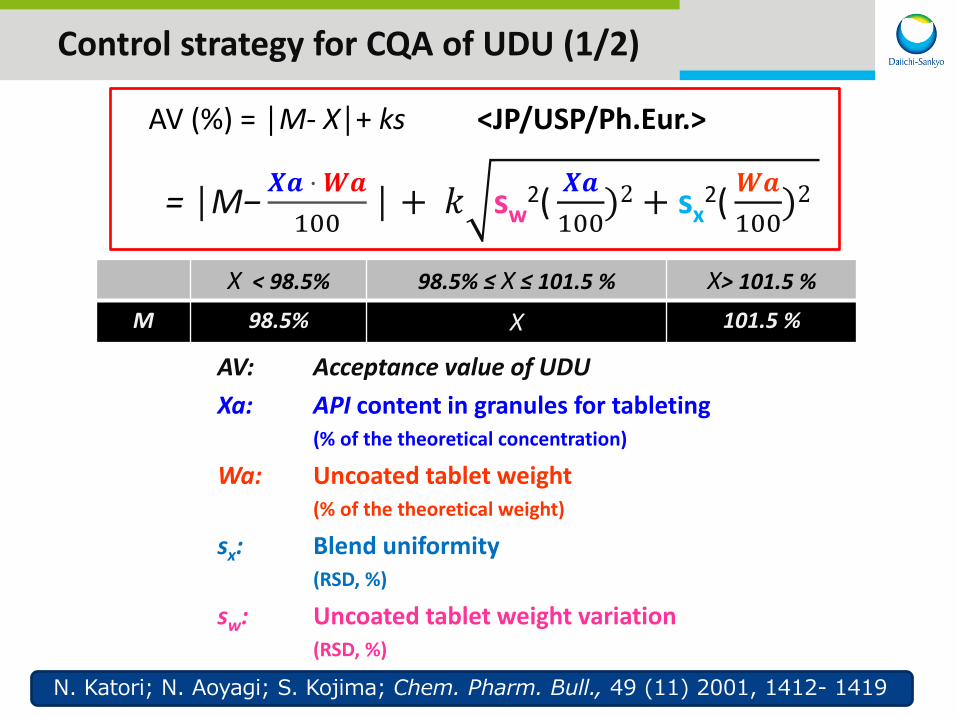
Control strategy for CQA of UDU (1/2)
AV: Acceptance value of UDU Xa: API content in granules for tableting (% of the theoretical concentration)
Wa: Uncoated tablet weight (% of the theoretical weight)
sx: Blend uniformity (RSD, %)
sw: Uncoated tablet weight variation (RSD, %)
AV (%) = │M- X│+ ks <JP/USP/Ph.Eur.>
X < 98.5% 98.5% ≤ X ≤ 101.5 % X> 101.5 %
M 98.5% X 101.5 %
N. Katori; N. Aoyagi; S. Kojima; Chem. Pharm. Bull., 49 (11) 2001, 1412- 1419
= │M− 𝑿𝑿 · 𝑾𝑿100
│ + 𝑘 sw2( 𝑿𝑿100
)2 + sx2( 𝑾𝑿100
)2
9
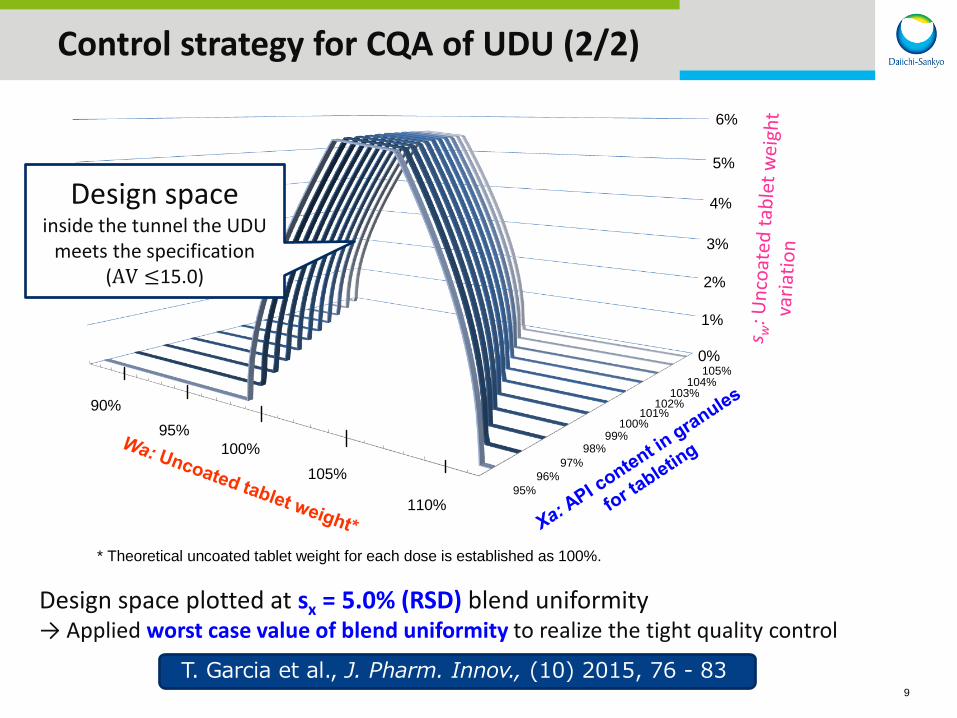
Uncoated tablet weight* API content in granules
for tableting
Uncoated
tablet weight
variation
0%
3%
4%
5%
6%
95% 96%
98% 97%
99%
101% 100%
105%
102% 103%
104%
90% 95%
100% 105%
110%
* Theoretical uncoated tablet weight for each dose is established as 100%.
1%
2%
Design space inside the tunnel the UDU
meets the specification (AV ≤15.0)
Design space plotted at sx = 5.0% (RSD) blend uniformity → Applied worst case value of blend uniformity to realize the tight quality control T. Garcia et al., J. Pharm. Innov., (10) 2015, 76 - 83
Control strategy for CQA of UDU (2/2)

10
Integrated Design Space for Assay and UDU
Integrated Design Space*1 Overlay of design spaces
for Assay and UDU (Inside of the tunnel meets the
specification for Assay and UDU)
*1: Design space plotted at sx=5.0% (RSD) blend uniformity *2: Theoretical uncoated tablet weight for each strength is established as 100%.
Assay and UDU can be assured when the combination of CMAs is within the tunnel.

Validation of Design Space for Assay and UDU (1/2)
11
Comparison between conventional and RTRT methods
0%
1%
2%
3%
4%
5%
6%
95% 96%
98% 97%
99%
101% 100%
105%
102% 103%
104%
90% 95%
100% 105%
110%
1
12
13
9 8
7
2 3
10
11 5
6 4

12
Validation of Design Space for Assay and UDU (2/2)
Fig. Validation Results for UDU Fig. Validation Results for Assay
Values calculated by conventional and RTRT methods were well correlated in both Assay and UDU (BU: actual).

13
Pros of 1st Principle Assay and UDU Control Strategy
One NIR model predicting API content is commonly used for all strengths to calculate Assay and UDU.
IPC/Spec. API content in granules
Spec. Tablet assay
Change of target tablet weight depending on the API content in granules
No need of dose dependent NIR model
Quality Control with Design Space Flexibility Ex. Assay
Assay can be controlled close to the target value by changing the uncoated tablet weight within design space.
Key

14
API Content in Granules Prediction by NIR
・・
99.8%
100.5%
70.2%
115.7%
80.0%
108.1%
97.9%
X Y
Calibration set
Unknown sample
100.0%
Developed calibration model
2. Parameter Selection Pretreatment, Wavenumber, Spectral analysis (e.g. PLS), Number of latent variables
Routine measurement NIR spectra API content
3. Model Evaluation Correlate coefficient, RMSECV, Loading, Regression coefficient, Score, etc.
4. Analytical Validation
Specificity, Linearity, Range Accuracy, Precision, Robustness
1. Data Acquisition
H. Nakagawa; M. Kano; S. Hasebe; T. Miyano; T. Watanabe; N. Wakiyama; Int. J. Pharm., 471 (2014) 264-275
NIR model development

15
Establishment of Calibration Set
+
Concept of Calibration Set (NIR spectra)
Samples with purposeful variations of API content (e.g. 70% to 130%)
Samples with variations affecting NIR spectra (e.g. variations of particle size)
+
Samples manufactured with commercial equipment (e.g. Scale up study samples)
Key for robust model development Selection of samples affecting NIR spectra in routine manufacturing

16
Model Evaluation / Analytical Validation
Measurement Value by HPLC [%]
Pred
ictio
n Va
lue
by N
IR [%
]
Specificity Linearity Accuracy Precision Range Robustness
API peak Correlation coefficient
SEP RSD of repeated measurements
Validated range
Variations of environment
Reference • Guidance for Industry, Development and Submission of Near Infrared Analytical Procedures (2015, FDA) • Guideline on the use of near infrared spectroscopy by the pharmaceutical industry and the data requirements for new submissions and variations (2014, EMA) • Standard Practices for Infrared Multivariate Quantitative Analysis (E1655, ASTM), etc.
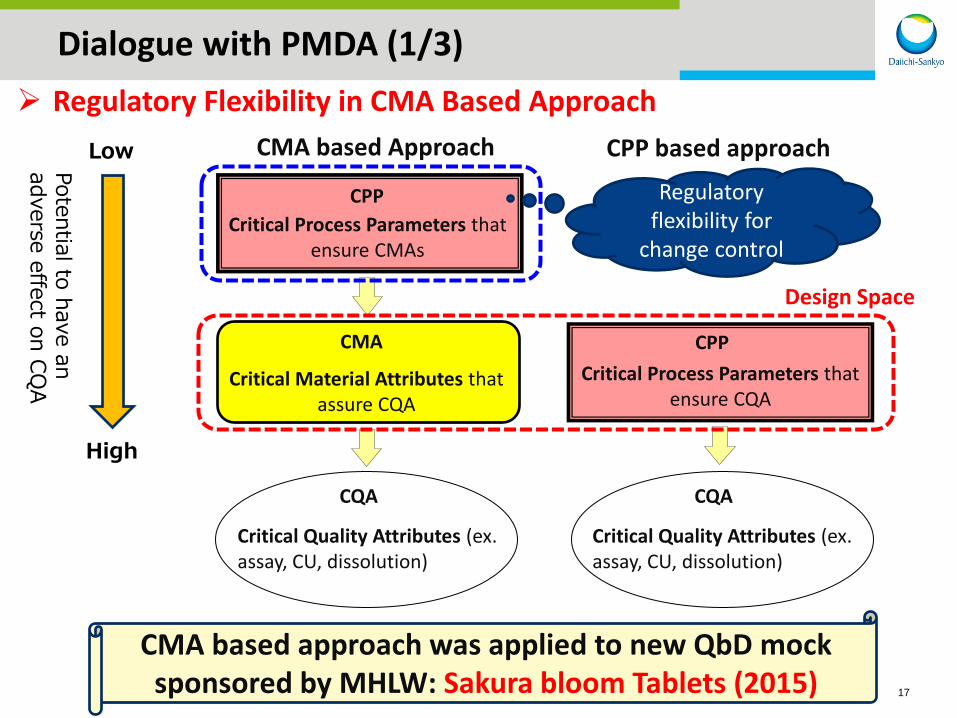
Dialogue with PMDA (1/3)
17
CQA
Critical Quality Attributes (ex. assay, CU, dissolution)
CPP Critical Process Parameters that
ensure CMAs
CPP Critical Process Parameters that
ensure CQA
CMA based Approach CPP based approach
CMA
Critical Material Attributes that assure CQA
CQA
Critical Quality Attributes (ex. assay, CU, dissolution)
Regulatory Flexibility in CMA Based Approach
Design Space
Potential to have an adverse effect on CQ
A
High
Low
Regulatory flexibility for
change control
CMA based approach was applied to new QbD mock sponsored by MHLW: Sakura bloom Tablets (2015)

18
Event check
SST, etc Trend analysis
Change control, QA judgment
Appropriateness of prediction models
Quality Assurance in RTRT
CQA Std
Max
Min
Trend change
Comparison with conventional testing
Periodical check Daily check
Actual Predict Prediction error
Model check (and updated)
Countermeasures for unexpected variations in model development stage
Model maintenance trigger
Model Maintenance
Dialogue with PMDA (2/3)

19
Development of NIR model
Validation of NIR model
Transfer of NIR model (Laboratory to Plant)
Routine measurement
Laboratory - Development
Plant - Operation
Model update and
Re-validation
Model Maintenance
Trigger of model maintenance
In case that model update according to SOP is difficult
Close cooperation between laboratory and plant
Verification of prediction error
(Comparison with conventional method)
Acceptable error
Unacceptable error
Dialogue with PMDA (3/3) Quality Management System for NIR Model

20
Queries from PMDA
Queries from PMDA 1st submission
(April 2011) 2nd submission
(September 2014) Total
General 4 4 8
QbD/PAT/RTRT related 85 8 93
Total 89 12 101
All the queries had been successfully solved by close-dialogue with PMDA.
Significant decrease of queries in 2nd submission based on the close-dialogue with PMDA in 1st submission

21
Conclusion
Edoxaban tablets 15 mg, 30 mg, and 60 mg were approved as RTRT products in Japan. CMA based enhanced QbD approach, in which a design space is constructed only using CMAs, was applied to Edoxaban tablets. e.g., Assay and UDU design space was constructed using four CMAs of 1st principle equation based on compendial requirements. A lot of queries were inquired by PMDA, but all had been successfully solved by close-dialogue.

22
Acknowledgment
Formulation Tomoyuki Watanabe Naoki Wakiyama Tatsuya Suzuki Masazumi Kojima Hidehiro Imai Koichi Ishidoh Kazuko Maeda Makoto Kamada Jin Hisazumi Jin Maeda Masatomo Ito Hideaki Tanabe Takuya Miyano Kazuhiro Matsuura Yoshito Kikkawa Shuichi Tanabe Takafumi Kato Rie Saguchi
CMC Takeshi Hamaura Shuichi Ando Motonori Kidokoro Hiromi Morita Kenichi Enokita Hiroyuki Nakata Kyoko Nakanishi
Analytical Motomu Ohara Tadanobu Takatani Hiroki Hifumi
Plant Jun Hishida Katsuhiko Nagao Tsuyoshi Tanaka Satoshi Osaki Hiroaki Inoue Eiji Kawai Shigenari Sugaya Takahiko Nuga Yasuhiro Maniwa Tomohiro Yoshida Ryota Suzuki Masaaki Koyama Masanobu Kabasawa Other Company
Hiroaki Nakagami Takashi Maehara
Headquarters Chiaki Matsumoto Kenji Ochiai Hisashi Takeuchi Ayako Fujitani
Kyoto University Manabu Kano Shinji Hasebe

Thank you for your attention. Any questions?
23