Q4/Full year 2018 · Highlights the Netherlands • Albert Heijn most sustainable Dutch food...
25
Q4/Full year 2018 February 27, 2019
Transcript of Q4/Full year 2018 · Highlights the Netherlands • Albert Heijn most sustainable Dutch food...

Q4/Full year 2018
February 27, 2019

HighlightsFrans Muller
President & CEO

A strong quarter with full year underlying EPS up 29.6%
Fourth quarter results:
• Net sales of €16.5 billion, up 3.0% at constant exchange rates
• Net consumer online sales up 25.0% at constant exchange rates
• Operating income of €627 million, up 9.1% at constant exchange rates
• Underlying operating margin of 4.2%, up 0.2% points, supported by synergies
Full year results:
• Free cash flow €2.3 billion, up 24.0% at constant exchange rates
• Underlying earnings per share* €1.60, up 29.6% at constant exchange rates
• Proposed dividend of €0.70, up 11.1% compared to 2017
3*From continuing operations

Financial Results Jeff Carr
CFO4

Group performance
€ in million Quarter 4 Full year
2018 2017 Changeactual rates
Changeconstant rates
2018 2017 Changeactual rates
Changeconstant rates
Net sales 16,547 15,763 5.0% 3.0% 62,791 62,890 (0.2)% 2.5%
Underlying EBITDA 1,129 1,081 4.5% 2.4% 4,305 4,249 1.4% 4.1%
Underlying EBITDA margin 6.8% 6.9% 6.9% 6.8%
Underlying operating income 691 631 9.5% 7.2% 2,554 2,456 4.0% 6.7%
Underlying operating margin 4.2% 4.0% 4.1% 3.9%
Operating income 627 564 11.3% 9.1% 2,395 2,225 7.7% 10.5%
Income from continuing operations
517 744 (30.5)% (32.2)% 1,809 1,817 (0.4)% 0.9%
5
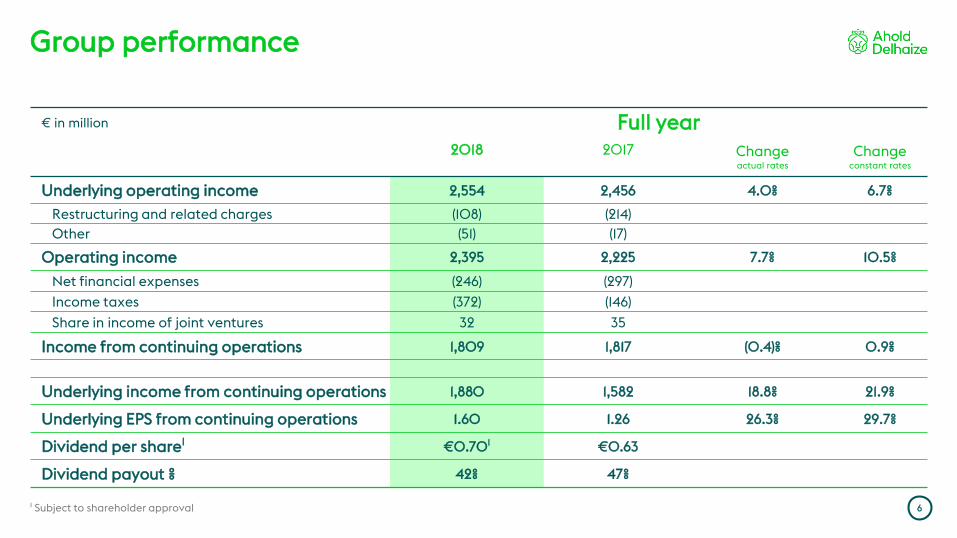
Group performance
€ in million Full year2018 2017 Change
actual rates
Changeconstant rates
Underlying operating income 2,554 2,456 4.0% 6.7%
Restructuring and related charges (108) (214)
Other (51) (17)
Operating income 2,395 2,225 7.7% 10.5%
Net financial expenses (246) (297)
Income taxes (372) (146)
Share in income of joint ventures 32 35
Income from continuing operations 1,809 1,817 (0.4)% 0.9%
Underlying income from continuing operations 1,880 1,582 18.8% 21.9%
Underlying EPS from continuing operations 1.60 1.26 26.3% 29.7%
Dividend per share1 €0.701 €0.63
Dividend payout % 42% 47%
¹ Subject to shareholder approval 6

1.0%
2.8%
-0.1%
3.0%2.7%
Q4'17 Q1'18 Q2'18 Q3'18 Q4'18
4.1% 4.3%4.0% 4.1% 4.3%
Q4'17 Q1'18 Q2'18 Q3'18 Q4'18
United States Q4 2018
7
• Net sales up 2.6% at constant rates to €9,798 million compared to the same quarter last year
• Comparable sales growth ex gas up 2.7%, including a slightly favorable weather impact
• Online sales increased 12.1% at constant exchange rates to €203 million, driven by Peapod and Hannaford To Go and same day delivery partners
• Underlying operating margin was 4.3%, up 0.2% points from the same quarter last year
Strong financial performance across all brands
1Comparable sales growth excl. gas
Comparable sales growth¹ Underlying operating margin

6.0%
3.2%2.9%
5.9%
3.3%
Q4'17 Q1'18 Q2'18 Q3'18 Q4'18
The Netherlands Q4 2018
Comparable sales growth
• Net sales of €3,805 million increased by 3.6% compared to the previous year
• Comparable sales up 3.3%, including a limited negative impact of the timing of New Year and cycling a strong fourth quarter in 2017
• Net consumer online sales for the segment increased by 28.3% compared to last year
• Underlying operating margin was 4.9%, up 0.2% points compared to the same quarter last year
• Underlying operating margin excluding bol.com was 5.2%, slightly lower compared to last year
Underlying operating margin
Solid quarter with full year positive EBITDA margins for bol.com
4.7% 4.9%5.3% 5.1% 4.9%
Q4'17 Q1'18 Q2'18 Q3'18 Q4'18
8

Belgium Q4 2018
Comparable sales growth
• Net sales were €1,338 million, up 3.6% versus the same quarter last year
• Comparable sales increased by 3.0%, helped by a positive calendar impact with one additional opening day compared to last year
• Underlying operating margin was 2.9%, up 1.9% points compared to last year, supported by synergies and lower shrink, operational labor costs and D&A
Underlying operating margin
New strategy for Delhaize gaining traction
0.0%
4.1%
1.4%
0.6%
3.0%
Q4'17 Q1'18 Q2'18 Q3'18 Q4'18
1.0%
2.3%2.7%
3.2%2.9%
Q4'17 Q1'18 Q2'18 Q3'18 Q4'18
9

5.4%
3.0%3.6% 3.7%
5.3%
Q4'17 Q1'18 Q2'18 Q3'18 Q4'18
0.3%0.7% 0.5% 0.6%
2.0%
Q4'17 Q1'18 Q2'18 Q3'18 Q4'18
Central and Southeastern Europe Q4 2018
Comparable sales growth¹
• Net sales increased by 3.9% at constant exchange rates to €1,606 million, aided by the addition of 130 stores of which most were convenience stores in Romania and Greece
• Comparable sales growth ex gas of 2.0%
• Czech Republic reported a strong performance with a successful new store concept and other commercial improvements resulting in increased transactions and basket size
• Underlying operating margin was 5.3%, down 0.1% points versus last year
Underlying operating margin
Expansion of store network in Romania and Greece, continuedstrong performance in Czech Republic
¹Comparable sales growth excl. gas
10

€ in million Quarter 4 Full year
2018 2017 2018 2017
United States 81 51 291 159
Europe 28 25 102 78
Global support office
11 7 40 31
Total 120 83 432 268
€432 million delivered in 2018Synergies delivered ahead of plan
22
268
432
500*
2016 2017 2018 2019
€ in million
Timeline 2016 – 2019
• Net synergies 2018: €432 million, of which incremental €164 million to 2017
• Net synergies target 2019: €500 million, including synergies realized in 2016, 2017 & 2018
€ in millionQ4 Full year
Coststo date
Expectedfull costs
Integration costs 18 79 354 380
U.S. restructuring costs 9 11 50 7011
* Guidance

Strong free cash flow, supported by further improvements in working capital
€ in million Quarter 4 Full year
2018 2017 2018 2017
Operating cash flow 1,104 1,043 4,124 4,049
Change in working capital 498 522 484 131
Income tax paid – net (148) (152) (280) (480)
Cash from cont. operations 1,454 1,413 4,328 3,700
Net investments (691) (471) (1,753) (1,556)
Net interest paid (93) (93) (250) (288)
Dividends from joint ventures - 54 17 70
Free cash flow 670 903 2,342 1,926
Net cash from financing activities (2,929) (227) (4,011) (1,458)
Net cash from operating, investing & financing activities (1,922) 894 (1,587) 827
• Strong free cash flow generation of €2,342 million, €416 million higher than last year mainly due to working capitalimprovements and lower income taxes paid
• Net investments increase to 2.8% of sales compared to 2.5% last year
• Net cash from financing activities includes repayments of finance lease liabilities
Free cash flow
12

2.1%*1.7%*
2.5%
2016 2017 2018
3.7%*
3.9%*
4.1%
2016 2017 2018
Ahold Delhaize delivers a consistent strong performance
Underlying operating marginNet sales growth1
1At constant exchange rates*2016 & 2017 on a pro forma basis
Underlying EPS from continuing operations
13
1.17* 1.27*1.60
2016 2017 2018
€
Free cash flow & Capex spend
€ in billion
1.41.9
2.3
1.7 1.7 1.8
2016 2017 2018
Free cash flow Capex
*2016 & 2017 on a pro forma basis
*2016 & 2017 on a pro forma basis

• Implementation of new accounting standard IFRS 16, adopting full retrospectiveapproach
• We refer to Note 3 of Ahold Delhaize’s 2018 Annual Report consolidated financial statements for an explanation of the impact of this new accounting standard
• Restated 2018 quarterly financial statements to be provided on March 25, as well as an update on the impact of IFRS 16 on our guidance for 2019
• IFRS 16 analyst briefing to be held in London, March 25
14
Reporting changes 2019Implementation of IFRS 16

Outlook 2019*
• We confirm our target for 2019 of realizing €750 million gross synergies, resulting in €500 million net synergies from the integration of the two companies
• We expect to save €540 million in 2019 as part of our €1.8 billion Save for Our Customers program for 2019-2021
• We expect full year group margins to be in line with last year
• Underlying earnings per share from continuing operations is expected to grow by high single digits compared to last year
• Free cash flow is expected to be around €2.0 billion, as we are increasing our capital expenditures to €2.0 billion, in particular at Stop & Shop, eCommerce and our digital capabilities
Strong foundation and confidence in the future
15*Pre IFRS 16 guidance

Business HighlightsFrans Muller
President & CEO16

Introduction
• Strong business performance during the merger integration
• Consistent delivery on merger synergies
• Strengthened culture bringing people together
• Efficient platform for growth
Well positioned tocontinue to win
Accelerating what will make the difference
From our successfulBetter Together strategy
To our ambitious Leading Together strategy
17
• Omnichannel growth including eCommerce and meal solutions
• Technology including AI and Robotics
• Healthy & Sustainable
• Portfolio & Scale efficiencies
• Best talent
Leading Together

18
Highlights United States
• Roll-out Click & Collect points on track, with Food Lion To-Go service available at 53 Food Lion stores
• Peapod opened its fifth wareroom on Long Island, increasing order delivery capacity by 10% in the New York region
• Stop & Shop launched first micro fulfillment center, several more planned in 2019 with further expansion into 2020. Remodeled stores Hartford area show positive sales uplift
• Giant Food Stores opened “Giant Heirloom Market”, a new store concept for the urban customer, three more stores will be opened this year
• Stop & Shop and Giant/Martin’s to introduce robots to its stores

19
Highlights the Netherlands
• Albert Heijn most sustainable Dutch food retailer in the Netherlands for second consecutive year
• Albert Heijn and bol.com accessible via Google Home, customers can now receive voice-activated shopping advice
• Albert Heijn broadens omni-channel offering:– AH to go and Thuisbezorgd.nl+Deliveroo offer instant delivery of groceries– Home delivery of freshly prepared hot meals, based on recipes from
“Allerhande”
• New fully mechanized Albert Heijn DC of > 40.000m2 to open in Q1 in Zaandam, capacity to deliver 400.000 crates and boxes per day
• Black Friday sales at bol.com €30 million, highest sales ever in oneday

20
Highlights Belgium
• Further improvement of omnichannel offering and acceleratinggrowth:
– Delhaize will open ~100 new supermarkets in the next 3 to 4 years
– Albert Heijn will open 30-50 new supermarkets in Flanders in the next few years
– Bol.com started a collaboration with Delhaize, adding instore bol.com pick-up points
• Bol.com to open office in Antwerp to better serve 2,000 Belgian Plaza-partners who sell their products on the bol.com platform

21
Highlights Central and Southeastern Europe
• Albert hypermarket at Chodov awarded Best Store in Czech republic, recognized for freshness and quality and for various innovations
• Alfa Beta launched first “Green Truck” with CNG as combustible and recycled CO2 for cooling, less polluting and more silent in downtown Athens
• Mega Image, Romania, launched personalized loyalty card “Connect” in November, almost 300.000 subscribers end of 2018
• Delhaize Serbia introduced new own brands: Maxi Kuhinjica (Ready to Cook), Maxi Apetit (Ready to Eat) and Etos

Wrap-up
• Very robust financial profile and right structure to further grow our brands, both in-storeand online
• Completion of merger integration process and synergies delivered as promised
• Full year free cash flow €2.3 billion, up 24.0% at constant exchange rates
• Full year underlying earnings per share* €1.60, up 29.6% at constant exchange rates
• Proposed dividend of €0.70, up 11.1% compared to 2017
22
Ahold Delhaize well positioned to continue to win
*From continuing operations

Cautionary notice
This communication includes forward-looking statements. All statements other than statements of historical facts may be forward-looking statements. Words such as strategy, guidance, to be, outlook, future, target, expect, well-positioned to continue to win, will, on track, planning, to open, promised or other similar words or expressions are typically used to identify forward-looking statements.
Forward-looking statements are subject to risks, uncertainties and other factors that are difficult to predict and that may cause actual results of Koninklijke Ahold Delhaize N.V. (the “Company”) to differ materially from future results expressed or implied by such forward-looking statements. Such factors include, but are not limited to, risks relating to the Company’s inability to successfully implement its strategy, manage the growth of its business or realize the anticipated benefits of acquisitions; risks relating to competition and pressure on profit margins in the food retail industry; the impact of economic conditions on consumer spending; turbulence in the global capital markets; natural disasters and geopolitical events; climate change, raw material scarcity and human rights developments in the supply chain; disruption of operations and other factors negatively affecting the Company’s suppliers; the unsuccessful operation of the Company’s franchised and affiliated stores; changes in supplier terms and inability to pass on costs to prices; risks related to corporate responsibility and sustainable retailing; food safety issues resulting in product liability claims and adverse publicity; environmental liabilities associated with the properties that the Company owns or leases; competitive labor markets, changes in labor conditions and labor disruptions; increases in costs associated with the Company’s defined benefit pension plans; the failure or breach of security of IT systems; the Company’s inability to successfully complete divestitures and the effect of contingent liabilities arising from completed divestitures; antitrust and similar legislation; unexpected outcomes in the Company’s legal proceedings; additional expenses or capital expenditures associated with compliance with federal, regional, state and local laws and regulations; unexpected outcomes with respect to tax audits; the impact of the Company’s outstanding financial debt; the Company’s ability to generate positive cash flows; fluctuation in interest rates; the change in reference interest rate; the impact of downgrades of the Company’s credit ratings and the associated increase in the Company’s cost of borrowing; exchange rate fluctuations; inherent limitations in the Company’s control systems; changes in accounting standards; adverse results arising from the Company’s claims against its self-insurance program; the Company’s inability to locate appropriate real estate or enter into real estate leases on commercially acceptable terms and other factors discussed in the Company’s public filings and other disclosures.
Forward-looking statements reflect the current views of the Company’s management and assumptions based on information currently available to the Company’s management. Forward-looking statements speak only as of the date they are made, and the Company does not assume any obligation to update such statements, except as required by law.
23

Q&A

Thank you