
Q4'20 Investor Presentation - January FINAL
47
January 2021 Investor Presentation
Transcript of Q4'20 Investor Presentation - January FINAL

January 2021
Investor Presentation

Investor Presentation January 2021 2
Caution Regarding Forward-Looking Statements
As noted in the following Caution Regarding Forward-Looking Statements, all forward-looking statements and information, by their nature, are subject to inherent risks and uncertainties, both general and specific, which may cause actual results to differ materially from the expectations expressed in any forward-looking statement. The Enterprise-Wide Risk Management section starting on page 73 in BMO’s 2020 Annual Report describes a number of risks, including credit and counterparty, market, insurance, liquidity and funding, operational, legal and regulatory, strategic, environmental and social, and reputation risk. Should the bank’s risk management framework prove ineffective, there could be a material adverse impact on its financial position and results.Bank of Montreal’s public communications often include written or oral forward-looking statements. Statements of this type are included in this document, and may be included in other filings with Canadian securities regulators or the U.S. Securities and Exchange Commission, or in other communications. All such statements are made pursuant to the “safe harbor” provisions of, and are intended to be forward-looking statements under, the United States Private Securities Litigation Reform Act of 1995 and any applicable Canadian securities legislation. Forward-looking statements in this document may include, but are not limited to, statements with respect to the bank’s objectives and priorities for fiscal 2021 and beyond, its strategies or future actions, its targets, expectations for its financial condition or share price, the regulatory environment in which it operates and the results of or outlook for its operations or for the Canadian, U.S. and international economies, its response to the COVID-19 pandemic and its expected impact on the bank’s business, operations, earnings, results, and financial performance and condition, as well as its impact on the bank’s customers, competitors, reputation and trading exposures, and include statements of the bank’s management. Forward-looking statements are typically identified by words such as “will”, “would”, “should”, “believe”, “expect”, “anticipate”, “project”, “intend”, “estimate”, “plan”, “goal”, “target”, “may” and “could.”By their nature, forward-looking statements require the bank to make assumptions and are subject to inherent risks and uncertainties, both general and specific in nature. There is significant risk that predictions, forecasts, conclusions or projections will not prove to be accurate, that assumptions may not be correct, and that actual results may differ materially from such predictions, forecasts, conclusions or projections. The uncertainty created by the COVID-19 pandemic has heightened this risk given the increased challenge in making assumptions, predictions, forecasts, conclusions or projections. The bank cautions readers of this document not to place undue reliance on forward-looking statements, as a number of factors – many of which are beyond its control and the effects of which can be difficult to predict – could cause actual future results, conditions, actions or events to differ materially from the targets, expectations, estimates or intentions expressed in the forward-looking statements.Future outcomes that relate to forward-looking statements may be influenced by many factors, including but not limited to: the severity, duration and spread of the COVID-19 pandemic, its impact on local, national or international economies, and its heightening of certain risks that may affect the bank’s future results; the possible impact on the bank’s business and operations of outbreaks of disease or illness that affect local, national or international economies; general economic and market conditions in the countries in which the bank operates; information, privacy and cyber security, including the threat of data breaches, hacking, identity theft and corporate espionage, as well as the possibility of denial of service resulting from efforts targeted at causing system failure and service disruption; changes in monetary, fiscal, or economic policy, and tax legislation and interpretation; interest rate and currency value fluctuations, as well as benchmark interest rate reforms; technological changes and technology resiliency; political conditions, including changes relating to or affecting economic or trade matters; the Canadian housing market and consumer leverage; climate change and other environmental and social risks; weak, volatile or illiquid capital or credit markets; the level of competition in the geographic and business areas in which the bank operates; changes in laws or in supervisory expectations or requirements, including capital, interest rate and liquidity requirements and guidance, and the effect of such changes on funding costs; judicial or regulatory proceedings; the accuracy and completeness of the information the bank obtains with respect to its customers and counterparties; failure of third parties to comply with their obligations to the bank; the bank’s ability to execute its strategic plans and to complete proposed acquisitions or dispositions, including obtaining regulatory approvals; critical accounting estimates and the effect of changes to accounting standards, rules and interpretations on these estimates; operational and infrastructure risks, including with respect to reliance on third parties; changes to the bank’s credit ratings; global capital markets activities; the possible effects on the bank’s business of war or terrorist activities; natural disasters and disruptions to public infrastructure, such as transportation, communications, power or water supply; and the bank’s ability to anticipate and effectively manage risks arising from all of the foregoing factors.The bank cautions that the foregoing list is not exhaustive of all possible factors. Other factors and risks could adversely affect the bank’s results. For more information, please refer to the discussion in the Risks That May Affect Future Results section, and the sections related to credit and counterparty, market, insurance, liquidity and funding, operational, legal and regulatory, strategic, environmental and social, and reputation risk, in the Enterprise-Wide Risk Management section that starts on page 73 of BMO’s 2020 Annual Report, all of which outline certain key factors and risks that may affect the bank’s future results. Investors and others should carefully consider these factors and risks, as well as other uncertainties and potential events, and the inherent uncertainty of forward-looking statements. The bank does not undertake to update any forward-looking statements, whether written or oral, that may be made from time to time by the organization or on its behalf, except as required by law. The forward-looking information contained in this document is presented for the purpose of assisting shareholders in understanding the bank’s financial position as at and for the periods ended on the dates presented, as well as its strategic priorities and objectives, and may not be appropriate for other purposes.Material economic assumptions underlying the forward-looking statements contained in this document are set out in the Economic Developments and Outlook section on page 18 of BMO’s 2020 Annual Report as well as in the Allowance for Credit Losses section on page 114 of BMO’s 2020 Annual Report. Assumptions about the performance of the Canadian and U.S. economies, as well as overall market conditions and their combined effect on the bank’s business, are material factors the bank considers when determining its strategic priorities, objectives and expectations for its business. In determining expectations for economic growth, the bank primarily considers historical economic data, past relationships between economic and financial variables, changes in government policies, and the risks to the domestic and global economy.
Non-GAAP Measures
Bank of Montreal uses both GAAP and non-GAAP measures to assess performance. Readers are cautioned that earnings and other measures adjusted to a basis other than GAAP do not have standardized meanings under GAAP and are unlikely to be comparable to similar measures used by other companies. Reconciliations of GAAP to non-GAAP measures, the rationale for their use, as well as the effects of changes in exchange rates on BMO’s U.S. segment reported and adjusted results can be found on pages 6 and 7 of BMO’s Fourth Quarter 2020 Earnings Release and on pages 17 and 23 of BMO’s 2020 Annual Report, all of which are available on our website at www.bmo.com/investorrelations.Examples of non-GAAP amounts or measures include: efficiency and leverage ratios; revenue and other measures presented on a taxable equivalent basis (teb); amounts presented net of applicable taxes; results and measures that exclude the impact of Canadian/U.S. dollar exchange rate movements (i.e. constant currency basis or CCY), adjusted net income, revenues, non-interest expenses, earnings per share, effective tax rate, ROE, efficiency ratio, pre-provision pre-tax earnings, and other adjusted measures which exclude the impact of certain items such as, acquisition integration costs, amortization of acquisition-related intangible assets, reinsurance adjustment, restructuring costs, revaluation of U.S. net deferred tax asset as a result of U.S. tax reform and the remeasurement of an employee benefit liability as a result of an amendment to the benefits plan. Bank of Montreal provides supplemental information on combined business segments to facilitate comparisons to peers.
Forward looking statements & non-GAAP measures

Investor Presentation January 2021 3
Who We AreEstablished in 1817, BMO Financial Group is a highly diversified financial services provider based in North America
* All amounts in this presentation in Canadian dollars unless otherwise noted1 Source: Bloomberg GICS screen of largest North American banks by total assets
8th largest bank in North America
by assets1
$949 billion in total assets
Personal and Commercial Banking
BMO Wealth Management
BMO Capital Markets
Mobilizing
$400 billion for sustainable finance
by 2025
Three operating groups
We serve:12+ million
customers globally8+ million
personal and commercial customers in Canada
2+ millionpersonal, small business
and commercial customers in the United States

Investor Presentation January 2021 4
Our commitment to Sustainability
At BMO, our Purpose toBoldly Grow the Good, inbusiness and life isinspired by the SustainableDevelopment Goals (SDGs),and they are shaping ourbusiness and sustainabilityactivities. We believe wecan have the greatestimpact on the SDGs thatalign with our strategicpriorities, and we focus ourefforts on the seven SDGsshown here.
Decent Work and Economic Growth
Promoting sustained growth and productive employment by creating opportunities for our employees, customers and communities, and by upholding human rights across our value chain.
Reduced Inequalities
Championing equal opportunity and working to reduce inequalities by removing barriers to social and economic inclusion faced by our customers, employees and communities.
Gender EqualityEmpowering women by championing diversity and inclusion in our workforce, and by supporting women entrepreneurs so they can participate fully in the economy.
Sustainable Cities and Communities
Supporting the environmental and social sustainability of the communities in which we do business by managing our use of resources responsibly, and by partnering in community development initiatives.
Climate Action
Raising awareness and building our capacity to address climate change across the enterprise by managing risks and opportunities, mobilizing capital in support of a lower-carbon economy, and partnering with others to advance analytical capabilities.
Affordable and Clean Energy
Stimulating the growth of renewable energy by advising on and financing renewable energy projects, working with clients towards a green transition, and by purchasing renewable energy for our own operations.
Peace, Justice and Strong Institutions
Building effective and accountable institutions by upholding high standards of ethical and responsible conduct for ourselves and our partners.
Investor Presentation January 2021 5
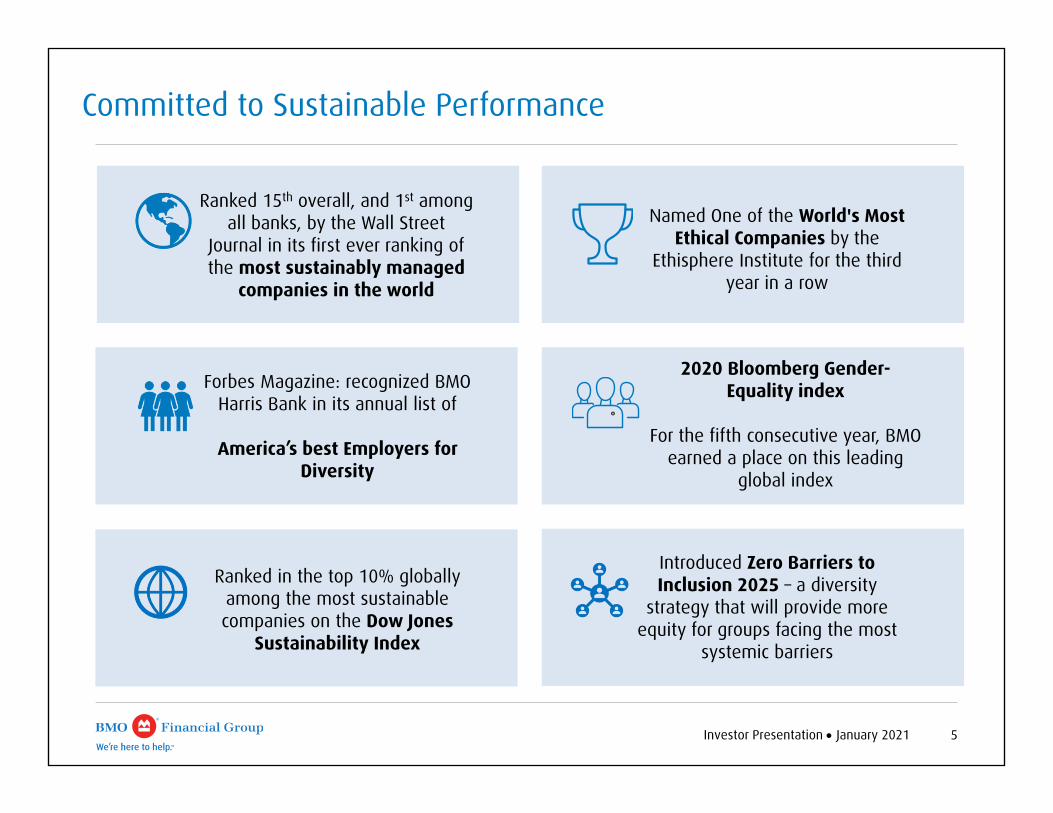
Committed to Sustainable Performance
Named One of the World's Most Ethical Companies by the
Ethisphere Institute for the third year in a row
Forbes Magazine: recognized BMO Harris Bank in its annual list of
America’s best Employers for Diversity
Ranked 15th overall, and 1st among all banks, by the Wall Street
Journal in its first ever ranking of the most sustainably managed
companies in the world
2020 Bloomberg Gender-Equality index
For the fifth consecutive year, BMO earned a place on this leading
global index
Ranked in the top 10% globally among the most sustainable companies on the Dow Jones
Sustainability Index
Introduced Zero Barriers to Inclusion 2025 – a diversity
strategy that will provide more equity for groups facing the most
systemic barriers

Investor Presentation January 2021 6
Reasons to Invest in BMO
1
2
• Well-capitalized with an attractive dividend yield
• Leading momentum in operating leverage and efficiency improvement through resource optimization, simplification and digitization
• Leading employee engagement and winning culture
• Digital first operating model where business and technology are completely integrated, driving efficiency, speed and scale
• Purpose-driven commitment to sustainability, applying industry-leading approaches to seize opportunities and manage risks in key areas such as sustainable finance, climate change, human rights, and diversity and inclusion
• Diversified businesses that continue to deliver resilient and robust earnings growth and long-term value for shareholders
• Strong foundation built for growth and differentiating strengths that drive competitive advantage:
– Top 10 commercial lender in North America with advantaged market share in Canada and the U.S.
– Well-established, highly profitable flagship banking business in Canada
– Strong U.S. deposit market share, top 3 in our core footprint with a digital banking platform that extends nationally
– Diversified, high-return wealth franchise with a strong client focus and competitive position
– Competitively advantaged Canadian capital markets franchise with an integrated North American platform
Investor Presentation January 2021 7
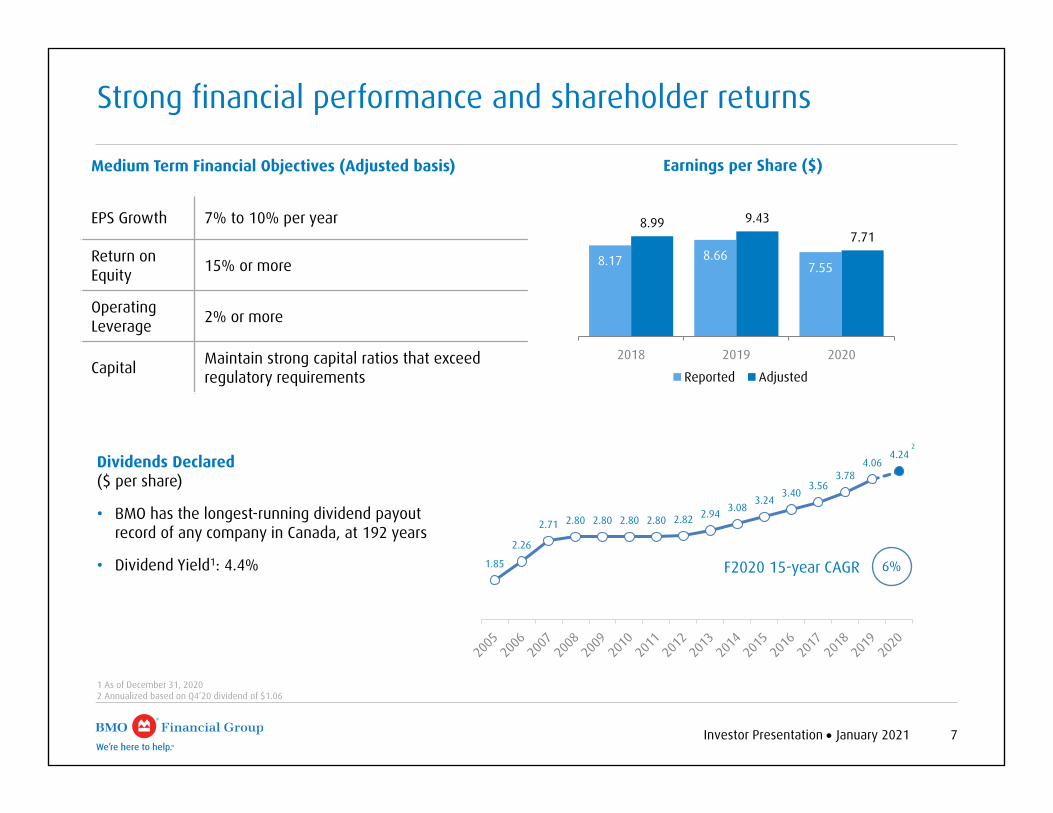
Strong financial performance and shareholder returns
1 As of December 31, 20202 Annualized based on Q4’20 dividend of $1.06
8.17 8.667.55
8.99 9.437.71
2018 2019 2020
Reported Adjusted
Earnings per Share ($)
1.85
2.26
2.71 2.80 2.80 2.80 2.80 2.82 2.94 3.083.24
3.403.56
3.784.06
4.24
6%F2020 15-year CAGR
1
Medium Term Financial Objectives (Adjusted basis)
EPS Growth 7% to 10% per year
Return on Equity 15% or more
Operating Leverage 2% or more
Capital Maintain strong capital ratios that exceed regulatory requirements
2
Dividends Declared($ per share)
• BMO has the longest-running dividend payout record of any company in Canada, at 192 years
• Dividend Yield1: 4.4%

Investor Presentation January 2021 8
Well-positioned for any environment with a proven strategy, resilient earnings and balance sheet strength
Superior credit risk management performance, appropriately provisioned
Well positioned for any environment and eventual economic recovery
Delivering on expense management and efficiency commitments
Proven strategy and resilient earnings power; strong operating momentum across businesses
Strong balance sheet and capital position; maintaining flexibility to invest and grow in areas of strategic importance
Investor Presentation January 2021 9
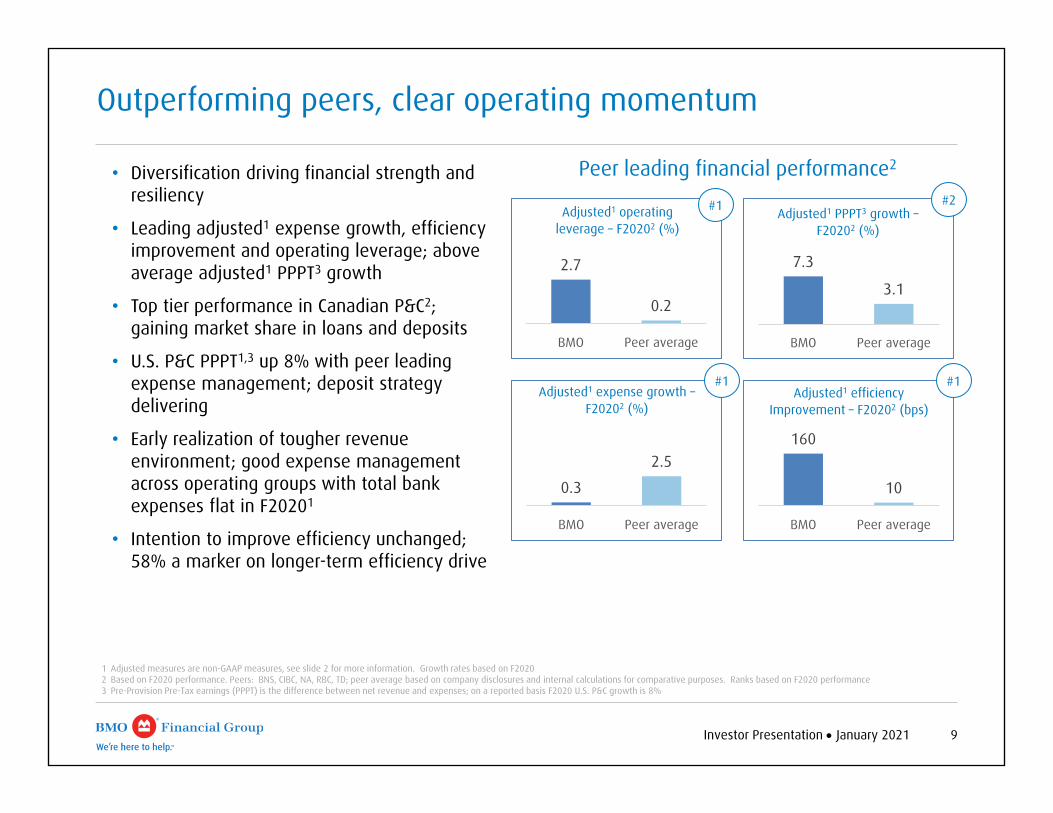
Outperforming peers, clear operating momentum
7.3
3.1
BMO Peer average
Adjusted1 PPPT3 growth –F20202 (%)
0.3
2.5
BMO Peer average
Adjusted1 expense growth –F20202 (%)
2.7
0.2
BMO Peer average
Adjusted1 operating leverage – F20202 (%)
1 Adjusted measures are non-GAAP measures, see slide 2 for more information. Growth rates based on F20202 Based on F2020 performance. Peers: BNS, CIBC, NA, RBC, TD; peer average based on company disclosures and internal calculations for comparative purposes. Ranks based on F2020 performance3 Pre-Provision Pre-Tax earnings (PPPT) is the difference between net revenue and expenses; on a reported basis F2020 U.S. P&C growth is 8%
• Diversification driving financial strength and resiliency
• Leading adjusted1 expense growth, efficiency improvement and operating leverage; above average adjusted1 PPPT3 growth
• Top tier performance in Canadian P&C2; gaining market share in loans and deposits
• U.S. P&C PPPT1,3 up 8% with peer leadingexpense management; deposit strategy delivering
• Early realization of tougher revenue environment; good expense management across operating groups with total bank expenses flat in F20201
• Intention to improve efficiency unchanged; 58% a marker on longer-term efficiency drive
160
10
BMO Peer average
Adjusted1 efficiency Improvement – F20202 (bps)
#2
#1 #1
#1
Peer leading financial performance2

Investor Presentation January 2021 10
378.8 387.1449.1 461.5 468.0
Q4'19 Q1'20 Q2'20 Q3'20 Q4'20
• CET1 ratio of 11.9%, up 30bps Q/Q; total capital ratio of 16.2%• Sound leverage and liquidity ratios− Leverage Ratio 4.8%; Liquidity Coverage Ratio 131%
• Prudent balance sheet management• Focused deposit strategy delivering double digit balance
growth • Quarterly common dividend $1.06; attractive dividend yield of
4.4%1
Strong balance sheet and capital positionCET1 ratio 11.9%, up 30bps Q/Q
Customer Deposits2 ($B)
1 As at December 31, 20202 Customer deposits are operating and savings deposits, including term investment certificates and retail structured deposits, primarily sourced through our retail, commercial, wealth and corporate banking businesses3 Chart is not to scale4 On March 13, 2020, OSFI announced a decrease of the Domestic Stability Buffer from 2.25% to 1% of total risk-weighted assets effective immediately, in order to support D-SIBs’ ability to supply credit to the
economy during an expected period of disruption related to COVID-19 and market conditions
4.5%
2.5%
1.0%1.0%
Q3'20 Internalcapital
generation
Shareissuances
Other Q4'20
9%Current OSFI expectation
D-SIB Surcharge
Minimum CET1
Domestic Stability Buffer4
11.9%+8 bps+25 bps
+2 bps
11.6%
CET1 Capital Ratio3
Capital Conservation Buffer

Investor Presentation January 2021 11
Diversified business mix with strong, resilient profitability
1 Adjusted measures are non-GAAP measures, see slide 2 for more information. Pre-Provision Pre-Tax earnings (PPPT) is the difference between net revenue and expenses. See page 7 of BMO’s Q4’20 Report to Shareholders for adjustments to reported results. On a reported basis: Q4’20 PPPT up 38%; F2020 PPPT up 14%; F2020 expenses down 3% Y/Y; F2020 efficiency ratio improved 380bps to 60.4%; F2020 operating leverage 6.2%
2 Reported net revenue for F2020 by operating group (excludes Corporate Services): Canadian P&C 34%, U.S. P&C 23%, BMO WM 21%, BMO CM 22%3 Operating leverage and efficiency ratio based on net revenue. Net revenue is net of insurance claims, commissions and changes in policy benefit liabilities (CCPB)4 Based on internal analysis5 Core footprint includes Illinois, Kansas, Wisconsin, Missouri, Indiana and Minnesota
Diversified sources of revenue% of Operating Groups Net Revenue – F20202
• Strong core profitability with Q4’20 and F2020 adjusted pre-provision, pre-tax earnings (PPPT)1
up 7%− F2020 adjusted1 expenses well-managed, stable Y/Y− F2020 adjusted1 efficiency ratio3 improved 160 bps to
59.8%− F2020 operating leverage3 above 2%
• Significant business and geographic diversification contributes to resilience and growth
• Top 10 commercial lender4 in North America with advantaged market share in Canada and the U.S.
• Well-established, highly profitable flagship banking business in Canada
• Strong U.S. deposit market share, top 3 in core footprint5 with digital banking platform that extends nationally
• Diversified, high-return wealth franchise with a strong client focus and competitive position
• Competitively advantaged Canadian capital markets franchise with integrated North American platform
CanadianPersonalBanking
Canadian Commercial
Banking
BMO Capital Markets
22%
BMO Wealth Management
21%
U.S. P&C23%
CanadianP&C34%

Investor Presentation January 2021 12
Canadian P&C - Strong flagship business
• Flagship business contributing 34% of total bank net revenue1 and 39% of adjusted2 net income in F2020
• Good expense discipline with expenses down1% Y/Y
• Growth in commercial loans and deposits contributed to market share gains
• Personal continuing to deliver with strong deposit growth and market share gains
• Continuing to invest in digital innovation, providing leading, customer-centric digital experiences
7.1% 6.8%
2.4%
-4.0%-2.2%
Q4'19 Q1'20 Q2'20 Q3'20 Q4'20
Revenue Growth
BMO Peer Avg
8.6% 10.3%
1.4%
-7.6% -3.4%
Q4'19 Q1'20 Q2'20 Q3'20 Q4'20
Adjusted2 pre-provision pre-tax earnings growth
BMO Peer Avg
7% 7% 7%5%
3%
Q4'19 Q1'20 Q2'20 Q3'20 Q4'20
Loan Growth
BMO Peer Avg
13% 14% 15%20% 18%
Q4'19 Q1'20 Q2'20 Q3'20 Q4'20
Deposit Growth
BMO Peer Avg
1 Net revenue is net of insurance claims, commissions and changes in policy benefit liabilities (CCPB) 2 Adjusted measures are non-GAAP measures, see slide 2 for more information. For details on adjustments refer to page 7 of BMO’s Q4’20 Report to Shareholders; on a reported basis, net income contributed 40% 3 Peers: BNS, CIBC, NBF, RBC, TD; ranks based on F2020 performance
#2#1
#2 #1
Top tier3 financial performance
Recognized as the best commercial bank in Canada for six consecutive years
Awarded first place in J.D. Power’s 2020 Canada Retail Banking Advice Study

Investor Presentation January 2021 13
Advancing our digital experience in line with customer preferences
Active Mobile Users2 (000s) Self-Serve Transaction 3 (%)
Canadian Personal1
Active Mobile Users4 (000s) Self-Serve Transaction 5 (%)
U.S. Personal1Digital Adoption Rate4 (%)
Digital Adoption Rate2 (%)
1 Canadian Personal based on Canadian Personal Banking, excludes Small Business Banking and Commercial Banking; U.S. Personal based on U.S. Personal Banking, excludes Small Business Banking and Commercial Banking2 Digital adoption is percent of deposit customers that logged on in last 90 days. Active mobile users is number of deposit customers that logged into mobile in the last 90 days3 Self–Serve Includes deposits, bill payments, internal funds transfers, withdrawals and e-transfers sent. Self-serve are ATM, Digital and IVR4 Digital adoption is percent of retail deposit customers that logged on in last 90 days. Active mobile users is number of retail deposit customers that logged into mobile in the last 90 days 5 The % of retail transactions occurring in self-serve channels (Digital, ATM, IVR). Retail transactions includes: deposits, withdrawals, bill pay, internal funds transfers, account to account transfers (A2A) and person to person
transfers sent (P2P)
56.0%58.8% 58.9%
Q4 F’19 Q4 F’20Q3 F’20
+290bps
1,835 1,958 1,990
Q4 F’19 Q3 F’20 Q4 F’20
+8%
87.3% 92.2% 92.0%
Q4 F’20Q4 F’19 Q3 F’20
+470bps
45.6%48.2% 48.9%
Q4 F’19 Q3 F’20 Q4 F’20
+330bps
464 496 508
Q4 F’20Q4 F’19 Q3 F’20
+9%
68.3%76.6% 76.4%
Q4 F’19 Q3 F’20 Q4 F’20
+810bps

Investor Presentation January 2021 14
Proven strength in Commercial Banking with advantaged market share
1 Based on internal analysis2 Canadian Bankers Association; loan market share $0-$25MM, as at December 20193 Based upon publicly available U.S. regulatory filings (FR Y-9Cs and FFIEC 002s) and internal analysis4 WAPD – Weighted Average Probability of Default
Commercial Banking Revenue as % of Total Bank Revenue – F2020
Canadian Commercial Banking
13%
U.S. Commercial
Banking16% Other
71%
• A relationship-based commercial bank; top 10 commercial lender1 in North America
− In Canada: Top-tier commercial banking business, #2 market share for business loans up to $25 million2
− In the U.S.: large, diversified national business, supported by industry knowledge, best-in-class customer experience, and top-tier share in flagship markets; #12 in U.S. commercial lending3
• Growth diversified, consistent risk appetite and underwriting
• Risk profile of new commercial business better than existing business
• Growth reflects:
− Quality and reputation of the business; deep industry expertise
− In Canada: new sectors and capacity creation through technology
− In the U.S.: focused expansion of national specialty lending sectors; strength in traditional footprint
• Commercial portfolio 81% secured
0.72%0.78%
0.69%0.76%
0.66% 0.66% 0.64%0.66%
0.64%
0.89%0.88%
0.83%0.77% 0.79% 0.78% 0.79%
0.85%0.86%
Oct-15 Oct-16 Oct-17 Oct-18 Oct-19 Jan-20 Apr-20 Jul-20 Oct-20
No Change in Risk Appetite: WAPD4 (Portfolio vs. New)
New* Portfolio

Investor Presentation January 2021 15
Leading track record in risk management
1 Based on F2020 pre-provision, pre-tax earnings
• Long track record of outperforming peers on credit, with 20-year historical average loss rates well below peer banks• Loss rates in 2020 continue to trend in line with peers• PPPT earnings would cover PCL rate of ~200bps1, higher than any time in at least 30 years, and over five times historical
average• Prudent underwriting, consistent approach, unparalleled expertise and industry knowledge, effectiveness of work-out process.
Deep expertise across Risk and business teams• Credit risk discipline will serve us well through expected stress period• Credit allowances appropriately reflect diversification and underlying strength of portfolios
PCL on Impaired Loans as a % of Average Net Loans & Acceptances
0.00%0.20%0.40%0.60%0.80%1.00%1.20%1.40%1.60%1.80%
'90 '91 '92 '93 '94 '95 '96 '97 '98 '99 '00 '01 '02 '03 '04 '05 '06 '07 '08 '09 '10 '11 '12 '13 '14 '15 '16 '17 '18 '19 '20Q1
'20Q2
'20Q3
'20Q4
0.52% Cdn. Peer Historical Avg. (1990- 2020)0.38% BMO Historical Avg. (1990- 2020)
0.26% Cdn. Peer Avg.0.30% BMO
Investor Presentation January 2021 16
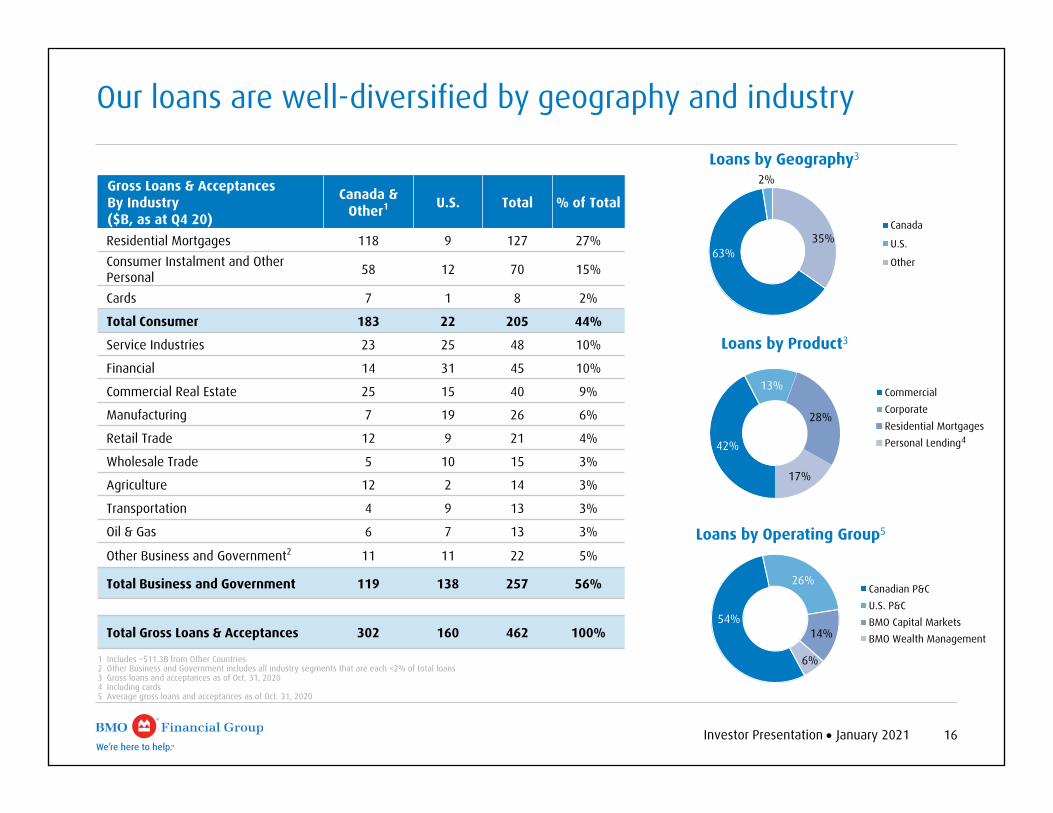
Our loans are well-diversified by geography and industry
42%
13%
28%
17%
CommercialCorporateResidential MortgagesPersonal Lending
63%
2%
35%Canada
U.S.
Other
Loans by Product3
Loans by Geography3
54%
26%
14%
6%
Canadian P&CU.S. P&CBMO Capital MarketsBMO Wealth Management
Loans by Operating Group5
4
1 Includes ~$11.3B from Other Countries2 Other Business and Government includes all industry segments that are each <2% of total loans3 Gross loans and acceptances as of Oct. 31, 20204 Including cards5 Average gross loans and acceptances as of Oct. 31, 2020
Gross Loans & Acceptances By Industry($B, as at Q4 20)
Canada & Other1 U.S. Total % of Total
Residential Mortgages 118 9 127 27%Consumer Instalment and Other Personal 58 12 70 15%
Cards 7 1 8 2%
Total Consumer 183 22 205 44%
Service Industries 23 25 48 10%
Financial 14 31 45 10%
Commercial Real Estate 25 15 40 9%
Manufacturing 7 19 26 6%
Retail Trade 12 9 21 4%
Wholesale Trade 5 10 15 3%
Agriculture 12 2 14 3%
Transportation 4 9 13 3%
Oil & Gas 6 7 13 3%
Other Business and Government2 11 11 22 5%
Total Business and Government 119 138 257 56%
Total Gross Loans & Acceptances 302 160 462 100%
Investor Presentation January 2021 17
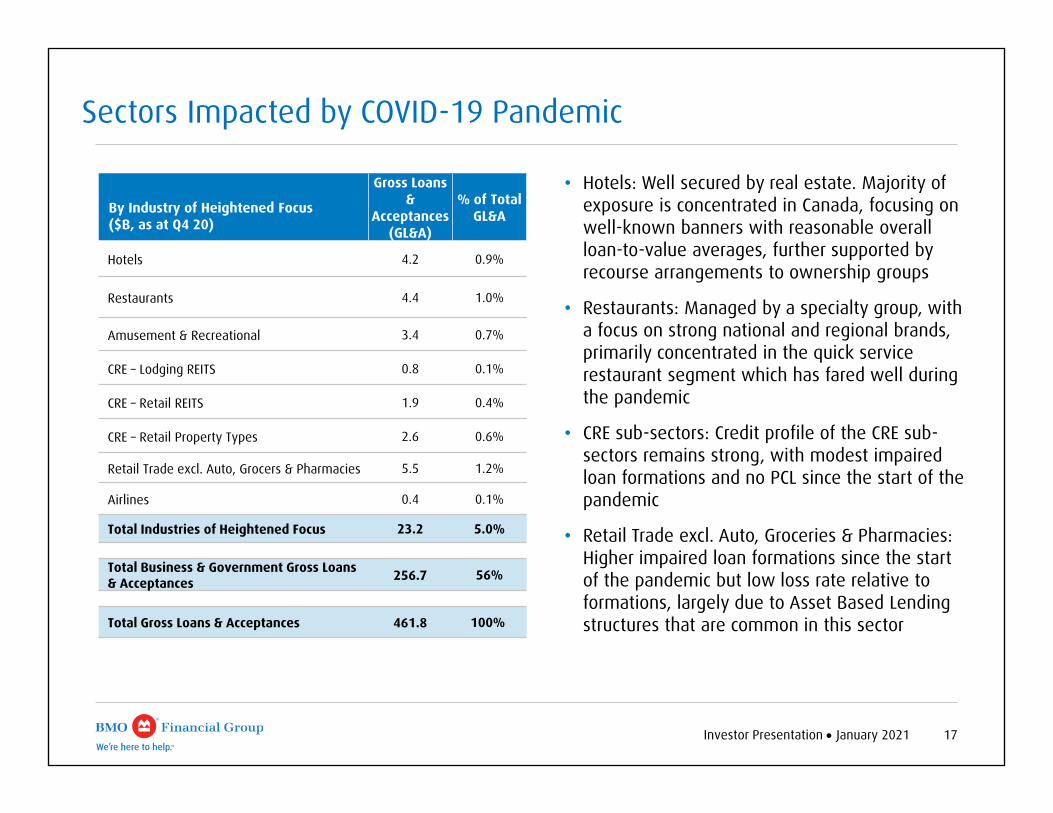
Sectors Impacted by COVID-19 Pandemic
By Industry of Heightened Focus($B, as at Q4 20)
Gross Loans &
Acceptances (GL&A)
% of Total GL&A
Hotels 4.2 0.9%
Restaurants 4.4 1.0%
Amusement & Recreational 3.4 0.7%
CRE – Lodging REITS 0.8 0.1%
CRE – Retail REITS 1.9 0.4%
CRE – Retail Property Types 2.6 0.6%
Retail Trade excl. Auto, Grocers & Pharmacies 5.5 1.2%
Airlines 0.4 0.1%
Total Industries of Heightened Focus 23.2 5.0%
Total Business & Government Gross Loans & Acceptances 256.7 56%
Total Gross Loans & Acceptances 461.8 100%
• Hotels: Well secured by real estate. Majority of exposure is concentrated in Canada, focusing on well-known banners with reasonable overall loan-to-value averages, further supported by recourse arrangements to ownership groups
• Restaurants: Managed by a specialty group, with a focus on strong national and regional brands, primarily concentrated in the quick service restaurant segment which has fared well during the pandemic
• CRE sub-sectors: Credit profile of the CRE sub-sectors remains strong, with modest impaired loan formations and no PCL since the start of the pandemic
• Retail Trade excl. Auto, Groceries & Pharmacies: Higher impaired loan formations since the start of the pandemic but low loss rate relative to formations, largely due to Asset Based Lending structures that are common in this sector

Investor Presentation January 2021 18
Oil and Gas portfolioWell-reserved; high quality portfolio with proven history of strong credit performance over time
E&D65%
Pipelines18%
Services12%
Manufacturing & Refining
5%
O&G Portfolio Breakdown
Oil and Gas %(as at Q4 20)
Of Business and Government Loans
Of Total Gross Loans & Acceptances
NBF 7.4% 3.1%BNS 7.1% 2.6%CIBC 6.3% 2.2%BMO 5.0% 2.8%TD 3.5% 1.3%RBC 3.3% 1.1%Average1 5.0% 2.0%
Canada ($6.2B) U.S. ($6.6B)
E&D62%
Pipelines32%
Services4%
Manufacturing & Refining
2%1 Based on weighted average
• O&G portfolio is not outsized:― 5.0% of Business and Government loans, below three
banks• Loans diversified by geography and sub-segment.
Pipelines 26% of total; low exposure to Services segment• 32% of O&G portfolio is investment grade• E&D 63% of portfolio, of which nearly three-quarters is
borrowing base lending― Over 96% of U.S. E&D loans are borrowing base― 48% of E&D loans in Canada and other countries are
borrowing base. 75% of non-borrowing base E&D loans in Canada and other countries are investment grade
• Security, position in capital structure and structural protections reduce risk
• Clients actively managing situation, experienced in downturns. Majority of non-investment grade borrowers actively hedge, providing a level of protection against short-term commodity price volatility
• O&G allowance on performing loans of $298MM, or ~2.43% of the performing portfolio providing significant coverage; 3.3% excluding Pipelines
• Orderly wind-down of non-Canadian investment and corporate banking energy business
19Investor Presentation January 2021
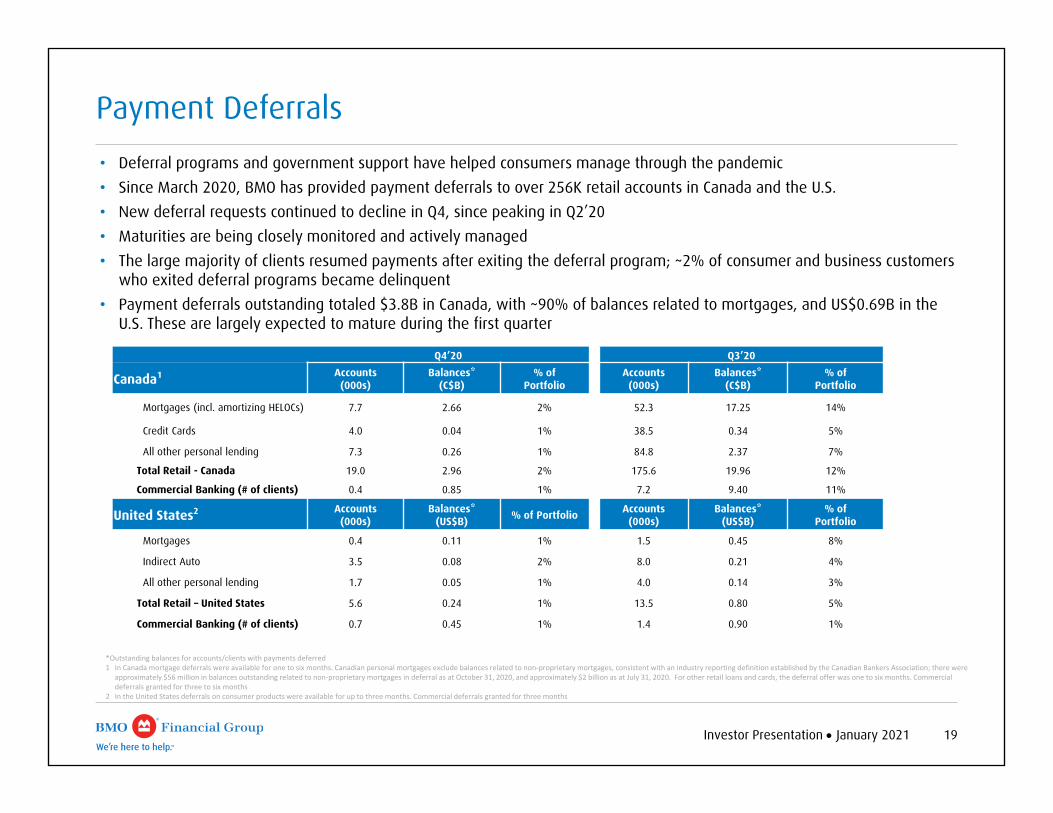
Payment Deferrals• Deferral programs and government support have helped consumers manage through the pandemic• Since March 2020, BMO has provided payment deferrals to over 256K retail accounts in Canada and the U.S.• New deferral requests continued to decline in Q4, since peaking in Q2’20• Maturities are being closely monitored and actively managed • The large majority of clients resumed payments after exiting the deferral program; ~2% of consumer and business customers
who exited deferral programs became delinquent• Payment deferrals outstanding totaled $3.8B in Canada, with ~90% of balances related to mortgages, and US$0.69B in the
U.S. These are largely expected to mature during the first quarter
Q4’20 Q3’20
Canada1 Accounts(000s)
Balances*(C$B)
% of Portfolio
Accounts(000s)
Balances*(C$B)
% of Portfolio
Mortgages (incl. amortizing HELOCs) 7.7 2.66 2% 52.3 17.25 14%
Credit Cards 4.0 0.04 1% 38.5 0.34 5%
All other personal lending 7.3 0.26 1% 84.8 2.37 7%
Total Retail - Canada 19.0 2.96 2% 175.6 19.96 12%
Commercial Banking (# of clients) 0.4 0.85 1% 7.2 9.40 11%
United States2 Accounts(000s)
Balances*(US$B) % of Portfolio Accounts
(000s)Balances*
(US$B)% of
Portfolio
Mortgages 0.4 0.11 1% 1.5 0.45 8%
Indirect Auto 3.5 0.08 2% 8.0 0.21 4%
All other personal lending 1.7 0.05 1% 4.0 0.14 3%
Total Retail – United States 5.6 0.24 1% 13.5 0.80 5%
Commercial Banking (# of clients) 0.7 0.45 1% 1.4 0.90 1%
*Outstanding balances for accounts/clients with payments deferred1 In Canada mortgage deferrals were available for one to six months. Canadian personal mortgages exclude balances related to non‐proprietary mortgages, consistent with an industry reporting definition established by the Canadian Bankers Association; there were
approximately $56 million in balances outstanding related to non‐proprietary mortgages in deferral as at October 31, 2020, and approximately $2 billion as at July 31, 2020. For other retail loans and cards, the deferral offer was one to six months. Commercial deferrals granted for three to six months
2 In the United States deferrals on consumer products were available for up to three months. Commercial deferrals granted for three months

Q4 F2020 Highlights

Investor Presentation January 2021 21
F2020 - Financial HighlightsGood PPPT5 performance absorbed higher PCLs, with positive operating leverage
• Adjusted1 EPS $7.71, down 18% Y/Y (reported down 13%)
• Adjusted1 net income down 17% Y/Y (reported down 11%)
• Adjusted1 PPPT5 up 7% Y/Y (reported3 up 14%)
• Net revenue2 up 3% Y/Y
• Adjusted1 expenses flat Y/Y; disciplined approach to expense management– Reported3 expenses down 3% Y/Y reflecting $484MM
($357MM after-tax) restructuring charge in prior year
• Adjusted1 efficiency ratio2 59.8%, improved 160 bps Y/Y (reported 60.4%, improved 380 bps)
• Adjusted1 operating leverage2 2.7% (reported 6.2%)
• Total PCL $2,953MM, up $2,081MM Y/Y due to the pandemic– PCL on impaired loans $1,522MM or 33 bps; performing loans
$1,431MM– Total PCL to average net loans and acceptances 63 bps
Reported Adjusted1
($MM) F2020 F2019 F2020 F2019
Net Revenue2 23,478 22,774 23,478 22,799
Expense3 14,177 14,630 14,042 14,005
PPPT5 9,301 8,144 9,436 8,794
Total PCL 2,953 872 2,953 872
Net Income 5,097 5,758 5,201 6,249
Diluted EPS ($) 7.55 8.66 7.71 9.43
ROE (%) 10.1 12.6 10.3 13.7
ROTCE4 (%) 11.9 15.1 11.9 16.1
CET1 Ratio (%) 11.9 11.4
1 Adjusted measures are non-GAAP measures, see slide 2 for more information. For details on adjustments refer to page 7 of BMO’s Q4’20 Report to Shareholders2 Net revenue is net of insurance claims, commissions and changes in policy benefit liabilities (CCPB). Operating leverage and efficiency ratio based on net revenue. Reported gross revenue: F2020 $25,186MM; F2019
$25,483MM. Reported net revenue in F2019 includes $25MM reinsurance adjustment in CCPB for the net impact of major reinsurance claims from Japanese typhoons that were incurred after our announced decision to wind down our reinsurance business
3 Reported expenses include $484MM restructuring charge in F20194 Return on Tangible Common Equity (ROTCE)5 Pre-Provision Pre-Tax earnings (PPPT) is the difference between net revenue and expenses

Investor Presentation January 2021 22
• Adjusted1 EPS $2.41 (reported $2.37)
• Adjusted1 net income $1,610MM (reported $1,584MM)
• Adjusted1 PPPT5 $2,471MM, up 7% Y/Y (reported $2,438MM, up 38%)
• Adjusted1 and reported net revenue2 up 4% Y/Y
• Adjusted1 expenses up 1% Y/Y– Reported3 expenses down 11% Y/Y reflecting $484MM
($357MM after-tax) restructuring charge in prior year
• Adjusted1 efficiency ratio2 58.7%, improved 130 bps Y/Y (reported 59.3%, improved 1,000 bps)
• Adjusted1 operating leverage2 2.1% (reported 15.1%)
• Total PCL $432MM, up $179MM Y/Y; down $622MM Q/Q– PCL on impaired loans $339MM or 30 bps; PCL on
performing loans $93MM– Total PCL to average net loans and acceptances 38 bps
1 Adjusted measures are non-GAAP measures, see slide 2 for more information. For details on adjustments refer to page 7 of BMO’s Q4’20 Report to Shareholders 2 Net revenue is net of insurance claims, commissions and changes in policy benefit liabilities (CCPB). Operating leverage and efficiency ratio based on net revenue. Reported gross revenue: Q4‘20 $5,986MM; Q3‘20
$7,189MM; Q4'19 $6,087MM. Reported net revenue in Q4’19 includes $25MM reinsurance adjustment in CCPB for the net impact of major reinsurance claims from Japanese typhoons that were incurred after our announced decision to wind down our reinsurance business
3 Reported expenses include $484MM restructuring charge in Q4’194 Return on Tangible Common Equity (ROTCE)5 Pre-Provision Pre-Tax earnings (PPPT) is the difference between net revenue and expenses
Q4 F2020 - Financial HighlightsGood PPPT5 growth with positive operating leverage and income flat Y/Y
Reported Adjusted1
($MM) Q4 20 Q3 20 Q4 19 Q4 20 Q3 20 Q4 19
Net Revenue2 5,986 6,000 5,752 5,986 6,000 5,777
Expenses3 3,548 3,444 3,987 3,515 3,407 3,463
PPPT5 2,438 2,556 1,765 2,471 2,593 2,314
Total PCL 432 1,054 253 432 1,054 253
Net Income 1,584 1,232 1,194 1,610 1,259 1,607
Diluted EPS ($) 2.37 1.81 1.78 2.41 1.85 2.43
ROE (%) 12.4 9.4 9.9 12.6 9.6 13.5
ROTCE4 (%) 14.5 11.1 11.9 14.5 11.1 15.7
CET1 Ratio (%) 11.9 11.6 11.4
1,194
1,592
689
1,232 1,584
1,607 1,617
715
1,259
1,610
Q4'19 Q1'20 Q2'20 Q3'20 Q4'20
Net Income1 Trends
Reported Net Income ($MM) Adjusted Net Income ($MM)

Investor Presentation January 2021 23
1,293 1,287 1,218 1,213 1,250
785 795 742 749 781
Q4'19 Q1'20 Q2'20 Q3'20 Q4'20
Commercial
Personal
2,0821,9621,960
2,078 2,031
Canadian Personal & Commercial Banking
Revenue ($MM)
• Highly engaged team focused on providing a personalized banking experience, anticipating customers’ needs and finding new ways to help
• Top-tier commercial banking business, number two ranking in Canadian market share for business loans up to $25 million
• Strong and growing retail banking business, accelerating digital engagement and digital sales
• Largest Mastercard® card issuer in Canada• Consistently applied credit risk management practices, providing
reliable access to appropriate financing solutions
Net Income1 and NIM
Strengths and Value Drivers
710 700
361 320
647
710 700
362 320
648
2.69 2.68 2.58 2.54 2.60
Q4'19 Q1'20 Q2'20 Q3'20 Q4'20
ReportedNet
Income($MM)
AdjustedNet
Income($MM)
NIM (%)
Highlights (Adjusted1) F2020 Q4’20
1 Adjusted measures are non-GAAP measures, see slide 2 for more information. For details on adjustments refer to page 7 of BMO’s Q4’20 Report to ShareholdersF2020 on a reported basis: Net Income $2,028MM; Net Income Growth (23)%; ROE: 18.1%; Efficiency Ratio 48.4%; Operating Leverage (0.8)%Q4’20 on a reported basis: Net Income $647MM; Net Income Growth (9)%; ROE: 22.7%; Efficiency Ratio 47.6%; Operating Leverage (1.3)%
2 Pre-Provision Pre-Tax profit contribution; PPPT is the difference between revenue and expenses
Net Income $2,030MM $648MM
Net Income Growth (Y/Y) (23)% (9)%
Revenue Growth (Y/Y) 1% (2)%
PPPT2 Growth (Y/Y) - (3)%
ROE 18.1% 22.7%
Efficiency Ratio 48.4% 47.6%
Operating Leverage (0.8)% (1.4)%
Average Net Loans and Acceptances $249B $250B

Investor Presentation January 2021 24
Canadian Personal & Commercial Banking
• Continue to improve customer loyalty by deepening primary relationships
– In Personal Banking, deepen primary relationships, enhance digital capabilities and deliver a leading customer experience
– In Commercial Banking, focus on maintaining core strengths, target opportunities for growth and diversification across high-value sectors and businesses, invest in digital and payment capabilities, and continue to leverage cross-bank collaboration
• Support customers, employees and the broader community to alleviate the adverse impact of the COVID-19 pandemic• Drive efficiencies by simplifying and streamlining operations, investing in digital capabilities and through cross-bank
collaboration
Strategic Priorities
Performance
53% 55% 59%
35% 38% 42%
2018 2019 2020
Digital Adoption1
Digital Mobile
Average Gross Loans & Acceptances ($B) Average Deposits ($B)
1 Adoption is the percent of retail deposit customers that have logged in within the last 90 days; as at October 31, 2018, 2019 and 2020
84.6 90.0 88.0
9.2 8.2 8.4 47.6 48.3 48.6
102.0 104.5 106.0
Q4'19 Q3'20 Q4'20
Commercial Credit CardsConsumer Loans Residential Mortgages
243.4 251.0 251.0
68.8 85.6 90.0
115.2 127.5 127.9
Q4'19 Q3'20 Q4'20
Commercial Deposits Personal Deposits
184.0213.1 217.9
Investor Presentation January 2021 25
Strengths and Value Drivers
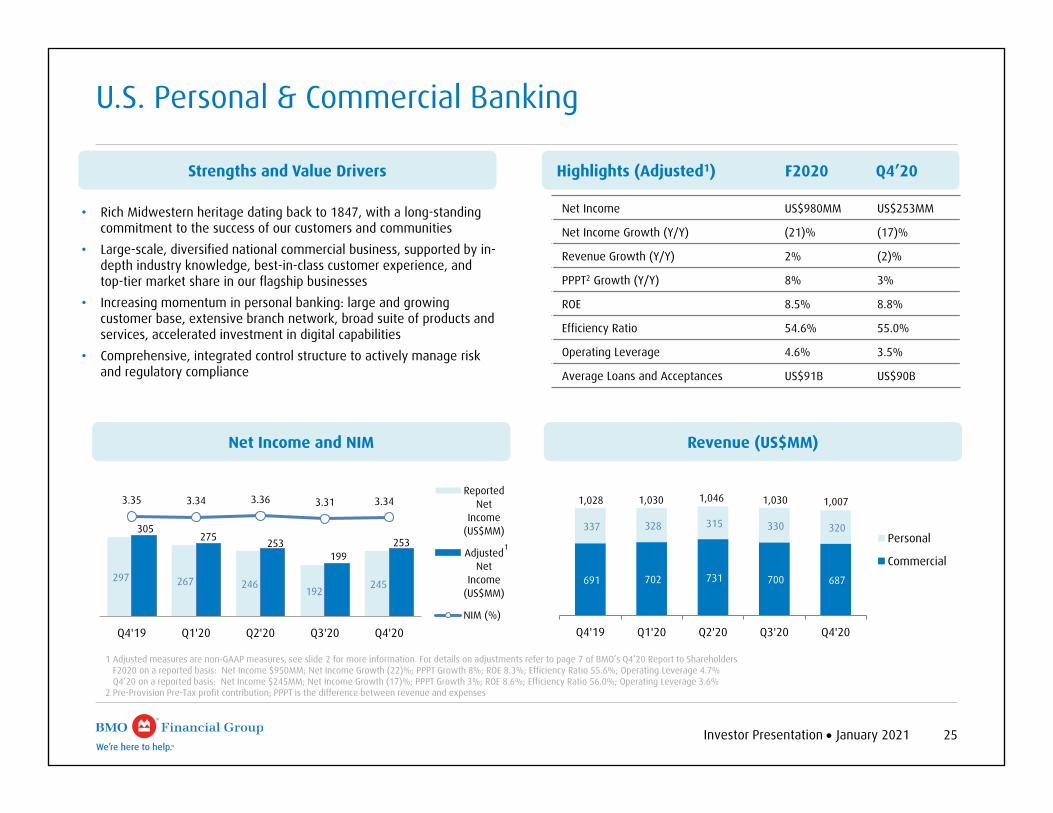
U.S. Personal & Commercial Banking
Net Income and NIM Revenue (US$MM)
297 267 246 192
245
305 275 253
199 253
3.35 3.34 3.36 3.31 3.34
Q4'19 Q1'20 Q2'20 Q3'20 Q4'20
ReportedNet
Income(US$MM)
AdjustedNet
Income(US$MM)
NIM (%)
• Rich Midwestern heritage dating back to 1847, with a long-standing commitment to the success of our customers and communities
• Large-scale, diversified national commercial business, supported by in-depth industry knowledge, best-in-class customer experience, and top-tier market share in our flagship businesses
• Increasing momentum in personal banking: large and growing customer base, extensive branch network, broad suite of products and services, accelerated investment in digital capabilities
• Comprehensive, integrated control structure to actively manage risk and regulatory compliance
691 702 731 700 687
337 328 315 330 320
Q4'19 Q1'20 Q2'20 Q3'20 Q4'20
Personal
Commercial
1,030 1,046 1,030 1,0071,028
1 Adjusted measures are non-GAAP measures, see slide 2 for more information. For details on adjustments refer to page 7 of BMO’s Q4’20 Report to ShareholdersF2020 on a reported basis: Net Income $950MM; Net Income Growth (22)%; PPPT Growth 8%; ROE 8.3%; Efficiency Ratio 55.6%; Operating Leverage 4.7% Q4’20 on a reported basis: Net Income $245MM; Net Income Growth (17)%; PPPT Growth 3%; ROE 8.6%; Efficiency Ratio 56.0%; Operating Leverage 3.6%
2 Pre-Provision Pre-Tax profit contribution; PPPT is the difference between revenue and expenses
Highlights (Adjusted1) F2020 Q4’20
1
Net Income US$980MM US$253MM
Net Income Growth (Y/Y) (21)% (17)%
Revenue Growth (Y/Y) 2% (2)%
PPPT2 Growth (Y/Y) 8% 3%
ROE 8.5% 8.8%
Efficiency Ratio 54.6% 55.0%
Operating Leverage 4.6% 3.5%
Average Loans and Acceptances US$91B US$90B
Investor Presentation January 2021 26
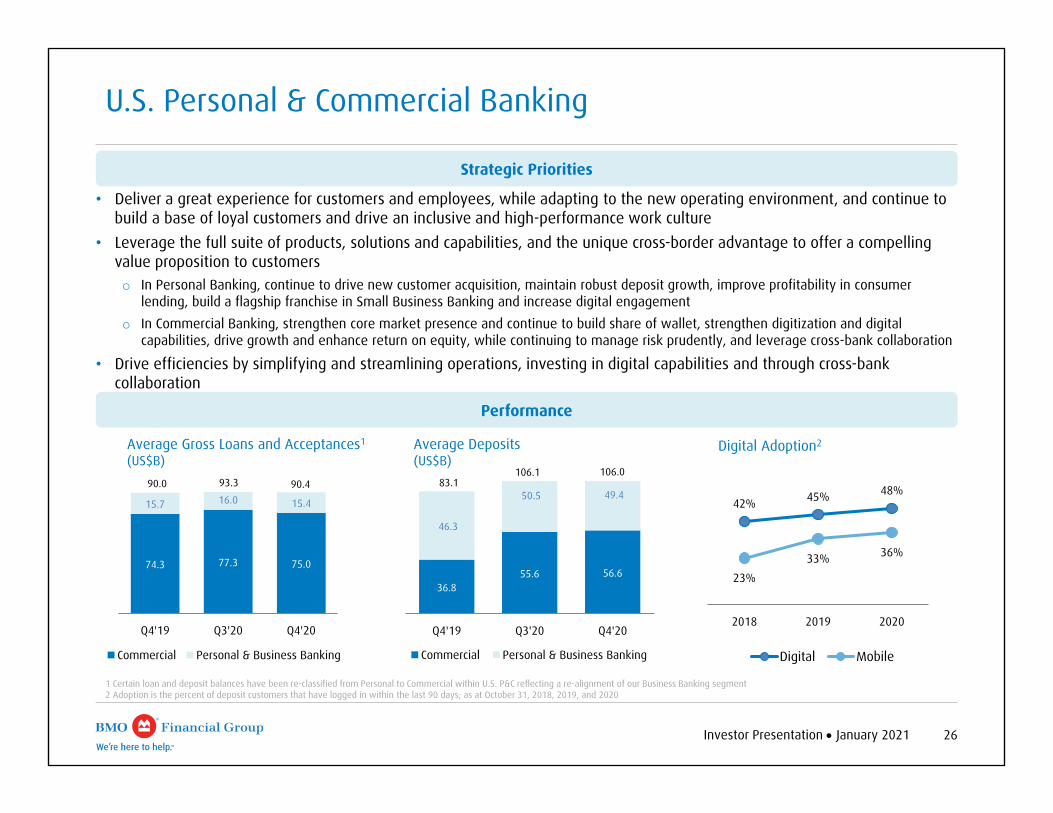
U.S. Personal & Commercial Banking
• Deliver a great experience for customers and employees, while adapting to the new operating environment, and continue to build a base of loyal customers and drive an inclusive and high-performance work culture
• Leverage the full suite of products, solutions and capabilities, and the unique cross-border advantage to offer a compelling value proposition to customerso In Personal Banking, continue to drive new customer acquisition, maintain robust deposit growth, improve profitability in consumer
lending, build a flagship franchise in Small Business Banking and increase digital engagemento In Commercial Banking, strengthen core market presence and continue to build share of wallet, strengthen digitization and digital
capabilities, drive growth and enhance return on equity, while continuing to manage risk prudently, and leverage cross-bank collaboration
• Drive efficiencies by simplifying and streamlining operations, investing in digital capabilities and through cross-bank collaboration
Strategic Priorities
74.3 77.3 75.0
15.7 16.0 15.4
Q4'19 Q3'20 Q4'20
Commercial Personal & Business Banking
93.3 90.490.0
Average Gross Loans and Acceptances1
(US$B)
36.855.6 56.6
46.3
50.5 49.4
Q4'19 Q3'20 Q4'20
Commercial Personal & Business Banking
83.1106.1 106.0
Average Deposits(US$B)
Performance
1 Certain loan and deposit balances have been re-classified from Personal to Commercial within U.S. P&C reflecting a re-alignment of our Business Banking segment2 Adoption is the percent of deposit customers that have logged in within the last 90 days; as at October 31, 2018, 2019, and 2020
42% 45% 48%
23%33% 36%
2018 2019 2020
Digital Adoption2
Digital Mobile

Investor Presentation January 2021 27
Net Income $1,130MM $328MM
Net Income Growth (Y/Y) 1% 9%
Revenue2 Growth (Y/Y) 1% 6%
PPPT3 Growth (Y/Y) 2% 7%
ROE 17.7% 20.6%
Efficiency Ratio2 69.5% 66.5%
Operating Leverage2 0.5% 1.6%
AUA / AUM $895B $895B
Average Loans / Deposits $27B / $44B $27B / $47B
394 411 401 411 412
471 482 464 498 483
Q4'19 Q1'20 Q2'20 Q3'20 Q4'20
AUA AUM
893865 865 909 895
236 245 209 218160 169
271 279 253 261
30 5582 82
-16 -16
70 7067 67
BMO Wealth Management
Net Income1 ($MM) AUA / AUM ($B)
Reported Adjusted Reported Adjusted Reported Adjusted Reported Adjusted Reported Adjusted
Q4’19 Q1’20 Q2’20 Q3’20 Q4’20
291
153
349341300
144
Traditional Wealth Insurance
Strengths and Value Drivers
328320
1 Adjusted measures are non-GAAP measures, see slide 2 for more information. For details on adjustments refer to page 7 of BMO’s Q4’20 Report to ShareholdersF2020 on a reported basis: Net Income $1,096MM; Net Income Growth 3%; Net Revenue Growth 1%; PPPT Growth 4%; ROE 17.1%; Efficiency Ratio 70.4%; Operating Leverage 1.1%Q4’20 on a reported basis: Net Income $320MM; Net Income Growth 20%; Net Revenue Growth 6%; PPPT Growth 15%; ROE 20.1%; Efficiency Ratio 67.3%; Operating Leverage 3.8%
2 Revenue, efficiency ratio and operating leverage based on net revenue. Net revenue is net of insurance claims, commissions and changes in policy benefit liabilities (CCPB)3 Pre-Provision Pre-Tax profit contribution; PPPT is the difference between net revenue and expenses
266 300
• Planning and advice-based approach that integrates investment, insurance, specialized wealth management and core banking solutions, offered by a team of highly skilled professionals
• Diversified products and services, from digital investing to integrated full-service investment management, banking and wealth advisory services for retail, business and institutional clients
• Global asset manager with a commitment in responsible investing delivering innovative investment solutions to institutional and individual clients including BMO Mutual Funds and BMO Exchange Traded Funds across a range of channels
• Robust risk management framework supporting alignment with heightened regulatory expectations
Highlights (Adjusted1) F2020 Q4’20

Investor Presentation January 2021 28
Strategic Priorities
BMO Wealth Management
BMO GAM Investment Asset Class3Net Revenue1 by Business – F2020
Intermediary37%
Multi-Asset24%
Retail14%
Institutional59%
Liquidity Management
5%
Fixed Income
36%
Equity31%
Alternatives4%
Diversification
12%
8%
44%7%
29%
BMO WealthManagementU.S.BMOInsurance
BMO PrivateWealth
BMOInvestorLine
BMO GlobalAssetManagement
~65%Fee-based Revenues2
ETF#1 in net new
assets in Canadian market4
1 Net revenue is net of insurance claims, commissions and changes in policy benefit liabilities (CCPB)2 % of F2020 total Wealth Management net revenue 3 Investment Asset Class as of October F20204 Net new assets as of October F2020
• Deliver a differentiated client experience, providing outstanding support and working together to plan, grow, protect and transition their wealth with confidence
• Extend our advantage as a solutions provider, delivering innovative asset management and insurance offerings that anticipate clients’ evolving needs and exceed their expectations
• Build on a strong foundation and continue to evolve, simplify and streamline businesses to drive value, efficiency and returns • Activate and drive an inclusive, high-performance culture, focused on strong collaboration and alignment across the enterprise
and a commitment to building diverse and inclusive teams to bring the best of BMO to all clients

Investor Presentation January 2021 29
Net Income $1,116MM $387MM
Net Income Growth (Y/Y) (0%) 38%
Revenue Growth (Y/Y) 12% 17%
PPPT2 Growth (Y/Y) 41% 47%
Efficiency Ratio 60.1% 57.4%
Operating Leverage 13.3% 15.4%
Average Gross Loans and Acceptances $67B $64B
Offices 35 globally, 22 in N.A.
U.S. Revenue Contribution3 47% 45%
U.S. IB market share4 #20
686 823 564
981 854
493 546
487
547 524
Q4'19 Q1'20 Q2'20 Q3'20 Q4'20
InvestmentandCorporateBanking
GlobalMarkets
1,3691,179
1,3781,528
1,051
Strengths and Value Drivers
BMO Capital Markets
Net Income1 ($MM) Revenue ($MM)
• A valued financial partner to our clients; leveraging our people, innovative solutions and capital to help them overcome their challenges and achieve their goals
• Unified coverage and integrated North American platform, delivering a seamless and exceptional client experience
• Well diversified platform and business mix by sector, geography, product and currency, including a strong and scalable U.S. business
• Strong first line of defense risk management and regulatory and compliance capabilities
• High performance culture with strong focus on diversity and inclusion
271 356
(74)
426 379
282
362
(68)
435 387
Q4'19 Q1'20 Q2'20 Q3'20 Q4'20
Reported NetIncome
Adjusted NetIncome
1 Adjusted measures are non-GAAP measures, see slide 2 for more information. For details on adjustments refer to page 7 of BMO’s Q4’20 Report to Shareholders F2020 on a reported basis: Net Income $1,087MM; Net Income Growth (0)%; PPPT Growth 41%; Efficiency Ratio 60.8%; Operating Leverage 13.2%Q4’20 on a reported basis: Net Income $379MM; Net Income Growth 40%; PPPT Growth 49%; Efficiency Ratio 58.1%; Operating Leverage 15.8%
2 Pre-Provision Pre-Tax profit contribution; PPPT is the difference between revenue and expenses 3 U.S. Revenue as a % of Total 4 Source: Dealogic as at October 31, 2020
Highlights (Adjusted1) F2020 Q4’20
Investor Presentation January 2021 30
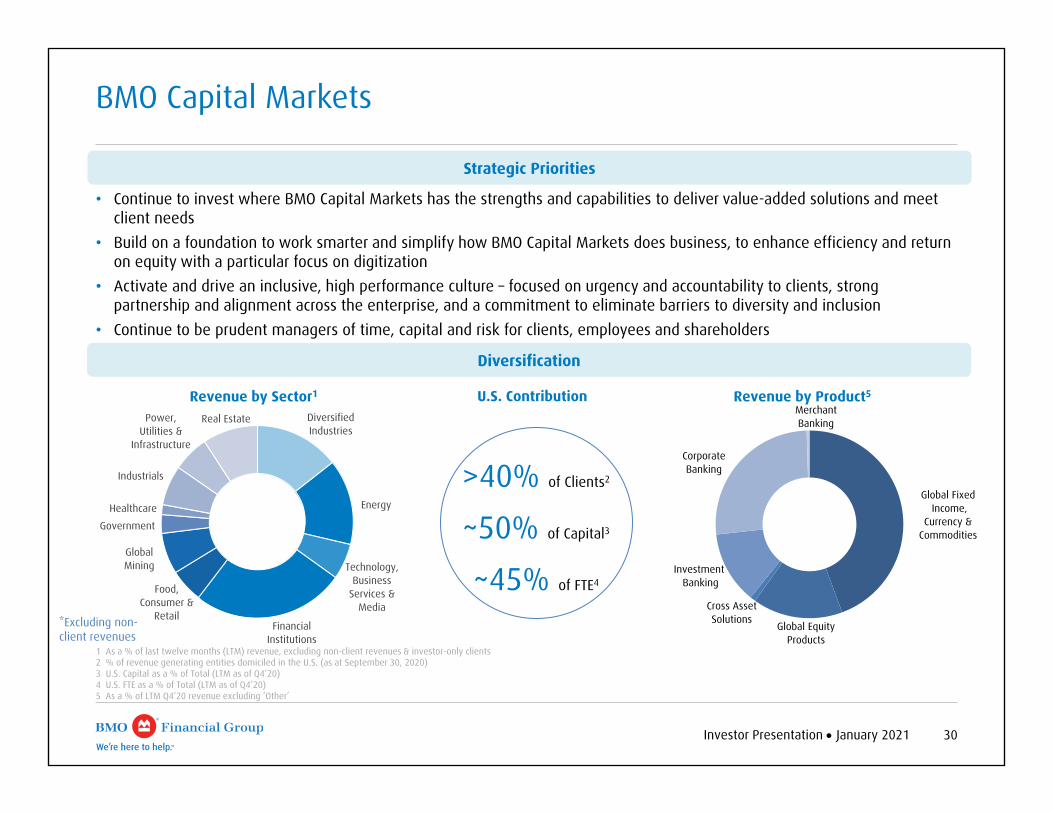
• Continue to invest where BMO Capital Markets has the strengths and capabilities to deliver value-added solutions and meet client needs
• Build on a foundation to work smarter and simplify how BMO Capital Markets does business, to enhance efficiency and return on equity with a particular focus on digitization
• Activate and drive an inclusive, high performance culture – focused on urgency and accountability to clients, strong partnership and alignment across the enterprise, and a commitment to eliminate barriers to diversity and inclusion
• Continue to be prudent managers of time, capital and risk for clients, employees and shareholders
BMO Capital Markets
*Excluding non-client revenues
U.S. Contribution Revenue by Product5Revenue by Sector1
1 As a % of last twelve months (LTM) revenue, excluding non-client revenues & investor-only clients2 % of revenue generating entities domiciled in the U.S. (as at September 30, 2020)3 U.S. Capital as a % of Total (LTM as of Q4’20)4 U.S. FTE as a % of Total (LTM as of Q4’20)5 As a % of LTM Q4’20 revenue excluding ‘Other’
>40% of Clients2
~50% of Capital3
~45% of FTE4
Diversified Industries
Energy
Technology, Business
Services & Media
Financial Institutions
Food, Consumer &
Retail
Global Mining
Government
Healthcare
Industrials
Power, Utilities &
Infrastructure
Real Estate
Global FixedIncome,
Currency & Commodities
Global Equity Products
Cross Asset Solutions
InvestmentBanking
Corporate Banking
Merchant Banking
Strategic Priorities
Diversification

Investor Presentation January 2021 31
• U.S. P&C Q4’20 adjusted3 PPPT up 3%‒ Delivered positive adjusted3 operating leverage of 3.5%;
adjusted3 efficiency ratio of 55.0% meets Investor Day target of mid-50s
• BMO Capital Markets delivering on strategy, providing growth and diversification ‒ Achieved Investor Day target of 45-50% revenue contribution
from U.S. in Q4 and F2020
U.S. Operations U.S. segment continuing to deliver strong results
BMO CM22%
BMO WM5%U.S. P&C
73%
U.S. Segment Adjusted3 Net Income by Operating Group4 – F2020
Figures that follow are on a U.S. dollar basis
• U.S. segment contributing ~1/3 total bank earnings‒ #121 in U.S. commercial lending; top-tier commercial lending
market position in flagship U.S. markets
‒ #3 deposit market share in our core footprint2; #2 in Chicago and Milwaukee
‒ Leveraging strong integration and collaboration across businesses to provide integrated client offering
1 Based upon publicly available U.S. regulatory filings (FR Y-9Cs and FFIEC 002s) and internal analysis2 Core footprint includes Illinois, Kansas, Wisconsin, Missouri, Indiana and Minnesota3 Adjusted measures are non-GAAP measures, see slide 2 for more information. For details on adjustments refer to page 7 of BMO’s Q4’20 Report to Shareholders
On a reported basis: U.S. P&C PPPT up 3%; U.S. P&C operating leverage 3.6%; U.S. P&C efficiency ratio 56.0%Total bank reported net income by geography for F2020: Canada 59%, U.S. 31%, Other 10%; U.S. Segment reported net income by operating group for F2020: U.S. P&C 74%, BMO CM 21%, BMO WM 5%
4 Excludes Corporate Services
U.S.31%
Other11%
Can.58%
Total Bank Adjusted3 Net Income by Geography – F2020

Risk Overview
Investor Presentation January 2021 33
Provision for Credit Losses (PCL)
PCL on Impaired Loans as a % of Average Net Loans & Acceptances
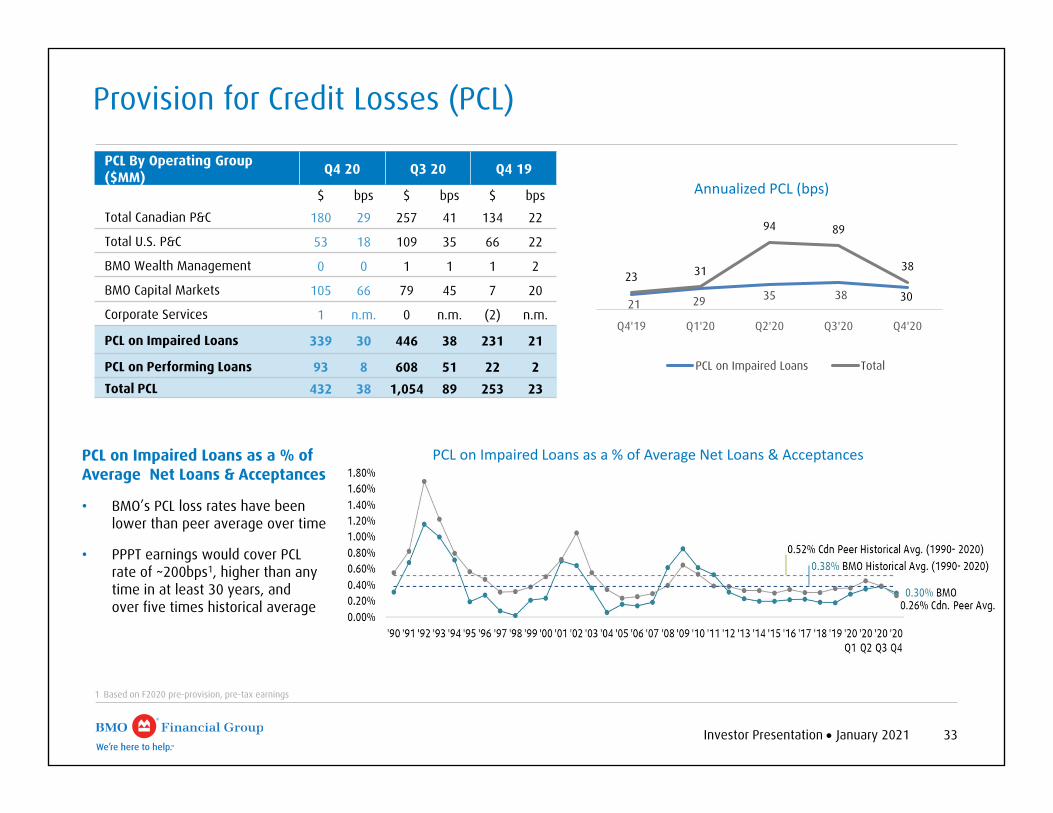
• BMO’s PCL loss rates have been lower than peer average over time
• PPPT earnings would cover PCL rate of ~200bps1, higher than any time in at least 30 years, and over five times historical average
1 Based on F2020 pre-provision, pre-tax earnings
PCL By Operating Group ($MM) Q4 20 Q3 20 Q4 19
$ bps $ bps $ bps
Total Canadian P&C 180 29 257 41 134 22
Total U.S. P&C 53 18 109 35 66 22
BMO Wealth Management 0 0 1 1 1 2
BMO Capital Markets 105 66 79 45 7 20
Corporate Services 1 n.m. 0 n.m. (2) n.m.
PCL on Impaired Loans 339 30 446 38 231 21
PCL on Performing Loans 93 8 608 51 22 2Total PCL 432 38 1,054 89 253 23
21 29 35 38 30
23 31
94 89
38
Q4'19 Q1'20 Q2'20 Q3'20 Q4'20
Annualized PCL (bps)
PCL on Impaired Loans Total
PCL on Impaired Loans as a % of Average Net Loans & Acceptances

34Investor Presentation January 2021
1 Total Business and Government includes $84MM GIL from Other Countries2 Other Business and Government includes industry segments that are each <1% of total GIL
• GIL ratio 79 bps, down 16 bps Q/Q
Gross Impaired Loans (GIL) and Formations
By Industry($MM, as at Q4 20)
Formations Gross Impaired Loans
Canada & Other U.S. Total Canada &
Other1 U.S. Total
Consumer 105 40 145 414 335 749
Service Industries 30 41 71 137 382 519
Oil & Gas 31 142 173 93 457 550
Retail Trade 42 5 47 311 149 460
Agriculture 11 13 24 70 279 349
Manufacturing 34 4 38 183 109 292
Transportation 2 31 33 14 130 144
Commercial Real Estate 19 30 49 49 40 89
Financing Products 0 0 0 0 147 147
Wholesale Trade 20 0 20 43 61 104
Construction (non-real estate) 3 5 8 64 40 104
Financial 10 0 10 19 29 48
Mining 0 40 40 0 40 40
Other Business and Government2 4 0 4 30 13 43Total Business and Government 206 311 517 1,013 1,876 2,889
Total Bank 311 351 662 1,427 2,211 3,638
799 831 1,396
1,760
662
Q4'19 Q1'20 Q2'20 Q3'20 Q4'20
Formations ($MM)
2,629 2,822 3,645
4,413 3,638
Q4'19 Q1'20 Q2'20 Q3'20 Q4'20
Gross Impaired Loans ($MM)
58 62 7495 79
Q4'19 Q1'20 Q2'20 Q3'20 Q4'20
GIL (bps)

35Investor Presentation January 2021
$6.4
$23.8
$69.6
$19.2
$30.2
$4.5
48%33% 24%
52%17%
48%
40%
39%
52%
31% 58%
36%
12%
28%
24%
17%
25%
16%
Atlantic Quebec Ontario Alberta British Columbia All Other Canada
Residential-Secured Lending by Region ($153.7B)
HELOC
Uninsured Mortgages
Insured Mortgages
Canadian Residential-Secured Lending
Avg. LTV1
UninsuredAtlantic Quebec Ontario Alberta British
ColumbiaAll Other Canada
Total Canada
Mortgage - Portfolio 58% 57% 54% 62% 50% 56% 54% - Origination 74% 73% 69% 73% 66% 73% 70%HELOC - Portfolio 47% 52% 44% 56% 44% 47% 47% - Origination 72% 73% 65% 68% 62% 66% 66%
1 LTV is the ratio of outstanding mortgage balance or the HELOC authorization to the original property value indexed using Teranet data. Portfolio LTV is the combination of each individual mortgage or HELOC LTV weighted by the mortgage balance or HELOC authorization
• Total Canadian residential-secured lending portfolio at $153.7B, representing 33% of total loans─ LTV1 on uninsured of 51%
─ 90-day delinquency rate for RESL remains good at 19 bps; loss rates for the trailing 4 quarter period were 1 bp
• Residential mortgage portfolio of $117.9B─ 38% of portfolio insured
─ LTV1 on uninsured of 54%
─ 80% of the mortgage portfolio has an effective remaining amortization of 25 years or less
• HELOC portfolio of $35.9B outstanding of which 63% is amortizing
• GTA and GVA portfolios demonstrate better LTV1, delinquency rates and bureau scores compared to the national average

Economic and Housing Market Overview

Investor Presentation January 2021 37
Economic outlook and indicators1
1 This slide contains forward looking statements. See caution on slide 22 Data is annual average. Estimates as of January 4, 20213 Eurozone estimates provided by IMF World Economic Outlook/Haver
Canada United States Eurozone
Economic Indicators (%)1, 2 2020E2 2021E2 2022E2 2020E2 2021E2 2022E2 2020E2 2021E2 2022E2
GDP Growth (5.5) 5.0 4.5 (3.5) 4.5 3.5 (6.8) 5.5 3.0
Inflation 0.8 1.7 1.9 1.2 2.0 2.1 0.3 0.7 1.0
Interest Rate (3mth Tbills) 0.45 0.10 0.10 0.35 0.10 0.10 (0.43) (0.54) (0.54)
Unemployment Rate 9.5 7.5 6.5 8.1 5.9 4.7 8.1 7.9 7.0
Current Account Balance / GDP3 (1.7) (1.6) (1.9) (3.0) (3.5) (3.5) 3.0 3.4 3.5
Budget Surplus / GDP3 (17.5) (5.2) (2.1) (14.9) (13.8) (6.6) (8.6) (6.5) (4.1)
United States
• U.S. GDP plunged during the pandemic, but has rebounded strongly. While a resurgence in infections is slowing activity, additional fiscal stimulus and vaccines will support a sturdy recovery in 2021
• After surging to a post-war high last spring, the unemployment rate has fallen sharply to below 7%
• The Federal Reserve is expected to keep policy rates near zero for at least two more years, while purchasing longer-term securities to keep market interest rates low
Canada
• Canada’s economy contracted sharply in 2020 due to the coronavirus and weak oil prices, but it has rebounded on support from fiscal and monetary stimulus. While a resurgence of the virus will slow the economy in early 2021, widescale vaccinations will promote a return to strong growth for the year
• The unemployment rate has fallen below 9% recently, but it is expected to remain elevated in 2021
• The Bank of Canada is expected to keep policy rates steady for at least a couple of years amid low inflation

Investor Presentation January 2021 38
Canada’s housing market is strong
Source: BMO CM Economics and Canadian Bankers’ Association as at January 4, 2021This slide contains forward looking statements. See caution on slide 2
Debt Service Ratio Mortgage Delinquencies/Unemployment
• National existing home sales rebounded to record highs in recent months after plunging in the shutdowns. Record-low mortgage rates and shifts in demand arising from remote working have supported the market
• Benchmark prices are up more than 10% in the past year, with demand surpassing supply
• Home sales are likely to moderate amid less pent-up demand in 2021, though prices should continue to rise
• Substantial fiscal income-support and mortgage deferral programs have tempered forced sales and downward price pressure
• Mortgage arrears remain near record lows, but are expected to rise somewhat due to elevated unemployment
• Debt servicing costs (relative to income) have eased from all-time highs
0.02.04.06.08.0
10.012.014.016.0
1990
1991
1992
1993
1994
1995
1996
1997
1998
1999
2000
2001
2002
2003
2004
2005
2006
2007
2008
2009
2010
2011
2012
2013
2014
2015
2016
2017
2018
2019
2020
Total
Interest only
5.06.07.08.09.010.011.012.013.014.0
0.20
0.25
0.30
0.35
0.40
0.45
0.50
Canada: Percent of Arrears to Total Number of Residential Mortgages (%)
Canada: Unemployment Rate: Both Sexes, 15 Years and Over (SA, %)
Investor Presentation January 2021 39
0.0
1.0
2.0
3.0
4.0
5.0
6.0
1998
1999
2000
2001
2002
2003
2004
2005
2006
2007
2008
2009
2010
2011
2012
2013
2014
2015
2016
2017
2018
2019
2020
Canada United States
Mortgage DelinquenciesArrears to Total Number of Residential Mortgages (%)
Equity Ownership (%)
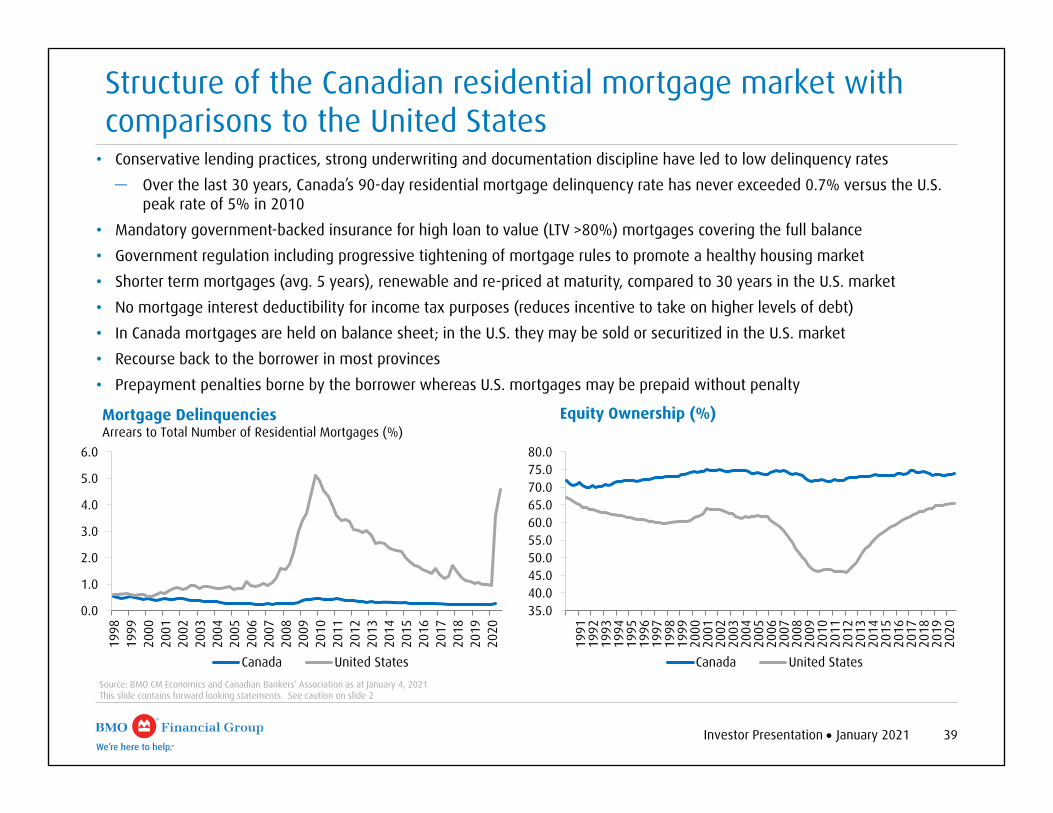
Structure of the Canadian residential mortgage market with comparisons to the United States
Source: BMO CM Economics and Canadian Bankers’ Association as at January 4, 2021This slide contains forward looking statements. See caution on slide 2
• Conservative lending practices, strong underwriting and documentation discipline have led to low delinquency rates— Over the last 30 years, Canada’s 90-day residential mortgage delinquency rate has never exceeded 0.7% versus the U.S.
peak rate of 5% in 2010• Mandatory government-backed insurance for high loan to value (LTV >80%) mortgages covering the full balance• Government regulation including progressive tightening of mortgage rules to promote a healthy housing market • Shorter term mortgages (avg. 5 years), renewable and re-priced at maturity, compared to 30 years in the U.S. market• No mortgage interest deductibility for income tax purposes (reduces incentive to take on higher levels of debt)• In Canada mortgages are held on balance sheet; in the U.S. they may be sold or securitized in the U.S. market• Recourse back to the borrower in most provinces• Prepayment penalties borne by the borrower whereas U.S. mortgages may be prepaid without penalty
35.040.045.050.055.060.065.070.075.080.0
1991
1992
1993
1994
1995
1996
1997
1998
1999
2000
2001
2002
2003
2004
2005
2006
2007
2008
2009
2010
2011
2012
2013
2014
2015
2016
2017
2018
2019
2020
Canada United States

Liquidity & WholesaleFunding Mix
Investor Presentation January 2021 41
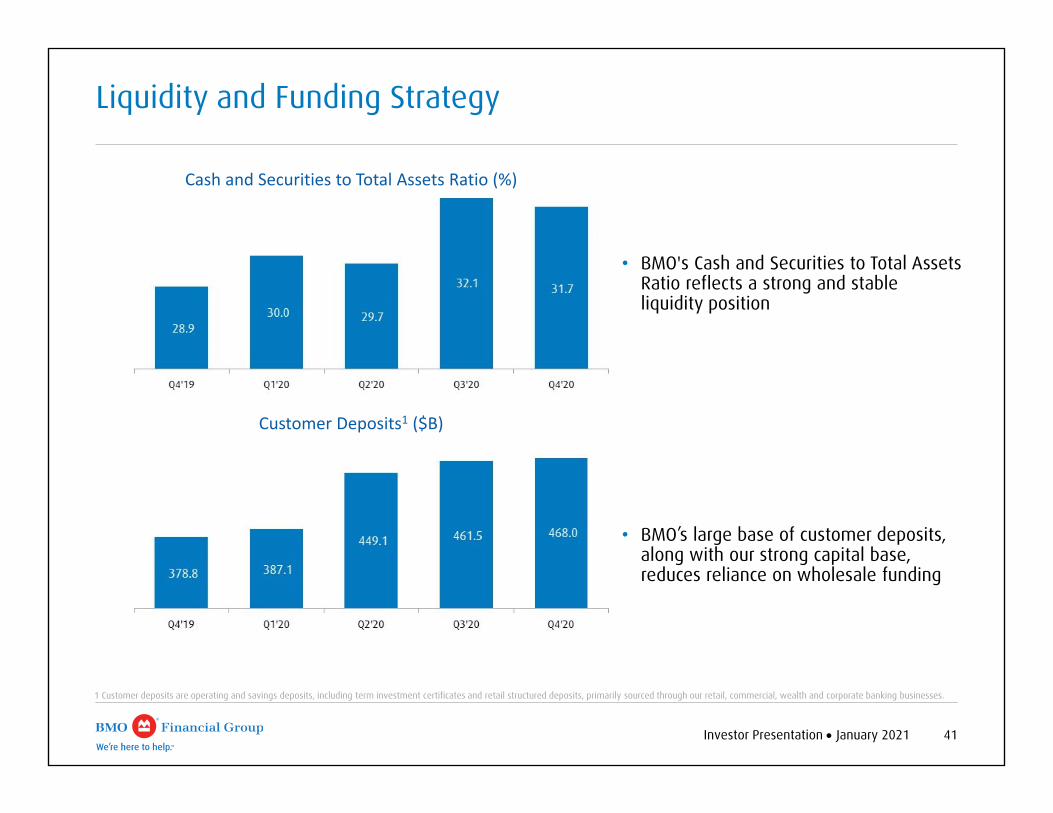
Liquidity and Funding Strategy
1 Customer deposits are operating and savings deposits, including term investment certificates and retail structured deposits, primarily sourced through our retail, commercial, wealth and corporate banking businesses.
• BMO's Cash and Securities to Total Assets Ratio reflects a strong and stable liquidity position
Cash and Securities to Total Assets Ratio (%)
Customer Deposits1 ($B)
• BMO’s large base of customer deposits, along with our strong capital base, reduces reliance on wholesale funding
Investor Presentation January 2021 42
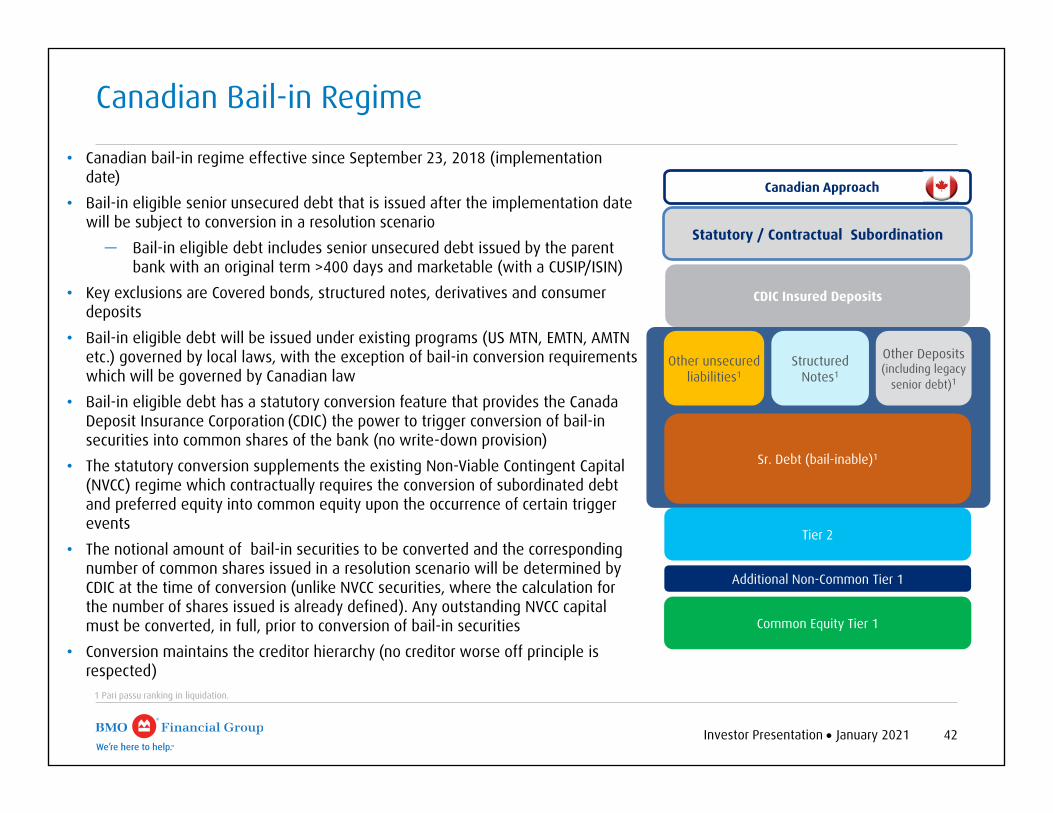
Canadian Bail-in Regime
1 Pari passu ranking in liquidation.
• Canadian bail-in regime effective since September 23, 2018 (implementation date)
• Bail-in eligible senior unsecured debt that is issued after the implementation date will be subject to conversion in a resolution scenario
— Bail-in eligible debt includes senior unsecured debt issued by the parent bank with an original term >400 days and marketable (with a CUSIP/ISIN)
• Key exclusions are Covered bonds, structured notes, derivatives and consumer deposits
• Bail-in eligible debt will be issued under existing programs (US MTN, EMTN, AMTN etc.) governed by local laws, with the exception of bail-in conversion requirements which will be governed by Canadian law
• Bail-in eligible debt has a statutory conversion feature that provides the Canada Deposit Insurance Corporation (CDIC) the power to trigger conversion of bail-in securities into common shares of the bank (no write-down provision)
• The statutory conversion supplements the existing Non-Viable Contingent Capital (NVCC) regime which contractually requires the conversion of subordinated debt and preferred equity into common equity upon the occurrence of certain trigger events
• The notional amount of bail-in securities to be converted and the corresponding number of common shares issued in a resolution scenario will be determined by CDIC at the time of conversion (unlike NVCC securities, where the calculation for the number of shares issued is already defined). Any outstanding NVCC capital must be converted, in full, prior to conversion of bail-in securities
• Conversion maintains the creditor hierarchy (no creditor worse off principle is respected)
Canadian Approach
CDIC Insured Deposits
Other Deposits (including legacy
senior debt)1
Structured Notes1
Tier 2
Additional Non-Common Tier 1
Other unsecured liabilities1
Sr. Debt (bail-inable)1
Statutory / Contractual Subordination
Common Equity Tier 1
Investor Presentation January 2021 43
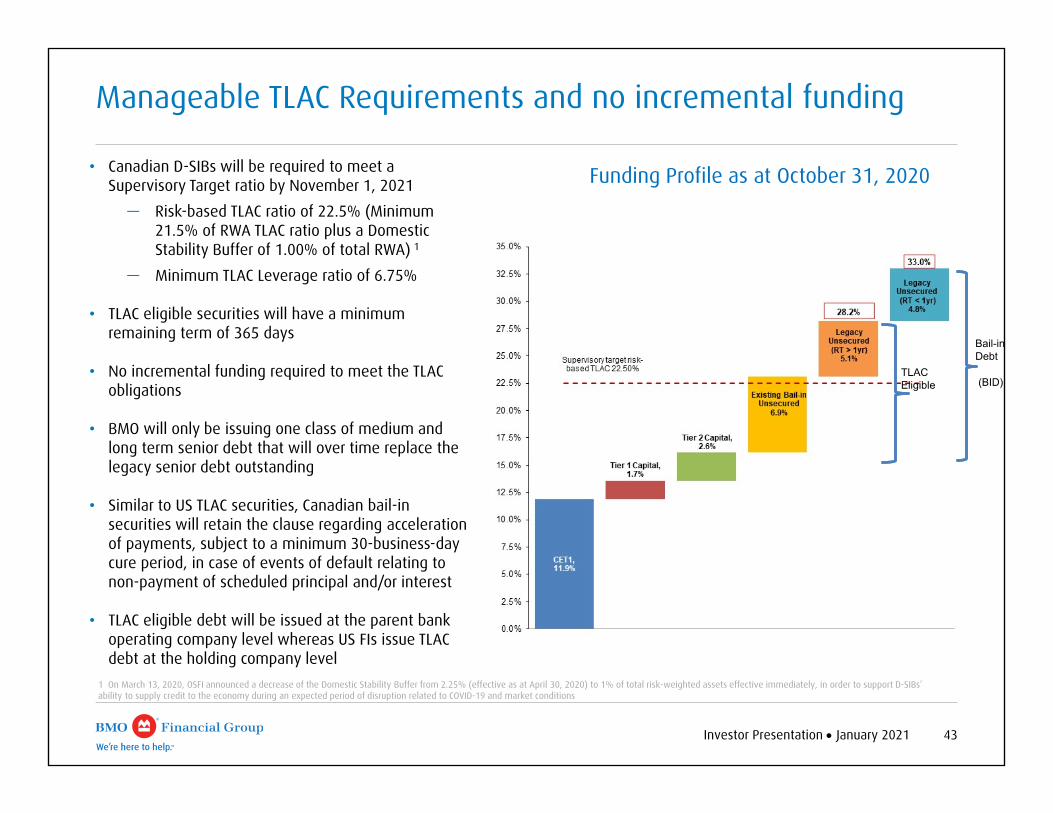
Manageable TLAC Requirements and no incremental funding
• Canadian D-SIBs will be required to meet a Supervisory Target ratio by November 1, 2021
— Risk-based TLAC ratio of 22.5% (Minimum 21.5% of RWA TLAC ratio plus a Domestic Stability Buffer of 1.00% of total RWA) 1
— Minimum TLAC Leverage ratio of 6.75%
• TLAC eligible securities will have a minimum remaining term of 365 days
• No incremental funding required to meet the TLAC obligations
• BMO will only be issuing one class of medium and long term senior debt that will over time replace the legacy senior debt outstanding
• Similar to US TLAC securities, Canadian bail-in securities will retain the clause regarding acceleration of payments, subject to a minimum 30-business-day cure period, in case of events of default relating to non-payment of scheduled principal and/or interest
• TLAC eligible debt will be issued at the parent bank operating company level whereas US FIs issue TLAC debt at the holding company level
Funding Profile as at October 31, 2020
Bail-in Debt
(BID)
1 On March 13, 2020, OSFI announced a decrease of the Domestic Stability Buffer from 2.25% (effective as at April 30, 2020) to 1% of total risk-weighted assets effective immediately, in order to support D-SIBs’ ability to supply credit to the economy during an expected period of disruption related to COVID-19 and market conditions
TLAC Eligible
Investor Presentation January 2021 44
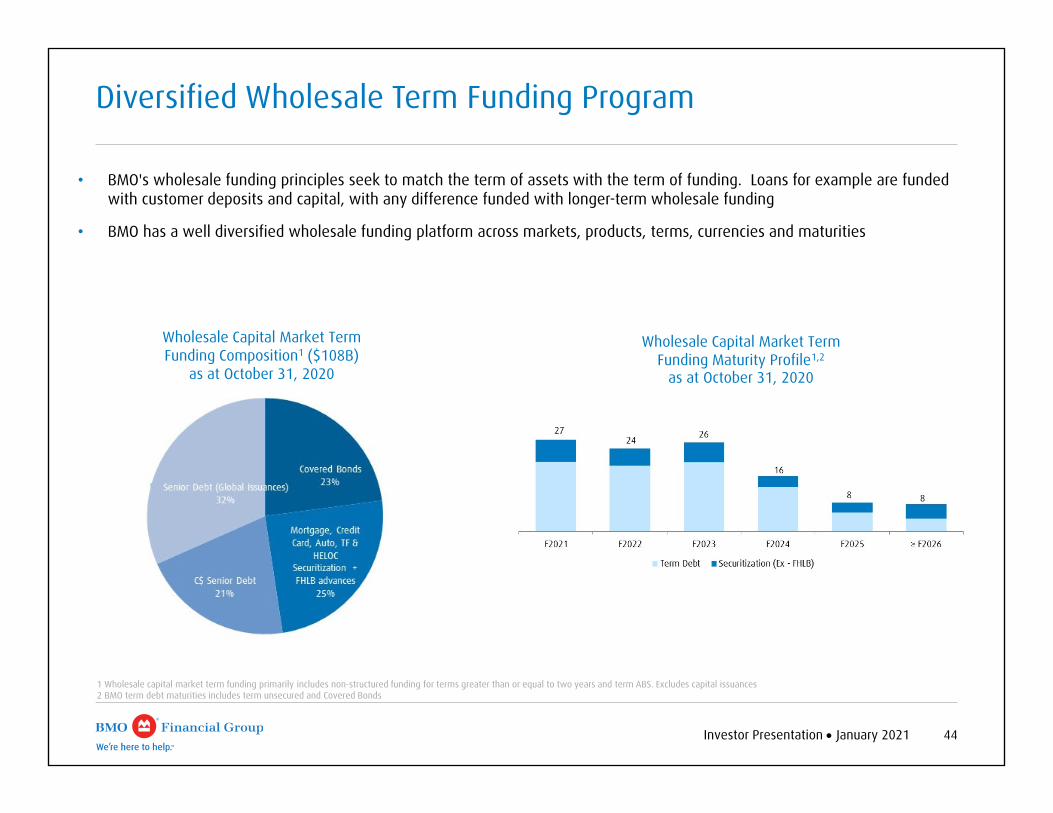
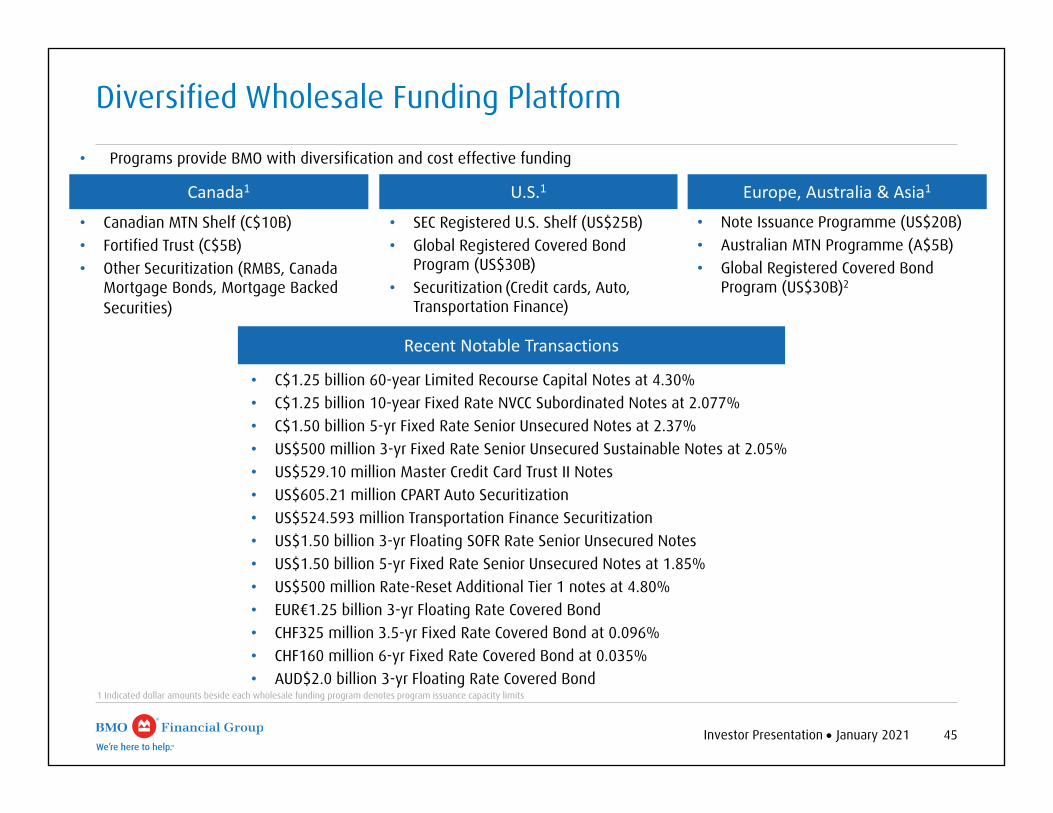
Diversified Wholesale Term Funding Program
1 Wholesale capital market term funding primarily includes non-structured funding for terms greater than or equal to two years and term ABS. Excludes capital issuances2 BMO term debt maturities includes term unsecured and Covered Bonds
• BMO's wholesale funding principles seek to match the term of assets with the term of funding. Loans for example are funded with customer deposits and capital, with any difference funded with longer-term wholesale funding
• BMO has a well diversified wholesale funding platform across markets, products, terms, currencies and maturities
Wholesale Capital Market Term Funding Composition1 ($108B)
as at October 31, 2020
Wholesale Capital Market Term Funding Maturity Profile1,2
as at October 31, 2020
Investor Presentation January 2021 45
Canada1 U.S.1 Europe, Australia & Asia1
• Canadian MTN Shelf (C$10B)• Fortified Trust (C$5B)• Other Securitization (RMBS, Canada
Mortgage Bonds, Mortgage Backed Securities)
• SEC Registered U.S. Shelf (US$25B)• Global Registered Covered Bond
Program (US$30B)• Securitization (Credit cards, Auto,
Transportation Finance)
• Note Issuance Programme (US$20B)• Australian MTN Programme (A$5B)• Global Registered Covered Bond
Program (US$30B)2
Recent Notable Transactions
• C$1.25 billion 60-year Limited Recourse Capital Notes at 4.30%• C$1.25 billion 10-year Fixed Rate NVCC Subordinated Notes at 2.077%• C$1.50 billion 5-yr Fixed Rate Senior Unsecured Notes at 2.37%• US$500 million 3-yr Fixed Rate Senior Unsecured Sustainable Notes at 2.05%• US$529.10 million Master Credit Card Trust II Notes• US$605.21 million CPART Auto Securitization• US$524.593 million Transportation Finance Securitization• US$1.50 billion 3-yr Floating SOFR Rate Senior Unsecured Notes• US$1.50 billion 5-yr Fixed Rate Senior Unsecured Notes at 1.85%• US$500 million Rate-Reset Additional Tier 1 notes at 4.80%• EUR€1.25 billion 3-yr Floating Rate Covered Bond• CHF325 million 3.5-yr Fixed Rate Covered Bond at 0.096%• CHF160 million 6-yr Fixed Rate Covered Bond at 0.035%• AUD$2.0 billion 3-yr Floating Rate Covered Bond
Diversified Wholesale Funding Platform
1 Indicated dollar amounts beside each wholesale funding program denotes program issuance capacity limits
• Programs provide BMO with diversification and cost effective funding
Investor Presentation January 2021 46
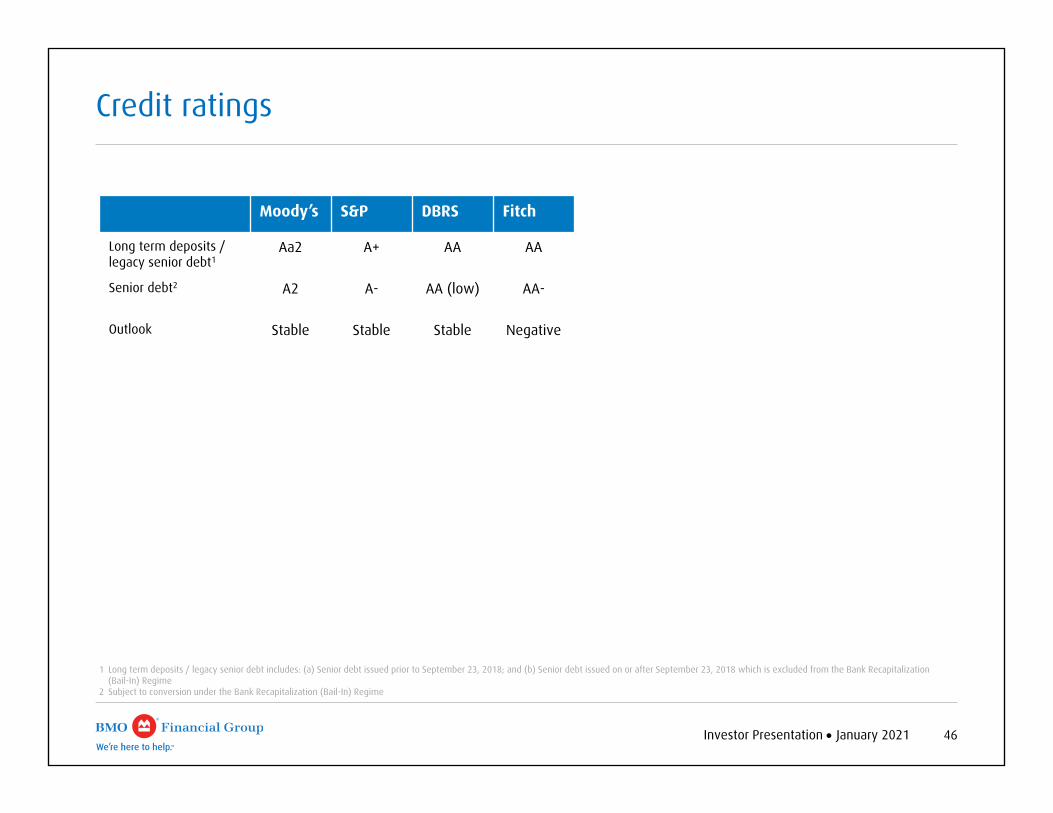
Credit ratings
Moody’s S&P DBRS Fitch
Long term deposits / legacy senior debt1
Aa2 A+ AA AA
Senior debt2 A2 A- AA (low) AA-
Outlook Stable Stable Stable Negative
1 Long term deposits / legacy senior debt includes: (a) Senior debt issued prior to September 23, 2018; and (b) Senior debt issued on or after September 23, 2018 which is excluded from the Bank Recapitalization (Bail-In) Regime
2 Subject to conversion under the Bank Recapitalization (Bail-In) Regime

http://www.bmo.com/investorrelationsE-mail: [email protected]
BILL ANDERSONDirector, Investor [email protected]
Investor Relations Contact Information
SUKHWINDER (SUKHI) SINGHDirector, Investor [email protected]
CHRISTINE VIAUHead, Investor [email protected]