Q4 Report 2017 - assaabloy.com digital security solutions for elderly care Development of homecare...
34
ASSA ABLOY is the global leader in door opening solutions, dedicated to satisfying end-user needs for security, safety and convenience Q4 Report 2017
Transcript of Q4 Report 2017 - assaabloy.com digital security solutions for elderly care Development of homecare...

ASSA ABLOY is the global leader in door opening solutions, dedicated to satisfying end-user needs for security, safety and convenience
Q4 Report 2017

Q4 2017 in brief
Organic growth in all divisions• Strong growth in Global Tech and EMEA
• Continued good growth in Americas, Entrance Systems, and APAC, with flat sales in China
• Continued strong development for smart door locks and electro-mechanical solutions
Strong profit and cash flow
New CEO Nico Delvaux appointed
2

Q4 2017 figures in summary
Sales SEK 20,109 M +3%
• 5% organic
• 3% acquired
• -5% currency
EBIT SEK 3,359 M +5%*
• Amortization of acquisition-related intangible assets SEK 87 M (51)
• Currency effect SEK -130 M
Operating margin 16.7% (16.5*)• EBITA-margin 17.1% (16.8*)
EPS SEK 2.15 +14%**
3 213
3 359
2 250
2 500
2 750
3 000
3 250
3 500
16 000
17 000
18 000
19 000
20 000
21 000
Q4 16* Q4 17
Sales, SEK M EBIT, SEK M
Sales EBITSales +3%
3
* Excluding China write down SEK 300 M and restructuring items in Q4 2016. ** Excluding restructuring items.

Jan. – Dec. 2017 figures in summary
Sales SEK 76,137 M +7%
• 4% organic
• 2% acquired
• 1% currency
EBIT SEK 12,341 M +7%*
• Amortization of acquisition-related intangible assets SEK 240M (200)
• Currency effect SEK 37 M
Operating margin 16.2% (16.2*)
• EBITA-margin 16.5% (16.5*)
EPS SEK 7.77 +10%**
11 554
12 341
6 000
7 000
8 000
9 000
10 000
11 000
12 000
13 000
14 000
40 000
45 000
50 000
55 000
60 000
65 000
70 000
75 000
80 000
Jan-Dec 2016 Jan-Dec 2017
Sales, SEK M EBIT, SEK M
Sales EBIT
4
Sales +7%
* Excluding China write down SEK 300 M and restructuring items in Q4 2016. ** Excluding restructuring items.

Sales by RegionFull year 2017
5
Emerging markets comprise Africa, Asia (excl. Japan), the Middle East, Latin America and Eastern Europe.
40 +8 +5
3 +4 +2
38 +7 +4
1 +16 +4
14 +1 +1
4 +4 +7
ASSA ABLOY 100 +6 +4Emerging markets 23 +5 +3
Share of sales, % Change in local currencies YTD 2017 vs. YTD 2016, %
Organic change YTD 2017 vs. YTD 2016, %

Market highlights
Strong e-cylinder demand• New platform driver: Cliq Web Manager, Cliq-go, Medeco XT
• Bluetooth keys
• Additional sales from new pulse platform in Q1 2018
Strengthened position in smart door locks• Continued strong organic growth
• Launch of Amazon key partnership with Yale
• Gearing up for Yale Lock for nest - in store March 2018
• Acquisition of August Home
Major HID win for eCovers in South America• New country win and leading regional reference
• eCover with Shielding material - New HID Technology
• Deliveries during 2018 with expected additional opportunities
6

Sales growth, currency adjusted
45 000
50 000
55 000
60 000
65 000
70 000
75 000
80 000
-10
-5
0
5
10
15
20
25
2012 2013 2014 2015 2016 2017Organic growth, % Acquired growth, % Sales in fixed currencies, SEK M
7
SEK M%
2017 QTDOrganic +5%Acquired +3%
+8%

Operating margin, %
13
14
15
16
17
18
13
14
15
16
17
18
2012 2013 2014 2015 2016 2017
Quarter Rolling 12-months
8
Long term target range (average)
Margin Bridge 2017 OG Currency ACQQ4 0.3% -0.1% 0.0%
YTD 0.2% -0.1% -0.1%
Run rate: EBIT-margin 16.2%* (16.2)%
* Excluding China write down SEK 300 M and restructuring items in Q4 2016.

Operating profit, SEK M
0
2 000
4 000
6 000
8 000
10 000
12 000
14 000
16 000
0
500
1 000
1 500
2 000
2 500
3 000
3 500
4 000
2012 2013 2014 2015 2016 2017
Quarter Rolling 12-months
9
SEK M SEK MRun rate: EBIT SEK 12,341 M (11,554*) +7%
+65%in
5 years
* Excluding China write down SEK 300 M and restructuring items in Q4 2016.

Manufacturing footprint
Status of programs launched 2006-2016• 77 factories closed to date, 11 to go
• 126 factories converted to assembly, 28 to go
Total personnel reduction• 13,564 FTE in total since 2006
• 723 FTE in recent quarter
• 1,353 FTE to go for all programs
SEK 944 M provisions remain for all programs
10

Acquisitions Fully active pipeline
19 acquisitions done
Acquired annualized sales SEK 3,200 M
Added sales 4%
Divestment of AdvanIDe SEK 1,250 M
11

Phoniro, Sweden
Turnover of SEK 175 M with 80 employees
Leading provider of physical & digital security solutions for elderly care
Development of homecare vertical
Accretive to EPS
12

Dale & Excel Hardware, UK
Turnover of SEK 210 M with 75 employees
Market leading supplier of high quality architectural hardware
Complements and extends current hardware portfolio
Accretive to EPS
13
Furniture
Hinges
Pocket Door Systems
Installation tools

EMEA
Organic growth of 5%• Strong growth in Finland, UK,
France, Southern and Eastern Europe, and in Africa/Middle East
• Good growth in Germany
• Growth in Scandinavia and Benelux
• Strong growth for electromechanical products and smart door locks
Operating margin 17.3% (16.8)• Organic growth leverage +0.4%
+ Footprint savings and efficiency- Investments in sales
• Curr. 0.1% and Acq. 0.0%
10%
12%
14%
16%
18%
20%
22%
2 000
2 500
3 000
3 500
4 000
4 500
5 000
Q415
Q116
Q216
Q316
Q416
Q117
Q217
Q317
Q417
Sales, SEK M Operating margin, %
14
24% of Group sales
Excluding restructuring items.

EMEA Financial Review
SEK M Q4 2016 Organic Currency Acq/Div Q4 2017
Growth 5% 0% 2% 7%
Sales 4,577 237 -20 95 4,869
Operating income* 766 60 -2 18 842
Operating margin, %* 16.8% 25.4% 9.8% 18.8% 17.3%
Dilution/accretion 0.4% 0.1% 0.0%
12 months figures*
Sales 16,837 18,081
EBIT 2,722 2,990
Operating cash flow before paid interest 2,577 2,977
Cash flow/EBIT 95% 99%
15
* Excluding restructuring items for 2016.

Americas
Organic growth of 4%• Strong growth in
Electromechanical, High Security, US Residential, Canada, Mexico and South America (excl. Brazil)
• Growth in Architectural Hardware, Perimeter Protection, Security Doors and in Brazil
Operating margin 19.9% (20.8)• Organic growth leverage +0.4%
+ Leverage- Material cost
• Curr. 0.0% Acq. -1.3%
14%
16%
18%
20%
22%
24%
2 500
3 000
3 500
4 000
4 500
5 000
Q415
Q116
Q216
Q316
Q416
Q117
Q217
Q317
Q417
Sales, SEK M Operating margin, %
16
21% of Group sales
Excluding restructuring items.

Americas Financial Review
SEK M Q4 2016 Organic Currency Acq/Div Q4 2017
Growth 4% -8% 1% -3%
Sales 4,362 153 -329 57 4,243
Operating profit* 908 45 -65 -41 847
Operating margin, %* 20.8% 29.6% 19.9% -72.4% 19.9%
Dilution/accretion 0.4% 0.0% -1.3%
12 months figures*
Sales 17,044 17,940
EBIT 3,640 3,815
Operating cash flow before paid interest 3,447 3,491
Cash flow/EBIT 95% 92%
17
* Excluding restructuring items for 2016.

Asia Pacific
Organic growth of 3%
• Strong growth in South Korea, South Asia, Pacific, and China Architectural Hardware
• Negative in China Fire and Security Doors
• Personnel adjustment in China YoY -8%
• Strong growth in Smart Door Locks
Operating margin 9.7% (10.4*)
• Organic growth leverage -0.8%- China, incl. higher steel costs
+ Savings
• Curr. -0.2% Acq. 0.3%
0%
5%
10%
15%
0
500
1 000
1 500
2 000
2 500
3 000
3 500
Q415
Q116
Q216
Q316
*Q416
Q117
Q217
Q317
Q417
Sales, SEK M Operating margin, %
18
11% of Group sales
*Excluding write down in China in Q4 2016 and restructuring items.
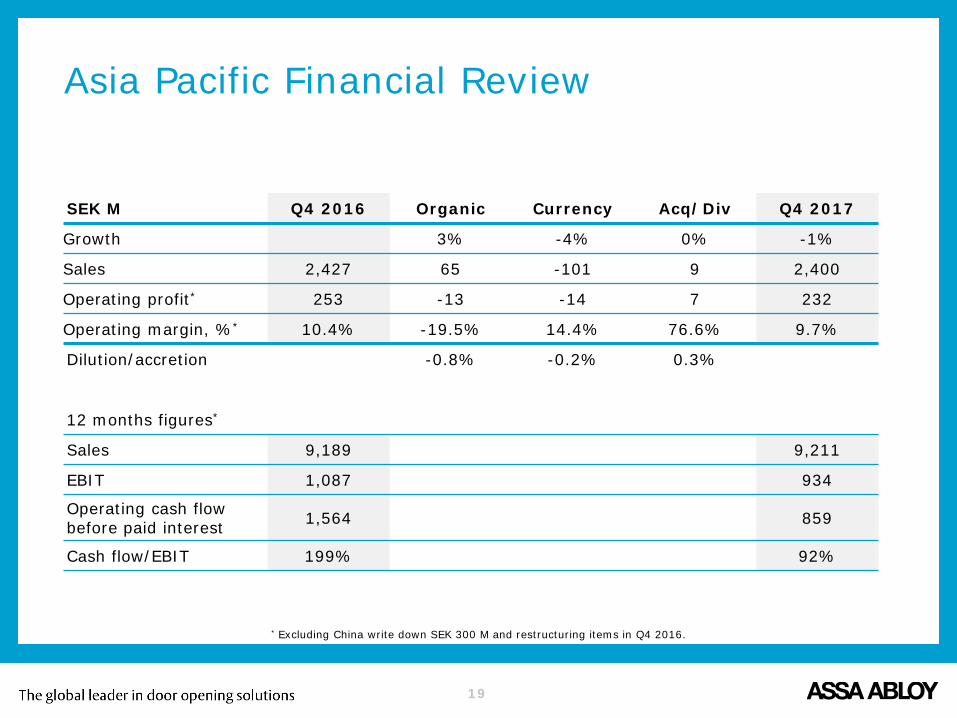
Asia Pacific Financial Review
SEK M Q4 2016 Organic Currency Acq/Div Q4 2017
Growth 3% -4% 0% -1%
Sales 2,427 65 -101 9 2,400
Operating profit* 253 -13 -14 7 232
Operating margin, %* 10.4% -19.5% 14.4% 76.6% 9.7%
Dilution/accretion -0.8% -0.2% 0.3%
12 months figures*
Sales 9,189 9,211
EBIT 1,087 934
Operating cash flow before paid interest 1,564 859
Cash flow/EBIT 199% 92%
19
* Excluding China write down SEK 300 M and restructuring items in Q4 2016.
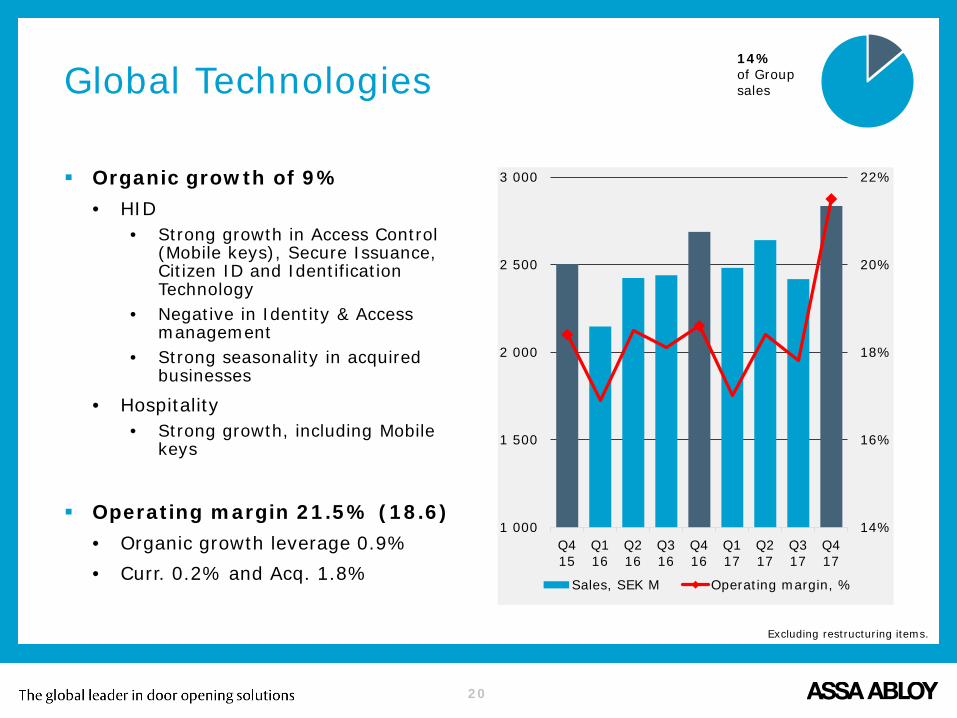
Global Technologies
Organic growth of 9%• HID
• Strong growth in Access Control (Mobile keys), Secure Issuance, Citizen ID and Identification Technology
• Negative in Identity & Access management
• Strong seasonality in acquired businesses
• Hospitality• Strong growth, including Mobile
keys
Operating margin 21.5% (18.6)• Organic growth leverage 0.9%• Curr. 0.2% and Acq. 1.8%
14%
16%
18%
20%
22%
1 000
1 500
2 000
2 500
3 000
Q415
Q116
Q216
Q316
Q416
Q117
Q217
Q317
Q417
Sales, SEK M Operating margin, %
20
14% of Group sales
Excluding restructuring items.

Global Technologies Financial Review
SEK M Q4 2016 Organic Currency Acq/Div Q4 2017
Growth 9% -6% 2% 5%
Sales 2,687 239 -140 48 2,835
Operating profit* 500 74 -25 59 608
Operating margin, %* 18.6% 30.8% 17.9% 123.8% 21.5%
Dilution/accretion 0.9% 0.2% 1.8%
12 months figures*
Sales 9,697 10,373
EBIT 1,752 1,946
Operating cash flow before paid interest 1,724 1,732
Cash flow/EBIT 98% 89%
21
* Excluding restructuring items for 2016.

Entrance Systems
Organic growth of 3%
• Strong growth in Pedestrian Doors, Door components, Industrial and High speed doors.
• Good growth in Residential doors
• Negative sales in warehouse and logistics solutions
Operating margin 15.9% (15.4)
• Organic growth leverage +0.6%+ Good leverage from consolidation
• Curr. 0.1% and Acq. -0.2% 10%
11%
12%
13%
14%
15%
16%
17%
18%
2 000
2 500
3 000
3 500
4 000
4 500
5 000
5 500
6 000
6 500
Q415
Q116
Q216
Q316
Q416
Q117
Q217
Q317
Q417
Sales, SEK M Operating margin, %
22
30% of Group sales
Excluding restructuring items.

Entrance Systems Financial Review
SEK M Q4 2016 Organic Currency Acq/Div Q4 2017
Growth 3% -3% 5% 5%
Sales 5,772 182 -153 271 6,072
Operating profit* 888 65 -21 34 966
Operating margin, %* 15.4% 35.8% 13.9% 12.7% 15.9%
Dilution/accretion 0.6% 0.1% -0.2%
12 months figures*
Sales 19,789 21,781
EBIT 2,753 3,087
Operating cash flow before paid interest 2,713 3,065
Cash flow/EBIT 99% 99%
23
* Excluding restructuring items for 2016.

ASSA ABLOY is the global leader in door opening solutions, dedicated to satisfying end-user needs for security, safety and convenience
Q4 Report 2017Carolina Dybeck HappeCFO
ASSA ABLOY is the global leader in door opening solutions, dedicated to satisfying end-user needs for security, safety and convenience

Financial highlights
25
October - December January - December
SEK M 2016 2017 Change 2016 2017 Change
Sales 19,484 20,109 3% 71,293 76,137 7%
- Organic growth 120 878 5% 1,428 2,834 4%
- Acquired growth 455 480 3% 1,967 1,753 2%
- FX-differences 609 -733 -5% -201 257 1%
Operating income (EBIT)* 3,213 3,359 5% 11,554 12,341 7%
EBITA-margin* 16.8% 17.1% 16.5% 16.5%
EBIT-margin* 16.5% 16.7% 16.2% 16.2%
Income before tax** 2,767 3,226 17% 10,549 11,673 11%
Net income** 2,088 2,385 14% 7,874 8,635 10%
EPS, SEK** 1.88 2.15 14% 7.09 7.77 10%
Operating cash flow 4,620 4,876 6% 10,467 10,929 4%* Excluding China write down SEK 300 M and restructuring items in Q4 2016. ** Excluding restructuring items.

Bridge Analysis – Q4 2017
Price +2% and volume +3%
Positive leverage from all divisions, except APAC
Accretion from acquisitions/divestments in Global Technologies
Dilution from acquisitions in Americas and Entrance Systems
26
SEK M Q4 2016 Organic Currency Acq/Div Q4 2017
5% -5% 3% 3%
Sales 19,484 878 -733 480 20,109
Operating profit* 3,213 199 -130 77 3,359
Operating margin, %* 16.5% 22.6% 17.7% 16.0% 16.7%
Dilution/accretion 0.3% -0.1% 0.0%
* Excluding write down in China and restructuring items in Q4 2016.

P&L components as % of salesJanuary - December 2017
Higher material cost and lower conversion cost
Organic growth leverage• S, G & A down 0.3% vs. previous year, despite investments in R&D and sales
27
% YTD 2016YTD 2017
excl. acquisitions Δ YTD 2017
Direct material -35.9% -36.5% -0.6% -36.3%
Conversion cost -24.6% -24.2% +0.4% -24.3%
Gross margin 39.5% 39.3% -0.2% 39.4%
S, G & A -23.3% -23.0% +0.3% -23.2%
EBIT* 16.2% 16.3% +0.1% 16.2%
* Excluding China write down SEK 300 M and restructuring items in Q4 2016.

Operating cash flow, SEK M
0
2 000
4 000
6 000
8 000
10 000
12 000
14 000
16 000
18 000
20 000
0
1 000
2 000
3 000
4 000
5 000
6 000
2012 2013 2014 2015 2016 2017
Quarter, SEK M Cash rolling 12 months, SEK M EBT rolling 12 months, SEK M
28
Quarter 12 months12 months cash flow / EBT = 94%

Gearing % and net debt, SEK M
0
15
30
45
60
75
90
0
5 000
10 000
15 000
20 000
25 000
30 000
2012 2013 2014 2015 2016 2017
Net debt, SEK M Gearing, %
29
Net debt GearingDebt/Equity 50% (49)
Net debt/EBITDA1.8 (1.8)

2.00
3.00
4.00
5.00
6.00
7.00
8.00
9.00
0.50
0.75
1.00
1.25
1.50
1.75
2.00
2.25
2012 2013 2014 2015 2016 2017
Quarter, SEK Rolling 12 months, SEK
Quarter
Earnings per share, SEK
30
12 monthsYTD EPS +10%*
Dividend proposal 2017: 3.30 SEK, +10%
* Excluding restructuring items in Q4 2016. Chart is restated for Stock split 3:1 2015 and excludes cost for restructuring programs in 2013 and 2016.
+67%in
5 years

ASSA ABLOY is the global leader in door opening solutions, dedicated to satisfying end-user needs for security, safety and convenience
Q4 Report 2017Johan MolinPresident and CEO

Conclusions Q4 2017
Sales +8%, excluding currency• Strong growth in Global Tech and
EMEA
• Continued good growth in Americas, Entrance Systems, and APAC, with flat sales in China
• Strong development for smart door locks and electro-mechanical solutions
Strong profit and cash flow
32
* Excluding write down in China and restructuring items in Q4 2016.

www.assaabloy.com
Q&A

www.assaabloy.com


![East of England Homecare Patient Satisfaction ... Homecare... · East of England Homecare Patient Satisfaction Questionnaire – Overview [Public domain] Local Trust Data Analysis](https://static.fdocuments.us/doc/165x107/5f10156a7e708231d4475d88/east-of-england-homecare-patient-satisfaction-homecare-east-of-england.jpg)