Q4 & FY 2017 Resultsiclgroupv2.s3.amazonaws.com/corporate/wp-content/... · Reduction in tax rates...
25
Asher Grinbaum | Acting CEO February 14 th , 2017 Q4 & FY 2017 Results
Transcript of Q4 & FY 2017 Resultsiclgroupv2.s3.amazonaws.com/corporate/wp-content/... · Reduction in tax rates...

Asher Grinbaum | Acting CEO
February 14th, 2017
Q4 & FY 2017 Results
Important Legal Notes
Disclaimer and Safe Harbor for Forward-Looking Statements
The information contained herein in this presentation or delivered or to be delivered to you during our presentation does not constitute an offer, expressed or implied, or arecommendation to do any transaction in Israel Chemicals Ltd. (“ICL” or “Company”) securities or in any securities of its affiliates or subsidiaries.
This presentation and/or other oral or written statements made by ICL during its presentation or from time to time, may contain forward-looking statements within themeaning of the United States Private Securities Litigation Reform Act of 1995 and other applicable securities laws. Whenever words such as "believe," "expect," "anticipate,""intend," "plan," "estimate", “predict” or similar expressions are used, the Company is making forward-looking statements. Such forward-looking statements may include, butare not limited to, those that discuss strategies, goals, financial outlooks, corporate initiatives, existing or new products, existing or new markets, operating efficiencies, orother non-historical matters.
Because such statements deal with future events and are based on ICL’s current expectations, they could be impacted or be subject to various risks and uncertainties,including those discussed in the "Risk Factors" section and elsewhere in our Annual Report on Form 20-F for the year ended December 31, 2016, and in subsequent filingswith the Tel Aviv Securities Exchange (TASE) and/or the U.S. Securities and Exchange Commission (SEC). Therefore actual results, performance or achievements of theCompany could differ materially from those described in or implied by such forward-looking statements. Although the Company believes that the expectations reflected insuch forward-looking statements are based on reasonable assumptions, it can provide no assurance that expectations will be achieved. Except as otherwise required by law,ICL disclaims any intention or obligation to update or revise any forward-looking statements, which speak only as of the date hereof, whether as a result of new information,future events or circumstances or otherwise. Readers, listeners and viewers are cautioned to consider these risks and uncertainties and to not place undue reliance on suchinformation.
Certain market and/or industry data used in this presentation were obtained from internal estimates and studies, where appropriate, as well as from market research andpublicly available information. Such information may include data obtained from sources believed to be reliable, however ICL disclaims the accuracy and completeness ofsuch information which is not guaranteed. Internal estimates and studies, which we believe to be reliable, have not been independently verified. We cannot assure that suchdata is accurate or complete.
Included in this presentation are certain non-GAAP financial measures, such as Adjusted Operating income and Adjusted Net income, designed to complement the financialinformation presented in accordance with IFRS because management believes such measures are useful to investors. These non-GAAP financial measures should beconsidered only as supplemental to, and not superior to, financial measures provided in accordance with IFRS. Please refer to our Q4 2017 press release for the quarterended December 31, 2017 for a reconciliation of the non-GAAP financial measures included in this presentation to the most directly comparable financial measures preparedin accordance with IFRS.
2

See Q4 2017 press release for a reconciliation of Adjusted operating income to operating income, adjusted net income and adjusted EBITDS to net income
Q4 and Full Year 2017 Results Summary
▪ Strong Q4 and full year performance:
✓ Growth of 20% in adjusted operating income (~160% in Q4 2017 reported operating income) supported by the recovery in the potash market and G&A reduction
✓ FY 2017: stable sales, operating margins expansion and higher free cash flow generation, despite continuous challenging commodity business environment
▪ Execution of prudent capital allocation and successful divestments, contributed to solid financial position
* Operating income attributed to segments before G&A and other expenses**See appendix for reconciliation of Free cash flow
$ millions Q4 17 Q4 16 % change FY2017 FY2016 % change
Sales 1,361 1,338 1.7% 5,418 5,363 1.0%
Operating income (loss) 189 72 162.5% 629 (3) NA
Adjusted operating income* 168 140 20.0% 652 582 12.0%
Adjusted EBITDA 276 264 4.5% 1,059 1,051 0.8%
Net income (loss) 155 32 384.4% 364 (122) 398.4%
Adjusted net income 142 114 24.6% 389 451 (13.7) %
Free cash flow** 137 127 7.9% 405 346 17.1%
Net Debt 3,037 3,264 (7.0)% 3,037 3,264 (7.0)%
Average potash selling price - FOB 222 202 9.9% 219 211 3.8%
3
Business Performance & Major Developments
Essential MineralsSpecialty Solutions
* Including inter-segment sales
** Excluding G&A, unallocated expenses
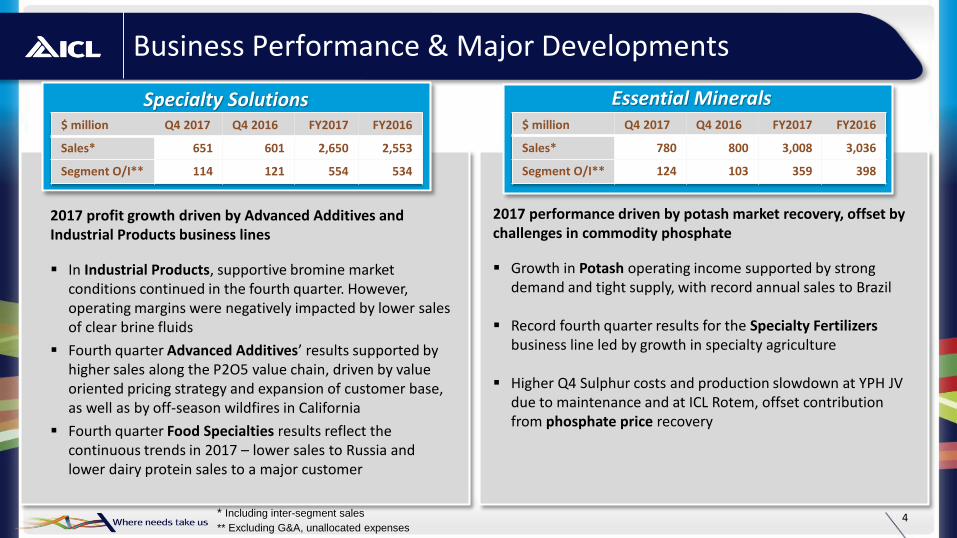
2017 profit growth driven by Advanced Additives and Industrial Products business lines
▪ In Industrial Products, supportive bromine market conditions continued in the fourth quarter. However, operating margins were negatively impacted by lower sales of clear brine fluids
▪ Fourth quarter Advanced Additives’ results supported by higher sales along the P2O5 value chain, driven by value oriented pricing strategy and expansion of customer base, as well as by off-season wildfires in California
▪ Fourth quarter Food Specialties results reflect the continuous trends in 2017 – lower sales to Russia and lower dairy protein sales to a major customer
$ million Q4 2017 Q4 2016 FY2017 FY2016
Sales* 651 601 2,650 2,553
Segment O/I** 114 121 554 534
$ million Q4 2017 Q4 2016 FY2017 FY2016
Sales* 780 800 3,008 3,036
Segment O/I** 124 103 359 398
2017 performance driven by potash market recovery, offset by challenges in commodity phosphate
▪ Growth in Potash operating income supported by strong demand and tight supply, with record annual sales to Brazil
▪ Record fourth quarter results for the Specialty Fertilizers business line led by growth in specialty agriculture
▪ Higher Q4 Sulphur costs and production slowdown at YPH JV due to maintenance and at ICL Rotem, offset contribution from phosphate price recovery
4
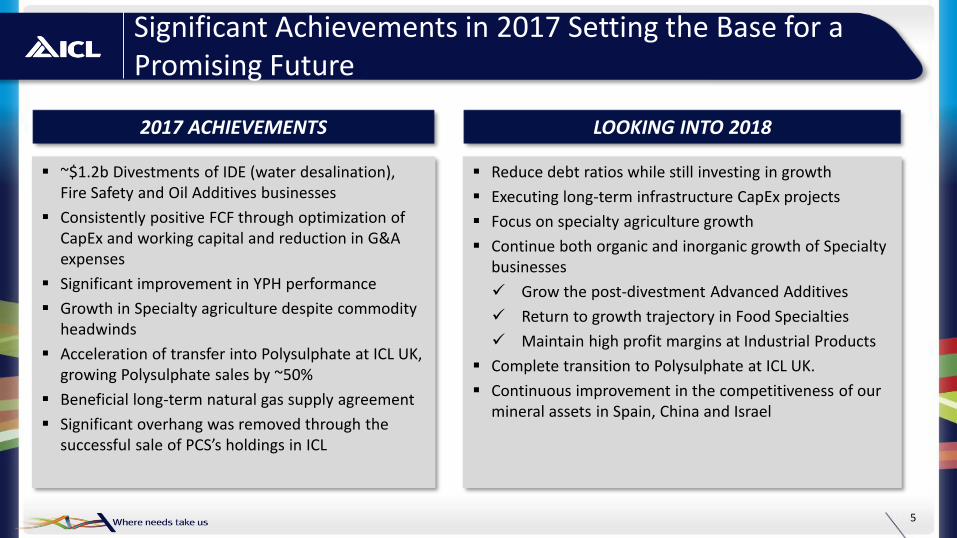
Significant Achievements in 2017 Setting the Base for a Promising Future
▪ Reduce debt ratios while still investing in growth
▪ Executing long-term infrastructure CapEx projects
▪ Focus on specialty agriculture growth
▪ Continue both organic and inorganic growth of Specialty businesses
✓ Grow the post-divestment Advanced Additives
✓ Return to growth trajectory in Food Specialties
✓ Maintain high profit margins at Industrial Products
▪ Complete transition to Polysulphate at ICL UK.
▪ Continuous improvement in the competitiveness of our mineral assets in Spain, China and Israel
▪ ~$1.2b Divestments of IDE (water desalination), Fire Safety and Oil Additives businesses
▪ Consistently positive FCF through optimization of CapEx and working capital and reduction in G&A expenses
▪ Significant improvement in YPH performance
▪ Growth in Specialty agriculture despite commodity headwinds
▪ Acceleration of transfer into Polysulphate at ICL UK, growing Polysulphate sales by ~50%
▪ Beneficial long-term natural gas supply agreement
▪ Significant overhang was removed through the successful sale of PCS’s holdings in ICL
2017 ACHIEVEMENTS LOOKING INTO 2018
5

Grow
Specialty Businesses
Our Strategic Direction
6
Improve Competitiveness of
Mineral Assets
Enhanced Focus on
Specialty Crop Nutrition

Financial Results Kobi AltmanCFO

140 168
533 2 6 7 17
$ millions Q4 17 Q4 16 % change 2017FY 2016FY % change
Sales 1,361 1,338 1.7% 5,418 5,363 1.0%
Operating income (loss) 189 72 162.5% 629 (3) NA
Adjusted operating income 168 140 20.0% 652 582 12.0%
Net income (loss) 155 32 384.4% 364 (122) 398.4%
Adjusted net income 142 114 24.6% 389 451 (13.7)%
Free cash flow 137 127 7.9% 405 346 17.1%
Main Financial Figures and Analysis
Q4 2017 Sales ($M) Q4 2017 Adjusted operating income ($M)
See Q4 2017 press release for a reconciliation of Adjusted operating income to operating income and adjusted net income to net income * See appendix for reconciliation of free cash flow
Numbers may not add due to rounding and set offs
1,338 1,361
5334 64
8
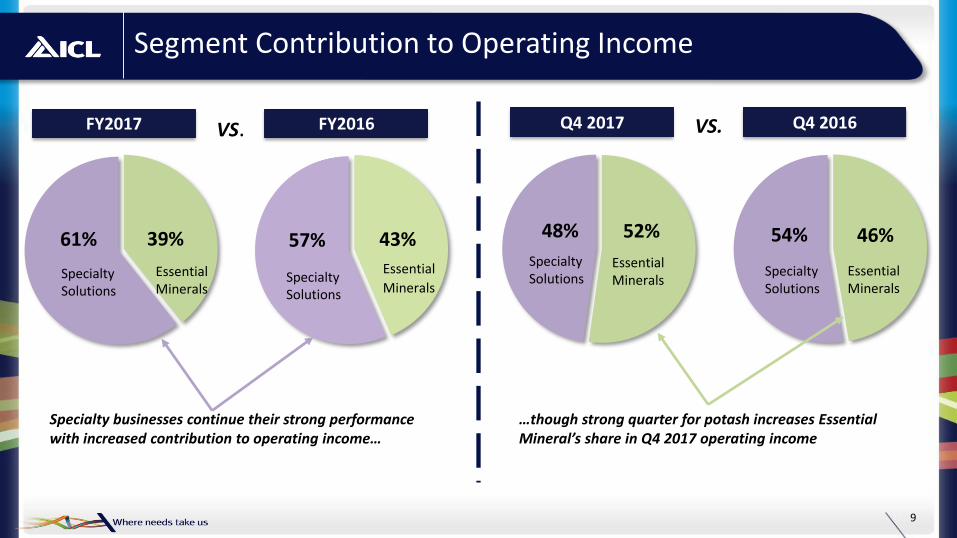
Segment Contribution to Operating Income
52%48% 46%54%39%61% 43%57%
Essential Minerals
Essential Minerals
Essential Minerals
Essential
Minerals
Specialty Solutions
Specialty Solutions
SpecialtySolutions
SpecialtySolutions
Q4 2017 Q4 2016VS.FY2017 FY2016VS.
Specialty businesses continue their strong performance with increased contribution to operating income…
…though strong quarter for potash increases Essential Mineral’s share in Q4 2017 operating income
9

Effective Tax Rate
$ million 2017 2016
Adjusted income before tax 528 506
Income tax rate (including resource tax) 26% 24%
136 121
Carryforward losses not recorded for tax purposes 25 26
161 146
30% 29%
Other items:
Exchange rate impact (mainly ILS vs USD) 18 1
Reduction in tax rates (mainly US 2017, Israel 2016) (13) (32)
Other (mainly deferred tax adjustments) (10) (16)
Adjusted income tax 156 100
Actual Effective tax rate 30% 20%
Reported Effective tax rate 31% N/A
See Q4 2017 press release for a reconciliation of Adjusted operating income to operating income10

Specialty Solutions Bridge Analysis
Sales ($M) Segment operating income ($M)
Numbers may not add due to rounding and set offs
Excluding G&A and unallocated expenses
601 651
19 18 13
121 114
137 1 2
24
11
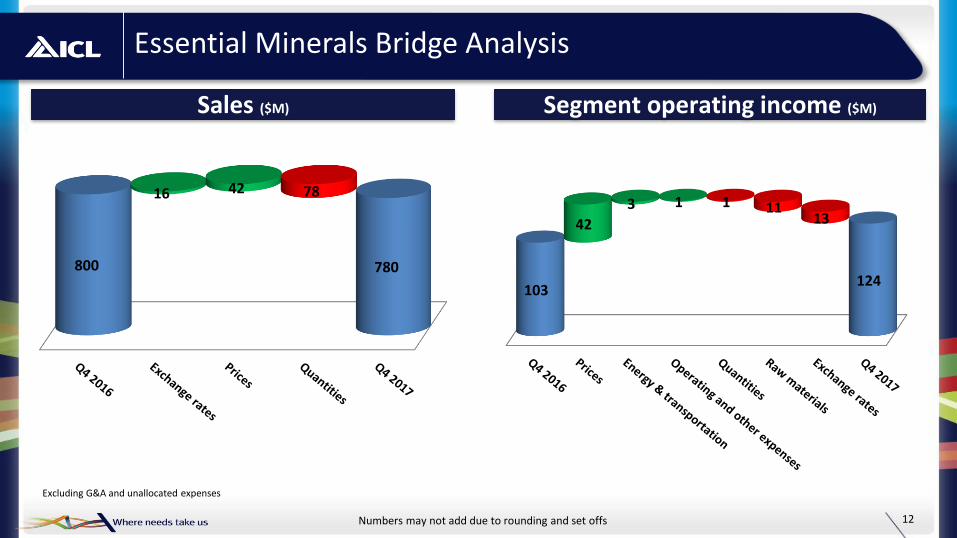
Essential Minerals Bridge Analysis
Sales ($M) Segment operating income ($M)
Numbers may not add due to rounding and set offs
Excluding G&A and unallocated expenses
800 780
16 42 78
103124
42
3 1 1 1113
12

… leading to a continuous positive Free Cash Flow** generation
887
794
680619
507
337 350 355401 418
2013A 2014A 2015A 2016A 2017A 2018E
CapEx
Depreciation andAmmortization
Prudent Capital Management Leading to Strong Cash Flow Generation
We Exercise Strict CapEx* Management While Still Investing in Future Growth…
* Additions to PP&E (Non cash)** Free cash flow =operating cash flow –purchases of property, plant and equipment and intangible assets + dividends from equity-accounted
investees (also included in “other”). See reconciliation table at the appendix.
$ million
$ million
278
74
-27
346
2013A 2014A 2015A 2016A 2017A 2018E
405
13
Q4 and FY2017 Key Takeaways
14
STRONG PERFORMANCE
DEBT REDUCTION
STRATEGIC DIRECTION

Thank You
Appendix

Specialty Solutions Segment
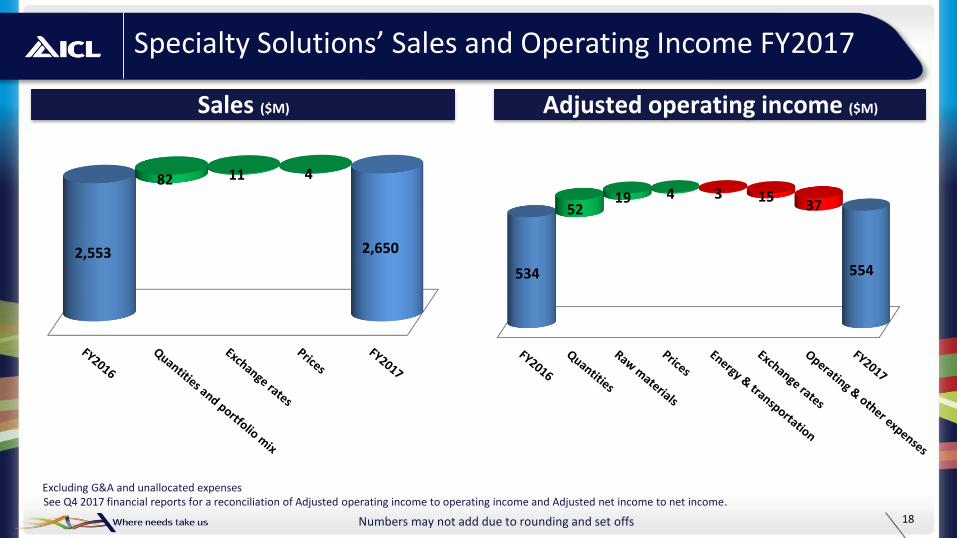
Specialty Solutions’ Sales and Operating Income FY2017
Sales ($M) Adjusted operating income ($M)
See Q4 2017 financial reports for a reconciliation of Adjusted operating income to operating income and Adjusted net income to net income.
Numbers may not add due to rounding and set offs
Excluding G&A and unallocated expenses
2,553 2,650
82 11 4
534 554
5219 4 3 15
37
18
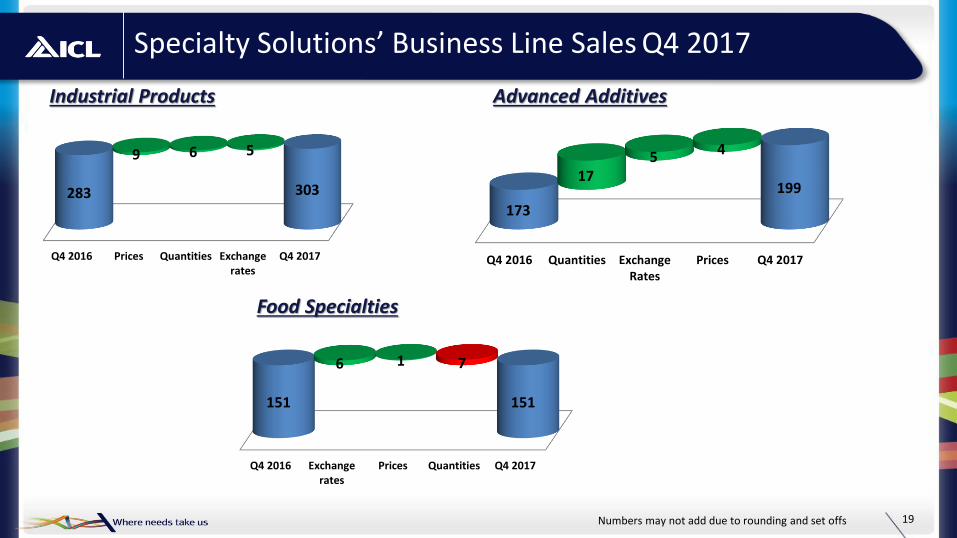
Specialty Solutions’ Business Line Sales Q4 2017
Numbers may not add due to rounding and set offs
Industrial Products Advanced Additives
Food Specialties
Q4 2016 Quantities ExchangeRates
Prices Q4 2017
173
19917
5 4
Q4 2016 Exchangerates
Prices Quantities Q4 2017
151 151
6 1 7
Q4 2016 Prices Quantities Exchangerates
Q4 2017
283 303
9 6 5
19

Essential Minerals Segment

Essential Minerals’ Sales and Operating Income FY2017
Sales ($M) Adjusted operating income ($M)
See Q4 2017 press release for a reconciliation of Adjusted operating income to operating income and Adjusted net income to net income.
Numbers may not add due to rounding and set offs
Excluding G&A and unallocated expenses
3,036 3,008
18 9 1
398 359
18 7 6 9 3031
21

Essential Minerals’ Business Line Sales Q4 2017
Numbers may not add due to rounding and set offs
Specialty Fertilizers
Potash & Magnesium Phosphates
415 414
32 8 41
263 242
6 11 38
137156
162 1
22
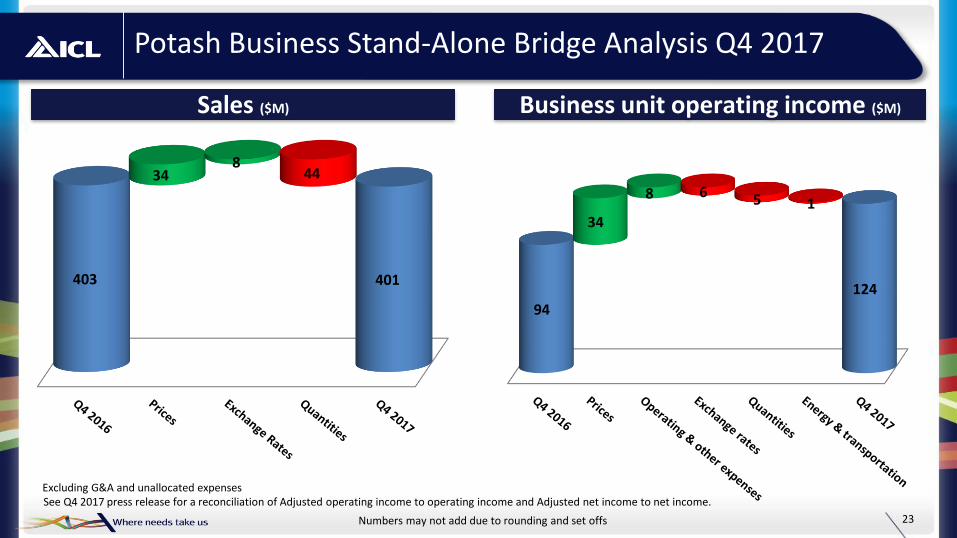
Potash Business Stand-Alone Bridge Analysis Q4 2017
Sales ($M) Business unit operating income ($M)
See Q4 2017 press release for a reconciliation of Adjusted operating income to operating income and Adjusted net income to net income.
Numbers may not add due to rounding and set offs
Excluding G&A and unallocated expenses
403 401
348
44
94
124
34
8 6 5 1
23

24
Q12014
Q2 2014
Q32014
Q42014
Q12015
Q22015
Q32015
Q42015
Q12016
Q22016
Q32016
Q42016
Q12017
Q22017
Q32017
Q4 2017
Cash flow from operations
167 120 295 310 66 325 124 58 222 238 249 257 195 199 176 277
Purchase of property, plant and equipment and intangible assets
(239) (209) (207) (180) (150) (155) (164) (150) (187) (154) (153) (138) (106) (113) (98) (140)
Dividend from investees
9 3 2 3 12 - 4 3 3 1 - 8 3 - - -
Proceeds from sale of fixed assets
- - - - - - - - - - - - 12 - - -
Free Cash Flow -63 -86 90 133 -72 170 -36 -89 38 85 96 127 104 86 78 137
Free Cash Flow Reconciliation

We disclose in this Quarterly Report non-IFRS financial measures t it led adjusted operat ing income, adjusted net income attributable to the Company’s shareho lders , adjusted EBITDA and free cash flow. Our
management uses adjusted operat ing income, adjusted net income att ributable to the Company’s shareho lders and adjusted EBITDA to facilitate operat ing performance compar isons from per iod to period and
present free cash flow to facilitate a review of our cash flows in per iods. We calculate our adjusted operat ing income by adjust ing our operat ing income to add certain items, as set forth in the reconciliat ion table
“Adjustments to reported operat ing and net income” above. Certain o f these items may recur. We calculate our adjusted net income att ributable to the Company’s shareho lders by adjust ing our net income
attributable to the Company’s shareho lders to add certain items, as set forth in the reconciliat ion table “Adjustments to reported operat ing and net income” above, excluding the total tax impact of such
adjustments and adjustments att ributable to the non-controlling interests. We calculate our adjusted EBITDA by adding back to the net income att ributable to the Company’s shareho lders the depreciat ion and
amort izat ion, financing expenses, net , taxes on income and the items presented in the reconciliat ion table “Adjusted EBITDA for the per iods o f act ivity” below which were adjusted for in calculat ing the adjusted
operat ing income and adjusted net income att ributable to the Company’s shareho lders. We calculate our free cash flow as our cash flows from operat ing act ivit ies net of our purchase o f property, plant,
equipment and intangible assets, and adding Proceeds from sale o f property, plant and equipment and Dividends from equity-accounted investees dur ing such per iod as presented in the reconciliat ion table under
“Calculat ion of free cash flow” .
You should not view adjusted operat ing income, adjusted net income att ributable to the Company’s shareho lders or adjusted EBITDA as a subst itute for operat ing income or net income at t ributable to the
Company’s shareho lders determined in accordance with IFRS, or free cash flow as a subst itute for cash flows from operat ing act ivit ies and cash flows used in invest ing act ivit ies, and you should note that our
definit ions o f adjusted operat ing income, adjusted net income att ributable to the Company’s shareho lders, adjusted EBITDA and free cash flow may differ from those used by other companies. However, we
believe adjusted operat ing income, adjusted net income att ributable to the Company’s shareho lders, adjusted EBITDA and free cash flow provide useful informat ion to both management and investors by excluding
certain expenses that management believes are not indicat ive o f our ongoing operations. In part icular for free cash flow, we adjust our Capex to include any Proceeds from sale of property, plant and equipment
because we believe such amounts o ffset the impact of our purchase o f property, plant , equipment and intangible assets. We further adjust free cash flow to add Dividends from equity-accounted investees because
receipt of such dividends affects our residual cash flow. Free cash flow does not reflect adjustment for addit ional items that may impact our residual cash flow for discret ionary expenditures, such as adjustments
for charges relat ing to acquisit ions, servicing debt obligat ions, changes in our deposit account balances that relate to our invest ing act ivit ies and other non-discret ionary expenditures. Our management uses these
non-IFRS measures to evaluate the Company's business st rategies and management 's performance. We believe that these non-IFRS measures provide useful informat ion to investors because they improve the
comparabilit y of the financial results between periods and provide for greater t ransparency of key measures used to evaluate our performance.
We present a discussion in the per iod-to-per iod compar isons o f the pr imary dr ivers of changes in the company’s results o f operat ions. This discussion is based in part on management’s best est imates of the impact
of the main trends in its businesses. We have based the following discussion on our financial statements. You should read the following discussion together with our financial statements.
Non GAAP Financial Measures
25