Q4 and Full Year 2015 Results
77
Investor Presentation January 27, 2016 Q4 and Full Year 2015 Results
-
Upload
nguyenthuan -
Category
Documents
-
view
218 -
download
2
Transcript of Q4 and Full Year 2015 Results
Investor Presentation
January 27, 2016
Q4 and Full Year 2015 Results
Disclaimer This presentation contains forward-looking statements that can be identified by terminology such as such as “potential,” “expected,” “will,” “planned,” or similar
expressions, or by express or implied discussions regarding potential new products, potential new indications for existing products, or regarding potential future revenues
from any such products; potential shareholder returns or credit ratings; or regarding any potential financial or other impact on Novartis or any of our divisions of the
strategic actions announced in January 2016 to focus our divisions, integrate certain functions and leverage our scale; or regarding any potential financial or other impact
on Novartis as a result of the creation and operation of NBS; or regarding the potential financial or other impact on Novartis of the transactions with GSK, Lilly or CSL; or
regarding potential future sales or earnings of the Novartis Group or any of its divisions; or by discussions of strategy, plans, expectations or intentions. You should not
place undue reliance on these statements. Such forward-looking statements are based on the current beliefs and expectations of management regarding future events,
and are subject to significant known and unknown risks and uncertainties. Should one or more of these risks or uncertainties materialize, or should underlying
assumptions prove incorrect, actual results may vary materially from those set forth in the forward-looking statements. There can be no guarantee that any new products
will be approved for sale in any market, or that any new indications will be approved for any existing products in any market, or that any approvals which are obtained will
be obtained at any particular time, or that any such products will achieve any particular revenue levels. Nor can there be any guarantee that Novartis will be able to
realize any of the potential strategic benefits, synergies or opportunities as a result of the strategic actions announced in January 2016, the creation and operation of
NBS, or the transactions with GSK, Lilly and CSL. Neither can there be any guarantee that Novartis or any of the businesses involved in the transactions will achieve any
particular financial results in the future. Neither can there be any guarantee that shareholders will achieve any particular level of shareholder returns. Nor can there be
any guarantee that the Group, or any of its divisions, will be commercially successful in the future, or achieve any particular credit rating. In particular, management’s
expectations could be affected by, among other things: unexpected regulatory actions or delays or government regulation generally; the potential that the strategic
benefits, synergies or opportunities expected from the strategic actions announced in January 2016, the creation and operation of NBS, or the transactions with GSK,
Lilly and CSL may not be realized or may take longer to realize than expected; the inherent uncertainties involved in predicting shareholder returns or credit ratings; the
uncertainties inherent in research and development, including unexpected clinical trial results and additional analysis of existing clinical data; our ability to obtain or
maintain proprietary intellectual property protection, including the ultimate extent of the impact on Novartis of the loss of patent protection and exclusivity on key products
which commenced in prior years and will continue this year; unexpected safety, quality or manufacturing issues; global trends toward health care cost containment,
including ongoing pricing pressures, in particular from increased publicity on pharmaceuticals pricing; uncertainties regarding actual or potential legal proceedings,
including, among others, actual or potential product liability litigation, litigation and investigations regarding sales and marketing practices, government investigations and
intellectual property disputes; general economic and industry conditions, including uncertainties regarding the effects of the persistently weak economic and financial
environment in many countries; uncertainties regarding future global exchange rates, including the continued significant increase in value of the US dollar, our reporting
currency, against a number of currencies; uncertainties regarding future demand for our products; uncertainties involved in the development of new healthcare products;
uncertainties regarding potential significant breaches of data security or disruptions of our information technology systems; and other risks and factors referred to in
Novartis AG’s current Form 20-F on file with the US Securities and Exchange Commission. Novartis is providing the information in this presentation as of this date and
does not undertake any obligation to update any forward-looking statements as a result of new information, future events or otherwise. | Novartis Q4 and FY 2015 Results | January 27, 2016 | Novartis Investor Presentation 2

| Novartis Q4 and FY 2015 Results | January 27, 2016 | Novartis Investor Presentation 3
Agenda
Group review Joseph Jimenez, Chief Executive Officer
Financial review Harry Kirsch, Chief Financial Officer
Pharmaceuticals review David Epstein, Division Head, Novartis
Pharmaceuticals
Closing remarks Joseph Jimenez, Chief Executive Officer
Q&A session Executive team
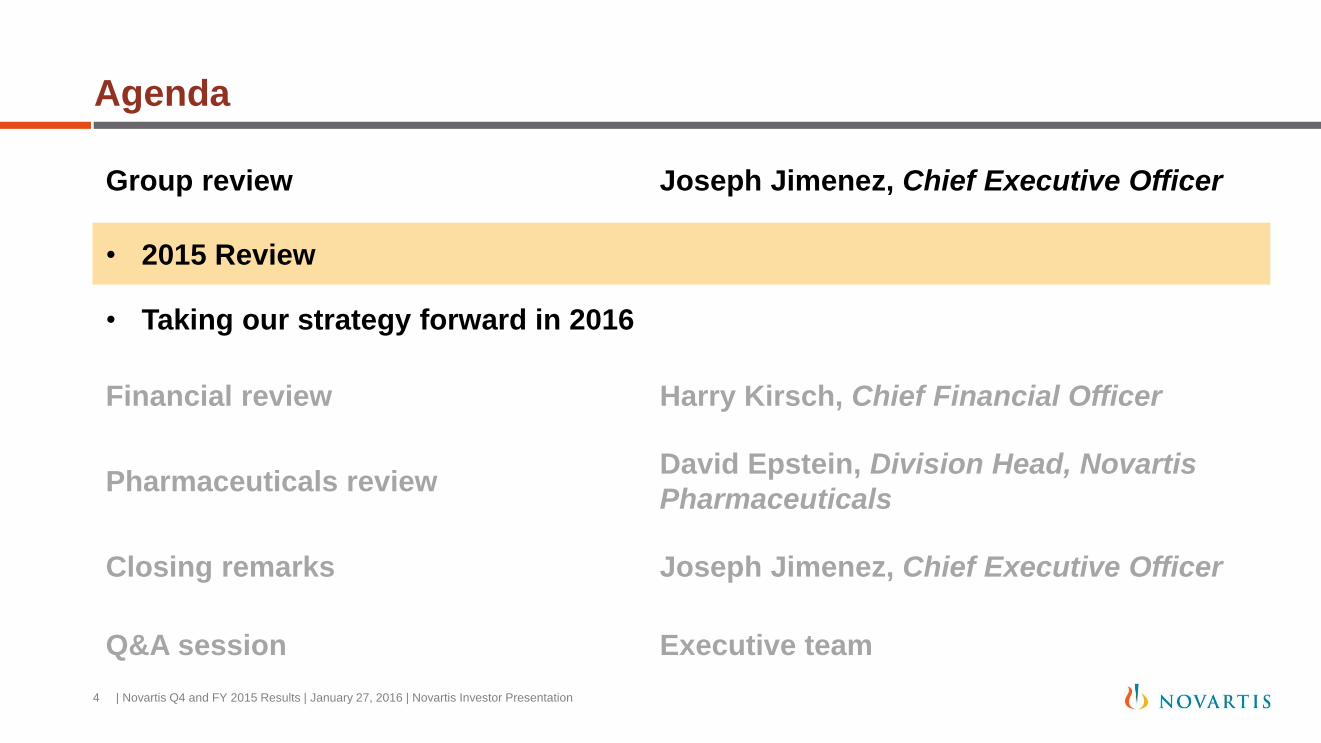
Group review Joseph Jimenez, Chief Executive Officer
• 2015 Review
• Taking our strategy forward in 2016
Financial review Harry Kirsch, Chief Financial Officer
Pharmaceuticals review David Epstein, Division Head, Novartis
Pharmaceuticals
Closing remarks Joseph Jimenez, Chief Executive Officer
Q&A session Executive team
| Novartis Q4 and FY 2015 Results | January 27, 2016 | Novartis Investor Presentation 4
Agenda
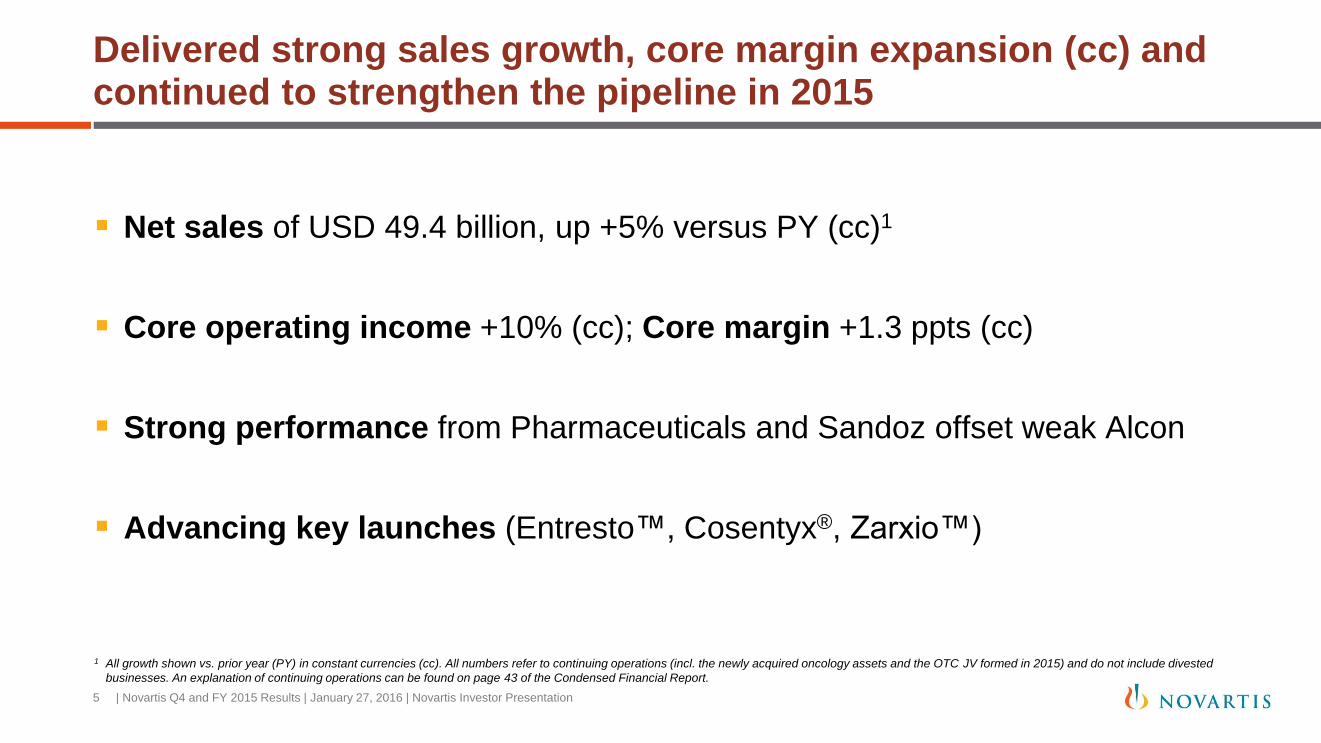
Delivered strong sales growth, core margin expansion (cc) and continued to strengthen the pipeline in 2015
Net sales of USD 49.4 billion, up +5% versus PY (cc)1
Core operating income +10% (cc); Core margin +1.3 ppts (cc)
Strong performance from Pharmaceuticals and Sandoz offset weak Alcon
Advancing key launches (Entresto™, Cosentyx®, Zarxio™)
1 All growth shown vs. prior year (PY) in constant currencies (cc). All numbers refer to continuing operations (incl. the newly acquired oncology assets and the OTC JV formed in 2015) and do not include divested
businesses. An explanation of continuing operations can be found on page 43 of the Condensed Financial Report.
| Novartis Q4 and FY 2015 Results | January 27, 2016 | Novartis Investor Presentation 5

Summary of 2015 financial results
1 Continuing operations are defined on page 43 of the Condensed Financial Report. Constant currencies (cc), core results, and free cash flow are non-IFRS measures. An explanation of these measures can be found on
page 53 of the Condensed Financial Report.
Continuing operations1
(in USD bn) 2015 % USD % cc
Net Sales 49.4 -5 +5
Core Operating Income 13.8 -5 +10
Operating Income 9.0 -19 -2
Net Income 7.0 -34 -18
Core EPS (USD) 5.01 -3 +10
EPS (USD) 2.92 -33 -17
Free Cash Flow 9.3 -15
Change vs. PY
| Novartis Q4 and FY 2015 Results | January 27, 2016 | Novartis Investor Presentation 6
1
2
3
4
5
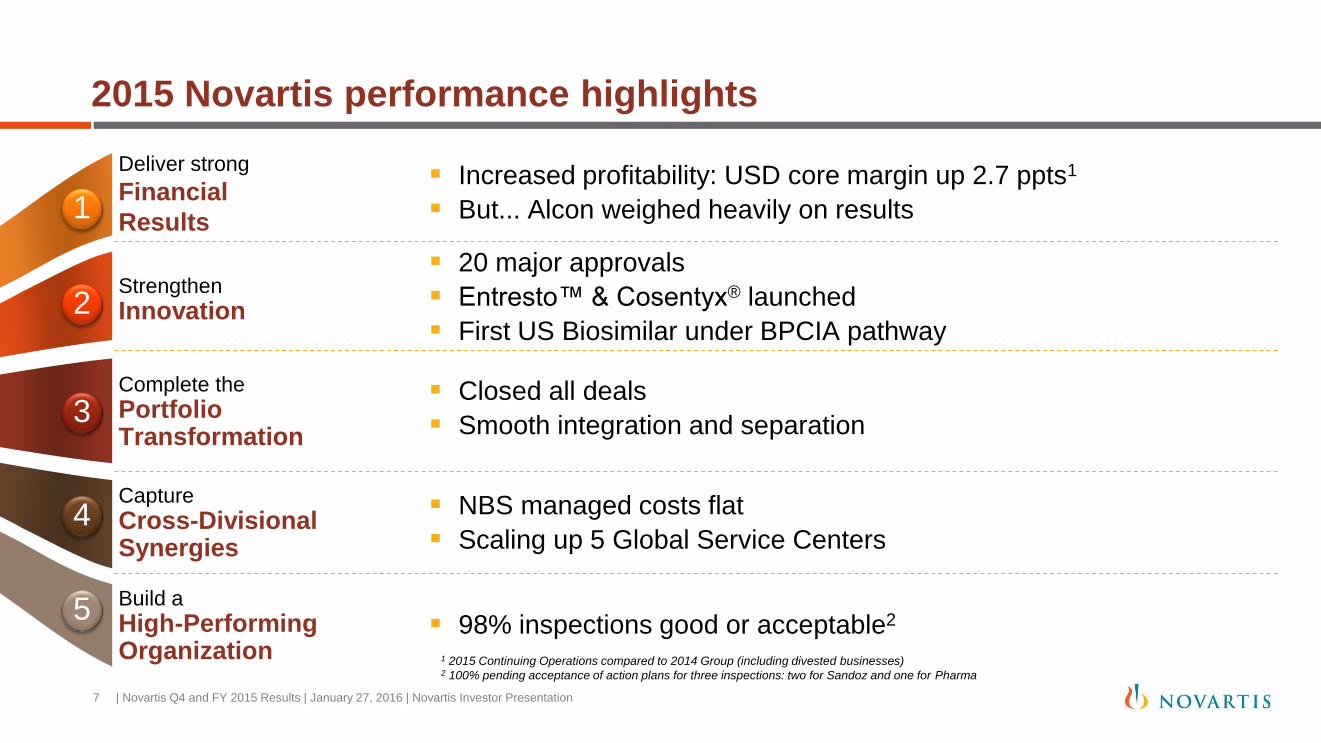
Deliver strong
Financial
Results
Strengthen
Innovation
Complete the
Portfolio Transformation
Capture
Cross-Divisional Synergies
Build a
High-Performing Organization
20 major approvals
Entresto™ & Cosentyx® launched
First US Biosimilar under BPCIA pathway
Increased profitability: USD core margin up 2.7 ppts1
But... Alcon weighed heavily on results
Closed all deals
Smooth integration and separation
NBS managed costs flat
Scaling up 5 Global Service Centers
98% inspections good or acceptable2
2015 Novartis performance highlights
| Novartis Q4 and FY 2015 Results | January 27, 2016 | Novartis Investor Presentation 7
1 2015 Continuing Operations compared to 2014 Group (including divested businesses) 2 100% pending acceptance of action plans for three inspections: two for Sandoz and one for Pharma

Sales Core operating
income
-7% -1% Alcon
+7% +17% Sandoz
+6% +14% Pharmaceuticals
1
4
2
3
5
Strong Pharmaceuticals and Sandoz performance drove sales and
profit growth despite weak Alcon
Deliver strong
Financial
Results1
1 All growth shown vs. PY in constant currencies (cc)
| Novartis Q4 and FY 2015 Results | January 27, 2016 | Novartis Investor Presentation 8

EU Approval
ALK+ NSCLC3
EU approval
BRAF V600+ Melanoma
(Median OS 25.6 months)
EU approval
polycythemia vera
1
4
3
5
2 US, EU approval
PsO, AS & PsA2
US and EU approval
HFrEF1
2015 was a strong year for innovation
1 Approved in EU and US for heart failure with reduced ejection fraction (HFrEF) NYHA II-IV 2 Approved for PsO (US, EU, JP), PsA (EU, JP) and AS (EU); US approval for AS and PsA in Jan ‘16; Japan approvals for PsO and PsA in Dec ‘14. PsO = Psoriasis; PsA = Psoriatic Arthritis; AS = Ankylosing Spondylitis 3 NSCLC = Non-Small Cell Lung Cancer;
US approval
Chemotherapy induced
febrile neutropenia
Strengthen
Innovation
| Novartis Q4 and FY 2015 Results | January 27, 2016 | Novartis Investor Presentation 9
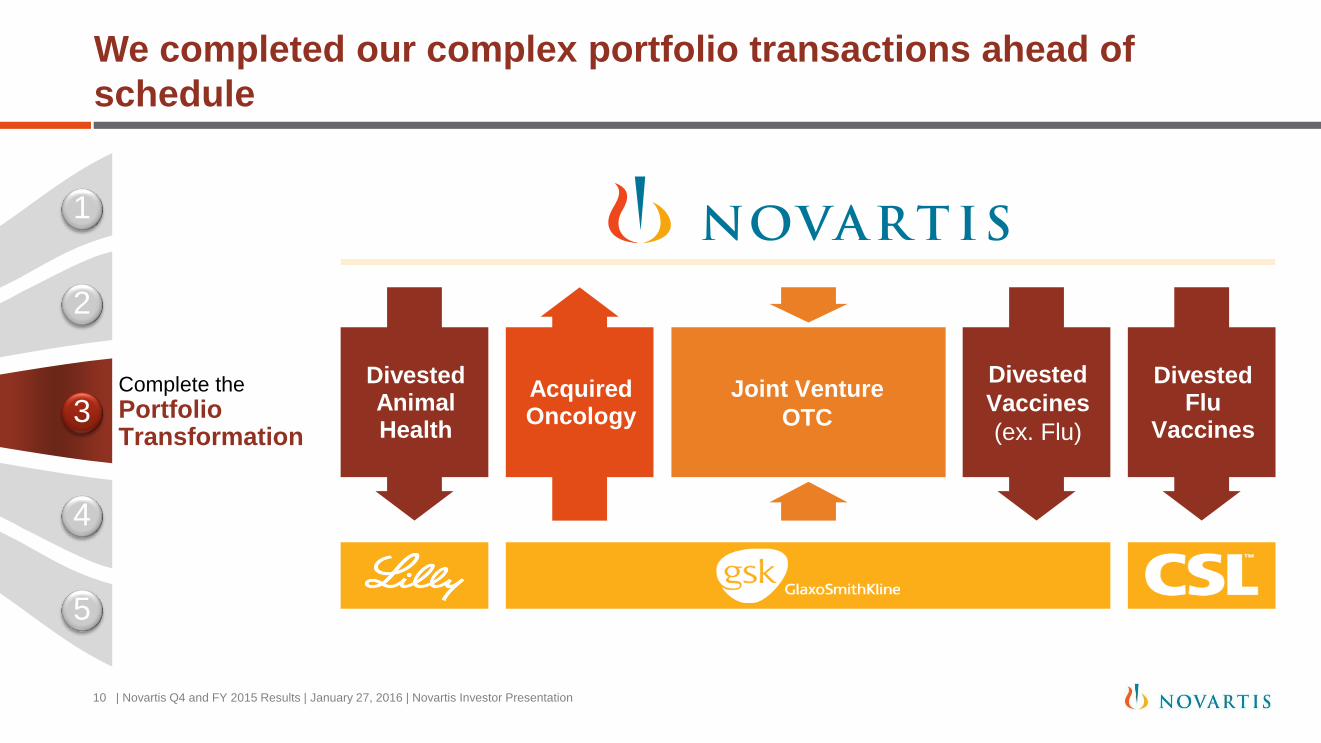
We completed our complex portfolio transactions ahead of
schedule
Divested
Vaccines
(ex. Flu)
Acquired Oncology
Divested Animal Health
Divested Flu
Vaccines
Joint Venture
OTC
1
4
2
5
3
| Novartis Q4 and FY 2015 Results | January 27, 2016 | Novartis Investor Presentation 10
Complete the
Portfolio Transformation

1
2
3
5
NBS is executing on its objectives
4
Cost under management flat versus prior year
Scaling up 5 Global Service Centers: Mexico City, Prague,
Dublin, Hyderabad and Kuala Lumpur
Procurement savings of USD 1.7 billion delivered in 2015,
in part by leveraging our scale through NBS
Capture
Cross-Divisional Synergies
| Novartis Q4 and FY 2015 Results | January 27, 2016 | Novartis Investor Presentation 11

1
4
2
3
Strong Quality performance across our ~80 sites, with 98% of
inspections good or acceptable (remaining 2% pending1)
5 Build a High-Performing Organization
97%
99%
100%
Sandoz
Alcon
Pharmaceuticals
Number of inspections
% Inspections good or acceptable1
84
41
67
1 Results status December 31, 2015, for continuing operations: Pharmaceuticals, Alcon and Sandoz. 100% pending acceptance of action plans for three inspections: two for Sandoz
and one for Pharma. Received FDA warning letter related to inspection at Kalwe/Turbhe India sites in Aug ‘14; does not contain any new issues versus the 483 observations issued.
| Novartis Q4 and FY 2015 Results | January 27, 2016 | Novartis Investor Presentation 12

Group review Joseph Jimenez, Chief Executive Officer
• 2015 Review
• Taking our strategy forward in 2016
Financial review Harry Kirsch, Chief Financial Officer
Pharmaceuticals review David Epstein, Division Head, Novartis
Pharmaceuticals
Closing remarks Joseph Jimenez, Chief Executive Officer
Q&A session Executive team
| Novartis Q4 and FY 2015 Results | January 27, 2016 | Novartis Investor Presentation 13
Agenda

Alcon growth plan
Our strategy for growth and innovation
Taking our strategy forward in 2016
| Novartis Q4 and FY 2015 Results | January 27, 2016 | Novartis Investor Presentation 14

Ophthalmology is an attractive healthcare segment
High unmet need
80% of population has a
treatable eye condition
Market is large and
profitable
Market size in 2015:
Over USD 40 billion in sales
Market expected to continue
to grow at healthy rate
+5% p.a. projected market
growth, driven by an aging
population
Source: Market Scope, LLC forecast, Alcon and competitors financial results, IMS MIDAS, Evaluate Pharma, Contact Lens Institute/Euromcontact Factory Sales Sharing Program/GfK, Alcon internal estimate
USD
~40bn
| Novartis Q4 and FY 2015 Results | January 27, 2016 | Novartis Investor Presentation 15

Alcon is the global leader in ophthalmology and maintains strong
customer relationships
0.8
1.2
1.5
3.4
3.3
10.8
Ophthalmology revenue
2014 full year, USD bn
2
1 Estimated based on Valeant reporting, as B&L did not report Q1 ‘14 sales 2 Includes surgical ophthalmology microscope business 3 Based on a survey of 203 ophthalmologists in the US in Nov/Dec ‘15
1 66%
7%
21% Competitor 1
Competitor 3
7% Competitor 2
“Which ophthalmology company do you
prefer?” 3
| Novartis Q4 and FY 2015 Results | January 27, 2016 | Novartis Investor Presentation 16

However, Alcon growth slowed in 2015
Net sales
Core operating
income
% Change vs. PY
(in cc)
-1
+6
-7
+8
2014 2015
| Novartis Q4 and FY 2015 Results | January 27, 2016 | Novartis Investor Presentation 17

We conducted an extensive analysis of Alcon’s underlying issues
Listened to our customers 100+
interviews with surgeons, ophthalmologists,
optometrists
Deep dive data analysis of market and
competitor benchmark data
Assessed impact of Alcon’s strategic
decisions over last decade
| Novartis Q4 and FY 2015 Results | January 27, 2016 | Novartis Investor Presentation 18

▪ Insufficient innovation
- Devices vs. Pharma, two different models
- Lack of investment, especially in Pharma
The root causes
Reduced customer focus
Underdeveloped capabilities in operations and systems
| Novartis Q4 and FY 2015 Results | January 27, 2016 | Novartis Investor Presentation 19

Insufficient innovation due to two different models
High frequency, iterative
development
Lower R&D investment
Deep relationships with physicians
Pharmaceuticals Medical Devices
Longer-term view on
development
Higher R&D investment
Targeted reach with physicians
Two different innovation models,
operating in one division
Core issue:
| Novartis Q4 and FY 2015 Results | January 27, 2016 | Novartis Investor Presentation 20

Reduced customer focus
Less surgeon education and training
Supply chain and consumables capacity issues
Reduced in-field support
| Novartis Q4 and FY 2015 Results | January 27, 2016 | Novartis Investor Presentation 21

As well as underdeveloped capabilities
Less Focus on Pharma Capabilities
Medical Affairs & Market Access
Sales Force Effectiveness
Pricing
Customer Relationship Management
| Novartis Q4 and FY 2015 Results | January 27, 2016 | Novartis Investor Presentation 22

Alcon growth plan has three core elements
Focus the business
Strengthen the foundation
Invest for growth
1
2
3
| Novartis Q4 and FY 2015 Results | January 27, 2016 | Novartis Investor Presentation 23

1. Focus the business
Move Ophtha Pharma into our
Pharmaceuticals Division
1
Gives critical devices business
100% focus from division
management
Leverages Novartis’ world-class
pharma capabilities in R&D and
marketing
Maintains strong customer-facing
Alcon branding to provide seamless
service
Focus Alcon eye care division on
Surgical and Vision Care
| Novartis Q4 and FY 2015 Results | January 27, 2016 | Novartis Investor Presentation 24

2. Strengthen the foundation
▪ Implement best-in-class surgical innovation model
▪ Prioritize and invest in Ophtha Pharma R&D behind key projects
Accelerate
Innovation
▪ Ensure best-in-class customer training & education
▪ Surround surgeon with support (e.g., field service engineers
and MSLs)
Strengthen the
Customer
Relationship
| Novartis Q4 and FY 2015 Results | January 27, 2016 | Novartis Investor Presentation 25
▪ Improve sales force effectiveness and pricing capabilities
▪ Strengthen supply chain
▪ Implement improved systems (e.g., SAP)
Improve Basic
Operations
2

Maximize new IOL launches (e.g., UltraSertTM, PanOptixTM) and
accelerate toric IOL uptake
Accelerate near-term BD&L and M&A to augment pipeline
Invest in direct-to-consumer to bolster contact lenses
(e.g., Dailies Total1®, AirOptix®)
3. Invest for growth
| Novartis Q4 and FY 2015 Results | January 27, 2016 | Novartis Investor Presentation 26
3

Alcon to become a ~USD 6 billion eye care division focused on
Surgical and Vision Care
Three large and profitable businesses:
Lenses, Consumables and IOLs
- Drive Consumables with innovative
equipment and physician training
- Drive IOLs by prioritizing innovation
and commercial launches
1.1
0.3
1.4
0.1 0.6
0.3
0.6
1.7
Other Cataract
Contact
Lenses
Contact
Lens Care
Cataract IOLs
Cataract
Consumables
Cataract
Equipment
Vitreoretinal
Refractive &
Other Surgery
- Drive Lenses with DTC investment
behind key brands
| Novartis Q4 and FY 2015 Results | January 27, 2016 | Novartis Investor Presentation 27
Net sales
(in USD bn)

Alcon delivery milestones in 2016
Milestones
Focus Full operational transfer of Ophtha Pharma by end Q2 2016
Financial Alcon (ex. Ophtha Pharma):
Expect difficult H1; exiting Q4 with low to mid-single digit sales growth
Innovation &
Growth
Accelerate innovation and growth: Return IOLs to growth by H2 2016 Grow consumables throughout the year Launch ClareonTM IOL platform by 2017
Deliver short-term, incremental innovation milestones
Investment
Incremental investment in our innovation and growth priorities:
Incremental M&S behind UltraSertTM and PanOptix® launches DTC behind key Vision Care brands in H1 Provide training, education and improved services for eye care professionals
| Novartis Q4 and FY 2015 Results | January 27, 2016 | Novartis Investor Presentation 28
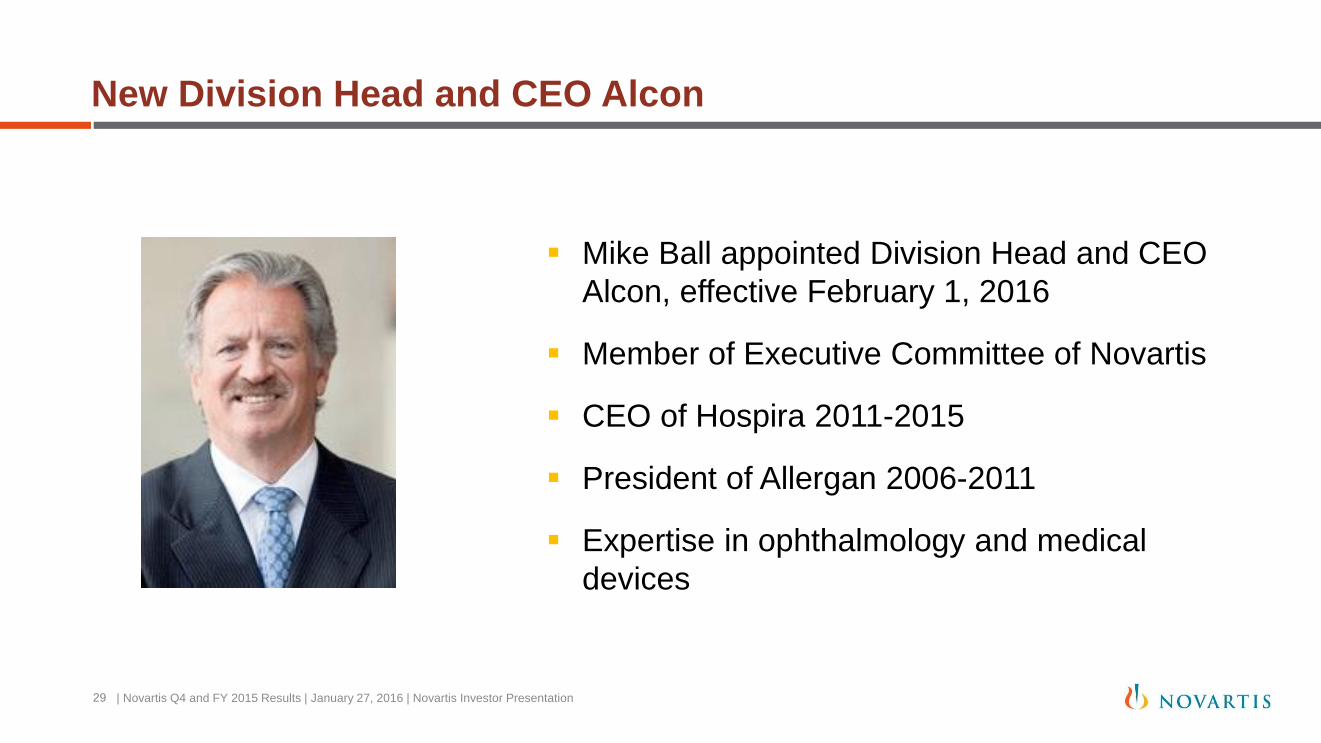
New Division Head and CEO Alcon
29
Mike Ball appointed Division Head and CEO
Alcon, effective February 1, 2016
Member of Executive Committee of Novartis
CEO of Hospira 2011-2015
President of Allergan 2006-2011
Expertise in ophthalmology and medical
devices
| Novartis Q4 and FY 2015 Results | January 27, 2016 | Novartis Investor Presentation

Shift of Alcon Ophtha to Pharmaceuticals Division creates a
~USD 6 billion unified ophthalmic medicines franchise1
Ophtha Pharmaceuticals
1 Including Lucentis®
Alcon-branded field force, coordinated
with surgical
Strengthened with world-class
capabilities in R&D and commercial
Stronger combined pipeline
| Novartis Q4 and FY 2015 Results | January 27, 2016 | Novartis Investor Presentation 30

Alcon growth plan
Our strategy for growth and innovation
Taking our strategy forward in 2016
| Novartis Q4 and FY 2015 Results | January 27, 2016 | Novartis Investor Presentation 31

Pharmaceuticals Alcon Sandoz
Last year we transformed our company to focus on three leading divisions and streamline our operations
Novartis Business Services
| Novartis Q4 and FY 2015 Results | January 27, 2016 | Novartis Investor Presentation 32
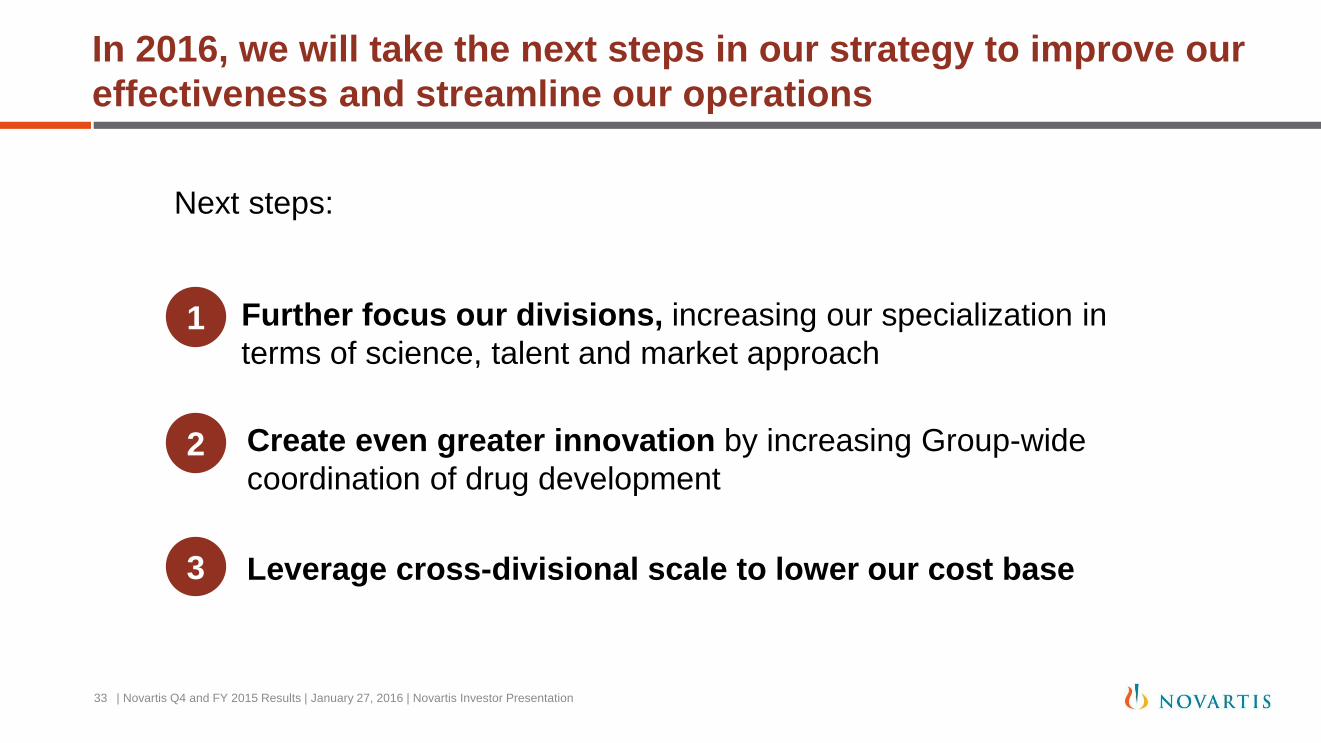
In 2016, we will take the next steps in our strategy to improve our
effectiveness and streamline our operations
Next steps:
Further focus our divisions, increasing our specialization in
terms of science, talent and market approach
Create even greater innovation by increasing Group-wide
coordination of drug development
Leverage cross-divisional scale to lower our cost base
1
2
3
| Novartis Q4 and FY 2015 Results | January 27, 2016 | Novartis Investor Presentation 33
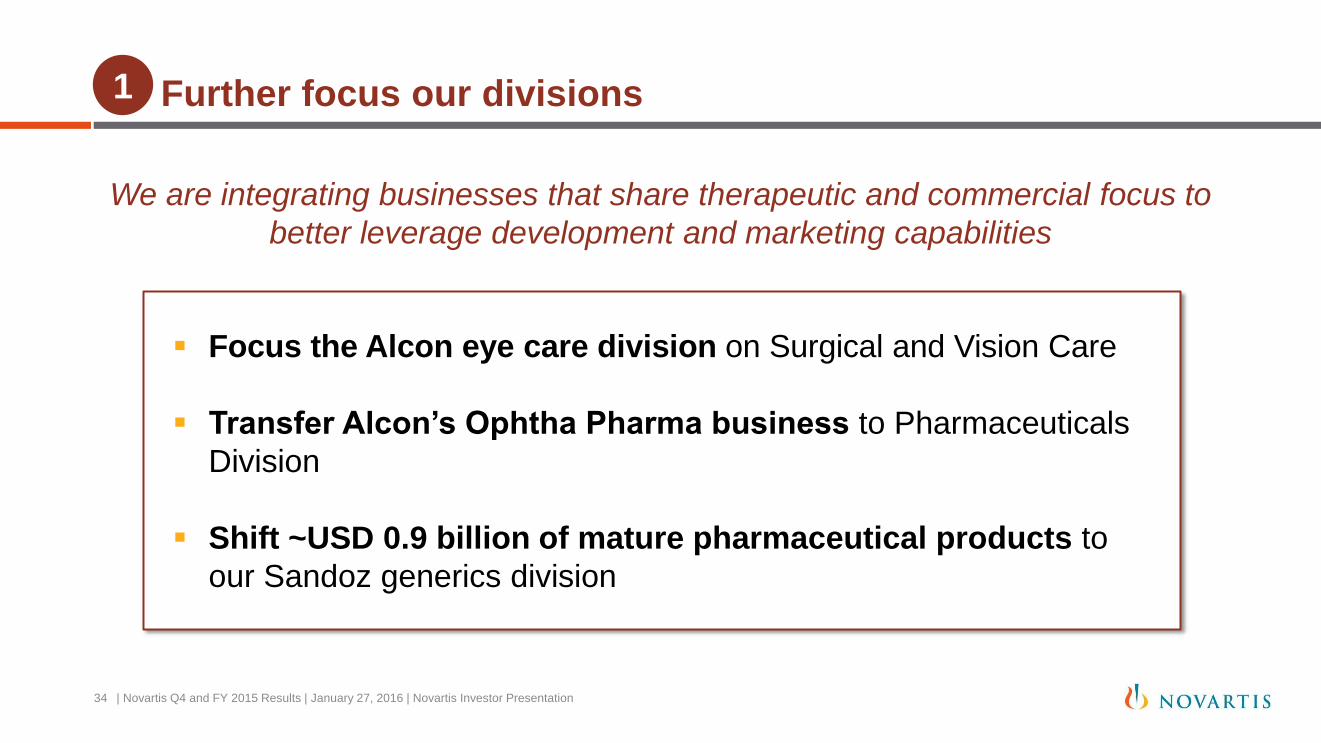
Further focus our divisions
We are integrating businesses that share therapeutic and commercial focus to
better leverage development and marketing capabilities
Focus the Alcon eye care division on Surgical and Vision Care
Transfer Alcon’s Ophtha Pharma business to Pharmaceuticals
Division
Shift ~USD 0.9 billion of mature pharmaceutical products to
our Sandoz generics division
| Novartis Q4 and FY 2015 Results | January 27, 2016 | Novartis Investor Presentation 34
1

Create even greater innovation 2
We are increasing Group-wide coordination of drug development to stay at the
cutting edge of innovation
Establish single Global Head Drug Development to improve
resource allocation, technology and standards across divisions
Integrate clinical enabling functions (such as safety,
pharmacovigilance and regulatory), while maintaining strategy and
clinical execution in the divisions
| Novartis Q4 and FY 2015 Results | January 27, 2016 | Novartis Investor Presentation 35

New Global Head Drug Development and Chief Medical Officer
Dr. Vas Narasimhan appointed Global Head
Drug Development and Chief Medical Officer,
effective February 1, 2016
Member of Executive Committee of Novartis
Functional oversight for drug development for
General Medicines, Ophtha Pharma, Oncology
and Biosimilars
Working closely with Jay Bradner at NIBR
Position created to improve resource
allocation, technology and standards to further
increase innovation
| Novartis Q4 and FY 2015 Results | January 27, 2016 | Novartis Investor Presentation 36

Leverage cross-divisional scale to lower our cost base 3
We are creating integrated manufacturing operations and more shared services,
to further boost efficiency
Centralize manufacturing operations across all divisions to:
- Improve capacity planning
- Lower costs and enhance quality
- Develop next-generation technologies and share best practices
Expand NBS to create an in-country service platform for sales
and marketing services across all divisions
| Novartis Q4 and FY 2015 Results | January 27, 2016 | Novartis Investor Presentation 37

New President Novartis Operations
Andre Wyss appointed President, Novartis
Operations
Already a member of Executive Committee of
Novartis, Head NBS and Country President for
Switzerland
Will assume responsibility for the integrated
Technical Operations organization and Global
Public & Government Affairs, in addition to his
current responsibilities
| Novartis Q4 and FY 2015 Results | January 27, 2016 | Novartis Investor Presentation 38

These changes are a natural extension of our strategy and are
expected to generate significant savings
Expect to generate
≥ USD 1bn savings
annually by 2020
Savings will be used to:
Maintain our high investment in R&D
Improve our profit margins
Free up resources for growth priorities
| Novartis Q4 and FY 2015 Results | January 27, 2016 | Novartis Investor Presentation 39

Group review Joseph Jimenez, Chief Executive Officer
• 2015 Review
• Taking our strategy forward in 2016
Financial review Harry Kirsch, Chief Financial Officer
Pharmaceuticals review David Epstein, Division Head, Novartis
Pharmaceuticals
Closing remarks Joseph Jimenez, Chief Executive Officer
Q&A session Executive team
| Novartis Q4 and FY 2015 Results | January 27, 2016 | Novartis Investor Presentation 40
Agenda

Continuing operations1 performance delivered 2015 guidance
“Sales are expected to grow at a mid-single digit rate”
“Core operating income is expected to grow ahead of sales, at a high-
single digit rate”
“Pharmaceuticals: mid single digit sales growth”
“Alcon: low single digit sales growth”
“Sandoz: high single digit sales growth”
Actuals
vs. PY
(all in cc)
Full Year Guidance, Q2 2015
(all in cc)
+5%
+10%
+6%
-1%
+7%
X
1 An explanation of continuing operations can be found on page 43 of the Condensed Financial Report
| Novartis Q4 and FY 2015 Results | January 27, 2016 | Novartis Investor Presentation 41

Q4 Change vs. PY FY Change vs. PY
(in USD m) 2015 % USD % cc 2015 % USD % cc
Net Sales 12 520 -4 4 49 414 -5 5
Core Operating Income 3 057 -5 9 13 790 -5 10
Operating Income 1 677 -29 -12 8 977 -19 -2
Net Income 1 054 -57 -34 7 028 -34 -18
Core EPS (USD) 1.14 -4 8 5.01 -3 10
EPS (USD) 0.44 -57 -34 2.92 -33 -17
Free Cash Flow 2 942 -26 9 259 -15
Strong leverage in Q4 and Full Year
1 An explanation of continuing operations can be found on page 43 of the Condensed Financial Report
Continuing operations1
| Novartis Q4 and FY 2015 Results | January 27, 2016 | Novartis Investor Presentation 42

-5
5
9
11
USD growth
Currency
CC growth
Generics impact1 -4
Growth before Gx
Price -2
Volume before Gx
-5
10
21
27
-11
-6
Sales volume more than offset generic impact
| Novartis Q4 and FY 2015 Results | January 27, 2016 | Novartis Investor Presentation 43
Continuing operations FY 2015 (growth vs. PY in %)
Core operating income Net sales
1 Generics impact on sales amounted to USD 2.2 billion for FY 2015
-10 -15

Negative currency impact in 2015 from strong USD
| Novartis Q4 and FY 2015 Results | January 27, 2016 | Novartis Investor Presentation 44
Net sales Core operating income
Currency impact vs. PY (in % pts)
2015
Q1 Q2 Q3 Q4
FY impact: -10%
FY
20161
Q1
-3-5
-8
-12-11-10
2015
Q1 Q2 Q3 Q4
FY impact: -15%
FY
20161
Q1
-5-7
-14-17
-13-13
1 Expected currency impact assuming mid January rates prevail for full year

FY 2015
Net sales
change vs. PY
Core operating
income
change vs. PY Core ROS
Core margin
change vs. PY
(in % cc) (in % cc) (%) (% pts cc)
Pharmaceuticals 6 14 30.9 2.4
Alcon -1 -7 31.2 -2.1
Sandoz 7 17 18.1 1.5
FY continuing operations 5 10 27.9 1.3
FY core margin improved due to Pharmaceuticals and Sandoz
| Novartis Q4 and FY 2015 Results | January 27, 2016 | Novartis Investor Presentation 45

Q4 2015
Net sales
change vs. PY
Core operating
income
change vs. PY Core ROS
Core margin
change vs. PY
(in % cc) (in % cc) (%) (% pts cc)
Pharmaceuticals 9 23 26.8 3.3
Alcon -6 -13 28.5 -2.6
Sandoz 0 4 17.2 0.6
Q4 continuing operations 4 9 24.4 1.1
Q4 core margin improvement driven by Pharmaceuticals
| Novartis Q4 and FY 2015 Results | January 27, 2016 | Novartis Investor Presentation 46

FY core margin significantly above prior year due to both
portfolio transformation and productivity improvements
1.3
2.5
26
0
29
28
25
27
+2.7
FY 2015
continuing
operations
core ROS
27.9
-1.1
FX Sales and
Productivity
Portfolio
Transformation
27.7
FY 2014
continuing
operations
core ROS
FY 2014 Total
Group core ROS
25.2
Core margin USD at period rates (in % pts)
| Novartis Q4 and FY 2015 Results | January 27, 2016 | Novartis Investor Presentation 47

(in USD bn)
| Novartis Q4 and Full Year 2015 Results | January 27th, 2016 | Novartis Investor Presentation 48
Net debt increased mainly due to acquisition of GSK oncology
assets
1 Total Group including discontinued operations 2 Related to employee participation programs
-0.8-6.1
-16.0
-16.5
-1.0
-6.5
-22
-20
-18
-16
-14
-12
-10
-8
-6
-4
-2
0
2
4
1.6
Divestment tax payments
Net proceeds
from portfolio
transformation
transactions
9.9
Acquired GSK
oncology
products
Dividends Dec 31, 2015
-10.0
Others Share
repurchases
Proceeds
from options
exercised2
-6.6
Free Cash
Flow1
9.0
Dec 31, 2014

19th consecutive dividend growth proposed1
49
2.6
0
2.7
0
2.6
7
2.7
32
0.00
0.50
1.00
1.50
2.00
2.50
3.00
1996 1997 1998 1999 2000 2001 2002 2003 2004 2005 2006 2007 2008 2009 2010 2011 2012 2013 2014 2015
Proposed1 dividend growth
2015 vs. 2014:
3.8% in CHF, 2.2% in USD
| Novartis Q4 and Full Year 2015 Results | January 27th, 2016 | Novartis Investor Presentation
CHF
USD
1 Proposal to shareholders at the 2016 Annual General Meeting, taking place on February 23, 2016 2 Dividend per share in USD is calculated by converting into USD the proposed dividend per share in CHF at the CHF-USD exchange rate of December 31, 2015 (1 CHF=USD 1.01)
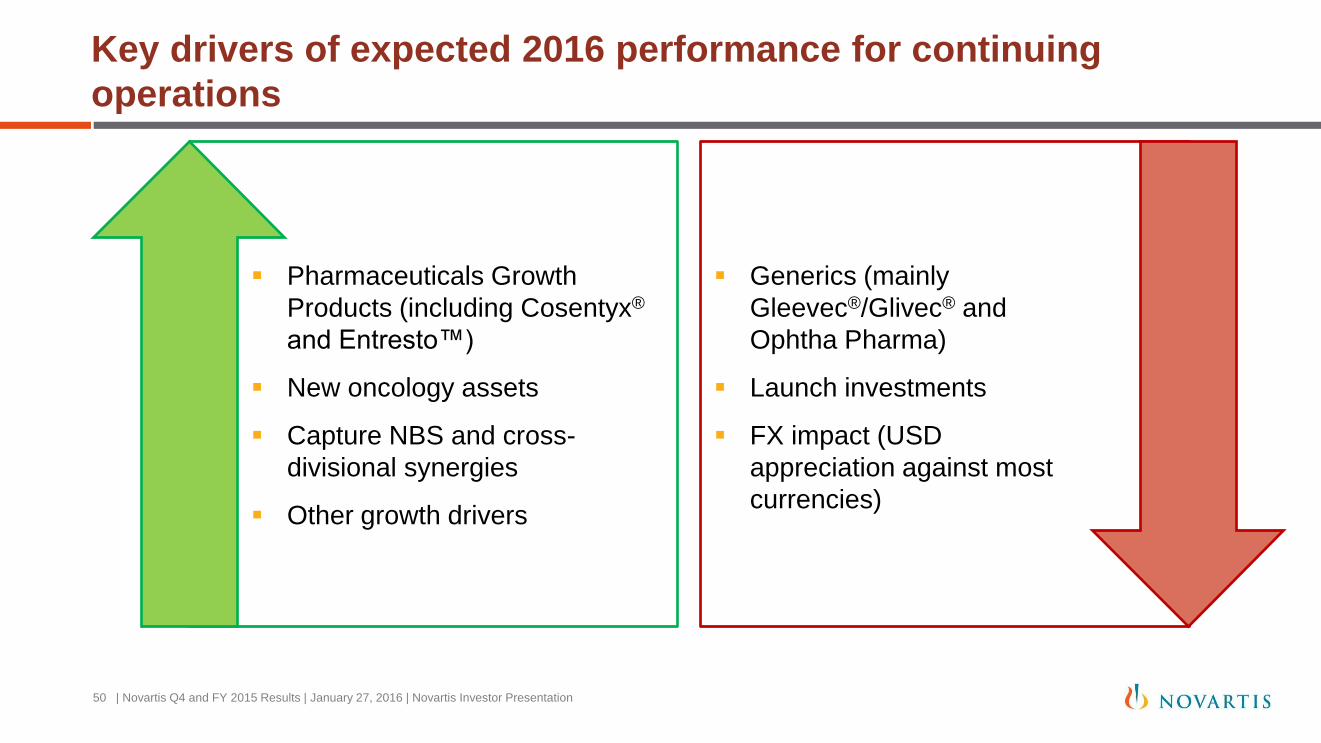
Key drivers of expected 2016 performance for continuing
operations
| Novartis Q4 and FY 2015 Results | January 27, 2016 | Novartis Investor Presentation 50
Pharmaceuticals Growth
Products (including Cosentyx®
and Entresto™)
New oncology assets
Capture NBS and cross-
divisional synergies
Other growth drivers
Generics (mainly
Gleevec®/Glivec® and
Ophtha Pharma)
Launch investments
FX impact (USD
appreciation against most
currencies)

Expected divisional sales outlook in 20161
| Novartis Q4 and FY 2015 Results | January 27, 2016 | Novartis Investor Presentation 51
0.9
3.8
33.3
Mature Product
consolidation
Ophtha
Pharmaceuticals
2015 Actual 30.4
2015 Restated
Pharmaceuticals
Total net sales expected to be broadly in line; mid-single digit growth excluding Gleevec®/Glivec® Gx
6.0
3.8
9.8
Alcon
10.1
0.9
9.2
Sandoz Sales (USD bn)
Broadly in line to slight decline Low single digit growth Low to mid-single digit growth Vs. 2015 (cc)
Vs. 2015 (cc)
Continuing ops
1 Barring unforeseen events; restated financials to be provided in the first half of April ‘16

Outlook for continuing operations in 20161
In 2016, we expect genericization of Gleevec®/Glivec®, currently the largest product in our
Pharmaceuticals portfolio; February in US and December in Europe
Continuing operations net sales expected to be broadly in line with PY; excluding the
Gleevec®/Glivec® Gx impact, growth is expected to be mid-single digits
Including the steps we announced today, we expect 2016 divisional net sales performance
• Pharmaceuticals: broadly in line with PY to a slight decline
• Alcon: low single digit growth
• Sandoz: low to mid-single digit growth
Continuing operations core operating income expected to be broadly in line with PY;
excluding the Gleevec®/Glivec® Gx impact, the growth is expected to be in the mid-teens
52 | Novartis Q4 and FY 2015 Results | January 27, 2016 | Novartis Investor Presentation
1 All in cc, barring unforeseen events
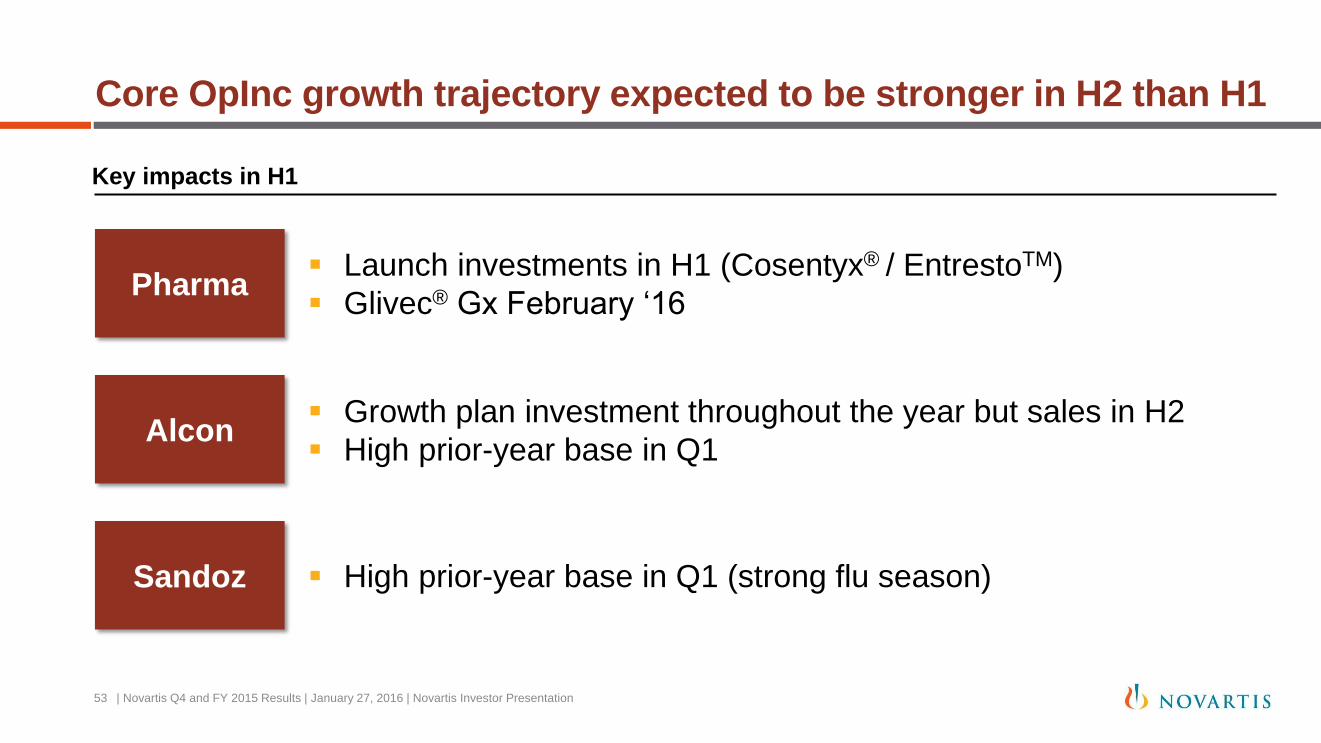
Core OpInc growth trajectory expected to be stronger in H2 than H1
Key impacts in H1
Pharma Launch investments in H1 (Cosentyx® / EntrestoTM)
Glivec® Gx February ‘16
Alcon Growth plan investment throughout the year but sales in H2
High prior-year base in Q1
Sandoz High prior-year base in Q1 (strong flu season)
| Novartis Q4 and FY 2015 Results | January 27, 2016 | Novartis Investor Presentation 53

Key assumptions in 2016
Core tax FY core tax rate in the mid-teens consistent with prior years
FX impact FY: -3% in sales and -5% in core operating income
Q1: -5% in sales and -7% in core operating income
Core
associated
companies
Higher core income as the OTC JV grows and 2015 included a negative true-
up on 2014 Roche income
| Novartis Q4 and FY 2015 Results | January 27, 2016 | Novartis Investor Presentation 54
Core NFI
Expense of approx. USD 0.8bn to 0.9bn, vs. USD 0.7bn in 2015; increase
driven by higher hedging costs due to increased exposure and volatility in
emerging market currencies

Today’s announced synergy plans expected to deliver over USD 1
billion in annual cost savings by 2020
| Novartis Q4 and FY 2015 Results | January 27, 2016 | Novartis Investor Presentation 55
≥ USD 1bn
2020 2019 2018 2017 2016
Expected one-time costs
Expected cost synergies
Operating income (in USD bn)
Illustrative
USD 1.4bn over 5 years
≥ USD 1bn per year by 2020

Group review Joseph Jimenez, Chief Executive Officer
• 2015 Review
• Taking our strategy forward in 2016
Financial review Harry Kirsch, Chief Financial Officer
Pharmaceuticals review David Epstein, Division Head, Novartis
Pharmaceuticals
Closing remarks Joseph Jimenez, Chief Executive Officer
Q&A session Executive team
| Novartis Q4 and FY 2015 Results | January 27, 2016 | Novartis Investor Presentation 56
Agenda

FY FY Change vs. PY
2015 2014 % USD % cc
Net Sales 30.4 31.8 -4 6
Core Operating Income 9.4 9.5 -1 14
Operating Income 7.6 8.5 -10 5
Core Operating Income Margin 30.9% 29.9%
Operating Income Margin 25.0% 26.6%
Pharmaceuticals Division delivered strong growth (cc) in both
sales and core operating income
(in USD bn)
| Novartis Q4 and FY 2015 Results | January 27, 2016 | Novartis Investor Presentation 57
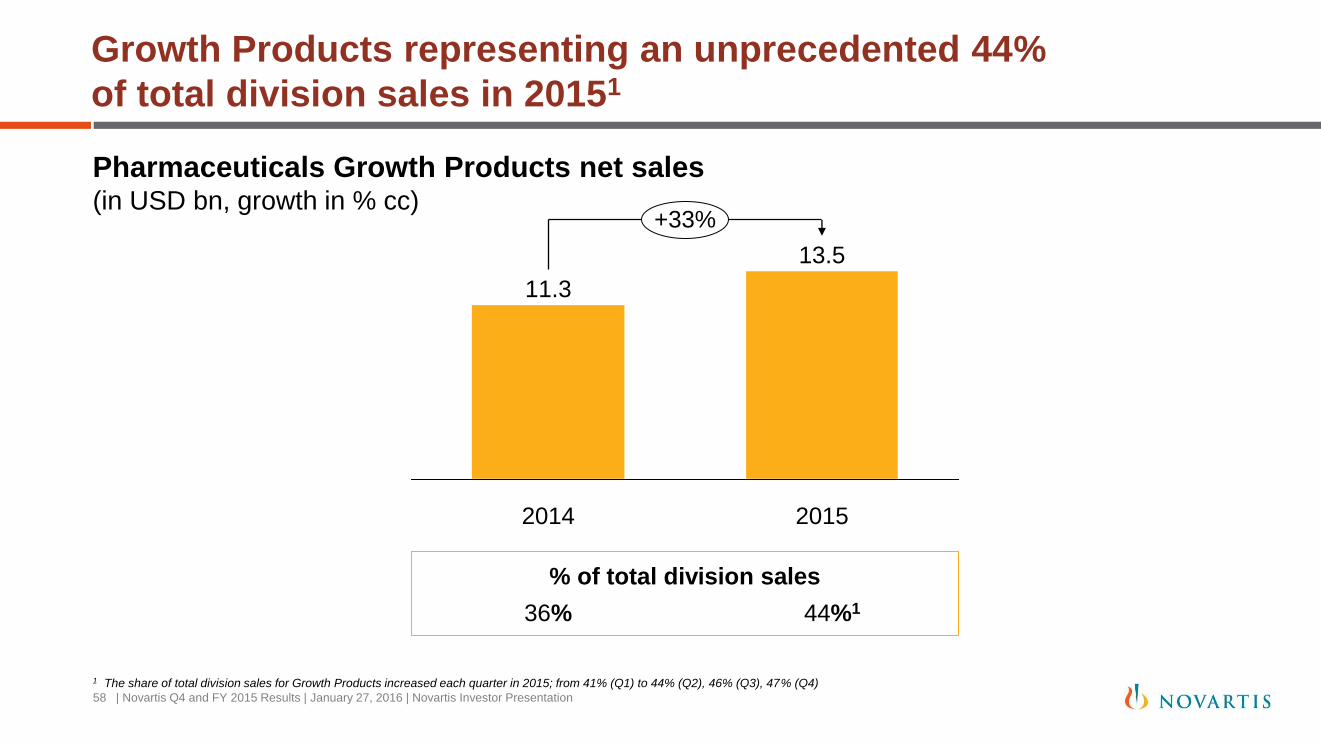
Pharmaceuticals Growth Products net sales (in USD bn, growth in % cc)
% of total division sales
36% 44%1
2015
+33%
2014
13.5
11.3
Growth Products representing an unprecedented 44%
of total division sales in 20151
| Novartis Q4 and FY 2015 Results | January 27, 2016 | Novartis Investor Presentation 58
1 The share of total division sales for Growth Products increased each quarter in 2015; from 41% (Q1) to 44% (Q2), 46% (Q3), 47% (Q4)
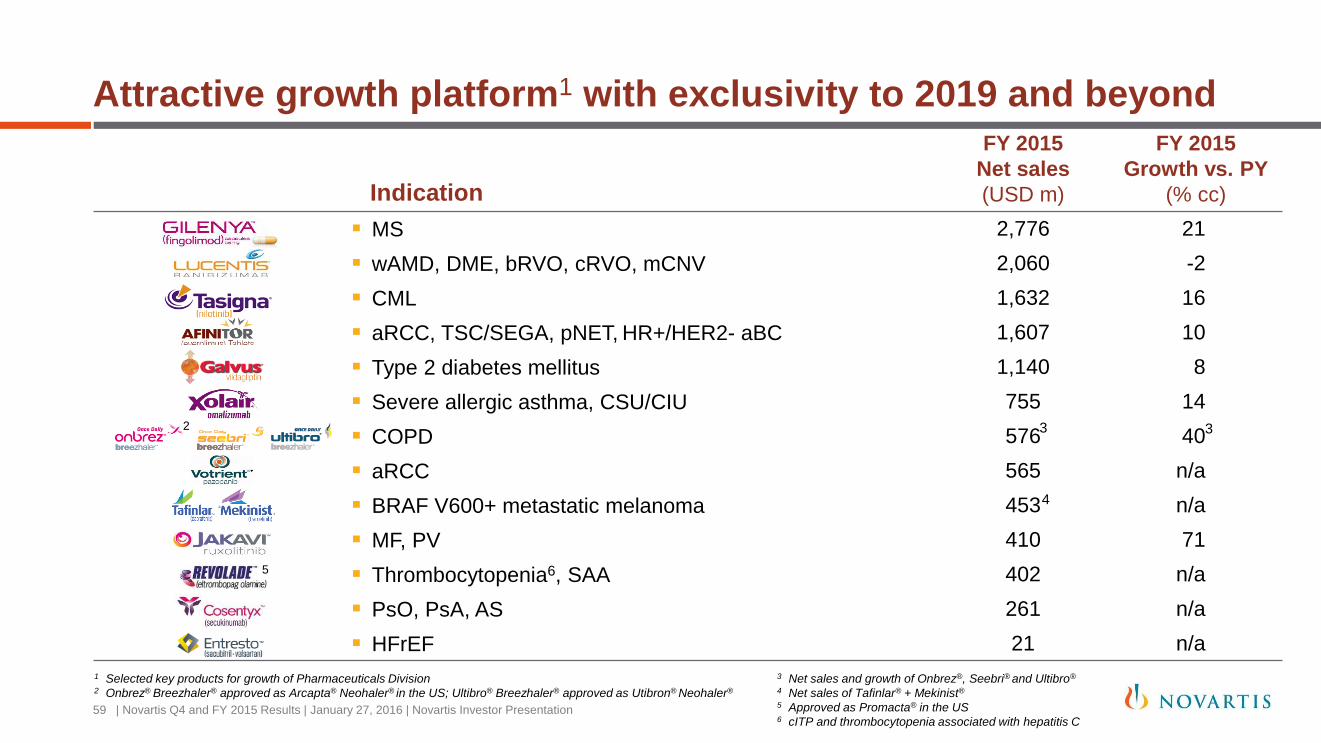
Indication
FY 2015
Net sales
(USD m)
FY 2015
Growth vs. PY
(% cc)
MS 2,776 21
wAMD, DME, bRVO, cRVO, mCNV 2,060 -2
CML 1,632 16
aRCC, TSC/SEGA, pNET, HR+/HER2- aBC 1,607 10
Type 2 diabetes mellitus 1,140 8
Severe allergic asthma, CSU/CIU 755 14
COPD 576 40
aRCC 565 n/a
BRAF V600+ metastatic melanoma 453 n/a
MF, PV 410 71
Thrombocytopenia6, SAA 402 n/a
PsO, PsA, AS 261 n/a
HFrEF 21 n/a
Attractive growth platform1 with exclusivity to 2019 and beyond
1 Selected key products for growth of Pharmaceuticals Division 2 Onbrez® Breezhaler® approved as Arcapta® Neohaler® in the US; Ultibro® Breezhaler® approved as Utibron® Neohaler®
3 3
3 Net sales and growth of Onbrez®, Seebri® and Ultibro®
4 Net sales of Tafinlar® + Mekinist®
5 Approved as Promacta® in the US 6 cITP and thrombocytopenia associated with hepatitis C
4
2
| Novartis Q4 and FY 2015 Results | January 27, 2016 | Novartis Investor Presentation 59
5
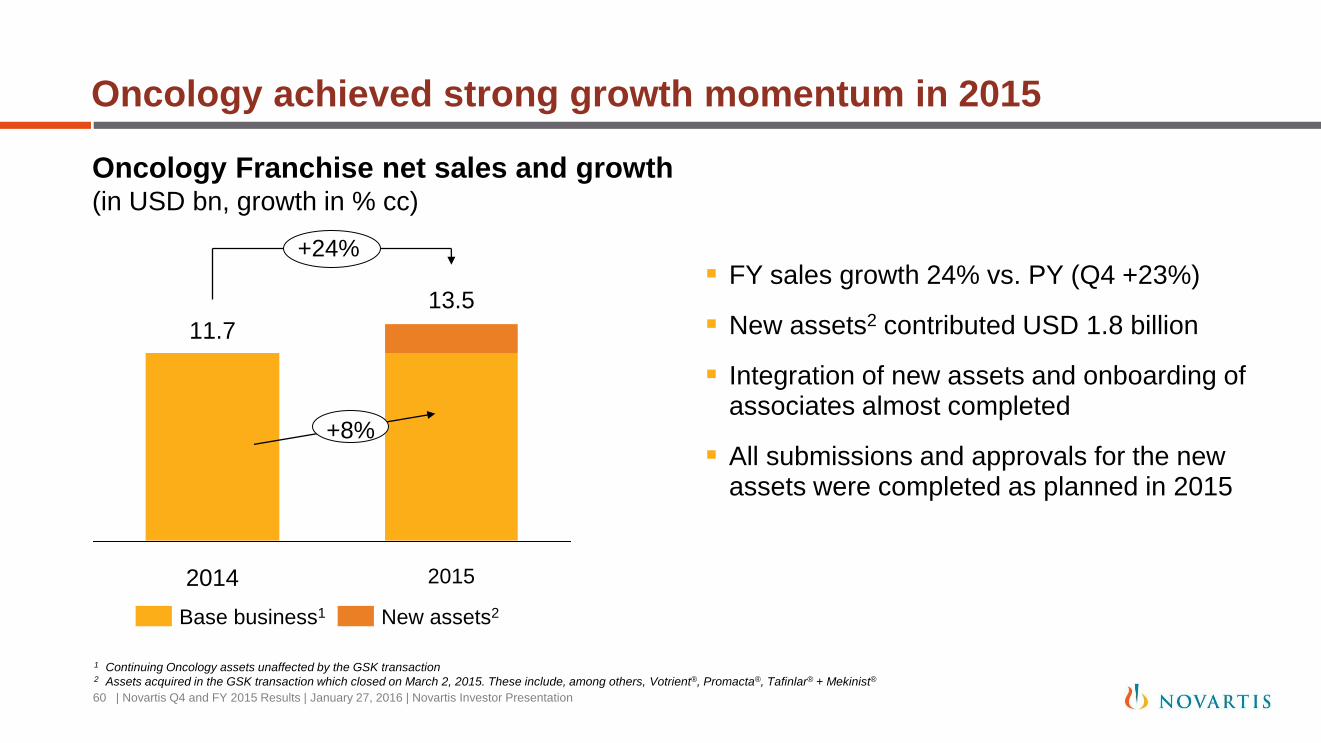
Oncology achieved strong growth momentum in 2015
Oncology Franchise net sales and growth (in USD bn, growth in % cc)
FY sales growth 24% vs. PY (Q4 +23%)
New assets2 contributed USD 1.8 billion
Integration of new assets and onboarding of associates almost completed
All submissions and approvals for the new assets were completed as planned in 2015
Base business1 New assets2
1 Continuing Oncology assets unaffected by the GSK transaction 2 Assets acquired in the GSK transaction which closed on March 2, 2015. These include, among others, Votrient®, Promacta®, Tafinlar® + Mekinist®
13.5
2015 2014
11.7
+24%
+8%
| Novartis Q4 and FY 2015 Results | January 27, 2016 | Novartis Investor Presentation 60

Jakavi® continues solid growth trajectory
61
FY sales growth 71% vs. PY (Q4 +59%)
Continued in-market growth of MF
indication across geographies
Contribution from PV sales mainly from
DE and JP
Approval for PV in Canada (Nov ’15)
Jakavi® sales1 (ex-US) (in USD m)
| Novartis Q4 and FY 2015 Results | January 27, 2016 | Novartis Investor Presentation
2012
PV approval
(EU, Mar 2015)
0
25
50
75
100
125
Q2 Q1 Q3 Q4
1 Sales growth vs. PY is in cc. Novartis licensed ruxolitinib (Jakavi®) from Incyte Corporation. Ruxolitinib is marketed in the US by Incyte under the brand name Jakafi®
2013
Q2 Q1 Q3 Q4
2014
Q2 Q1 Q3 Q4
2015
Q2 Q1 Q3 Q4
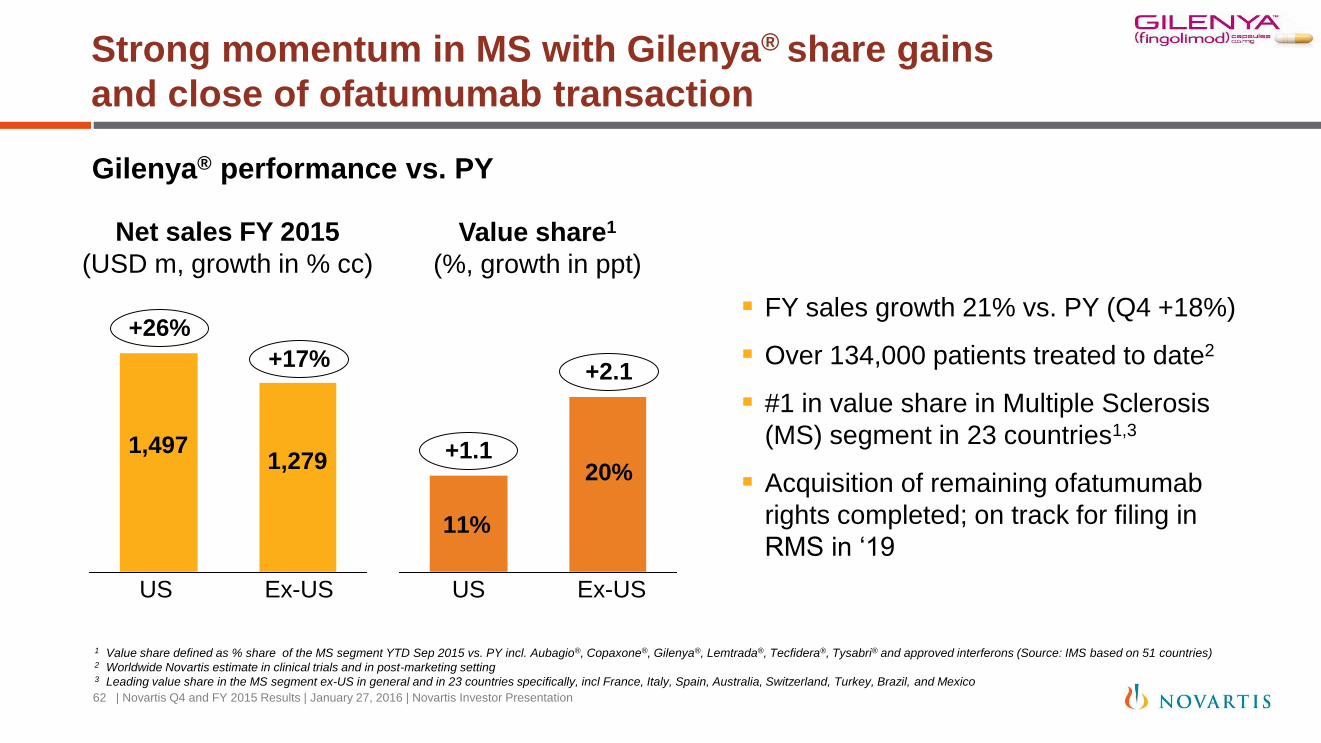
Gilenya® performance vs. PY
Net sales FY 2015
(USD m, growth in % cc)
FY sales growth 21% vs. PY (Q4 +18%)
Over 134,000 patients treated to date2
#1 in value share in Multiple Sclerosis
(MS) segment in 23 countries1,3
Acquisition of remaining ofatumumab
rights completed; on track for filing in
RMS in ‘19
Strong momentum in MS with Gilenya® share gains
and close of ofatumumab transaction
62 | Novartis Q4 and FY 2015 Results | January 27, 2016 | Novartis Investor Presentation
1 Value share defined as % share of the MS segment YTD Sep 2015 vs. PY incl. Aubagio®, Copaxone®, Gilenya®, Lemtrada®, Tecfidera®, Tysabri® and approved interferons (Source: IMS based on 51 countries) 2 Worldwide Novartis estimate in clinical trials and in post-marketing setting 3 Leading value share in the MS segment ex-US in general and in 23 countries specifically, incl France, Italy, Spain, Australia, Switzerland, Turkey, Brazil, and Mexico
Value share1
(%, growth in ppt)
US
+17%
+26%
Ex-US
1,497 1,279
+2.1
20% +1.1
US Ex-US
11%

Entresto™ started slowly in the US, but...
| Novartis Q4 and FY 2015 Results | January 27, 2016 | Novartis Investor Presentation 63
Sales of USD 21m (FY) and USD 5m (Q4)
US launch in 2015:
• Sales specialists interact with ~26k
physicians equivalent to 30-40% of Heart
Failure potential
• Very limited access in 2015; prior
authorization was required
• >4,850 prescribers2 and >11,000 patients3
Demand in the US1
(in weekly Rx from launch)
1 IMS weekly data from launch of each product 2 IMS NPA, Dec ‘15 3 IMS Custom Patient Count Report, Dec ‘15
0
2,000
4,000
6,000
8,000
WK
1
WK
2
WK
3
WK
4
WK
5
WK
6
WK
7
WK
8
WK
9
WK
10
WK
11
WK
12
WK
13
WK
14
WK
15
WK
16
WK
17
WK
18
WK
19
WK
20
WK
21
WK
22
WK
23
WK
24
WK
25
WK
26
WK
27
# of week Post FDA Approval
Entresto™ Xarelto® Corlanor®
Praluent® Repatha™

...patient access has substantially improved in
both Medicare and commercial segments...
| Novartis Q4 and FY 2015 Results | January 27, 2016 | Novartis Investor Presentation 64
Patient access – Medicare
(% coverage over time)
Patient access – Commercial insurance (% coverage over time)
Not Covered (i.e. not listed on formulary) On formulary; higher co-pay On formulary; lower co-pay
1 Patient access calculated based on EntrestoTM inclusion in national insurance plan formularies. Patient access is total number of patients whose insurance plan includes EntrestoTM on formulary (whether or not a heart
failure patient). Percentage shown is calculated as number of patients covered by an insurance plan with EntrestoTM on formulary, divided by all patients covered by insurance plans (Medicare and Commercial respectively)
100 91
30
26
9
44
0%
25%
50%
75%
100%
Jul 15 Oct 15 Jan 16
81
35 22
22
21
19
43 57
0%
25%
50%
75%
100%
Jul 15 Oct 15 Jan 16
~21m
covered lives1
~109m
covered lives1
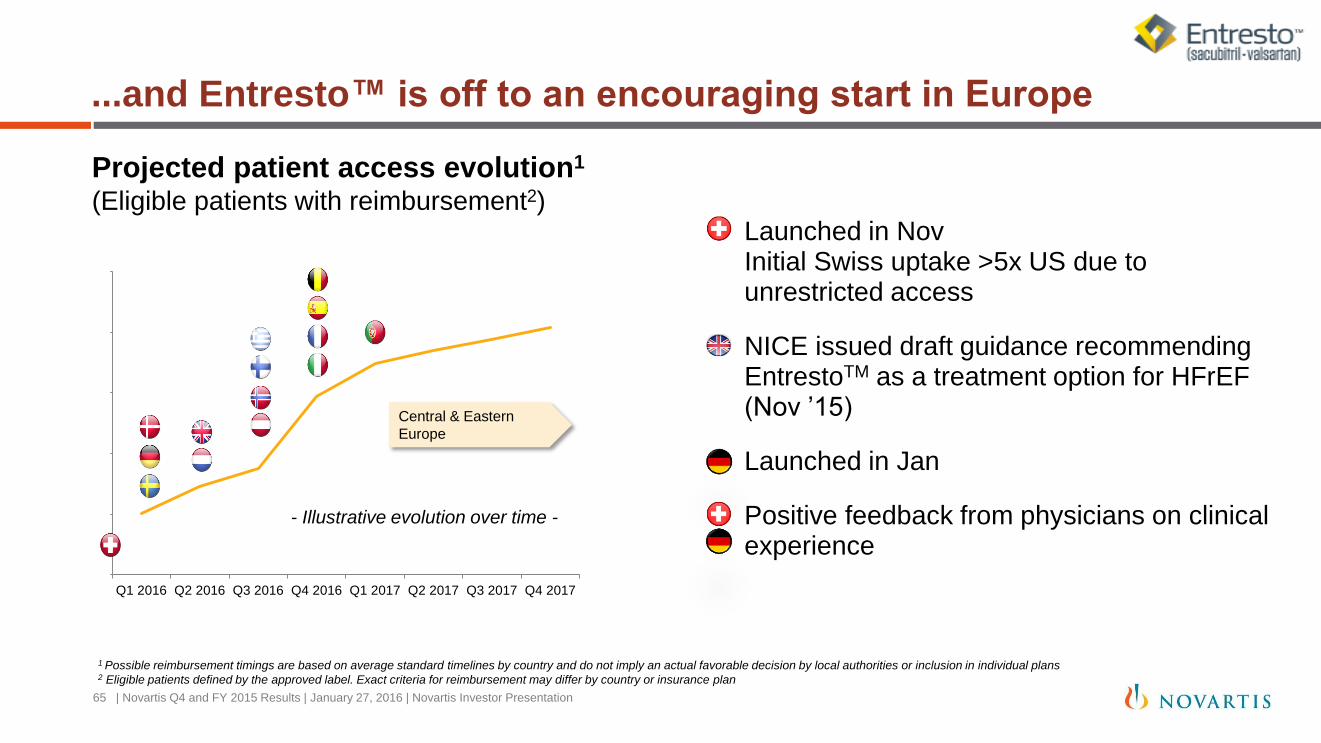
...and Entresto™ is off to an encouraging start in Europe
| Novartis Q4 and FY 2015 Results | January 27, 2016 | Novartis Investor Presentation 65
Launched in Nov Initial Swiss uptake >5x US due to unrestricted access
NICE issued draft guidance recommending EntrestoTM as a treatment option for HFrEF (Nov ’15)
Launched in Jan
Positive feedback from physicians on clinical experience
Projected patient access evolution1
(Eligible patients with reimbursement2)
-
0.5
1.0
1.5
2.0
2.5
Q1 2016 Q2 2016 Q3 2016 Q4 2016 Q1 2017 Q2 2017 Q3 2017 Q4 2017
Central & Eastern
Europe
- Illustrative evolution over time -
1 Possible reimbursement timings are based on average standard timelines by country and do not imply an actual favorable decision by local authorities or inclusion in individual plans 2 Eligible patients defined by the approved label. Exact criteria for reimbursement may differ by country or insurance plan

Cosentyx® gains share in psoriasis across the world
| Novartis Q4 and FY 2015 Results | January 27, 2016 | Novartis Investor Presentation 66
0%
2%
4%
6%
8%
10%
12%
14%
Va
lue
sh
are
in
Pso
ria
sis
(%
)
Global sales of USD 261m (FY) and USD 121m (Q4)
>15,000 patients worldwide
Share of biologic naive patients remains high in EU, i.e. 40-55% in AT, CH, DE & UK
Approval for pustular psoriasis in JP
Value share in psoriasis segment1
(% value share per country)
1 Value share in psoriasis segment, defined as systemic therapies and consisting of Cosentyx®,
Humira®, Enbrel®, Remicade®, Stelara®, Acitretin, Ciclosporin, Methotrexate, Etretinate (only in JP) and
Otezla® (only in US) (Source: IMS PADDS)
Germany
US
Japan

Cosentyx® approved for AS and PsA in US and EU1
| Novartis Q4 and FY 2015 Results | January 27, 2016 | Novartis Investor Presentation 67
0.8 0.9
1.0 1.2
1.5
1.9
0.0
0.5
1.0
1.5
2.0
2.5
3.0
Oct'10 Oct'11 Oct'12 Oct'13 Oct'14 Oct'15
Cimzia® Simponi® Remicade® Humira® Enbrel®
1.0 1.1 1.3
1.4
1.9
2.5
0.0
0.5
1.0
1.5
2.0
2.5
3.0
Oct'10 Oct'11 Oct'12 Oct'13 Oct'14 Oct'15
Otezla® Stelara® Cimzia® Simponi® Remicade® Humira® Enbrel®
The first and only IL-17A approved for AS & PsA1
First experience in EU, after DE launch (Dec)
Significant opportunity in high growth segments
• ~350k patients currently on biologics3
• Up to 40% of patients on biologics do not respond
adequately4
• Penetration of biologics is <20%5
US market sales and growth2
(USD bn, CAGR %)
1 Approvals granted in Nov ‘15 (EU) and Jan ’16 (US) for both AS and PsA. PsA approval in JP in Dec ‘14 2 Moving Annual Total (MAT) of 12-month data ending the month of October. PsA and AS segments defined by listed biologics 3 IMS sales units data (US, DE, FR, IT, SP, UK) 4 Dougados M et al., The Lancet. 2011; 377: 2127–37
5 Estimate based on Gelfand, 2005 (PsA prevalence), Reveille JD et al. 2013 (AS prevalence), Decision Resources 2013 (PsA
treated pool) and Datamonitor 2008 (AS treated pool)
Ankylosing spondylitis (AS)
Psoriatic arthritis (PsA)

100
75
50
25
0
0 12 24 36 48 60 72
Time, months
Su
rviv
al, %
Midostaurin
Placebo
PKC412: 1st targeted therapy to show overall survival (OS)
benefit in FLT3mut AML patients
Overall survival in FLT3mut AML1 (% probability of survival)
P value: 0.0074
HR (95% CI): 0.77
1 Stone RM, et al. 2015, oral presentation, ASH 2015 2 J. Gotlib & al. (Data presented at oral presentation ASH 2015). Full data to be published in 2016
OS improved by 23%
One-third of AML patients are FLT3mut; estimated at 25-30k patients worldwide
ASM is a rare disease of the mast cells and a 2nd potential indication for PKC412 2
US/EU submissions expected in H1 2016
| Novartis Q4 and FY 2015 Results | January 27, 2016 | Novartis Investor Presentation 68

Progressing our late stage pipeline across disease areas
| Novartis Q4 and FY 2015 Results | January 27, 2016 | Novartis Investor Presentation 69
QAW039 AMG 334 RLX030 ABL001
Severe asthma Migraine Acute heart failure CML
Ph III LUSTER1-2 trials
1,692 patients planned
FPFV achieved (Dec)
Filing planned 2019
Two Ph III migraine
prevention trials ongoing
~1,400 patients
Amgen collaboration1
RELAX-AHF2
6,800 patients
Recruitment ongoing
Filing planned 2017
Unique mode of action2
80+ patients in FIH
study
Filing planned ≥2020
1 The collaboration includes co-development and co-commercialization of AMG 334 (migraine) and CNP520 (Alzheimer’s disease) 2 First allosteric BCR-ABL inhibitor in clinical development

H1 2016
Cosentyx®
Cosentyx®
Ilaris®
Afinitor®
PKC412
Tafinlar® + Mekinist®
FDA action in ankylosing spondylitis
FDA action in psoriatic arthritis
Regulatory filings in EU and US for hereditary periodic fevers
FDA action for advanced non-functional NET (GI / Lung origin)
Regulatory filings in US and EU for ASM and AML
PMDA action in BRAF V600+ metastatic melanoma
H2 2016
Expected selected highlights from Pharmaceuticals newsflow
BYM338
Tafinlar® + Mekinist®
Votrient®
Afinitor®
LEE011 (+ letrozole)
Regulatory filings in EU and US for sporadic inclusion body myositis
Regulatory filings in US and EU for BRAF V600+ NSCLC
Regulatory filings in US and EU for adjuvant RCC
EU and PMDA action in advanced non-functional NET
Submission1 in US 1st line HR+ HER2(-) mBC
| Novartis Q4 and FY 2015 Results | January 27, 2016 | Novartis Investor Presentation 70
1 Submission late 2016 or early 2017 with final analysis based on the predefined progression free survival (PFS) data of the MONALEESA-2 trial, provided that events occur no later than early Q3

Group review Joseph Jimenez, Chief Executive Officer
• 2015 Review
• Taking our strategy forward in 2016
Financial review Harry Kirsch, Chief Financial Officer
Pharmaceuticals review David Epstein, Division Head, Novartis
Pharmaceuticals
Closing remarks Joseph Jimenez, Chief Executive Officer
Q&A session Executive team
| Novartis Q4 and FY 2015 Results | January 27, 2016 | Novartis Investor Presentation 71
Agenda

1
2
3
4
5
Deliver strong
Financial
Results
Strengthen
Innovation
Improve
Alcon
performance
Capture
Cross-Divisional Synergies
Build a
High-Performing Organization
Execute on Entresto™ and Cosentyx® launches
Secure key biosimilars filings
Maintain sales and core operating income, while absorbing Gleevec®/Glivec® impact and investing for future growth
Execute Alcon plan to return to growth
Implement organization restructuring
Execute NBS plans
Strengthen quality, compliance and develop the best talent
Our 2016 Priorities
| Novartis Q4 and FY 2015 Results | January 27, 2016 | Novartis Investor Presentation 72
In summary
A growth plan for Alcon
Next phase of our strategy to increase focus and efficiency
A stronger, better company going forward
| Novartis Q4 and FY 2015 Results | January 27, 2016 | Novartis Investor Presentation 73

Q&A

Appendix

Afinitor® TSC5 seizures
PKC412 ASM8
Gilenya® CIDP15
Lucentis®
CNV7 BYM338
sIBM2
Ilaris®
Hereditary periodic fevers CTL019
Pediatric acute lymphoblastic leukemia
Tasigna® CML10 treatment free remission
ACZ885 Sec. prev. CV events13
KAE609 Malaria
LCI699 Cushing’s disease
Afinitor®
DLBCL4
CAD106 Alzheimer’s disease
BAF312 SPMS18
QAW039 Asthma
Entresto™
Heart failure (PEF)19
HSC835 Stem cell transplantation
BGJ398 Solid tumors
LJM716 Solid tumors
Lucentis®
ROP17
Signifor® LAR11
Cushing’s disease
2020
RLX030 Acute heart failure
OAP030c
nAMD12
FCR001 Renal transplantation
BKM120 + fulv
mBC1 ER+ post Al and mTOR inhibitor 3rd line
CTL019 DLBCL4
INC280 NSCLC9
EGF816 Solid tumors
KAF156 Malaria
LEE011 + ltzb
HR+, HER2 (-) postmenopausal adv. BC1 1st line
CJM112 Immune disorders
Arzerra®
CLL6 (relapse)
Tafinlar® + Mekinist®
BRAF V600+ NSCLC9
Arzerra®
NHL (refractory)14 Votrient®
Renal cell carcinoma (adjuvant)
Tafinlar® + Mekinist® BRAF V600+ Melanoma (adjuvant)
ABL001 CML10
ASB183 Solid and hematologic tumors
QVM149 Asthma
QMF149 Asthma
LEE011+ fulv HR+, HER2 (-) postmenopausal
adv. BC1 1st /2nd line
LEE011+ tmx + gsn/or NSAI + gsn HR+, HER2 (-) premenopausal
Adv. BC1 1st line
EMA401
Neuropathic pain
Zykadia™ ALK+ adv. NSCLC9
(1st line, treatment naive)
Zykadia™ ALK+ adv. SCLC9
(Brain metastases)
Cosentyx®
nrAxSpA16
CNP520 Alzheimer’s disease
BYL719 + fulv HR+, HER2 (-) postmenopausal
Adv. BC1 2nd line
2018 2017 2016
BKM120 + fulv
mBC1 ER+ AI resistant/mTOR naive 2nd line
PKC412 AML3
Planned filings 2016 to 2020a
| Novartis Q4 and FY 2015 Results | January 27, 2016 | Novartis Investor Presentation 76
2019
LJN452 NASH21
a) AMG 334 is not included in this view. AMG 334 is part of the global collaboration with Amgen to
commercialize and develop neuroscience treatments (announced in September 2015).
b) Submission anticipated late 2016 or early 2017.
c) Also known as Fovista® (pegpleranib) and E10030. This product is being developed by Ophthotech Corp.
Ophthotech has licensed ex-US commercialization rights to Novartis under a Licensing and
Commercialization Agreement.
d) Novartis acquired all remaining rights to GSK’s ofatumumab (OMB157) in December 2015.
New molecule
New indication
New formulation
Combination Abbreviations: fulv fulvestrant ltz letrozole tmx tamoxifen gsn goserelin NSAI Non-steroidal aromatase inhibitor
1. Breast cancer
2. Sporadic inclusion body myositis
3. Acute myeloid leukemia
4. Diffuse large B-cell lymphoma
5. Tuberous sclerosis complex
6. Chronic lymphocytic leukemia
7. Choroidal neovascularization (CNV) secondary
to conditions other than macular degeneration
and pathologic myopia
8. Aggressive systemic mastocytosis
9. Non-small cell lung cancer
10. Chronic myeloid leukemia
11. Long-acting release
12. Neovascular age-related macular
degeneration
13. Secondary prevention of cardiovascular events
14. Non-Hodgkin’s lymphoma
15. Chronic inflammatory demyelinating
polyradiculoneuropathy
16. Non-radiographic axial spondyloarthritis
17. Retinopathy of prematurity
18. Secondary progressive multiple sclerosis
19. Preserved ejection fraction
20. Relapsing multiple sclerosis
21. Non-alcoholic steatohepatitis
22. Chronic spontaneous urticaria / Inducible
urticaria
BYM338 Hip fracture
QGE031 CSU/IU22
QAX576 Allergic diseases
BKM120 Solid tumors
LEE011 Solid tumors
BYM338 Sarcopenia
PIM447 Hematologic tumors
QAW039 Atopic dermatitis
Tafinlar® + Mekinist®
BRAF V600+ Colorectal cancer
BYL719 Solid tumors
Entresto™
Post-acute myocardial infarction
VAY736 Primary Sjoegren’s syndrome
OMB157d
RMS20

Key definitions and trademarks
This presentation contains several important words or phrases that we define as below: aBC: advanced Breast Cancer
ALK+ NSCLC: Anaplastic Lymphoma Kinase positive Non-Small Cell Lung Cancer
AML: Acute Myeloid Leukemia
ASM: Aggressive Systemic Mastocytosis
Approval: In Pharmaceuticals and Alcon in US and EU; each indication and regulator combination counts
as approval; excludes label updates, CHMP opinions alone and minor approvals
aRCC: advanced Renal Cell Cancer
AS: Ankylosing Spondylitis
Base business: continuing Oncology assets unaffected by the GSK transaction
cc: constant currencies
cITP: chronic Immune Thrombocytopenia
CML: Chronic Myeloid Leukemia
COPD: Chronic Obstructive Pulmonary Disease
CSU / CIU: Chronic Spontaneous Urticaria / Chronic Idiopathic Urticaria
DME: Diabetic Macular Edema
Growth Products: Products launched in a key markets (EU, US, Japan) in 2010 or later, or products with
exclusivity in key markets until at least 2019 (except Sandoz, which includes only products launched in the
last 24 months). They include the acquisition effect of the GSK oncology assets
HFrEF: Heart Failure with Reduced Ejection Fraction
HR+/HER2-: Hormone Receptor positive / Human Epidermal growth factor Receptor 2 negative
mCNV: Choroidal Neovascularization (CNV) secondary to pathologic myopia (myopic CNV)
MF: Myelofibrosis
MS: Multiple Sclerosis
New assets: Assets acquired in the GSK transaction which closed on March 2, 2015
NSCLC: Non-Small Cell Lung Cancer
OS: Overall Survival
PFS: Progression Free Survival
pNET: pancreatic Neuroendocrine Tumor
PsA: Psoriatic Arthritis
PsO: Psoriasis
PY: Prior Year
PV: Polycythemia Vera
RMS: Relapsing Multiple Sclerosis
RVO: Retinal Vein Occlusion
SAA: Severe Aplastic Anemia
TSC/SEGA: Tuberous Sclerosis Complex / Subependymal Giant Cell Astrocytoma
wAMD: wet (neovascular) Age-related Macular Degeneration
Trademarks
Aubagio® and Lemtrada® are registered trademarks of Genzyme Corporation
Cimzia® is a registered trademark of UCB PHARMA
Copaxone® is a registered trademark of Teva Pharmaceutical Industries Ltd
Corlanor®, Enbrel® and Repatha™ are registered trademarks of Amgen Inc.
Humira® is a registered trademark of AbbVie Ltd.
Jardiance® is a registered trademark of Boehringer Ingelheim
Otezla® is a registered trademark of Celgene Corporation
Praluent® is a registered trademark of Sanofi
Stelara® and Remicade® are registered trademarks of Janssen Biotech, Inc.
Tecfidera® and Tysabri® are registered trademarks of Biogen MA Inc.
Xarelto® is a registered trademark of Bayer Healthcare AG
77 | Novartis Q4 and FY 2015 Results | January 27, 2016 | Novartis Investor Presentation