Q4 & Full Year FY2020 Review Note
16
27 th June 2020 | Ahmedabad Q4 & Full Year FY2020 Review Note
Transcript of Q4 & Full Year FY2020 Review Note

27th June 2020 | Ahmedabad
Q4 & Full Year FY2020
Review Note

2
Safe harbour statement
Certain statements contained in this document may be statements of future expectations and
other forward looking statements that are based on management‘s current view and
assumptions and involve known and unknown risks and uncertainties that could cause actual
results, performance or events to differ materially from those expressed or implied in such
statements. None of Arvind Limited or any of its affiliates, advisors or representatives shall have
any liability whatsoever (in negligence or otherwise) for any loss howsoever arising from any use
of this document or its content or otherwise arising in connection with this document. This
document does not constitute an offer or invitation to purchase or subscribe for any shares and
neither it nor any part of it shall form the basis of or be relied upon in connection with any
contract or commitment whatsoever.

3
Agenda
• Q4 & FY20 Summary Financial Performance
• Business discussion
• Impact of Covid-19, and outlook ahead

4
INR Crs Jan-Feb FY20 11 Month Mar 2020 FY2020
Revenues +6.7% +8% -42.0% +3% (7369 cr)
Textiles +10.5% +10% -40% +5% (6205 cr)
Advanced Materials
+7.4% +20% -38% +13% (713 cr)
EBITDA margin 9.6% 9.4% 9.8% 9.4% (692 cr)
PAT (before exception items)
-48% (146 cr)
Net Debt 2371 cr (2619 cr Mar’19)
Executive summary of results and highlights
• Textile and AMD revenue growth- Jan & Feb and YTD Feb was tracking as planned
• Stoppage of production and logistics in second half of March resulted in 42% drop for month
• Management estimates of loss of Rs. 250 cr on topline, and Rs 75 cr in EBITDA, in addition to Rs. 36 crores of exceptional losses on FX, bad debts, impairments
• Despite severe setback in March, Net debt reduced by 248 crs during the year
• The working capital turns sharply improved from 3.9 in FY19 to 5.1 in FY20

5
Q4 and FY20: Profit and Loss summary
All figures in INR Crs Q4 FY20 Q4 FY19 Change FY20 FY19 Change
Revenues from Operations 1,642 1,859 -12% 7,369 7,142 3%
EBIDTA 158 184 -14% 692 717 -3%
Profit Before Tax 37 79 -53% 220 345 -36%
Profit After Tax 35 68 -49% 146 283 -48%
Less : Exceptional Item 47 4 50 46
Net Profit -12 64 -119% 96 237 -60%
Exceptional item includes • Retrenchment compensation – Rs 19 Cr, • MTM Forex Losses (cancellation of contracts resulting from reduced export sales given Covid 19) – Rs 11.4 Cr, • Impairment of Investment in subsidiaries – Rs 11.8 Cr, • Write off in receivables and others due to Covid-19 – Rs 13.2 Cr • Reversal of GST Write off – Rs 4.9 Cr )

6
Q4 and FY20 performance by segments
Note: One time Write off of Rs 34 cr related to withdrawal of MEIS
Rs Cr
Business Revenue EBIDTA EBIDTA% ROCE % Revenue EBIDTA EBIDTA% ROCE %
Textiles 1352 126 9.3% 8.0% 1486 156 10.5% 11.8%
Advanced Material 179 24 13.4% 15.3% 198 25 12.5% 15.1%
Others 117 -9 177 18
Un Allocable 0 13 0 -12
Other Income 0 9 -2 20
Inter segment -7 4 -1 -3
Total 1642 166 10.1% 6.9% 1859 204 11.0% 10.2%
Q4 FY1920 Q4 FY1819
Rs Cr
Business Revenue EBIDTA EBIDTA% ROCE % Revenue EBIDTA EBIDTA% ROCE %
Textiles 6205 664 10.7% 12.9% 5919 671 11.3% 13.4%
Advanced Material 713 92 12.9% 14.6% 630 65 10.4% 11.6%
Others 536 0 614 35
Un Allocable -35 -55
Other Income 55 84
Inter segment -51 5 -21 0
Total 7403 782 10.6% 9.4% 7142 800 11.2% 13.6%
Less : One time Write Off -34 -34 0 0
Reported Number 7369 748 8.8% 7142 800 10.2%
FY1920 FY1819
Covid-19 disruptions in Q4 estimated to cause loss of Rs. 250 cr on topline,
and Rs 75 cr in EBITDA

7
Consolidated Balance Sheet, as at March 31st 2020
Rs Cr 31st Mar 20 31st Mar 19
Shareholders' Fund
Share Capital 259 259
Reserves & Surplus 2450 2492
Minority Interest 58 86
long Term Borrowings 1018 935
Short Term Borrowings 1175 1601
Long Term Liability Maturing in one year 262 164
Borrowings 2455 2700
Lease Liabilities (Current + Non Current) 185 0
Other Liabilities 1759 1797
Total 7165 7334
Assets
Fixed Assets 3800 3683
ROU Assets 148 0
Non Current Investments 90 78
Long term Loans & Advances 1 1
Other Non Current Assets 89 80
Current Assets 3038 3490
Total 7165 7334
As at
Focused
improvement
of working
capital turn
helped reduce
borrowing

8
Key indicators – FY20 Vs FY19
EPS
10.9
5.6
FY19 FY20
Debt / Equity
1.00.9
FY19 FY20
Debt / EBIDTA
3.3 3.2
FY19 FY20
10.2%
FY19 FY20
8.8%
ROCE
FY19 FY20
5.4%
10.3%
ROE
* Net Debt is considered for Debt / EBIDTA

9
Agenda
• Q4 & FY19 Summary Financial Performance
• Business discussion
• Impact of Covid-19, and outlook ahead

10
1,672 1,634
2,353 2,164
1,385 1,648
1,042 1,309
-534 -549-1,000
0
1,000
2,000
3,000
4,000
5,000
6,000
7,000
Rev, Rs Cr
FY19 FY20
5,9196,205
Denim
Garments
Others
Wovens
Inter Business
Fabric top-line declined, garmenting grew EBITDA margin saw slight decline
* * Textiles figures are Intrinsic numbers, excluding non recurring write off of Rs34 Cr on account of withdrawal of MEIS from Mar’19
671 664
FY19
EBIDTA, Rs Cr
FY20
FY2020: Modest overall revenue growth, driven by garment volumes
• Fabric volumes lower by 2% (80M m for Denim and 101M m for Wovens)
• Garment volumes grew from 34 M Pcs to 42 M Pcs
* Others Include Voiles, Knits and trading Sales

11
Key Textile business parameters for Q4 & FY20
Qtrly Q4 FY20 Q4 FY19 Q4 FY20 Q4 FY19
Total Volume (Mn Mtrs) 17 22 25 34
Export proportion 50% 47% 20% 31%
Avg Prices 184 188 156 170
9 Monthly FY20 FY19 FY20 FY19
Total Volume (Mn Mtrs) 80 85 125 138
Export proportion 47% 49% 23% 30%
Avg Prices 190 189 168 171
Period Q4 FY20 Q4 FY19 FY20 FY19
Cotton Cost (Rs/Kg) 112 122 118 118
WovenDenim
lizaline.maharana
Highlight
lizaline.maharana
Highlight
lizaline.maharana
Highlight
lizaline.maharana
Highlight
lizaline.maharana
Highlight
lizaline.maharana
Highlight
lizaline.maharana
Highlight
12
EBITDA Margin (Rs Cr)Revenue (Rs Cr)
Healthy top-line growth
AMD continues to clock robust revenue growth with steadily improving margins
630713
FY19 FY20
+13%
65
91
FY19 FY20
Coupled with strong profitability
• Operating leverage from scaling up of key AMD businesses
• Improved realisation resulting from tighter operating discipline, and improved product mix
13
Agenda
• Q4 & FY19 Summary Financial Performance
• Business discussion
• Impact of Covid-19, and outlook ahead

14
Covid-19 impact
Market situation
• Most global brands reported ~50+% drop in sales, which is now slowly recovering; domestic market severely impacted
• Shift from woven to knit products (WFH trends), core lines
• Some signs of shift out of China sourcing
• Customers asking for longer payment terms
• Demand for AMD products largely intact
• Comprehensive agenda for fixed cost reduction including facilities consolidation, head count rationalization and overhead reduction
• Sharper management of working capital
• Proactive response to shifting market opportunities - aggressive ramp-up, esp. for AMD and knits products
• Expanded range of Human Protection products (added PPEs and N95 Masks)
Arvind response
15
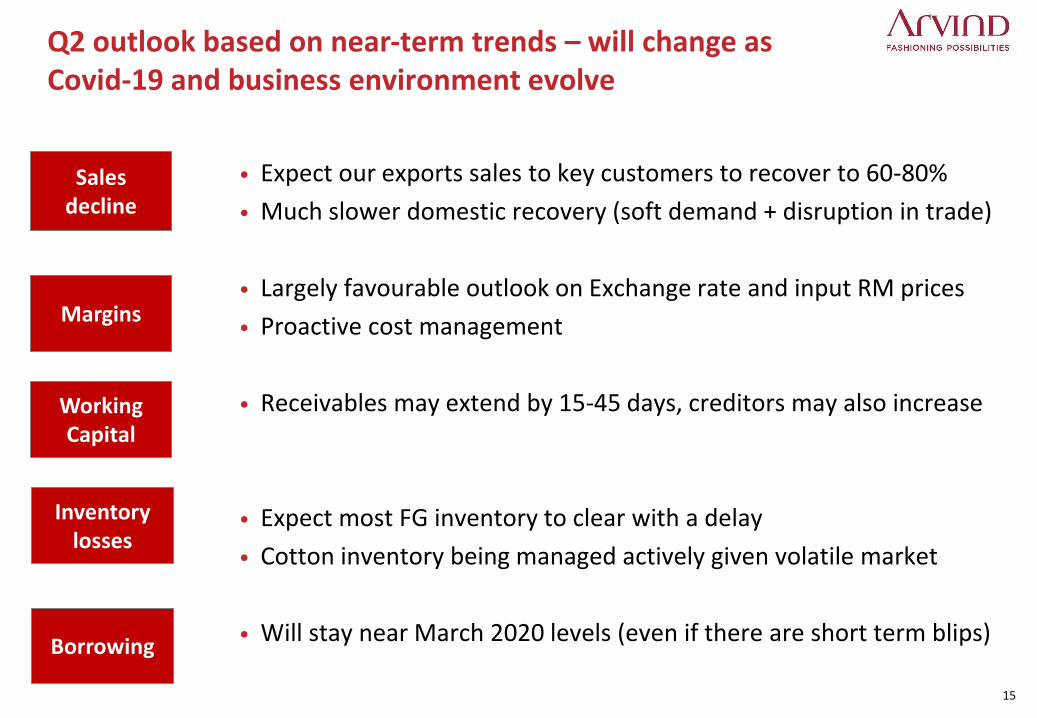
Q2 outlook based on near-term trends – will change as Covid-19 and business environment evolve
Sales decline
• Expect our exports sales to key customers to recover to 60-80%
• Much slower domestic recovery (soft demand + disruption in trade)
• Largely favourable outlook on Exchange rate and input RM prices
• Proactive cost management
• Receivables may extend by 15-45 days, creditors may also increase
• Expect most FG inventory to clear with a delay
• Cotton inventory being managed actively given volatile market
• Will stay near March 2020 levels (even if there are short term blips)
Margins
Working Capital
Inventory losses
Borrowing

Thank You!