Q4 2018 - Coinmotion · Q4 2018 we saw an increasing amount of building systemic risk, especially...
19
QUARTERLY REPORT Q4 2018 in collaboration with
Transcript of Q4 2018 - Coinmotion · Q4 2018 we saw an increasing amount of building systemic risk, especially...

QUARTERLY REPORT
Q4 2018
in collaboration with

CONTENTS
INDUSTRY OUTLOOK
ASSETSUM
MARY
FOREWORDS
BITCOIN’S VALUE PROPOSITIONS TO INVESTORS
CRYPTOASSET MCAPS
EXCHANGES
PEER-TO-PEER MARKET
PEER-TO-PEER EXCHANGES
MESH NETWORKS
TOKEN MARKET
BLOCKCHAIN TECH
STABLECOINS
UNIQUE ADDRESSES
CONF. TRANSACTIONS
NETWORK HASHRATE
CORRELATIONS
LIGHTNING NETWORK
BITCOIN & NATIONAL CURRENCIES
SOCIAL MEDIA
BITCOIN MVRV
ATM MARKET
BITCOIN MAYER MULTIPLE
INDEXES
BITCOIN & GOLD
BITCOIN NVT
REFERENCES

FOREWORDS
Despite the price drop in Q4 2018, bitcoin’s funda-mentals look bright. Bitcoin’s segwit usage was up over 300% in 2018. SegWit, an implemented soft work change in the transaction format of bitcoin, met much resistance in 2017. But in 2018, the upward trend of SegWit adoption is clear. According to transactionfee.info, last year segwit transactions accounted for 10% of all Bitcoin transactions, and today that figure is above 42% [1]. Yet another positive trend is the increasing volume of academic papers written about bitcoin, show-ing that cryptocurrencies’ appeal has spread far beyond speculation. Jameson Lopp recently point-ed out that Google Scholar results for articles containing “bitcoin” have grown every single year since Bitcoin’s creation, and 2018 was no excep-tion [2].
Additionally “bitcoin dominance”, the total crypto-currency market cap share held by bitcoin, is up to roughly 53% from only 32% in January 2018. The boom in Initial Coin Offerings (ICOs), which often raise funds in Ether (ETH), bit into bitcoin’s market dominance. The ICO bear market that followed, has now helped Bitcoin regain its market share.
Bitcoin network data in 2018 compared to previous years:
⊲ Total trading volume: $2,2 trillion.
⊲ Total Layer 1 transactional volume: $3,2 trillion.
⊲ Total change in transactional volume 2017-2018: Only -8,23% ($0.3 trillion).
⊲ Median change year-on-year 2017-2018 for every day in the year: +2,91%.
Bitcoin continues to serve its position as non-corre-lated asset, “digital gold” among other asset class-es. Bitcoin is scarce programmable digital money, with strong fundamentals into the future. During Q4 2018 we saw an increasing amount of building systemic risk, especially in Europe and Emerging Markets, with their weaker national fiat currencies. Bitcoin offers a safe haven for individuals, and an instrument for investors and institutions for hedging said systemic risk. We see bitcoin as an asset class and infrastructure, which makes it unique among alternative investments.
We collected > 4000 data points for this report. The report aims to provide value for individuals, investors, and institutions, by delivering a complete quarterly summary of the industry.
“03/Jan/2009 Chancellor on the brink of second bail-out for banks”. The famous word immortalized on bitcoin genesis block, or block #0. Consequently 03/Jan/2019 marks the 10-year anniversary of bit-coin.
According to Satoshi Capital Research, the transactional volume of bitcoin, the world’s lead-ing decentralized digital currency, exceeded $3 trillion in 2018 [3].
The New York firm compared bitcoin’s trad-ing volume with the volume of fiat currencies in emerging economies, noting that people traded Bitcoin more than Argentinian Pesos (ARS) and Bulgarian Lev (BGN). At $2,2 trillion, bitcoin was beaten only by Chilean Peso (CLP), Israeli Shekel (ILS), and Thai Baht (THB), whose trading volumes were $4 trillion, $5 trillion and $7 trillion, respectively in 2018. This solidifies bitcoin’s position as a serious global currency, ranking just under the Chilean Peso and more than 6x the Bulgarian Lev.

GROWTH
DIVERSIFICATION
HEDGE
DECENTRALIZED VALUE
The pioneering blockchain industry is developing with escalating pace and new projects are constantly gaining traction. The mass adoption in bitcoin & blockchain tech and tokenization in general will continue to evolve rapidly in coming years.
Bitcoin with a low historical correlation to traditional markets, is an emerging asset class to consider as a part of the portfolio diversification. Even just 1-5% allocation to bitcoin has been historically impacting portfolio performance favorably.
Bitcoin can be seen as a potential hedge to traditional asset classes. Built-in features like 21 million hard cap, inflation-free structure, and antifragile blockchain make bitcoin a store of value.
Global, decentralized, censorship-resistant & programmable asset with proven 10-year track record, showing outstanding staying power. With 99,98% uptime since inception, every subsequent day online makes bitcoin more robust, secured by built-in incentive structure.
BITCOIN’S VALUE PROPOSITIONS TO
INVESTORS

Bitcoin’s MCAP remained dominant during Q4 2018, one highly affecting factor being the implosion of ICO (Initial Coin Offering) market. Majority of ICOs are based on Ethereum (ETH) ERC-20 protocol.
The cryptocurrency market continued to be a sub-stantially profitable environment for exchanges, and despite of 2018 bear market, many exchanges retained their positions.
Comparing Q4 2018 (Nov.) exchange visit data in a bubble charts offers interesting results. Binance and Coinbase lead the comparison group in total number of visits, scoring over 15m for both. At the same time LocalBitcoins takes the #1 place in length of average visit, 44,45 minutes each. Poloniex and Yobit had high average visit times too, over 30 minutes each. The results confirm Binance’s and Coinbase’s status as the most popular exchanges, as “old school” platforms like LocalBitcoins, have a more dedicated “heavy” user base.
INDUSTRY OUTLOOK
CRYPTOASSET MCAPS
EXCHANGES
Coinbase Inc. is projecting around $1,3B revenue for the year 2018, a distinctive rise from $1B revenue in 2017, especially considering the 2018 bear market.
Coinbase reported $380M in profit during 2017, and is targeting $456M profit for 2018. The company also reported over $500M in cash at the end of H1 2018 [7].
The huge retail investor demand, that drove the market up in Q2-Q4 2017, is now a lot less pres-ent. The fastly changing sentiment scared majority of retail investors, it’s pretty clear that “old school” holders of bitcoin and ether are now the ones to support current levels. And these segments are known as holders of last resort, they will not sell easily.
Binance’s exchange volume stayed at 42% during 2018, closely followed by Bitfinex (20%). Bitfinex is a well known exchange behind the most popu-lar (and somewhat controversial) stablecoin Tether (USDT). HitBTC recorded a 8% share of the global volume, followed by legendary Kraken exchange (with 7%). Kraken is one of the oldest exchanges in the market, founded on 28th July 2011.
250
200
150
100
50
0
BITCOIN MCAP COMPARED WITH ALTCOIN MCAPS IN Q4 2018 IN BILLIONS OF USD (BITCOIN DOMINANCE)
BITCOIN MCAP
ALTCOIN MCAPS
42%
20,4%
7,9%
6,8%
5,2%
4,5%
4,1%
2,6%
2,5%
2,5%
1,6%

According to LocalBitcoins, Colombia processed 10x the volume of P2P bitcoin transactions in December 2018 vs. Dec. 2017.
P2P MARKET
Meanwhile Peru processed almost 20x the bitcoin volume, comparing Dec. 2017 and Dec. 2018.
Why is the P2P volume growing especially in South America? South America has a history of economic troubles and difficulties with fiat currencies & infla-tion. Throughout its history, Argentina has experi-enced multiple economic crises, the last one 1998-2002 Argentine great depression. The depression, which began after the Russian and Brazilian finan-cial crises, caused widespread unemployment, riots, the fall of the government.
Additional effects were a default on the country’s foreign debt, the rise of alternative currencies and the end of the peso’s fixed exchange rate to the US dollar. The economy shrank by 28 percent from 1998 to 2002. In terms of income, over 50% of Argentines were poor and 25 percent, indigent. Seven out of ten Argentine children were poor at the depth of the crisis in 2002.
WEEKLY 2018 LOCALBITCOINS VOLUME IN COLOMBIA (COP)
WEEKLY 2018 LOCALBITCOINS VOLUME IN ARGENTINA (ARS)
WEEKLY 2018 LOCALBITCOINS VOLUME IN PERU (PEN)
WEEKLY 2018 LOCALBITCOINS VOLUME IN VENEZUELA (VES)
Argentina has also seen increasing P2P bitcoin transaction volume lately.
This economic vision has led to the rapid devalua-tion of Venezuela’s national currency, to the point that a loaf of bread you buy one week will cost considerably more the next. In early July, one cup of coffee could cost as much as 1 million bolivars (VEF). Asdrúbal Oliveros, director of a financial firm called Econoalitica, said in June that a family of four needed 545 million VEF just to pay for basic goods and services. In Caracas, this macroeco-nomic disaster is evident on a daily basis. There is a huge gap between low-income people and the wealthy, with the middle class becoming extinct. In front of luxurious restaurants are people who live in the streets, digging for food in the trash [5].
Bitcoin P2P exchanges offer an alternative to tradi-tional crypto exchanges. Most popular ones at the moment are: LocalBitcoins (founded in 2012), Paxful (founded in 2015), and Bisq (founded in 2014).
P2P EXCHANGES
The state of these weaker national fiat currencies shows the demand for alternative assets like bit-coin. Systemic risks are present, more than ever before, within the fiat currency based economic system, and smart investors are preparing to hedge said risks with alternative assets.
↓LocalBitcoins, as the oldest P2P in the group, has been dominant in transactional volumes, rank-ing a yearly high, during second week of January 2018: $120 million in weekly volume. Since then LocalBitcoins’ volume has dropped with the gen-eral bear market, into $47 million during the last week of December 2018.
↑Paxful’s volume grew steadily from Q1 to Q4 2018, from January $9 million to late Q4 $16 million.
↑Bisq (formerly Bitsquare) still showcases relatively low volumes, $400K in the first week of Q1 2018, rising to around $1,5M at the end of Q4 2018. Bisq Q4 peak volume was $3,2 million during last week of November 2018.

The bitcoin scene continues to be driven by con-stant innovation. One of the most interesting new technologies to be implemented within the eco-system is Mesh Network Technology, first imple-mentations tested in 1998-1999, as ALOHA net-works. Mesh Network devices, like goTenna, allow the users to create their own network for text mes-saging, or sharing location data.
MESH NETWORKS
GoTenna also offers cunning services for bitcoin users, paired with Samourai app, the bund enables bitcoin offline transactions to be broadcasted via goTenna mesh network. Mesh network technology additionally offers a possibility to build your own “internet”, which would in theory be censorship resistant, like bitcoin itself. We’re estimating the demand for said devices and applications to grow, especially in environments with weak national fiat currencies, censorship, or other general threats.
GoTenna’s sales continued to expand strongly during 2018 Q3 & Q4. The company announced over 100 000 devices sold during the year in US and abroad. We expect new technologies, like mesh network, to boost bitcoin adoption and help to grow the ecosystem in long-term [6].
“Financial privacy is a basic human
right.”
- Riccardo Spagni, Monero.

The ICO (Initial Coin Offering) market continued to diminish during Q4 2018, while ICO funds raised (in USD) briefly rose to 312 million in November. December’s amount dropped mere 75 million. Before Q4, the ICO market dropped in Q3 too, quite linearly from July ($451M) to September ($242M). The ICO market saw its peak back in January 2018, recording $1,5 billion in raised funds.
TOKEN MARKET
79% of the total sum of ICOs were conducted in the first 6 months of 2018 ($6,2B). While last 6 months of 2018 counted only for 21% of the yearly Initial Coin Offerings. 19% of the ICOs ($1,5B) were launched in January alone, however December 2018 only saw $75 million in funding rounds, less than 1% of the total yearly amount.
The cryptocurrency & token market is heavily corre-lated meaning that outflow of assets from ICO market also heavily affects bitcoin’s performance as the most dominant cryptocurrency. While the ICO market remains berish for now, we’re expect-ing another digital funding round mechanism to gather popularity. STOs (Security Token Offering) are increasing rapidly and we’re witnessing multi-ple platforms to rise, especially in EU area [7].
We explored the ETH treasury balances of 5 well-known ICOs in last report (Quarterly Report Q3). Comparing the ETH wallet data in Q4 shows no change in Golem (GNT) projects balance, still holding 369 023 ETH as before. Gnosis (GNO) project ETH balance is close to Q3, only down 3113 ETH. These assets were either sold, or moved to another wallet.
ICO FUNDS RAISED IN 2018 (USD)data source: icodata.io
ICO FUNDS RAISED IN Q3-Q4 2018 (USD)
Polkadot’s (DOT) data shows exactly same amount (306 276 ETH) as in Q3. Also TenX’s (PAY) balance remains the same (32835 ETH), from 2018 Q3 to Q4. TenX’s ETH wallet seems small, however some sources indicate they still have around $100M in cash. Tezos’ (XTZ) ETH balance is down 82050 ETH, a significant amount. One could speculate that the most obvious reason for selling these assets (close to $9,4M) is to use them for mandatory expenses within Tezos project. We’ll continue to follow the ICO treasury balance situation throughout 2019 in upcoming reports.

There has been lot’s of hype about “Blockchain Technology”, especially 2017 bull market cycle saw many imaginary blockchain applications, some-times without real use cases. World Economic Forum compiled a relevant framework for finding high-potential use cases within blockchain tech [8]:
✓ Shared repository.
A shared repository of information is used by mul-tiple parties.
✓ Multiple writers.
More than one entity generates transactions that require modifications to the shared repository.
✓ Minimal trust.
A level of mistrust exists between entities that gen-erate transactions.
✓ Intermediaries.
One or multiple intermediary or a gatekeeper is present to enforce trust.
✓ Transaction dependencies.
Interaction or dependency between transactions is created by different entities.
BLOCKCHAIN TECH
Identifying and developing potential use cases is critical for the industry to succeed in future.
2017 hype market saw lot’s of wrongly allocated resources, and we hope the scene will provide better results as innovation-level processes mature.

Stablecoin projects continued to emerge during Q4 2018, majority of them being built on Ethereum ERC-20 platform and linked to USD.
Tether (USDT) has retained its position as the leading stablecoin, with close to $1,9B market cap at the end of Q4 2018.
USD Coin (USDC) takes the 2nd place with $249M MCAP. 3rd and 4th are TrueUSD (TUSD) with $207M, and Paxos (PAX) with $147M MCAPs each. Gemini Dollar (GUSD), by famous Winklevoss twins (Gemini) takes the 5th place with $93M market cap.
STABLECOINS
We expect the stablecoin market to expand during 2019, stablecoins offer features like 24/7 access, fast transfers, programmability, and easy compliance. Stablecoins obviously don’t try to compete directly with bitcoin or other PoW (Proof of Work) cryptocurrencies. Instead stablecoins fill their own niche as offering liquidity and low volatility to markets.
TETHER (USDT)71%
DAI (DAI)2,6%
TRUEUSD (TUSD)7,8%
PAXOS (PAX)5,5%
GEMINI DOLLAR (GUSD)3,5%
USD COIN (USDC)9,4%

The number of unique bitcoin addresses used in 2018 has remained steady through 2018 Q3 and Q4, around 400 000 addresses. We explored some market situations that increase or decrease the amount of unique addresses.
The amount of confirmed bitcoin transactions is constantly growing. 2018 saw a 3-year low in con-firmed transactions during April 2018, since then transactions have grown > 40%.
Bitcoin network hashrate saw 25% increase after briefly falling during Q4 November 2018. The growing hashrate tells about miner confidence and healthy infrastructure. The hashrate of the network is a response to the increasing price of bitcoin.
ASSET SUMMARY
Situations that increase unique addresses.
When fees are high, people leave their UTXOs (unspent transaction outputs) in multiple addresses, because it costs too much to consolidate them. When network is popular, more unique addresses are usually used. As the bitcoin network grows, there will be more unique addresses in general.
UNIQUE ADDRESSES
CONF. TRANSACTIONS
NETWORK HASHRATE
Situations that decrease unique addresses.
When fees are low, people will consolidate their funds into a single address. Batching reduces the number of unique addresses in use. More batching will decrease unique addresses and less batching will do the opposite. When the market drops, less unique addresses are in use because people just aren’t transacting as much.
NUMBER OF UNIQUE ADDRESSES USED IN 2018data source: blockchain.com
NUMBER OF UNIQUE ADDRESSES USED IN Q4 2018 data source: blockchain.com
The amount of confirmed transactions continued to grow during Q3 and Q4 2018. Consequently we expect the amount of transactions to continue growth in 2019.
However, unlike the price of bitcoin, the hashrate tends to be more stable because getting into or out of the mining business is a big decision. Investment in a large mining ops requires CAPEX and time.
The number of unique addresses is not a perfect stand-in for the number of users, but it is true that in general the more users we have, the more unique addresses in use and vice versa.
CONFIRMED TRANSACTIONS PER DAY 2018 data source: blockchain.com
THE ESTIMATED NUMBER OF TERAHASHES (TH/S) THE BITCOIN NETWORK PERFORMED IN 2018
data source: blockchain.com
CONFIRMED TRANSACTIONS PER DAY 2018 data source: blockchain.com
THE ESTIMATED NUMBER OF TERAHASHES (TH/S) THE BITCOIN NETWORK PERFORMED IN Q4 2018
data source: blockchain.com

Is bitcoin correlated with the stock market? Looking at Q4 bitcoin - S&P 500 index Spearman correlation, the answer seems to be increasingly: No. Highest point of correlation between SP500 was 0,217 on November 13th. Correlation has since weakened, dropping all the way to 0,117 for 31.12.2018. The weakening correlation supports the “digital gold” theory, which showcases bitcoin as a non-cor-related asset and hedge to traditional markets. Source: Coinmarketcap, FRED, IBA. 180d Spearman correlation.
CORRELATIONS
When comparing bitcoin with SPDR Gold Shares (GLD), the correlation is clearly negative, peaking at -0,084 on Dec. 8th. By the end of December, correlation has been moving towards 0, showing no linear relationship with the two assets. Bitcoin the “digital gold” is clearly non-correlated with the actual gold market.
In late Q4 2018, bitcoin’s price stayed relatively flat as tech stocks (FAANG) dropped. Contrary to popu-lar tech stocks and their underlying companies, bit-coin is not dependent of profitability or any sales. Bitcoin lacks debt overhang and has no stockpile of goods that needs to be sold, bitcoin just grows on adoption.
Bitcoin was created just after the 2008 subprime crisis, by the end of Q4 2018, macro level indica-tors are showing signs of slowdown again. When the end of cycle approaches, we’ll see the per-formance of bitcoin as alternative investment and hedge.
Q4 2018 CORRELATION BETWEEN BITCOIN - S&P 500, AND BITCOIN - GLD
data sources: Coinmarketcap, FRED, IBA.
BTC-GLD BTC-SP500
”Bitcoin has an asymmetric return profile - there is much more upside than downside in owning the asset. The downside is capped at the total amount of capital invested, yet the upside is ~100X+.”
- Anthony Pompilano, Morgan Creek Digital Assets.

This chart shows the number of nodes with chan-nels. Lightning nodes open payment channels with each other that are funded with bitcoin.
The cryptoasset Twitter popularity chart gathers data from posts, likes, and retweets for each cryp-toasset.
LIGHTNING NETWORK (LN)
SOCIAL MEDIA
When transactions are made across those channels, the channel balance is reflected without having to broadcast a transaction on chain. This creates a second layer on top of the bitcoin network that expands it capabilities.
Unique channels are bitcoin LN channels connecting nodes directly for the first time. Lightning Network (LN) channel growth, escalating during December and Q4 2018, showcases rising popularity of the network, even during current bear market cycle.
LIGHTNING NETWORK (LN) NODE GROWTH IN 2018data source: Bitcoin Visuals
LIGHTNING NETWORK (LN) CHANNEL GROWTH IN 2018data source: Bitcoin Visuals
MOST TRADED NATIONAL CURRENCIES FOR BITCOINdata source: coinhills.com
CRYPTOASSET POPULARITY ON TWITTERdata source: twitter
Lighting Network’s node count has been growing steadily during 2018, continuing deeply through Q4. The node count indicates good fundamentals for bitcoin, as a hugely promising layer 2 solution.
US Dollar (USD) remained the dominant national fiat currency to be used to bitcoin trading in 2018, with 49% of all fiat / bitcoin pair trades conducted in USD. Japanese Yen (JPY) made the close second place with 45% of the trades. Euro (EUR), and Korean Won (KRW) shared the third place with around 2% each.
BITCOIN AND NATIONAL CURRENCIES
The USD dominance in trade with bitcoin was pretty obvious, but Japanese Yen’s 45% was somewhat a surprise, meanwhile Japan’s high position in cryp-tocurrency adoption is a well-known fact.
Bitcoin seems clearly dominant cryptocurrency in social media too, followed by Ethereum (ETH), and Ripple (XRP) by wide margin. Now 10 years old bit-coin still holds the #1 position in network effects. Social media data helps to predict market cycles in current environment with large segment of retail investors.
“Bitcoin is becoming a platform, a protocol stack with many features: • Store of value. • Low trust wealth transfer. • Confidential transactions. • Tokenized securities. • High volume payment network. • Microtransactions. • Smart contracts / programmable money.”
- Tuur Demeester, Adamant Capital.

The bitcoin Market-Value-To-Realized-Value Ratio, or MVRV, was originally created by Murad Mahmudov and David Puell following Nic Carter’s presentation at Baltic Honeybadger 2018 (BH2018) [9]. Realized value is in summary closer to bitcoin’s “fair value”, as the RV adjusts with with lost coins and usually coins used for “holding”.
The MVRV clearly displays the peaks and busts of a general price cycle, showcasing the oscillation between fear and greed. The realized value accurately indicates bitcoin’s stable long-term value. The MVRV can be considered as trend’s “psychological indicator”, the area where long-term holders see true value.
MVRV
In Q4 2018 the MVRV ratio dropped from early October 1,3 to late December 0,8. Comparing to the previous data, the MVRV definitive peak in last cycle was late Q4 2017, when MVRV reached closer to 5,0. The 5,0 MVRV indicated escalated greed within retail investors in the Q3-Q4 2017 bull market. Similarly, the current 0,8 would indicate that bitcoin’s bottom is close in the current cycle.
BITCOIN MVRV Q4 2018
Bitcoin MVRV is calculated by dividing market value by realized value on a daily basis. MVRV, similar to Willy Woo’s NVT ratio, tracks the interaction between market actors that best describe the aforementioned dichotomy [10].
MVRV ratio only provides a long-term perspective of bitcoin market cycles, specifically distribution and accumulation phases. It is important as well to remember that realized cap may drop given a black-swan shock event where strong hands lose confidence in BTC. For this reason we recommend assessing market value and realized value both as a ratio and separately.
Just as the upper levels of MVRV suggest the climax of euphoria, overshooting its “fair” value at the peaks, price action as discovered at exchanges tends to undershoot beyond BTC’s “real” value at the bottoms. Looking back at the past two bitcoin bear cycles, we can say without a doubt that both occasions proved to be the most opportune periods to accumulate bitcoins.

2018 obviously was a good year for crypto ATMs. On average 6 ATMs were installed every day during the year. Bitcoin remained the favourite cryptocur-rency option for ATMs (4046), followed by Litecoin (2421), and Ethereum (1993).
ATM MARKETBITCOIN ATM INSTALLATION GROWTH 2014-2018
data source: coin ATM radar
71%
23,5%
2,5%
1,3%1,2%
BITCOIN ATM INSTALLATION GROWTH 2014-2018data source: coin ATM radar
BITCOIN ATM DISTRIBUTION BY MANUFACTURERdata source: coin ATM radar
2014 2015 2016 2017 2018
When exploring the Q4 numbers, it’s clear that 71% of the global crypto ATMs are currently located in the US, while 23,5% are located in Europe [11]. Asia’s ATM coverage is surprisingly low, only 2,5%. The US dominance in crypto ATMs might even increase in 2019 as EU is about to release new regulation considering cryptocurrencies, AML & KYC [12].
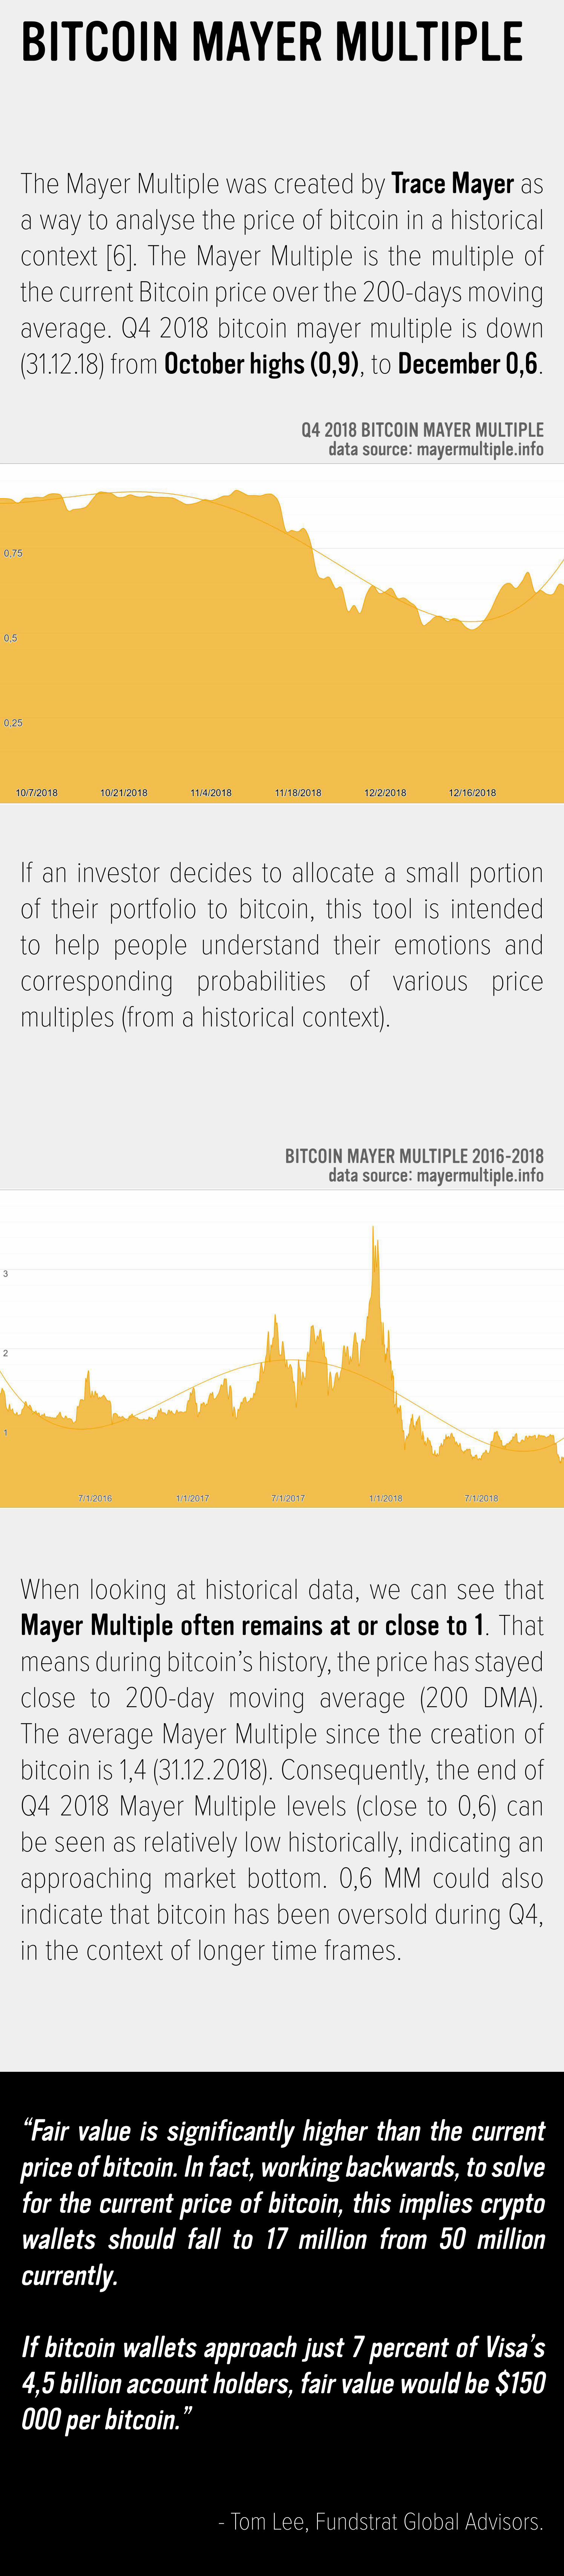
The Mayer Multiple was created by Trace Mayer as a way to analyse the price of bitcoin in a historical context [6]. The Mayer Multiple is the multiple of the current Bitcoin price over the 200-days moving average. Q4 2018 bitcoin mayer multiple is down (31.12.18) from October highs (0,9), to December 0,6.
BITCOIN MAYER MULTIPLE
When looking at historical data, we can see that Mayer Multiple often remains at or close to 1. That means during bitcoin’s history, the price has stayed close to 200-day moving average (200 DMA). The average Mayer Multiple since the creation of bitcoin is 1,4 (31.12.2018). Consequently, the end of Q4 2018 Mayer Multiple levels (close to 0,6) can be seen as relatively low historically, indicating an approaching market bottom. 0,6 MM could also indicate that bitcoin has been oversold during Q4, in the context of longer time frames.
If an investor decides to allocate a small portion of their portfolio to bitcoin, this tool is intended to help people understand their emotions and corresponding probabilities of various price multiples (from a historical context).
BITCOIN MAYER MULTIPLE 2016-2018data source: mayermultiple.info
Q4 2018 BITCOIN MAYER MULTIPLEdata source: mayermultiple.info
“Fair value is significantly higher than the current price of bitcoin. In fact, working backwards, to solve for the current price of bitcoin, this implies crypto wallets should fall to 17 million from 50 million currently.
If bitcoin wallets approach just 7 percent of Visa’s 4,5 billion account holders, fair value would be $150 000 per bitcoin.”
- Tom Lee, Fundstrat Global Advisors.

The Bitwise 10 Index is designed to track the broad-based performance of the cryptocurrency market as reflected in a basket of the ten largest coins, weighted by 5-year inflation-adjusted market capitalization. It is a rules-based index with a monthly reconstitution and rebalancing discipline. The latest monthly reconstitution occurred at 4pm ET on December 31, 2018.
INDEXES
The index uses a composite pricing model sourc-ing real-time data from multiple exchanges, con-sidering both trade weighting and inverse price variance weighting to determine the fair price for each coin.
Bitcoin’s realized volatility decreased during October and was from time to time even lower than realised volatility of some major stock indices. The record low volatility period was then followed by a major spike in the volatility levels raising up to 100% and above during the turbulence in the cryptomarkets in November, but gradually decreasing to lower levels towards the end of the year.
Price volatility is computed as the standard devia-tion of log-returns for the past 30 days, scaled by the square root of 365 to annualize, and expressed as a percentage. Source: BitMEX 30 day Historical Volatility Index (.BVOL Index).
To protect the integrity of the index, robustness criteria are applied around trading volume, trading concentration risk, exchange concentration risk, compliance, data availability, data reliability and other key factors when selecting and weighting coins.
BITWISE 10 INDEX (BITX) COMPONENTS (31.12.2018)data source: bitwise
Q4 2018 BITWISE LARGE CAP CRYPTO INDEX (BITX) PERFORMANCEdata source: bitwise
Q4 2018 BITCOIN PRICE VOLATILITY
1021.10.2018 4.11.2018 18.11.2018 2.12.2018 16.12.2018 30.12.2018 13.1.2018
30
50
70
90
110
130
150
Bitwise 10 index decreased sharply during the Q4/2018 leaving the quarterly performance at circa -45%. The biggest drop in the index occurred in November, when Bitcoin and cryptomarkets in gen-eral saw a sharp correction to a new range trad-ing level. Bitcoin price level dropped from 6500 BTC/USD level to 3500 USD/BTC level, where it has been range trading mostly since. Markets senti-ment was quite negative overall during Q4 with-out major developments in the client adoption or positive progress among cryptocurrencies. Most of the scheduled institutional focused solutions like Bakkt and ETFs in the US were delayed until 2019, so there were few positive triggers supporting the market.
“Bitcoin will never go to 0 because it is a hedge against falling currencies, inefficient economies and increasingly systemic inequality. Bitcoin represents the currency of a better future for society, and people will always invest in their future.”
- Jehan Chu, Kenetic Capital.

The structure of bitcoin software was originally designed to replicate the features of gold, how-ever bitcoin represents an entirely different asset class. One of the main attractions of precious met-als is that near-universal acceptance has made them useful stores of value. Low-interest rates and yields in the immediate aftermath of the 2008 eco-nomic downturn led to the value of gold doubling because markets demanded a stable asset to hold wealth: it may not pay dividends, but it acted as a safe haven for the foreseeable future.
Bitcoin`s NVT Ratio (Network Value to Transactions Ratio) is calculated by dividing the Network Value (market cap) by the the daily USD volume transmit-ted through the blockchain. Note that this is the equivalent of the bitcoin token supply divided by the daily BTC value transmitted through the block-chain. Thus it is technically an expression of inverse monetary velocity.
BITCOIN & GOLD
BITCOIN NVT
Bitcoin shares similar characteristics to precious metals. Unlike fiat currencies or even other cryp-tocurrencies, there is no central organization that backs or controls its value, it is completely at the mercy of the free market. A report joint-published by eToro and Imperial College London also argued cryptocurrencies like bitcoin, were stores of value because they enabled users to make intemporal choices on when to spend their purchasing power.
QUARTERLY OFFICIAL GOLD RESERVES (TONNAGE) BY COUNTRYdata source: world gold council
BITCOIN NVT RATIO & PRICE DURING Q4 2018data source: coinmetrics
As Christoper Brookins, a managing partner at Pugilist Ventures wrote, “First, BTC and other ‘name brand’ cryptos will decrease demonstrably in value initially due to capital flight to ‘safe assets’ and likely rising real interest rates.” Further, as this article points out, hurt investors from a global recession are unlikely to race toward a riskier, less centralized currency option. This was furthered as an argument by Dan McArdle, the co-founder of crypto analysis site Messari, who pointed out that Bitcoin exists as a “speculative asset.”
Moreover, his first point is that Bitcoin is a “hedge against inflation and loss of confidence in fiat” which is different than a plummeting market of traditional asset investment. He goes on to point out, “We saw this with gold in 08/09 (it tanked). What sub-sequently led to gold’s 2011 all-time-high run was people wanting to hedge European (and other) fiat-collapse scenarios.”
Gold markets and reserves have been tradition-ally quite stable globally. However, since the finan-cial crisis of 2008 especially emerging markets like China, Russia, Turkey, India and Mexico have been increasing their gold reserves by a significant amount. There has been also a tendency among all countries to repatriate gold reserves from vaults located traditionally in foreign countries like US, UK and Switzerland to restore the control of the gold reserves to themselves.
“We expect the safe-haven bid, and to a lesser extent, gold’s inflation hedge properties, to remain key drivers of the metal’s price in 2019, complemented by a resurgence of physical demand.
Gold and silver are looking good in 2019, underlining a potentially positive indicators that should drive a bullish case for both metals. And as a result, the related equities as well.”
- Mike Kozak, Cantor Fitzgerald.
In Q4 2018, bitcoin’s NVT Ratio has dropped from early October 181, to late December 114. The low-est NVT recorded during Q4 was 80,1 between 8-11 December.
If we analyze the market based on NVT Ratio, the bitcoin bottom might be closing in, meanwhile NVT remains relatively high. We should also remember that NVT only considers the chain trading and does not count offline OTC transactions into the data.
NVT RATIO
BTC PRICE (USD)
Some of the repatriation attempts have been ini-tially even blocked by the custodian countries for various reasons. [12] The development indicates that the countries try to position in the future global economic system and enforce their independence in case of greater fiat currency crisis, as the trust to the current system has been already destabilized by continuous economic crises and political ten-sion between countries globally. Similarly citizens in some of the more unstable emerging countries have been allocating their savings into easily acces-sible store of values like bitcoin to hedge their inde-pendence of the failed state developments, as we saw in the P2P section of this report.

[1] transactionfee.info
[2] medium.com/@lopp/bitcoin-by-the-numbers-2018-recap-68a91789d804
[3] satoshi.capital/research
[4] bloomberg.com/news/articles/2018-10-30/coinbase-to-bring-in-1-3-billion-in-2018-sales-doc-uments-show
[5] bloomberg.com/news/articles/2018-10-30/coinbase-to-bring-in-1-3-billion-in-2018-sales-doc-uments-show
[6] webwire.com/ViewPressRel.asp?aId=227090
[7] neufund.org
[8] weforum.org/docs/48423_Whether_Blockchain_WP.pdf
[9] theinvestorspodcast.com/bitcoin-mayer-multi-ple
[10] charts.woobull.com/bitcoin-nvt-ratio
[11] news.bitcoin.com/cryptocurrency-atm-growth-spikes-exponentially-4000-machines-worldwide
[12] europarl.europa.eu/RegData/etudes/STUD/2018/604970/IPOL_STU(2018)604970_EN.pdf
[13] https://www.reuters.com/article/uk-bundes-bank-gold/germany-brings-its-gold-stash-home-sooner-than-planned-idUKKBN15O192
REFERENCES
Prasos Oy (the Company) is not responsible for any errors, inaccuracies or defects that may arise in this document and the information therein. Market views are only the company’s own. This document is under no circumstances an offer, purchase or sales call or sales recommendation. There are always risks when investing. The value or return on investments may rise or fall and the investor may even lose the capital invested. Historical development is not a guarantee of potential future returns or losses.