Q3’13 Global IPO update - Ernst & Young€¦ · Page 3 1Q15 Global IPO update Table of contents...
32
1Q15 Global IPO update January – March 2015
Transcript of Q3’13 Global IPO update - Ernst & Young€¦ · Page 3 1Q15 Global IPO update Table of contents...
1Q15 Global IPO update January – March 2015

Page 2 1Q15 Global IPO update
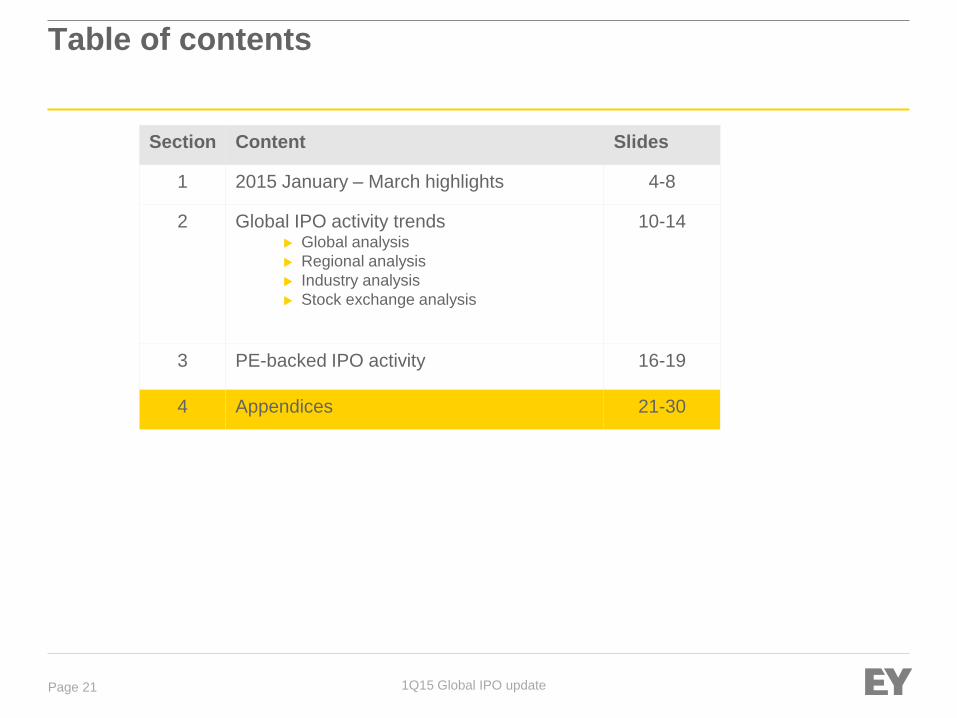
Table of contents
Section Content Slides
1 2015 January – March highlights 4-8
2 Global IPO activity trends Global analysis
Regional analysis
Industry analysis
Stock exchange analysis
10-14
3 PE-backed IPO activity 16-19
4 Appendices 21-30

Page 3 1Q15 Global IPO update
Table of contents
Section Content Slides
1 2015 January – March highlights 4-8
2 Global IPO activity trends Global analysis
Regional analysis
Industry analysis
Stock exchange analysis
10-14
3 PE-backed IPO activity 16-19
4 Appendices 21-30
Page 4 1Q15 Global IPO update
20,5 12,1
26,7
26,2
1Q14 1Q15*
47.2
-19%
80 43
182 209
1Q14 1Q15*
262
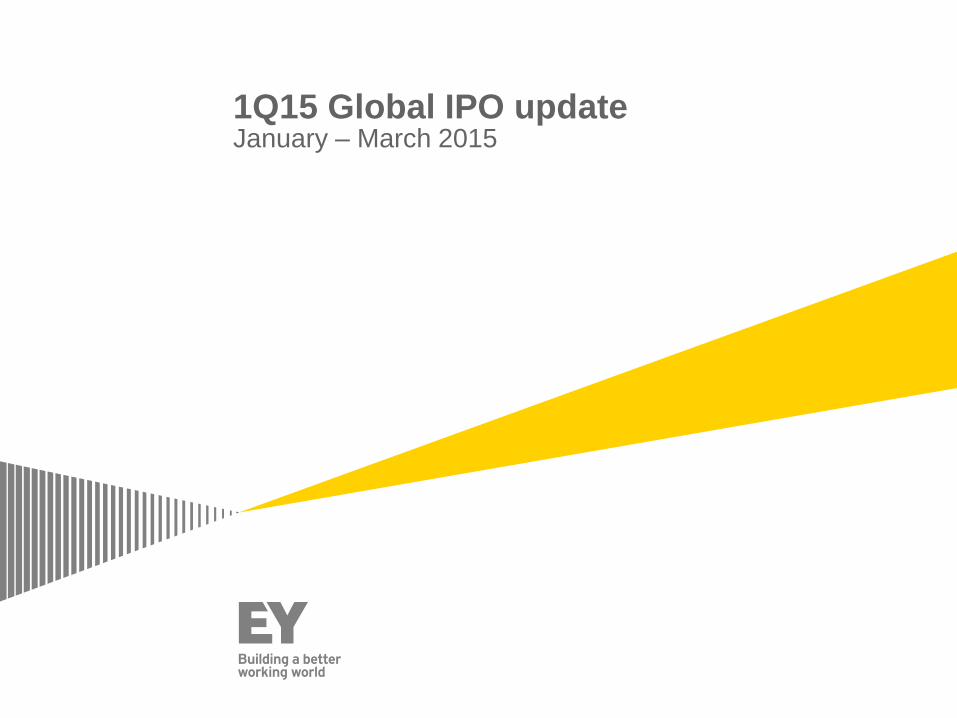
With lower number of exits by financial sponsors, 1Q15* saw a 19% and 4% decrease in proceeds and number of IPOs compared with 1Q14.
Financial sponsor backed IPOs refers to deals that are backed by PE or VC investors or both.
*Data for 1Q15* and 2015* are based on priced IPOs as of 17 March and expected IPOs by end of March; data is up to 17 March 2015, 9:00 a.m. India time. 1The top three IPO deals shown are those that have been priced by 17 March.
Issuer name Domicile country Industry Exchange Proceeds (US$m) % of global capital
Aena SA Spain Industrials Bolsa de Madrid 4,823.8 12.6%
Sunrise Communications AG Switzerland Telecommunications SIX Swiss Exchange 2,459.3 6.4%
Jasmine Broadband Internet Growth
Infrastructure Fund Thailand Telecommunications SIX Swiss Exchange 1,686.3 4.4%
Issuer name Domicile country Industry Exchange Proceeds (US$m) % of global capital
Sunrise Communications AG Switzerland Telecommunications SIX Swiss Exchange 2,459.3 6.4%
Auto Trader Group Ltd. United Kingdom Industrials London (LSE) 1,510.1 3.9%
GrandVision NV Netherlands Retail Euronext (Amsterdam) 1,167.9 3.1%
Issuer name Domicile country Industry Exchange Proceeds (US$ m) % of global capital
Inovalon Holdings, Inc. United States Technology NASDAQ 684.8 1.8%
Box, Inc. United States Technology New York (NYSE) 201.3 0.5%
Spark Therapeutics Inc United States Health care NASDAQ 185.2 0.5%
Global IPO activity summary
By number of deals By proceeds raised (US$b)
Financial sponsored (PE/VC backed) Non-financial sponsoredTop three IPO deals (by capital raised) during 1Q15*1
Top three PE-backed IPOs (by capital raised) during 1Q15*
Top three VC-backed IPOs (by capital raised) during 1Q15*
252 38.2 -4%

Page 5 1Q15 Global IPO update
Global IPO activity To access this infographic in PDF format, please go to EY’s IPO webpages (ey.com/ipo) to access the EY Global IPO Trends: 2015 Q1 report.

Page 6 1Q15 Global IPO update
Asia-Pacific1 and Greater China2 IPO activity To access this infographic in PDF format, please go to EY’s IPO webpages (ey.com/ipo) to access the EY Global IPO Trends: 2015 Q1 report.
1Based in IPO activity on Asia-Pacific stock exchanges. 2Based in IPO activity on Greater China stock exchanges (i.e.,, Shanghai Stock Exchange, Shenzhen Stock
Exchange – the Mainboard, SME and ChiNext, Hong Kong Stock Exchange – Main Board, GEM and Taiwanese Stock Exchange).

Page 7 1Q15 Global IPO update
EMEIA1 and UK2 IPO activity To access this infographic in PDF format, please go to EY’s IPO webpages (ey.com/ipo) to access the EY Global IPO Trends: 2015 Q1 report.
1Based in IPO activity on EMEIA stock exchanges. 2Based in IPO activity on London Main Market and Alternative Investment Market (AIM).

Page 8 1Q15 Global IPO update
EMEIA1 and UK2 IPO activity To access this infographic in PDF format, please go to EY’s IPO webpages (ey.com/ipo) to access the EY Global IPO Trends: 2015 Q1 report.
1Based in IPO activity on EMEIA stock exchanges. 2Based in IPO activity on London Main Market and Alternative Investment Market (AIM).
Page 9 1Q15 Global IPO update
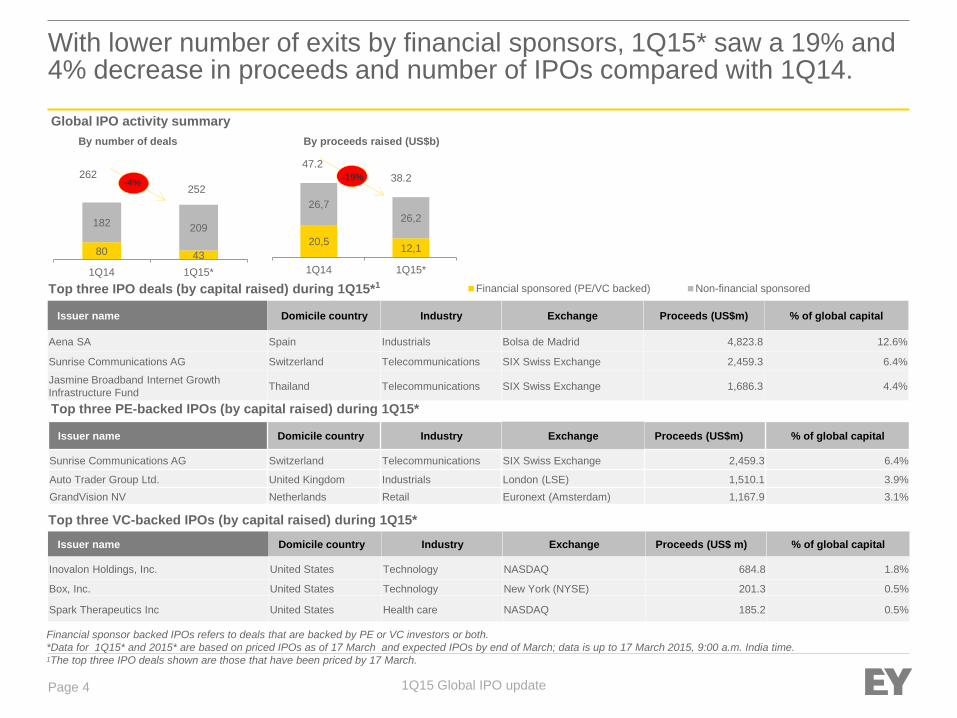
US IPO activity1 To access this infographic in PDF format, please go to EY’s IPO webpages (ey.com/ipo) to access the EY Global IPO Trends: 2015 Q1 report.
1Based in IPO activity on US stock exchanges: NYSE, NASDAQ

Page 10 1Q15 Global IPO update
Table of contents
Section Content Slides
1 2015 January – March highlights 4-8
2 Global IPO activity trends Global analysis
Regional analysis
Industry analysis
Stock exchange analysis
10-14
3 PE-backed IPO activity 16-19
4 Appendices 21-30

Page 11 1Q15 Global IPO update
Global IPO activity trends IPO activity saw a dip in 1Q15* compared with 1Q14, with proceeds and deal numbers decreasing by 19% and 4%, respectively.
Quarterly IPO activity (1Q11-1Q15*)
Global IPO activity (2011-2015*) % of cross-border listings
$ 46,9 $ 65,4 $ 28,7 $ 29,2 $ 18,0 $ 43,8 $ 29,6 $ 37,2 $ 24,4 $ 46,3 $ 25,6 $ 74,9 $ 47.2 $ 72,7 $ 67,4 $ 72,0 $ 38.2
306
384
293
260
203
243
192 201 163
205 202
325
262
335
277
367
252
0
50
100
150
200
250
300
350
400
450
0
10
20
30
40
50
60
70
80
1Q
11
2Q
11
3Q
11
4Q
11
1Q
12
2Q
12
3Q
12
4Q
12
1Q
13
2Q
13
3Q
13
4Q
13
1Q
14
2Q
14
3Q
14
4Q
14
1Q
15*
Num
ber
of IP
Os
Capital ra
ised (
US
$b)
Capital raised (US$b) Number of deals
9,2%
10,3%
9,9%
8,4%
8,8%
9,2%
9,6%
10,0%
10,4%
2013 2014 2015*
Cross-border listing
$ 170,2 $ 128,6 $ 171,1 $ 259,2 $ 38,2
1.243
839 895
1.241
252
0
200
400
600
800
1.000
1.200
1.400
0
50
100
150
200
250
3002011
2012
2013
2014
2015*
Num
ber
of IP
Os
Capital ra
ised (
US
$b)
Capital raised (US$b) Number of deals
*Data for 1Q15* and 2015* is based on priced IPOs as of 17 March and expected IPOs by end of March; data is up to 17 March 2015, 9:00 a.m. India time.
Page 12 1Q15 Global IPO update
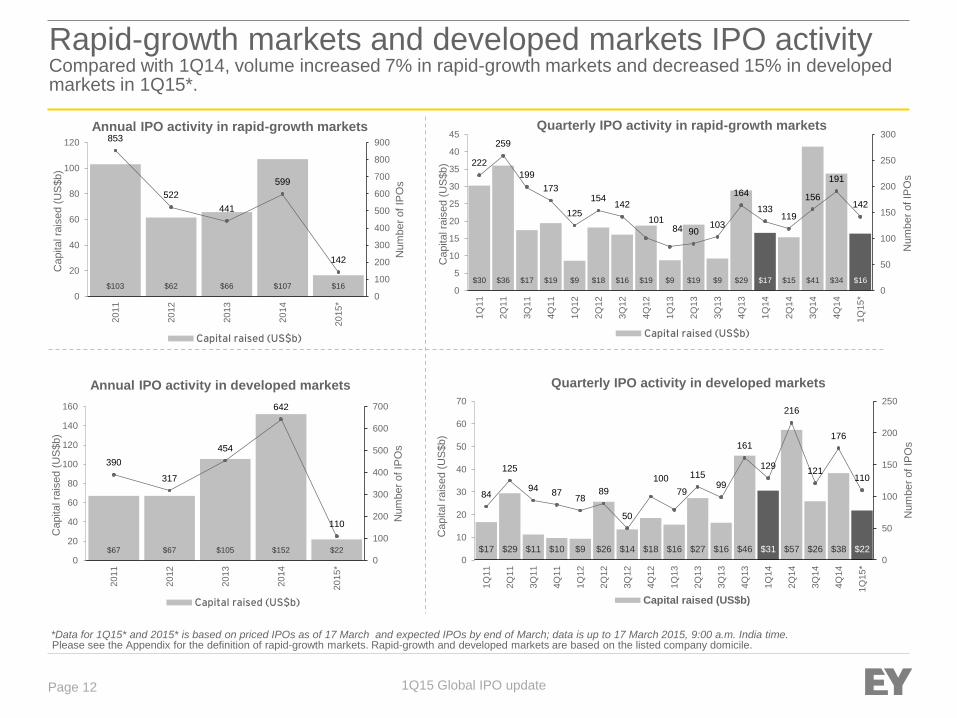
Rapid-growth markets and developed markets IPO activity Compared with 1Q14, volume increased 7% in rapid-growth markets and decreased 15% in developed markets in 1Q15*.
Please see the Appendix for the definition of rapid-growth markets. Rapid-growth and developed markets are based on the listed company domicile.
$30 $36 $17 $19 $9 $18 $16 $19 $9 $19 $9 $29 $17 $15 $41 $34 $16
222
259
199
173
125
154 142
101 84 90
103
164
133 119
156
191
142
0
50
100
150
200
250
300
0
5
10
15
20
25
30
35
40
45
1Q
11
2Q
11
3Q
11
4Q
11
1Q
12
2Q
12
3Q
12
4Q
12
1Q
13
2Q
13
3Q
13
4Q
13
1Q
14
2Q
14
3Q
14
4Q
14
1Q
15
*
Num
ber
of IP
Os
Capital ra
ised (
US
$b)
Quarterly IPO activity in rapid-growth markets
Capital raised (US$b)
$17 $29 $11 $10 $9 $26 $14 $18 $16 $27 $16 $46 $31 $57 $26 $38 $22
84
125
94 87
78 89
50
100
79
115 99
161
129
216
121
176
110
0
50
100
150
200
250
0
10
20
30
40
50
60
70
1Q
11
2Q
11
3Q
11
4Q
11
1Q
12
2Q
12
3Q
12
4Q
12
1Q
13
2Q
13
3Q
13
4Q
13
1Q
14
2Q
14
3Q
14
4Q
14
1Q
15
*
Num
ber
of IP
Os
Capital ra
ised (
US
$b)
Quarterly IPO activity in developed markets
Capital raised (US$b)
$67 $67 $105 $152 $22
390
317
454
642
110
0
100
200
300
400
500
600
700
0
20
40
60
80
100
120
140
160
20
11
20
12
20
13
20
14
20
15
*
Num
ber
of IP
Os
Capital ra
ised (
US
$b)
Annual IPO activity in developed markets
Capital raised (US$b)
$103 $62 $66 $107 $16
853
522
441
599
142
0
100
200
300
400
500
600
700
800
900
0
20
40
60
80
100
120
20
11
20
12
20
13
20
14
20
15
*
Num
ber
of IP
Os
Capital ra
ised (
US
$b)
Annual IPO activity in rapid-growth markets
Capital raised (US$b)
*Data for 1Q15* and 2015* is based on priced IPOs as of 17 March and expected IPOs by end of March; data is up to 17 March 2015, 9:00 a.m. India time.

Page 13 1Q15 Global IPO update
Industry analysis Most industries had smaller-sized IPOs in 1Q15* compared with 1Q14; industrials sector led global activity in 1Q15* by proceeds as well as by deal number.
103.4 232.9
426.2
72.7 2,072.8
272.3 184.5
217.5 127.0
197.5 79.7
330.9 202.5
65.4 51.8
247.9 142.1
83.7 50.5
295.8
107.6 34.8
1Q14 1Q15*
Average deal size (US$m)
13
11
23
22
54
14
32
16
15
5
21
36
14
13
26
13
38
12
35
22
20
2
12
45
Consumer staples
Media andentertainment
Materials
Real estate
Health care
Retail
Technology
Consumer products
Financials
Telecommunications
Energy
Industrials
1Q15* 1Q14
1,4
3,3
1,9
5,5
3,5
4,6
6,3
3,5
4,1
0,4
9,1
3,7
0,5
1,2
1,3
1,8
2,0
2,4
2,8
2,8
3,7
4,1
5,1
10,5
Consumer staples
Media andentertainment
Materials
Real estate
Health care
Retail
Technology
Consumer products
Financials
Telecommunications
Energy
Industrials
1Q15* 1Q14
Number of IPOs Capital raised (US$b)
431.5
91.2
*Data for 1Q15* and 2015* is based on priced IPOs as of 17 March and expected IPOs by end of March; data is up to 17 March 2015, 9:00 a.m. India time.

Page 14 1Q15 Global IPO update
Exchange analysis – summary EMEIA exchanges led in terms of capital raised, while Asia-Pacific exchanges dominated global IPO activity in terms of deal volume in 1Q15*.
Regional share by capital raised (US$b)
Regional share by number of IPOs
Greater China exchanges led in terms of total proceeds raised (US$9.2b); US (US$5.6b) and Spain (US$5.3b) ranked second and third,
respectively.
There were eight deals with capital raised above US$1b. Four of these deals listed on European exchanges while three listed on Asian
exchanges. US exchanges accounted for only one such deal.
Greater China exchanges (94 deals) led globally in terms of deal number, followed by the US (38 deals) and Japan (24 deals), which ranked
second and third, respectively.
1Greater China exchanges includes Mainland China exchanges (70 deals raised US$7.9b), Hong Kong Main Market and Growth Enterprise Market (22 deals raised US$1.3b) and
Taiwan exchange (2 deals raised US$51m).
Based on the listed company exchange.
Asia-Pacific EMEIA Americas
0,3
0,9
2,1
3,0
9,2
Indonesia
Japan
Thailand
Malaysia
Greater China
15%
25%
39%
46%
41%
41%
32%
34%
44%
34%
29%
20%
1Q15*
1Q14
2014
2013
3
8
11
24
94
South Korea
Thailand
Australia
Japan
Greater China
1,1
1,3
2,5
3,4
5,3
France
Netherlands
Switzerland
UK
Spain
4
7
8
9
17
Italy
India
Sweden
France
UK
0,01
5,6
Canada
US
2
38
Canada
US
16%
28%
25%
31%
57%
44%
46%
42%
27%
28%
29%
27%
1Q15*
1Q14
2014
2013
Americas Asia-Pacific EMEIA
*Data for 1Q15* and 2015* is based on priced IPOs as of 17 March and expected IPOs by end of March; data is up to 17 March 2015, 9:00 a.m. India time.

Page 15 1Q15 Global IPO update
1Q14 1Q15*
Stock exchange analysis Shenzhen and Shanghai exchanges led global IPO activity by deal numbers in 1Q15*.
*Data based on domicile of the exchange, regardless of the listed company domicile. Euronext includes Euronext (Amsterdam), Euronext (Paris) and Lisbon; NASDAQ OMX includes
Copenhagen and Stockholm; and Shenzhen includes Shenzhen (SZSE) includes the Main Board, SME Board and ChiNext.
Capital raised (US$b)
Number of
IPOs
93
9
11
13
14
17
25
35
35
All other exchanges
London (LSE)
Australia (ASX)
New York (NYSE)
Hong Kong (HKEx)
Tokyo MOTHERS
NASDAQ
Shenzhen (SZSE)
Shanghai (SSE)
10,3
2,4
2,5
2,5
3,0
3,3
3,5
5,3
5,4
All other exchanges
Shenzhen (SZSE)
Euronext
SIX Swiss Exchange
Bursa Malaysia
London (LSE)
New York (NYSE)
Bolsa de Madrid
Shanghai (SSE)
9,9
3,1
3,2
3,3
3,6
4,6
4,9
5,9
8,7
All other exchanges
NASDAQ OMX
Euronext
NASDAQ
Shenzhen (SZSE)
Tokyo (TSE)
London (LSE)
Hong Kong (HKEx)
New York (NYSE)
91
6
10
10
15
17
26
42
45
All other exchanges
Euronext
Bombay SME
London (LSE)
Hong Kong (HKEx)
London (AIM)
New York (NYSE)
Shenzhen (SZSE)
NASDAQ
Data for 1Q15* and 2015* is based on priced IPOs as of 17 March and expected IPOs by end of March; data is up to 17 March 2015, 9:00 a.m. India time.

Page 16 1Q15 Global IPO update
Table of contents
Section Content Slides
1 2015 January – March highlights 4-8
2 Global IPO activity trends Global analysis
Regional analysis
Industry analysis
Stock exchange analysis
10-14
3 PE-backed IPO activity 16-19
4 Appendices 21-30

Page 17 1Q15 Global IPO update
Global PE IPO activity trends PE-backed IPOs saw a record year in 2014, but muted activity to date in 2015.
*EMEA refers to Europe, Middle East and African exchanges. India is included within Asia-Pacific.
Quarterly PE-backed IPO activity (2012-1Q’15*)
Annual global PE-backed IPOs by region (capital raised)
Key insights PE firms continue to take advantage of a strong environment for exits.
After several years of concerns centering around PE’s ability to exit from
the buildup of companies acquired during the 2006-2007 time period, PE
activity is now reaching a state of equilibrium.
PE firms are particularly active in the IPO markets. 2014 was a new record
year, breaking the record set in 2013. In 2014, PE-backed deals
dramatically surpassed expectations of 2013. In 2014, raising a
remarkable US$109.9b across 211 separate offerings.
Indeed, exits of all sorts were the lead story for PE investors. Through
trade sales, secondaries and IPOs, PE firms sold stakes in more than
1,200 companies valued at US$470.6b, a new global record, and an
increase of 70% versus 2013.
29 37 31
80 96 99 92
10 31
86 62 69
103 88
7
6 10 12
30 28
40 66
37 21
51
42 36
49 53
3
9 13 6
40
56
60
58
4 4
19
13 6
35
70
16
0
50
100
150
200
250
2001 2002 2003 2004 2005 2006 2007 2008 2009 2010 2011 2012 2013 2014 2015YTD*
Num
ber
of deals
Americas Asia-Pacific EMEA*
$6 $7 $7 $15 $21 $23 $21
$3 $10 $16
$30 $15
$35 $33
$1
$1 $1 $1
$8 $3
$7 $16
$4
$6 $9
$6
$4
$6
$43
$1 $1 $4 $2
$8 $14
$20 $21
$3
$1
$10 $3
$2
$18
$34
$7
$0
$20
$40
$60
$80
$100
$120
2001 2002 2003 2004 2005 2006 2007 2008 2009 2010 2011 2012 2013 2014 2015YTD*
Capital ra
ised (
US
$b)
Americas Asia-Pacific EMEA*
$6 $7 $4 $5 $8 $15 $8 $28 $17 $37 $41 $14 $9
35 30 20 25
33
47 36
71
40
82
41 48
26
0
20
40
60
80
100
0
10
20
30
40
50
Num
ber
of deals
Capital ra
ised (
US
$b)
Capital raised (US$b) Number of deals
Annual global PE-backed IPOs by region (number of deals)

Page 18 1Q15 Global IPO update
335
562
545
625
435
359
543
644
599
634
720
121
227
318
335
384
199
83
249
301
322
299
350
57
149
180
197
216
51
56
156
117
110
187
211
26
0 200 400 600 800 1.000 1.200 1.400
2004
2005
2006
2007
2008
2009
2010
2011
2012
2013
2014
1Q15*
Strategic sales Secondary sales IPOs
Global PE exit trends IPOs remain strong; strategic acquirers step up as bidders for PE assets.
1EMEA refers to Europe, Middle East and African exchanges. India is included within Asia-Pacific.
“Strategic sales” are sales to corporations (i.e., M&A) while “secondary sales” are sales to other PE firms.
*1Q15* shows IPOs that have been priced by 17 March
Key insights PE investors are likely to continue focusing on exits in 2015. While firms have made great strides over the last 12 to 18 months in reducing the size of
their PE portfolios and achieving liquidity on many long-held positions, a significant amount of work remains to be done. In 2014, PE exits outpaced new
acquisitions by a ratio of roughly 1.7:1.
According to PitchBook, PE firms hold majority stakes in more than 13,000 companies globally, 45% of which have been held in excess of five years.
Despite recent volatility in the global equities markets, IPOs remain poised to be a primary exit route for many of these companies.
Strategic acquirers have become far more active in recent months; this is evident in higher valuations for M&A transactions and the number of sales to
trade buyers for PE assets.
Indeed, on the buyside, valuations are among the greatest concern for PE buyers in the present market.
Annual global PE exits by deal volume (2004-1Q15*)
$74,9
$143,3
$89,5
$143,6
$111,6
$51,9
$155,1
$182,1
$148,5
$158,8
$296,6
$57,3
$60,3
$68,1
$91,9
$158,2
$28.5
$12.8 $65,9
$53,5
$69,9
$58,7
$34.7
$11,4
$31,6
$38,4
$50,0
$57,7
$9,9
$16,8
$35,5
$38,8
$22,0
$58,5
$110,0
$9,4
$0 $100 $200 $300 $400 $500 $600
2004
2005
2006
2007
2008
2009
2010
2011
2012
2013
2014
1Q15*
Strategic sales Secondary sales IPOs
Annual global PE exits by deal value (US$m) (2004-1Q15*)
IPOs as % of
PE exits
12.0
23.1%
21.1%
9.2%
14.2%
13.8%
20.2%
6.6%
16.1%
21.6%
15.4%
18.9%
IPOs as % of
PE exits
12.7%
16.5%
16.7%
10.7%
11.0%
16.4%
11.2%
7.4%
17.6%
18.3%
16.9%
20.9%

Page 19 1Q15 Global IPO update
PE exit trends by region Americas and EMEA1 see significant increase in exit activity.
119
169
181
201
115
95
231
219
248
234
305
41
103
140
126
160
77
27
114
123
176
135
178
21
80
96
99
92
10
31
86
62
69
103
88
7
0 200 400 600
2004
2005
2006
2007
2008
2009
2010
2011
2012
2013
2014
1Q15*
Strategic sales Secondary sales IPOs
187
338
294
325
262
193
223
303
246
283
316
65
118
172
195
208
110
50
118
157
126
144
158
35
40
56
60
58
4
4 19
13
6
35
70
16
0 200 400 600 800
2004
2005
2006
2007
2008
2009
2010
2011
2012
2013
2014
1Q15*
Strategic sales Secondary sales IPOs
33,3
76,3
43,4
59,8
59,1
23,7
84,1
73,4
76,9
99,7
148,3
34,6
31,0
27,0
25,2
68,0
$4.1
$2.5
29,7
14,4
44,4
28,3
$24.6
6,5
15,3
21,2
23,4
21,3
2,8
10,1
16,2
29,8
15,3
34,6
32,7
1,2
0 50 100 150 200 250
2004
2005
2006
2007
2008
2009
2010
2011
2012
2013
2014
1Q15*
Strategic sales Secondary sales IPOs
33,9
51,7
40,9
71,0
46,5
20,9
56,1
76,5
57,8
44,0
113,9
18,5
28,9
40,6
65,6
83,8
21,8
$8.9
34,5
31,9
21,4
28,4
$9.5
4,6
8,2
14,4
20,1
20,9
3,2
0,8
10,2
3,1
2,3
17,8
34,5
7,3
0 50 100 150 200
2004
2005
2006
2007
2008
2009
2010
2011
2012
2013
2014
1Q15*
Strategic sales Secondary sales IPOs
Americas PE exits by deal volume (2004-1Q15*)
EMEA1 PE exits by deal volume (2004-1Q15*)
10.1%
15.4%
21.8%
14.1%
15.4%
20,0%
20.2%
5.0%
20.3%
24.4%
23.7%
26.4%
IPOs as % of
PE exits
IPOs as % of
PE exits
2.7%
14.8%
21.8%
11.2%
25.4%
12.4%
27.8%
4.2%
14.3%
25.4%
17.0%
19.1%
Americas PE exits by deal value (US$m) (2004-1Q15*)
IPOs as % of
PE exits
13.8%
12.8%
7.6%
1.6%
2.7%
5.3%
1.6%
1.1%
9.8%
10.9%
9.9%
11.6%
IPOs as % of
PE exits EMEA1 PE exits by deal value (US$m) (2004-1Q15*)
24.1%
19.5%
18.5%
2.8%
2.8%
10.1%
2.6%
4.4%
11.9%
15.9%
13.5%
11.7%
“Strategic sales” are sales to corporations (i.e., M&A) while “secondary sales” are sales to other PE firms.
*1Q15* shows IPOs that have been priced by 17 March.
1EMEA refers to Europe, Middle East and African exchanges. India is included within Asia-Pacific.

Page 20 1Q15 Global IPO update
PE exit trends by region US value up dramatically in 2014, though number of deals declines. EMEA1 sees continued strength, as Asia-Pacific continues to work through China backlog.
29
55
70
99
58
71
89
122
105
117
99
15
6
6
14
16
12
6
17
21
20
20
14
1
30
28
40
66
37
21
51
42
36
49
53
3
0 100 200
2004
2005
2006
2007
2008
2009
2010
2011
2012
2013
2014
2015 YTD
Strategic sales Secondary sales IPOs
7,7
15,3
5,2
12,8
6,0
7,3
15,0
32,3
13,7
15,1
34,4
4,2
0,4
0,5
1,0
6,3
2,6
1,4
1,7
7,2
4,0
2,0
1,7
0.3
8,1
2,8
6,5
15,6
3,9
5,8
9,1
5,9
4,4
6,0
0,9
0 10 20 30 40 50
2004
2005
2006
2007
2008
2009
2010
2011
2012
2013
2014
2015 YTD
Strategic sales Secondary sales IPOs
Key insights ► European strength continues as sponsors work out of pre-recession era deals. PE firms took 70 companies public during 2014, which was a new record,
and strength has continued into the new year, with an additional 16 PE-backed companies listing on regional exchanges.
► Asia-Pacific continues to gain strength from stronger equities markets in the second half of 2014, as well as the reopening of the IPO window in Mainland
China. With the window effectively closed throughout 2013, firms had to decide whether to wait out the shutdown or pursue alternative exits such as trade
sales and secondary buyouts. China was the source of the largest PE-backed deal in history, when the long-anticipated Alibaba IPO went effective at
US$25.0b. Indeed, it wasn’t just the largest PE-backed IPO of all time; it was the largest IPO ever, surpassing the US$22.1b offering by the Agricultural
Bank of China in 2010. The company, which was backed by a range of sponsors including Silver Lake, General Atlantic, China Investment Corporation,
CITIC Capital Management, The Canada Pension Plan Investment Board and others, highlights some key trends in the PE asset class: 1) the increasingly
important role that growth capital is playing; and 2) it underscores the importance and the potential of emerging markets such as China to the asset class.
► The Americas region saw a marked uptick in value in 2014, although the number of deals fell to 88 from 103. Activity in the first three months of 2015 has
been muted. Some observers cite lower oil prices as a potential source of the slowdown.
IPOs as % of
PE exits IPOs as % of
PE exits
15.8%
31.9%
26.3%
22.4%
22.7%
32.3%
21.4%
34.6%
36.5%
32.3%
31.5%
46.2%
16.2%
54,2%
25.8%
19.7%
12.9%
35.3%
40.2%
30.3%
44.8%
51.1%
15.1%
50.0%
Asia-Pacific PE exits by deal volume (2004-1Q15*) Asia-Pacific PE exits by deal value (US$m) (2004-1Q15*)
“Strategic sales” are sales to corporations (i.e., M&A) while “secondary sales” are sales to other PE firms. 1EMEA refers to Europe, Middle East and African exchanges. India is included within Asia-Pacific.
*1Q15* shows IPOs that have been priced by 17 March.
Page 21 1Q15 Global IPO update
Table of contents
Section Content Slides
1 2015 January – March highlights 4-8
2 Global IPO activity trends Global analysis
Regional analysis
Industry analysis
Stock exchange analysis
10-14
3 PE-backed IPO activity 16-19
4 Appendices 21-30

Page 22 1Q15 Global IPO update
Asia-Pacific1 IPO activity trends IPO activity increased by 25% in 1Q15* in terms of volume while it decreased by 18% in terms of value when compared with levels seen in 1Q141.
Former state-owned enterprise (SOE) IPO activity in Asia-
Pacific (2007-1Q15*)
1Q15* Asia-Pacific IPOs by sector
IPO pricing and performance: 1Q15* IPOs
Measures 1Q15* IPOs
% of IPOs priced within or above initial pricing range 99.2%
First-day average return +39.6%
% change of offer price vs. 17 March +158.3%
Median post-IPO market cap US$166.9m
Hang Seng Index – 2015 YTD returns +1.5%
Shanghai SE Composite Index – 2015 YTD returns +6.6%
Nikkei 225 – 2015 YTD returns +10.3%
Sectors Number of
deals Proceeds (US$m)
Industrials 32 2,146.0
Technology 25 1,136.6
Materials 17 1,024.1
Consumer products 15 1,244.1
Health care 11 577.7
Financials 8 2,475.6
Real estate 8 933.5
Retail 8 541.6
Energy 7 3,218.4
Media and entertainment 7 537.6
Consumer staples 6 274.3
Telecommunications 1 1,686.3
Grand Total 145 15,795.8
Asia-Pacific IPO activity (2007-1Q15*)
1Based in IPO activity on Asia-Pacific stock exchanges. More information on 1Q15, please see the Asia-Pacific infographic on slide 6.
$125 $32 $72 $179 $88 $56 $59 $83 $16
760
350 347
746
675
437
376
564
145
0
100
200
300
400
500
600
700
800
0
20
40
60
80
100
120
140
160
180
200
20
07
20
08
20
09
20
10
20
11
20
12
20
13
20
14
1Q
15
*
Num
ber
of IP
Os
Capital ra
ised (
US
$b)
Capital raised (US$b)
$65 $14 $22 $54 $1 $12 $11 $17 $0
69
27 24
73
4 7 8
11
0
10
20
30
40
50
60
70
80
0
10
20
30
40
50
60
70
20
07
20
08
20
09
20
10
20
11
20
12
20
13
20
14
1Q
15
*
Num
ber
of IP
Os
Capital ra
ised (
US
$b)
Capital raised (US$b)
*Data for 1Q15* and 2015* is based on priced IPOs as of 17 March and expected IPOs by end of March; data is up to 17 March 2015, 9:00 a.m. India time.

Page 23 1Q15 Global IPO update
EMEIA1 IPO activity trends EMEIA IPO activity on the main markets improved in 1Q15*, compared with 1Q14.
EMEIA financial sponsor-backed IPO activity (2007-1Q15*)
Annual EMEIA IPO activity (2007-1Q15*)
1Based in IPO activity on EMEIA stock exchanges. See Appendix for definitions of main market and junior market.
$126 $36 $14 $48 $33 $16 $34 $75 $17
823
310
112
354 353
209 240
365
67
0
100
200
300
400
500
600
700
800
900
0
20
40
60
80
100
120
140
20
07
20
08
20
09
20
10
20
11
20
12
20
13
20
14
1Q
15
*
Num
ber
of IP
Os
Capital ra
ised (
US
$b)
Capital raised (US$b)
$22 $3 $2 $11 $4 $3 $17 $36 $9
101
15 8
37 30
14
38
77
20
0
20
40
60
80
100
120
0
5
10
15
20
25
30
35
40
20
07
20
08
20
09
20
10
20
11
20
12
20
13
20
14
1Q
15
*
Num
ber
of IP
Os
Capital ra
ised (
US
$b)
Capital raised (US$b)
1Q15* EMEIA IPOs by sector
IPO pricing and performance: 1Q15* IPOs
Measures 1Q15* IPOs
% of IPOs priced within or above initial pricing range 97.7%
EMEIA main markets’ IPOs – first-day average return +10.2%
EMEIA main markets’ IPO – % change of offer price vs.
17 March +20.8%
EMEIA main markets’ IPO – median post-IPO market cap US$412.5m
FTSE 100 – 2015 YTD returns +3.6%
DAX – 2015 YTD returns +24.1%
CAC – 2015 YTD returns +18.5%
Sectors Number of
deals Proceeds (US$m)
Industrials 11 7,644.6
Consumer staples 8 212.5
Health care 8 181.4
Consumer products 7 1,549.2
Financials 7 946.1
Materials 7 258.0
Media and entertainment 6 648.5
Technology 6 632.5
Retail 3 1,767.2
Energy 2 512.3
Telecommunications 1 2,459.3
Real estate 1 2.4
Grand Total 67 16,813.9
*Data for 1Q15* and 2015* is based on priced IPOs as of 17 March and expected IPOs by end of March; data is up to 17 March 2015, 9:00 a.m. India time.

Page 24 1Q15 Global IPO update
US1 IPO activity trends Financial sponsor-backed activity went down considerably in 1Q15*, compared with 1Q14.
US financial sponsor-backed IPO activity (2007-1Q15*)
Annual US IPO activity (2007-1Q15*)
1Based in IPO activity on US stock exchanges: NYSE, NASDAQ and NYSE – AMEX
$50 $27 $27 $43 $40 $47 $62 $96 $6
214
35
65
162
124 133
226
291
38
0
50
100
150
200
250
300
350
0
20
40
60
80
100
120
20
07
20
08
20
09
20
10
20
11
20
12
20
13
20
14
20
15
*
Num
ber
of IP
Os
Capital ra
ised (
US
$b)
Capital raised (US$b)
$24 $3 $10 $17 $30 $32 $41 $70 $3
124
13
36
108
80 87
144
185
21
0
20
40
60
80
100
120
140
160
180
200
0
10
20
30
40
50
60
70
80
20
07
20
08
20
09
20
10
20
11
20
12
20
13
20
14
20
15
*
Num
ber
of IP
Os
Capital ra
ised (
US
$b)
Capital raised (US$b)
1Q15* US IPOs by sector
IPO pricing and performance: 1Q15* IPOs
Measures 1Q15* IPOs
% of IPOs priced within or above initial filing range 63.0%
First day average return +19.0%
% change of offer price vs. 17 March +19.0%
Median post-IPO market cap US$294.0m
S&P 500 – 2015 YTD returns +1.1%
DJIA – 2015 YTD returns +0.9%
CBOE Volatility Index® (VIX®) - change from 1 Jan. -18.7%
Sectors Number of
deals Proceeds (US$m)
Health care 18 1,196.6
Financials 5 268.3
Technology 4 1,020.8
Real estate 4 911.2
Energy 2 1,383.1
Industrials 2 689.1
Materials 2 31.2
Retail 1 120.8
Grand Total 38 5,621.0
*Data for 1Q15* and 2015* is based on priced IPOs as of 17 March and expected IPOs by end of March; data is up to 17 March 2015, 9:00 a.m. India time.

Page 25 1Q15 Global IPO update
Pricing range Ninety-four percent of global IPOs1 were priced within or above the initial filing range in 1Q15* compared with 92% in 1Q14.
1Chart shows the number of open-price IPOs with deal value above US$50m that are priced above, below or within their initial filing range. For 3% of IPOs, this range is not applicable.
12% 11% 14% 16% 9% 7%
3% 11% 10% 10% 7% 7% 6% 6% 5% 9% 11%
8% 11% 7% 6%
12% 9% 10% 8%
12% 14% 14%
6%
87% 88% 86% 84%
91%
74%
95%
86% 85% 88% 90% 90%
88% 88% 92% 83% 83% 87%
85% 90%
85%
83%
80% 82% 85%
82% 78% 80%
89%
1% 1%
19%
2% 3% 5% 2% 3% 3% 6% 5% 4%
8% 6% 5% 4% 3% 9%
5% 11%
8% 7% 6% 8% 6% 5%
2%
12%
22%
32%
42%
52%
62%
72%
82%
92%
1Q
08
2Q
08
3Q
08
4Q
08
1Q
09
2Q
09
3Q
09
4Q
09
1Q
10
2Q
10
3Q
10
4Q
10
1Q
11
2Q
11
3Q
11
4Q
11
1Q
12
2Q
12
3Q
12
4Q
12
1Q
13
2Q
13
3Q
13
4Q
13
1Q
14
2Q
14
3Q
14
4Q
14
1Q
15
*
Num
ber
of deals
Below In range Above
227 276 171 84 52 84 141 288 282 313 296 474 306 384 293 260 203 243 192 201 163 205 202 325 262 335 276 359 Total
number of
IPOs
89% of global IPOs in 1Q15* were priced within their initial filing range, 5% were priced above their initial filing range and 6% of IPOs were
priced below their initial filing range.
*Data for 1Q15* and 2015* is based on priced IPOs as of 17 March and expected IPOs by end of March; data is up to 17 March 2015, 9:00 a.m. India time.
Page 26 1Q15 Global IPO update
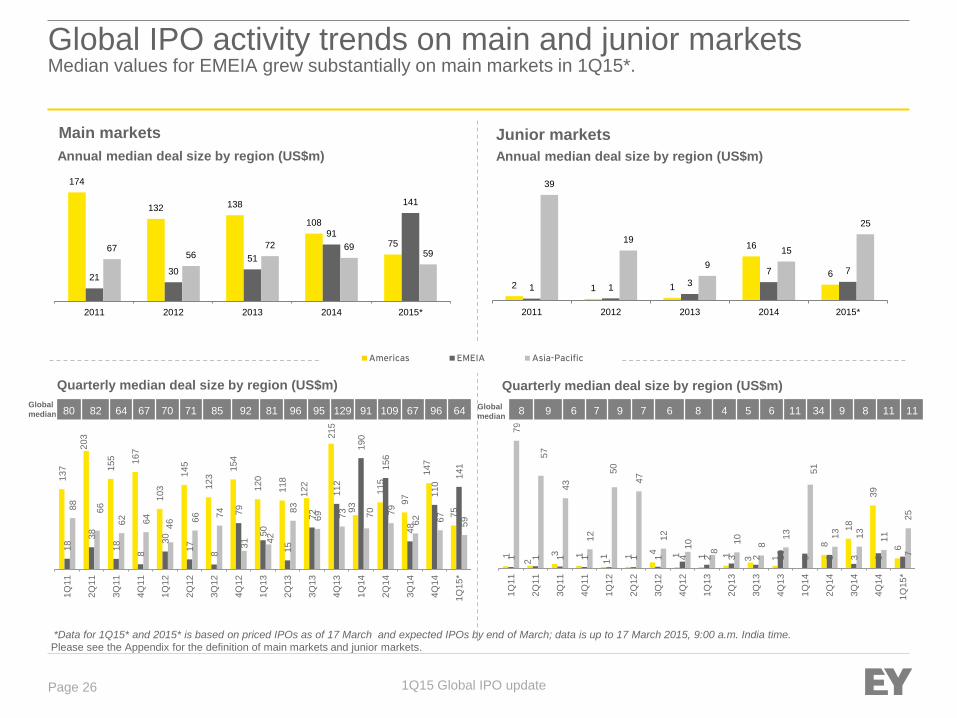
Global IPO activity trends on main and junior markets Median values for EMEIA grew substantially on main markets in 1Q15*.
Please see the Appendix for the definition of main markets and junior markets.
Annual median deal size by region (US$m)
Quarterly median deal size by region (US$m)
Americas EMEIA Asia-Pacific
Main markets Junior markets
Annual median deal size by region (US$m)
Global
median
Global
median
Quarterly median deal size by region (US$m)
174
132 138
108
75
21 30
51
91
141
67 56
72 69 59
2011 2012 2013 2014 2015*
137
203
155
167
103
145
123 1
54
120
118
122
215
93
115
97
147
75
18 3
8
18
8
30
17
8
79
50
15
72
112
190
156
48
110 1
41
88
66
62
64
46 66
74
31
42
83
69
73
70
79
62
67
59
1Q
11
2Q
11
3Q
11
4Q
11
1Q
12
2Q
12
3Q
12
4Q
12
1Q
13
2Q
13
3Q
13
4Q
13
1Q
14
2Q
14
3Q
14
4Q
14
1Q
15
*
2 1 1
16
6
1 1 3
7 7
39
19
9
15
25
2011 2012 2013 2014 2015*
1
2 3
1
1
1 4
1
1 1
3
1
8
18
39
6
1
1
1
1
1 1
1
4
2
3
2
10
9
8
3
9 7
79
57
43
12
50
47
12
10
8 1
0
8 1
3
51
13
13
11
25
1Q
11
2Q
11
3Q
11
4Q
11
1Q
12
2Q
12
3Q
12
4Q
12
1Q
13
2Q
13
3Q
13
4Q
13
1Q
14
2Q
14
3Q
14
4Q
14
1Q
15
*
8 9 6 7 9 7 6 8 4 5 6 11 34 9 8 11 11 80 82 64 67 70 71 85 92 81 96 95 129 91 109 67 96 64
*Data for 1Q15* and 2015* is based on priced IPOs as of 17 March and expected IPOs by end of March; data is up to 17 March 2015, 9:00 a.m. India time.

Page 27 1Q15 Global IPO update
Appendix: key global IPO statistics (US$)
1Percentage change from 2010 to 2011 2Percentage change from 2011 to 2012 3Percentage change from 2012 to 2013 4Percentage change from 2013 to 2014
5Consumer products includes consumer services 6Throughout slides, financial sponsor backed IPOs refer to IPOs backed by PE and/or VC funds. In 1Q15, there were 43 IPOs raising US$12.1b.
Please see Appendix for the list of stock exchanges. *Data for 1Q15* and 2015* is based on priced IPOs as of 17 March and expected IPOs by end of March; data is up to 17 March 2015, 9:00 a.m. India time.
2011 2012 2013 2014 1Q15*
Number of deals 1,243 (▼ 9%1) 839 (▼ 33%2) 895 (▲7%3) 1241 (▲38.7%4) 252
Capital raised $170.2b (▼ 40%1) $128.6b (▼ 24%2) $171.1b (▲33%3) $259.2b (▲51.5%4) $38.2b
Average deal size $137.0m $153.3m $191.1m $208.9m $151.8m
PE-backed IPOs 119 deals, $38.3b 107 deals, $19.4b 185 deals, $58.3b 211 deals, $109.9b 30 deals, $10.5b
VC-backed IPOs 143 deals, $17.3b 92 deals, $23.2b 129 deals, $14.1b 159 deals, $22.8b 17 deals, $2.1b
Top 5 sectors
(number of deals)
Materials (271)
Industrials (215)
Technology (146)
Energy (101)
Consumer products 5(98)
Materials (143)
Industrials (135)
Technology (115)
Energy (63)
Consumer staples (58)
Industrials (117)
Technology (115)
Real estate (100)
Health care (100)
Financials (92)
Health care (198)
Technology (169)
Industrials (146)
Consumer products
(111)
Materials (106)
Industrials (45)
Health care (38)
Technology (35)
Materials (26)
Consumer products (22)
Top 5 sectors
(capital raised)
Materials ($29.2b)
Industrials ($27.0b)
Energy ($20.8b)
Financials ($15.9b)
Technology ($15.5b)
Technology ($23.1b)
Industrials ($20.2b)
Financial ($19.4b)
Real estate ($12.5b)
Energy ($12.1b)
Financials ($28.6b)
Real estate ($27.0b)
Energy ($22.0b)
Industrials ($18.9b)
Health care ($12.4b)
Technology ($50.6b)
Financials ($43.2b)
Energy ($31.4b)
Real estate ($27.2b)
Health care ($22.6b)
Industrials ($10.5b)
Energy ($5.1b)
Telecommunications ($4.1b)
Financials ($3.7b)
Consumer products ($2.8b)
Top 5 exchanges
(number of deals)
Warsaw – New Connect
(136)
Shenzhen – ChiNext (128)
Shenzhen – SME (115)
Australian (101)
Hong Kong (68)
New York (78)
Shenzhen – ChiNext (74)
Warsaw – New Connect (62)
Shenzhen (55)
NASDAQ (54)
New York (116)
NASDAQ (109)
Hong Kong (76)
London AIM (54)
Australian (52)
NASDAQ (174)
New York (117)
Hong Kong (90)
London AIM (74)
Australian (70)
Shanghai SSE (35)
NASDAQ (25)
Shenzhen – Chinext (23)
Tokyo Mothers (17)
Hong Kong (14)
Top 5 exchanges
(capital raised)
New York ($30.5b)
Hong Kong ($25.3b)
Shenzhen ($15.7b)
Shanghai ($15.1b)
London ($13.9b)
New York ($24.0b)
NASDAQ ($22.6b)
Tokyo ($12.2b)
Hong Kong ($11.5b)
Bursa Malaysia ($7.6b)
New York ($45.8b)
Hong Kong ($21.4b)
NASDAQ ($15.8b)
London ($12.9b)
Tokyo ($9.3b)
New York ($73.8b)
Hong Kong ($29.1b)
NASDAQ ($22.2b)
London ($19.4b)
Australian ($16.0b)
Shanghai SSE ($5.4b)
Bolsa de Madrid ($5.3b)
New York ($3.5b)
London LSE ($3.3b)
Bursa Malaysia ($3.0b)

Page 28 1Q15 Global IPO update
Appendix: 1Q15* top 20 IPOs by capital raised
Issue
month Issuer name Domicile Sector Issuer business description
Capital
raised
(US$m)
Exchange(s) Type of IPO
February Aena SA Spain Industrials Airports operator. 4,823.8 Bolsa de
Madrid Former SOE
March 1MDB Energy Sdn Bhd Malaysia Energy Financial vehicle created for the purchase
of Tanjong by 1Malaysia Development. 3,000.0
Bursa
Malaysia
February Sunrise Communications AG Switzerland Telecommunicat
ions
Fixed-line telecommunications services
provider. 2,459.3
SIX Swiss
Exchange PE backed
February Jasmine Broadband Internet
Growth Infrastructure Fund Thailand
Telecommunicat
ions
Infrastructure Fund invest in fiber-optic
network for broadband internet. 1,686.3 Thailand (SET)
March Orient Securities Co., Ltd.
(China) China Financials
Provider of financial services, including
securities brokerage. 1,629.1
Shanghai
(SSE)
March Auto Trader Group Ltd. United
Kingdom Industrials
Provider of online motoring digital
marketplace for motor vehicle buyers and
sellers.
1,510.1 London (LSE) PE backed
February Columbia Pipeline Partners LP United States Energy Owns, operates and develops a portfolio
of pipelines for natural gas transmission. 1,238.2
New York
(NYSE)
February GrandVision NV Netherlands Retail Retailer of optical products. 1,167.9 Euronext
(Amsterdam)
PE backed
February Elis SA - Groupe Elis France Consumer
Products
Provides rental and cleaning of uniforms,
linens, water coolers and espresso coffee
machine, sanitary equipment and floor
protection.
966.8 Euronext
(Paris)
PE backed
March HKBN Ltd. Hong Kong,
China
Consumer
Products
Provider of fibre broadband services in
Hong Kong. 748.4
Hong Kong
(HKEx)
*Data for 1Q15* and 2015* is based on priced IPOs as of 17 March and expected IPOs by end of March; data is up to 17 March 2015, 9:00 a.m. India time.
Page 29 1Q15 Global IPO update
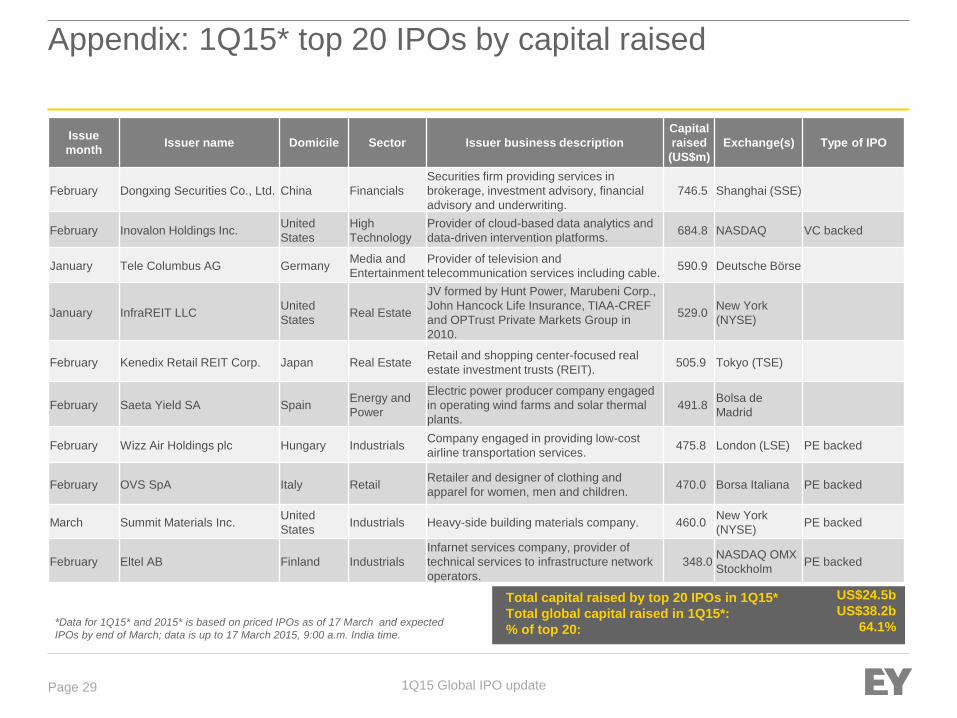
Appendix: 1Q15* top 20 IPOs by capital raised
Issue
month Issuer name Domicile Sector Issuer business description
Capital
raised
(US$m)
Exchange(s) Type of IPO
February Dongxing Securities Co., Ltd. China Financials
Securities firm providing services in
brokerage, investment advisory, financial
advisory and underwriting.
746.5 Shanghai (SSE)
February Inovalon Holdings Inc. United
States
High
Technology
Provider of cloud-based data analytics and
data-driven intervention platforms. 684.8 NASDAQ VC backed
January Tele Columbus AG Germany Media and
Entertainment
Provider of television and
telecommunication services including cable. 590.9 Deutsche Börse
January InfraREIT LLC United
States Real Estate
JV formed by Hunt Power, Marubeni Corp.,
John Hancock Life Insurance, TIAA-CREF
and OPTrust Private Markets Group in
2010.
529.0 New York
(NYSE)
February Kenedix Retail REIT Corp. Japan Real Estate Retail and shopping center-focused real
estate investment trusts (REIT). 505.9 Tokyo (TSE)
February Saeta Yield SA Spain Energy and
Power
Electric power producer company engaged
in operating wind farms and solar thermal
plants.
491.8 Bolsa de
Madrid
February Wizz Air Holdings plc Hungary Industrials Company engaged in providing low-cost
airline transportation services. 475.8 London (LSE) PE backed
February OVS SpA Italy Retail Retailer and designer of clothing and
apparel for women, men and children. 470.0 Borsa Italiana PE backed
March Summit Materials Inc. United
States Industrials Heavy-side building materials company. 460.0
New York
(NYSE) PE backed
February Eltel AB Finland Industrials
Infarnet services company, provider of
technical services to infrastructure network
operators.
348.0 NASDAQ OMX
Stockholm PE backed
Total capital raised by top 20 IPOs in 1Q15*
Total global capital raised in 1Q15*:
% of top 20:
US$24.5b
US$38.2b
64.1% *Data for 1Q15* and 2015* is based on priced IPOs as of 17 March and expected
IPOs by end of March; data is up to 17 March 2015, 9:00 a.m. India time.
Page 30 1Q15 Global IPO update
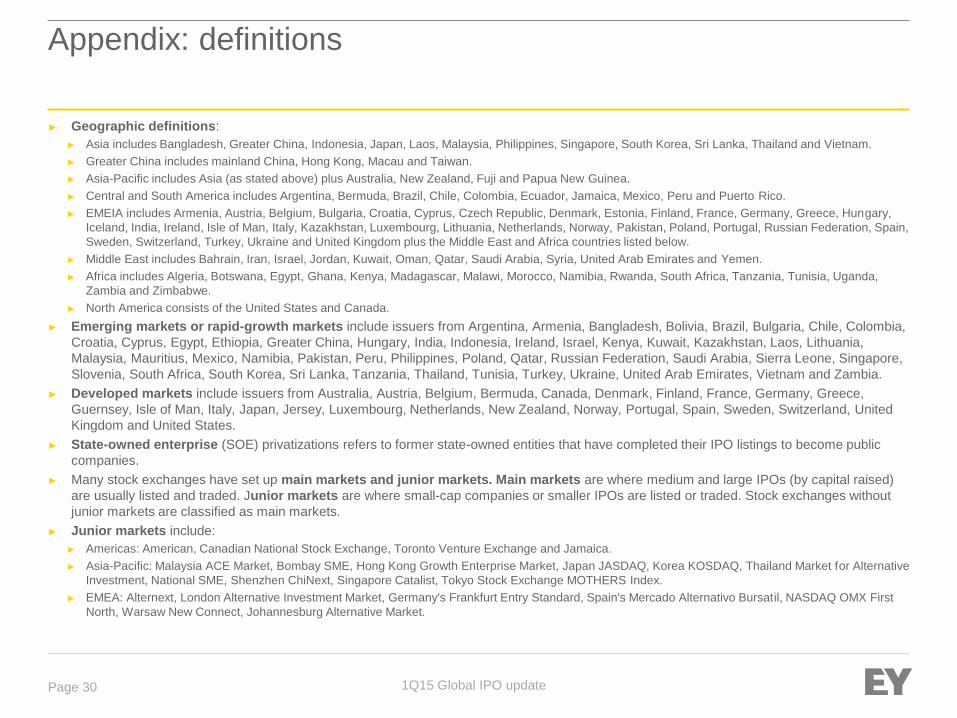
Appendix: definitions
► Geographic definitions:
► Asia includes Bangladesh, Greater China, Indonesia, Japan, Laos, Malaysia, Philippines, Singapore, South Korea, Sri Lanka, Thailand and Vietnam.
► Greater China includes mainland China, Hong Kong, Macau and Taiwan.
► Asia-Pacific includes Asia (as stated above) plus Australia, New Zealand, Fuji and Papua New Guinea.
► Central and South America includes Argentina, Bermuda, Brazil, Chile, Colombia, Ecuador, Jamaica, Mexico, Peru and Puerto Rico.
► EMEIA includes Armenia, Austria, Belgium, Bulgaria, Croatia, Cyprus, Czech Republic, Denmark, Estonia, Finland, France, Germany, Greece, Hungary,
Iceland, India, Ireland, Isle of Man, Italy, Kazakhstan, Luxembourg, Lithuania, Netherlands, Norway, Pakistan, Poland, Portugal, Russian Federation, Spain,
Sweden, Switzerland, Turkey, Ukraine and United Kingdom plus the Middle East and Africa countries listed below.
► Middle East includes Bahrain, Iran, Israel, Jordan, Kuwait, Oman, Qatar, Saudi Arabia, Syria, United Arab Emirates and Yemen.
► Africa includes Algeria, Botswana, Egypt, Ghana, Kenya, Madagascar, Malawi, Morocco, Namibia, Rwanda, South Africa, Tanzania, Tunisia, Uganda,
Zambia and Zimbabwe.
► North America consists of the United States and Canada.
► Emerging markets or rapid-growth markets include issuers from Argentina, Armenia, Bangladesh, Bolivia, Brazil, Bulgaria, Chile, Colombia,
Croatia, Cyprus, Egypt, Ethiopia, Greater China, Hungary, India, Indonesia, Ireland, Israel, Kenya, Kuwait, Kazakhstan, Laos, Lithuania,
Malaysia, Mauritius, Mexico, Namibia, Pakistan, Peru, Philippines, Poland, Qatar, Russian Federation, Saudi Arabia, Sierra Leone, Singapore,
Slovenia, South Africa, South Korea, Sri Lanka, Tanzania, Thailand, Tunisia, Turkey, Ukraine, United Arab Emirates, Vietnam and Zambia.
► Developed markets include issuers from Australia, Austria, Belgium, Bermuda, Canada, Denmark, Finland, France, Germany, Greece,
Guernsey, Isle of Man, Italy, Japan, Jersey, Luxembourg, Netherlands, New Zealand, Norway, Portugal, Spain, Sweden, Switzerland, United
Kingdom and United States.
► State-owned enterprise (SOE) privatizations refers to former state-owned entities that have completed their IPO listings to become public
companies.
► Many stock exchanges have set up main markets and junior markets. Main markets are where medium and large IPOs (by capital raised)
are usually listed and traded. Junior markets are where small-cap companies or smaller IPOs are listed or traded. Stock exchanges without
junior markets are classified as main markets.
► Junior markets include:
► Americas: American, Canadian National Stock Exchange, Toronto Venture Exchange and Jamaica.
► Asia-Pacific: Malaysia ACE Market, Bombay SME, Hong Kong Growth Enterprise Market, Japan JASDAQ, Korea KOSDAQ, Thailand Market for Alternative
Investment, National SME, Shenzhen ChiNext, Singapore Catalist, Tokyo Stock Exchange MOTHERS Index.
► EMEA: Alternext, London Alternative Investment Market, Germany's Frankfurt Entry Standard, Spain's Mercado Alternativo Bursatil, NASDAQ OMX First
North, Warsaw New Connect, Johannesburg Alternative Market.

Global IPO press release and Global IPO update slides – 2015 Q1 Date published: 20 March 2015
For PR inquiries, please contact:
Will Brewster
Associate Director, EY Global Media Relations
+44 (0) 207 980 0812
For information about EY’s IPO services and our IPO point of view, please contact:
Dr. Martin Steinbach
Ernst & Young GmbH Wirtschaftsprüfungsgesellschaft
Mergenthalerallee 3-5, 65760 Eschborn, Germany
Office: +49 (0) 6196 996 11574
Mobile: +49 (0) 160 939 11574
Produced by Global Markets — EY Knowledge:
Anshul Singh, Market Performance, Global Markets – EY Knowledge
+91 124 619 2943
Contributors include: Akriti Kapoor, Harshit Takkar
This report was requested by:
Eva Chan, Manager – Global IPO Center, Strategic Growth Markets
+44 (0) 207 980 0254
Visit the EY Knowledge CHS for help accessing and using knowledge tools and services.

EY | Assurance | Tax | Transactions | Advisory
About EY
EY is a global leader in assurance, tax, transaction and advisory services.
The insights and quality services we deliver help build trust and confidence
in the capital markets and in economies the world over. We develop
outstanding leaders who team to deliver our promises to all of our
stakeholders. In so doing, we play a critical role in building a better working
world for our people, for our clients and for our communities.
EY refers to the global organization, and may refer to one or more, of the
member firms of Ernst & Young Global Limited, each of which is a separate
legal entity. Ernst & Young Global Limited, a UK company limited by
guarantee, does not provide services to clients. For more information about
our organization, please visit ey.com.
About EY's IPO services
EY is a leader in helping to take companies public worldwide. With
decades of experience our global network is dedicated to serving market
leaders and helping businesses evaluate the pros and cons of an IPO. We
demystify the process by offering IPO readiness assessments, IPO
preparation, project management and execution services, all of which help
prepare you for life in the public spotlight. Our Global IPO Center of
Excellence is a virtual hub which provides access to our IPO knowledge,
tools, thought leadership and contacts from around the world in one easy-
to-use source. www.ey.com/ipocenter
© 2015 EYGM Limited.
All Rights Reserved.
EYG no. CY0882
ED None
This material has been prepared for general information purposes only and is not intended to
be relied upon as accounting, tax or other professional advice. Please refer to your advisors
for specific advice.
www.ey.com/ipocenter