Q3 Results
27
4 NOVEMBER 2021 Q3 Results Mikko Ayub CEO
Transcript of Q3 Results

4 NOVEMBER 2021
Q3 Results
Mikko AyubCEO

EUR million 3Q2021 3Q2020 %
Total operating income 67.1 49.4 36%
Net interest income 23.1 20.0 16%
Net commission income 33.5 24.2 39%
Net income from life insurance 9.7 4.7 105%
Other income 0.7 0.5 44%
Total operating expenses -41.6 -33.8 23%
Impairments of credits and other commitments -1.0 -0.1 -
Operating profit 24.4 16.0 53%
Comparable operating profit 23.8 16.0 49%
EPS, EUR 0.28 0.18 54%
ROE, % 11.4 7.8 46%
Cost-to-income ratio (comparable) 0.63 0.68 -8%
CET1, % 10.4 15.6 -33%
• Good net interest income
• Net commission income also at a very good level
• Strong net income from life insurance was
attributable to good sales and an improved
investment income
• Comparable cost-to-income ratio decreased to
0.63
• On 14 October 2021, Aktia paid EUR 0.43
dividend per share for the financial year 2020.
The paid dividend amounted to EUR 30.9 million
4 November 2021Aktia Q3 2021 Results Presentation 2
Continued good performance in all business areas
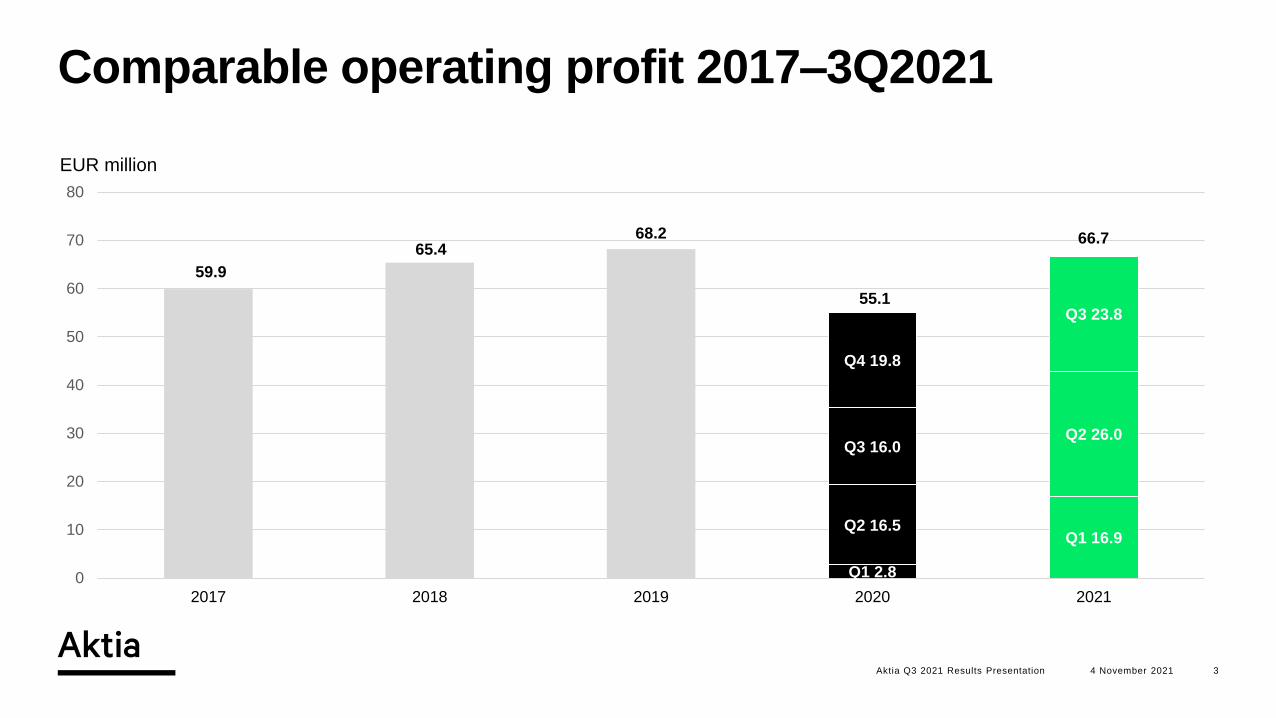
59.9
65.468.2
Q1 2.8
Q1 16.9Q2 16.5
Q2 26.0Q3 16.0
Q3 23.8
Q4 19.8
0
10
20
30
40
50
60
70
80
2017 2018 2019 2020 2021
4 November 2021Aktia Q3 2021 Results Presentation 3
Comparable operating profit 2017–3Q2021
55.1
66.7
EUR million

• Integration work continued in Q3 and proceeded
according to plans and timetable
• The organisational structure of Aktia’s asset
management was completed during Q3
• Customer service models merged, and piloting
projects initiated during Q3
• Financing of investments well received by
customers
• Preparation for year end legal entity mergers
advances
• Returning to office work supports building new
culture
4 November 2021Aktia Q3 2021 Results Presentation 4
Asset Management
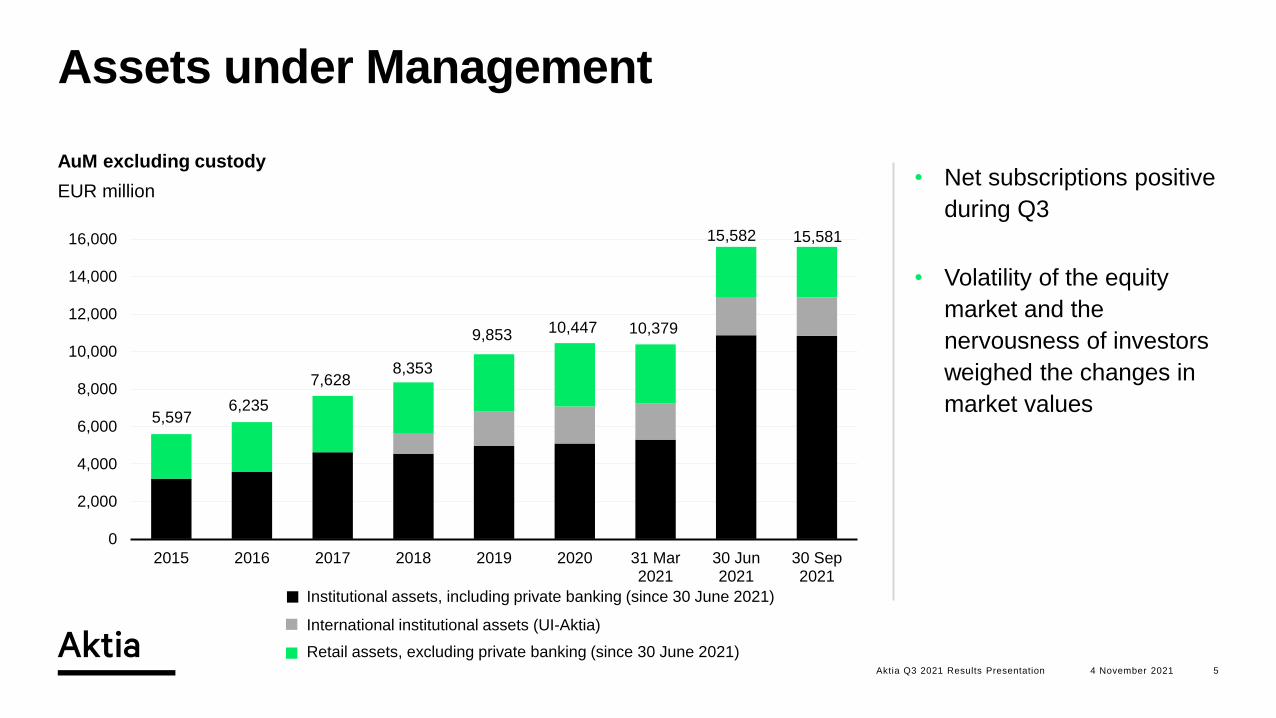
5,5976,235
7,6288,353
9,853 10,447 10,379
15,582 15,581
0
2,000
4,000
6,000
8,000
10,000
12,000
14,000
16,000
2015 2016 2017 2018 2019 2020 31 Mar2021
30 Jun2021
30 Sep2021
Aktia Q3 2021 Results Presentation 5
Assets under Management
AuM excluding custody
EUR million
4 November 2021
International institutional assets (UI-Aktia)
Retail assets, excluding private banking (since 30 June 2021)
Institutional assets, including private banking (since 30 June 2021)
• Net subscriptions positive
during Q3
• Volatility of the equity
market and the
nervousness of investors
weighed the changes in
market values

• Growth in loan book continues
• Loan margins from corporate customers continued to increase
during Q3
• Goal not to increase volume or gain market share as such, we
hold strong focus on profitability and good quality of the credit
portfolio
• Aktia and Finnair have agreed on co-operation and will introduce
a new Finnair Visa credit card into the market in spring 2022,
which opens access to customers at the core of our strategy
• Customer satisfaction was at a good level according to surveys in
the autumn and the satisfaction of Premium customers in
particular was downright excellent
• Particular effort was made to develop the customer service for
corporate customers as well as to organise the work, which our
customers noticed as shorter waiting and service times
• Aktia’s investments in the sales and development of leasing
products were also reflected in the profitable growth of the credit
book and market share in Aktia’s SME sector
4 November 2021Aktia Q3 2021 Results Presentation 6
Banking Business

• The demand for risk life insurances continued to
increase, particularly the sales of critical illness
insurances developed well
• Co-operation with Finlands Företagarskydd
continued well, strengthening Aktia Life’s position
particularly amongst SME companies
• Focus within business development has been on
improving the risk life insurance underwriting
processes and on broadening the investment
offering
4 November 2021Aktia Q3 2021 Results Presentation 7
Life Insurance

Our three strategic priorities 2025
Win in wealth managementA) The most preferred wealth manager among private and institutional customers
B) Success in integrating Taaleri’s wealth management operations
Growth among customers who are willing to increase their wealthC) Acquire new customers to our strategic sweet-spot
D) Focus on cross-sales and development of our current customer base
Excellent customer experienceE) Seamless collaboration and holistic service models across all business areas
1
2
3
OUR VISION
The leading wealth
manager bank
OUR MISSION
Building wealth for our
customers and society
Courageously Skillfully Together

Focus on guiding customers to our focal point
Focus on excellent customer experience
and offering for single product customers
Focus on production and service cost for
single product customers
Growth through cross-selling
Focus on cross sales and development of
our current customer base
ASSET
MANAGEMENT
BANKING LIFE
Growth in our strategic sweet-spot
Offering comprehensive wealth
management to our target segments,
including wealth plans, financing, asset
management services, personal life
insurance and convenient banking services
4 November 2021Aktia Q3 2021 Results Presentation 9

The financial targets 2025
Comparable
operating profit
above EUR 120
million
1–9/2021;
EUR 66.7 million
Comparable
return on
Equity (ROE)
above 12%
30 September 2021;
10.4%
Comparable
cost-to-income
ratio under 0.60
1–9/2021;
0.64
Common Equity
Tier 1 capital ratio
(CET1) above 1.5
percentage points
over the regulatory
requirement
30 September 2021;
2.7 percentage points over
the minimum capital
requirement 7.7%
4 November 2021Aktia Q3 2021 Results Presentation 10

Aktia maintains its previous outlook in which the comparable operating profit for 2021 is expected to
be considerably higher than during 2020 (maintained)
• The increase in net interest income is expected to continue owing to strong volume increase and
reasonable financing expenses
• The increase in commission income from fund and asset management is expected to be higher than
during the first half year due to the acquisition of Taaleri’s wealth management operations
• Expenses are expected to be higher than during 2020 considering the increased staff expenses due to the
acquisition of Taaleri’s wealth management operations as well as one-off transaction and integration
related expenses
• Provisions for possible expected credit losses are expected to increase moderately. Aktia’s liquidity is
expected to be at a high level and the capital adequacy ratio is expected to be stable
4 November 2021Aktia Q3 2021 Results Presentation 11
Outlook 2021
4 November 2021Aktia Q3 2021 Results Presentation
Aktia Q3 2021 Results presentation
Financialoverview
Outi HenrikssonCFO
12
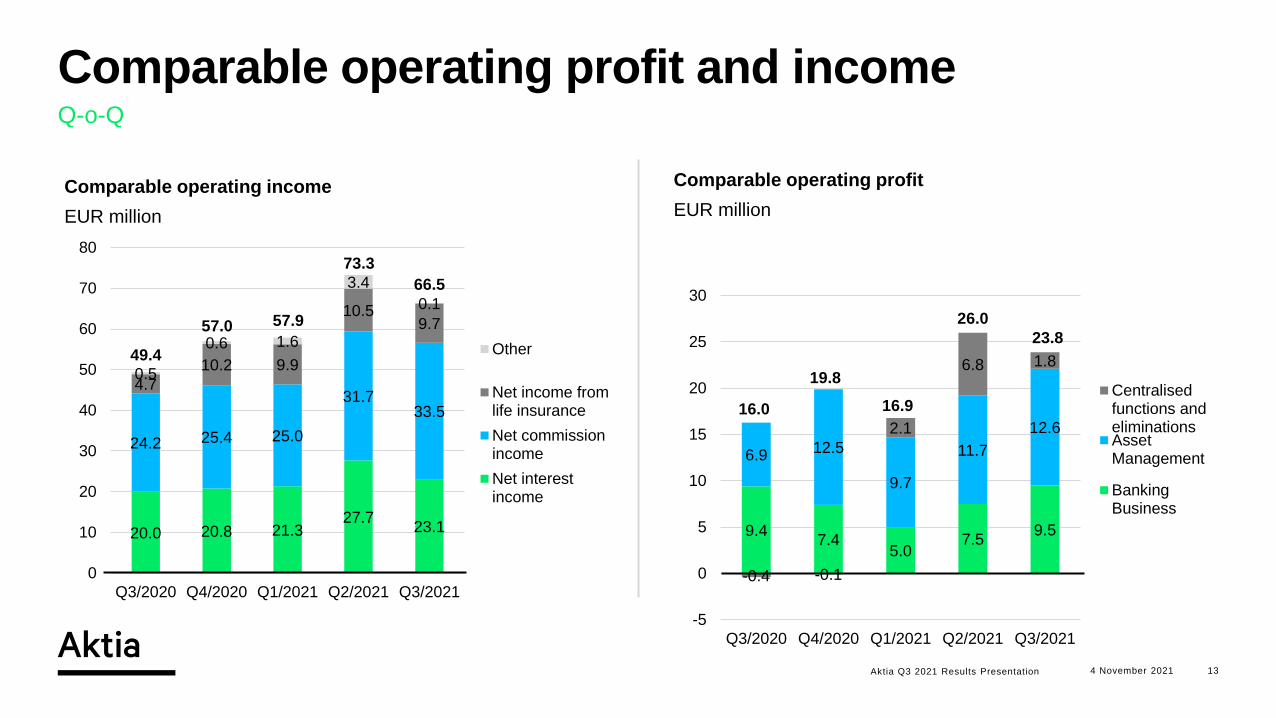
9.47.4
5.07.5
9.5
6.9 12.5
9.7
11.7
12.6
-0.4 -0.1
2.1
6.8 1.8
-5
0
5
10
15
20
25
30
Q3/2020 Q4/2020 Q1/2021 Q2/2021 Q3/2021
Centralisedfunctions andeliminationsAssetManagement
BankingBusiness
4 November 2021Aktia Q3 2021 Results Presentation
Comparable operating profit and income
Comparable operating profit
EUR million
Q-o-Q
20.0 20.8 21.327.7
23.1
24.2 25.4 25.0
31.733.5
4.7
10.2 9.9
10.59.7
0.5
0.6 1.6
3.4
0.1
0
10
20
30
40
50
60
70
80
Q3/2020 Q4/2020 Q1/2021 Q2/2021 Q3/2021
Other
Net income fromlife insurance
Net commissionincome
Net interestincome
Comparable operating income
EUR million
57.0 57.9
66.5
49.4
13
23.8
19.8
16.916.0
26.0
73.3
4 November 2021Aktia Q3 2021 Results Presentation
Comparable operating profit1–9/2021 vs 1–9/2020 +43% underlying profit growth
(without unrealised value changes)
EUR million
14
Comparable
operating profit
1–9/2020
Net interest
income
Net commission
income
Actuarially
calculated result
(Net income from
life insurance)
Other net income
from investments
(Net income from
life insurance)Comparable
operating profit
1–9/2021
Other
Model-based
expected credit
losses (ECL)
Operating
expenses
Other incomeValue changes
in the Life
Insurance
investment
portfolio
Negative interest
rate of TLTRO
loan (part of total
NII)
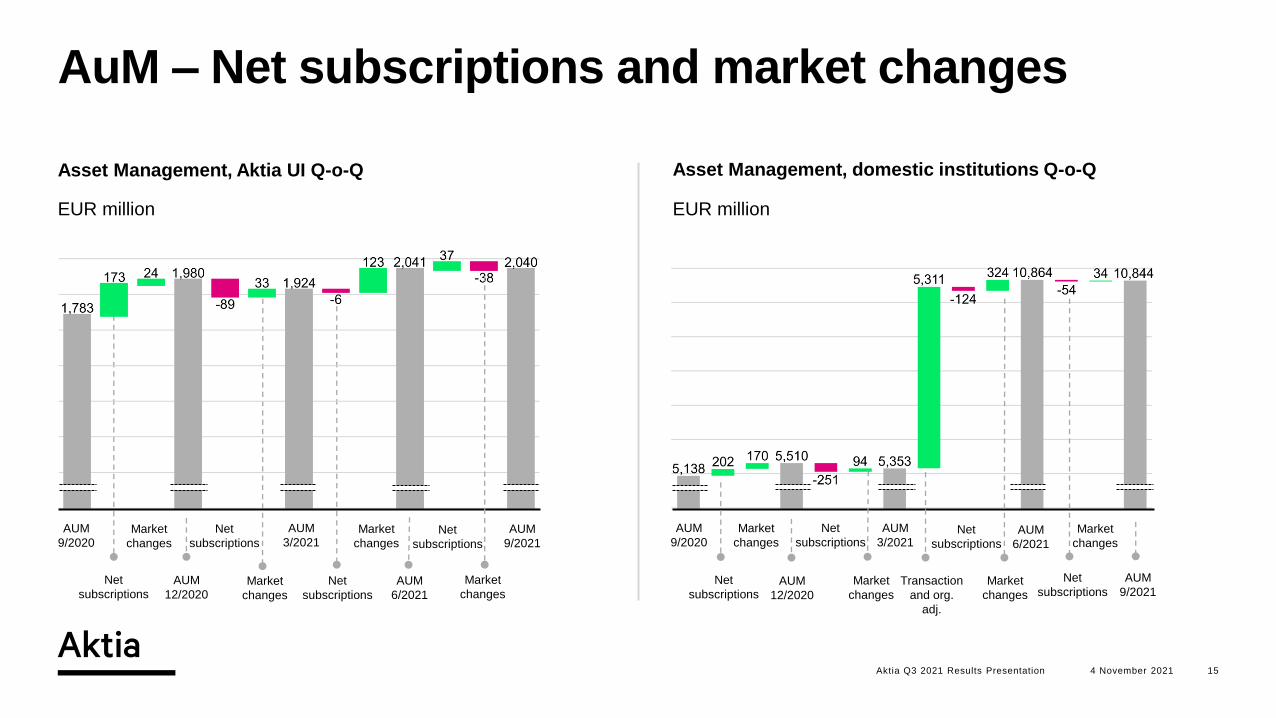
AuM – Net subscriptions and market changes
4 November 2021 15
AUM
9/2020
Net
subscriptions
Market
changes
AUM
12/2020
AUM
3/2021Net
subscriptions
Market
changes
Net
subscriptions
Market
changes
AUM
6/2021
Net
subscriptions
Market
changes
AUM
9/2021AUM
6/2021
Net
subscriptions
Market
changes
AUM
9/2020
AUM
12/2020
Net
subscriptions
Market
changes
Net
subscriptions
Market
changes
AUM
3/2021
Net
subscriptions
Market
changes
AUM
9/2021
Asset Management, Aktia UI Q-o-Q
EUR million
Asset Management, domestic institutions Q-o-Q
EUR million
Transaction
and org.
adj.
Aktia Q3 2021 Results Presentation
4 November 2021Aktia Q3 2021 Results Presentation 16
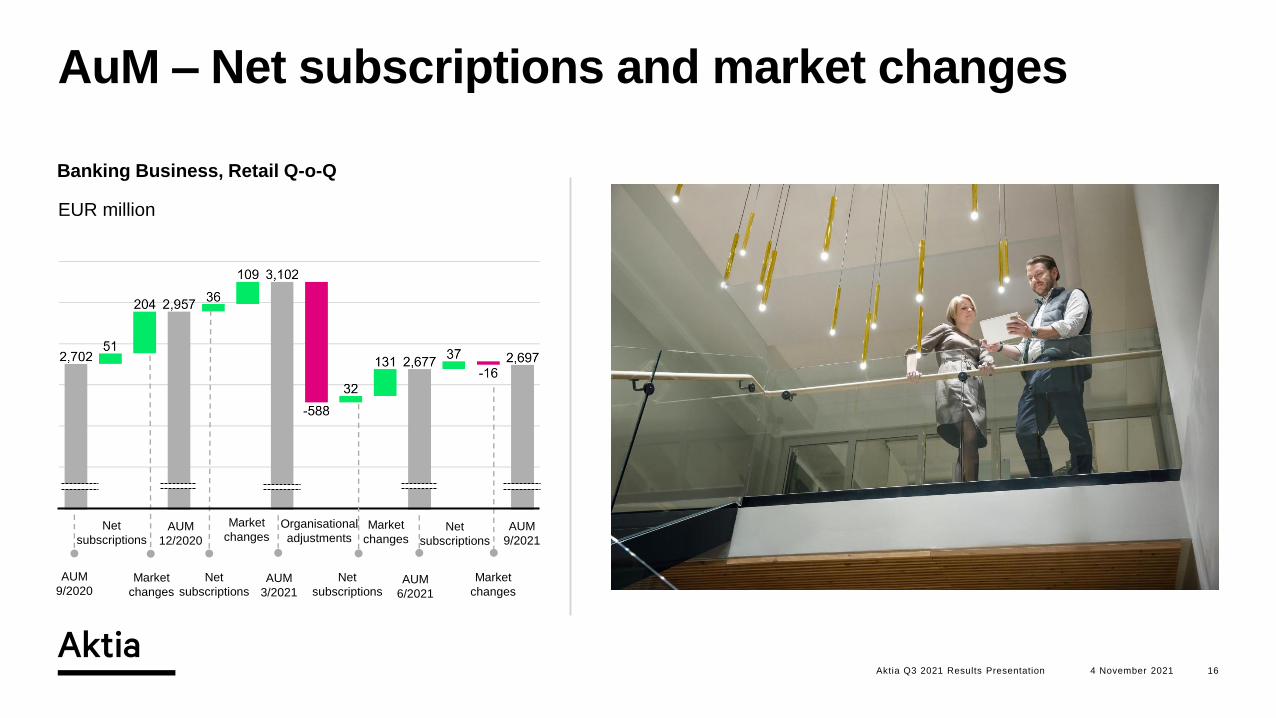
AuM – Net subscriptions and market changes
EUR million
AUM
9/2021
Net
subscriptions
Market
changes
AUM
9/2020
AUM
12/2020
Net
subscriptions
Market
changes
Net
subscriptions
Market
changes
AUM
3/2021
Net
subscriptions
Market
changes
AUM
6/2021
Banking Business, Retail Q-o-Q
Organisational
adjustments
Comparable operating expenses 1–9/2021 vs 1–9/2020
Comparable
operating expenses
1–9/2020Staff costs Comparable
operating expenses
1–9/2021
Other
operating
expenses
Stability
fee
IT
expenses
EUR million
Staff costs:
Staff costs increased by 20% to EUR 126.2
(105.5) million. The increase is mainly attributable
to increase in personnel as a result of acquisition
of Taaleri’s wealth management operations (in
2Q).
IT expenses:
IT expenses increased by 13% to EUR 21.6 (19.0)
million. The difference is mainly attributable to
Taaleri’s wealth management operations IT
expenses as well as a greater number of IT
projects than for the corresponding period last
year.
Other operating expenses:
Comparable other operating expenses increased
by 34% to EUR 29.0 (21.6) million. The increase
mainly pertains to one-off expenses (advisory
fees, transfer taxes) relating to the acquisition of
Taaleri’s wealth management operations. The
stability fee increased to EUR 4.1 (2.8) million.
The depreciations of intangible assets increased
as a result of the acquisition of Taaleri’s wealth
management operations, while Aktia’s other
depreciations have somewhat decreased.
4 November 2021Aktia Q3 2021 Results Presentation 17
Depreciations One-off
expenses
related to the
acquisition of
Taaleri
Impairments for future expected credit losses
• Impairments on credits and other
commitments increased to EUR -4.6 (-3.2)
million, of which the change in the
allowance for model-based credit losses
(ECL) amounted to EUR -2.0 (-1.6) million,
whereas other impairments on credits
increased to EUR -2.6 (-1.6) million.
• The new definition of default that entered
into force on 1 January 2021 increased the
model-based impairments with
approximately EUR 0.8 million and has
also affected the individual impairments.
• The macroeconomic assumptions were
updated again in Q3, no material impact in
3Q.
• We still have not observed any major
covid-related new risk concentrations in
our credit portfolio.
EUR million
4 November 2021Aktia Q3 2021 Results Presentation
Change in expected credit losses (ECL) 1–9/2021
18
Impairment
31 Dec 2020
Loan book
stage 1
(model-
based)
Loan book
stage 2
(model-
based)Loan book
stage 3
(model-based
and individually
assessed)
Interest-bearing
securities stage
1 (model-based) Realised losses
for which write-
downs were made
in previous years
Impairment
30 Sep 2021
Impairment of credits and other
commitments 1–9/2021 EUR –4.6 million
4 November 2021Aktia Q3 2021 Results Presentation
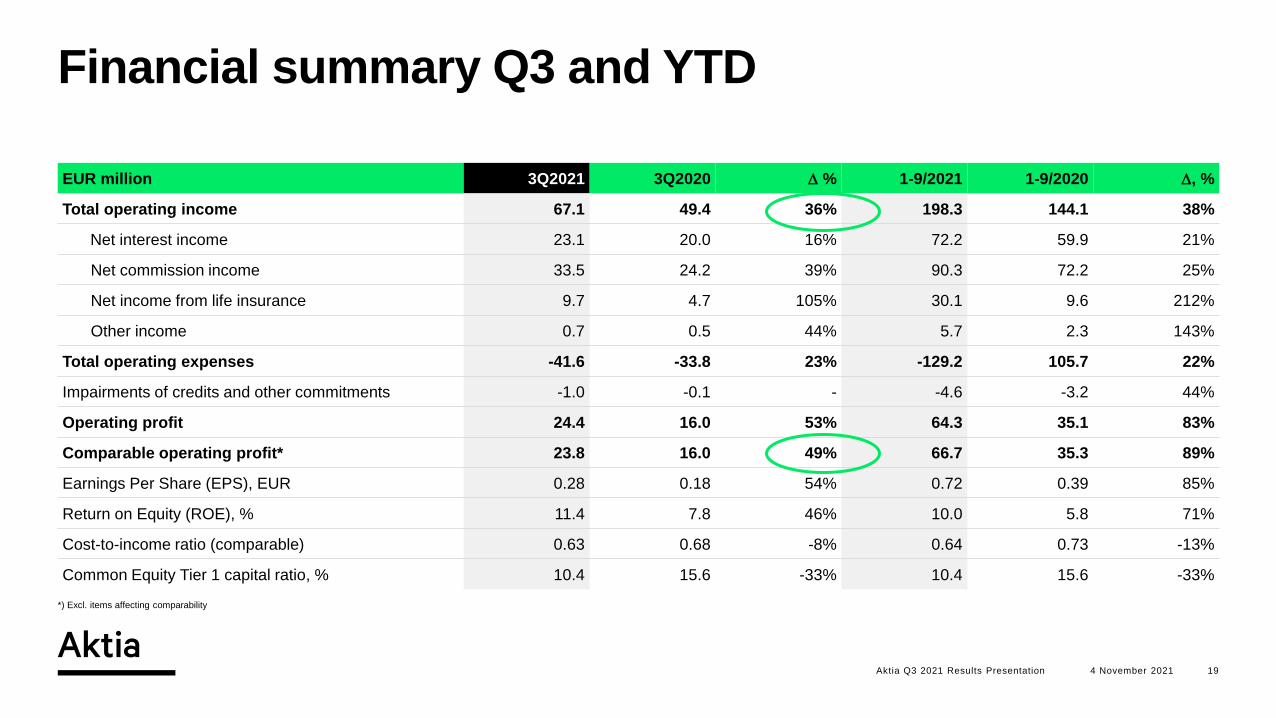
Financial summary Q3 and YTD
*) Excl. items affecting comparability
19
EUR million 3Q2021 3Q2020 % 1-9/2021 1-9/2020 , %
Total operating income 67.1 49.4 36% 198.3 144.1 38%
Net interest income 23.1 20.0 16% 72.2 59.9 21%
Net commission income 33.5 24.2 39% 90.3 72.2 25%
Net income from life insurance 9.7 4.7 105% 30.1 9.6 212%
Other income 0.7 0.5 44% 5.7 2.3 143%
Total operating expenses -41.6 -33.8 23% -129.2 105.7 22%
Impairments of credits and other commitments -1.0 -0.1 - -4.6 -3.2 44%
Operating profit 24.4 16.0 53% 64.3 35.1 83%
Comparable operating profit* 23.8 16.0 49% 66.7 35.3 89%
Earnings Per Share (EPS), EUR 0.28 0.18 54% 0.72 0.39 85%
Return on Equity (ROE), % 11.4 7.8 46% 10.0 5.8 71%
Cost-to-income ratio (comparable) 0.63 0.68 -8% 0.64 0.73 -13%
Common Equity Tier 1 capital ratio, % 10.4 15.6 -33% 10.4 15.6 -33%

71% (73%)
15% (14%)
13% (13%)
71% (70%)
20% (21%)
Lending
Total EUR 7,413 (7,000) million
Deposits
Total EUR 4,607 (4,466) million
Structure of lending and deposits 30 September 2021 (31 December 2020)
Public entities and non-profit organisations
Corporates
Housing associations
Households
EUR 3,265
(3,140) million
EUR 911
(946) million
8% (7%)
EUR 367
(314) million
EUR 5,285
(5,083) million
EUR 1,001
(979) million
EUR 972
(908) million
1% (0%)
EUR 55
(30) million
4 November 2021Aktia Q3 2021 Results Presentation 20
1% (2%)
EUR 65
(66) million
Public entities and non-profit organisations
Corporates
Housing associations
Households

5861,065
1,5411,637
1,4461,259
7,000
7,413
0
2,000
4,000
6,000
8,000
10,000
31 Dec 2020 30 Sep 2021
Lending to the publicand public-sectorentities
Liquidity portfolio
Life insurance assetsincl. Unit Link
Other assets
Balance sheet total increased to EUR 11,374 million30 September 2021
Total assets
EUR million
10,57311,374
667 755460 582
1,4111,519
2,8463,116
723
795
4,466
4,607
0
2,000
4,000
6,000
8,000
10,000
31 Dec 2020 30 Sep 2021
Deposits from thepublic
Liabilities to centralbanks and creditinstitutions
Debt securitiesissued
Technical provisions
Other liabilities
Equity
11,37410,573
Total liabilities and equity
EUR million
4 November 2021Aktia Q3 2021 Results Presentation 21

• At the end of the period, the Bank Group’s Common Equity
Tier 1 (CET1) capital ratio was 10.4%
• Target: CET1 ratio above 1.5 percentage points over the regulatory
requirements, i.e. above 9.2 %
• CET1 capital decreased by EUR 115.7 million during the
period
• The decrease was expected and mainly a result of increase of
intangible assets and goodwill accounted for the successful acquisition
of Taaleri’s wealth management operations
• The 2020 dividend, EUR 0.43 per share, has been deducted from the
CET1 capital
• Aktia has issued AT1 capital of EUR 60 million during the
second quarter
• Tier 1 ratio 12.4%
• Total capital ratio 14.8% (minimum requirement 11.8%)
CET1
% %
4.3
3.4 4.7
6.0
5.9
4.2
4.03.1
2.7
15.614.7
15.9 15.7 15.6
14.0 13.8
10.8 10.4
0
3
6
9
0
2
4
6
8
10
12
14
16
18
20
30 Sep2019
31 Dec2019
31 Mar2020
30 Jun2020
30 Sep2020
31 Dec2020
31 Mar2021
30 Jun2021
30 Sep2021
Buffer CET1 Capital ratio CET1 requirement
4 November 2021Aktia Q3 2021 Results Presentation
CET1 ratio 2.7 percentage points above the requirementCapital Adequacy
22
CE
T1
Cap
ita
l ra
tio
Bu
ffe
r

• During the Q3/2021 Aktia completed two private placement transaction. From the beginning of the year
2021 has Aktia Bank issued 14 pieces of senior preferred debt under the EMTN program. The total volume
has been approximately EUR 215 million with maturities in the range of 3–10 years. The bank will continue
to issue senior debt during the Q4 to refinance redeeming notes over the year end and beginning of the
following year 2022.
• Aktia Bank is working on preparing the inaugural issue out of Aktia Life company. The plan is to issue
Solvency eligible Tier 2 issue in Q4/2021 and further strengthen the capital structure of Aktia Life
Insurance.
• Aktia’s liquidity situation is very good. The LCR ratio has been comfortably over the regulative limit being
125% at the end of Q3. The cash level has been very good. The ECB tiering structure has been in full use
for the whole period.
4 November 2021Aktia Q3 2021 Results Presentation
Funding activities
23

4 November 2021Aktia Q3 2021 Results Presentation
Aktia Q3 2021 Results presentation
Appendices
24

4 November 2021Aktia Q3 2021 Results Presentation
EUR million
17.1 17.9 16.9 17.3 16.9 17.4 17.7 18.2 17.9 18.2 18.7 18.5 18.8 19.4 19.5 20.6 20.6 21.9 21.5
4.6 3.83.4 3.1 2.4 2.2 2.0 1.7 1.6 1.6 1.5 1.4 1.4
1.7 1.61.5 1.4
1.4 1.23.9 3.6
3.5 3.43.3 3.3 2.8 2.0
1.3 1.2 0.8 0.7 0.50.6 0.6
0.6 0.50.5 0.4
-2.2 -2.4 -2.3 -1.9 -1.9
0.7
-1.5 -1.2 -1.4 -1.7 -1.5 -1.3 -1.1 -1.5 -1.7 -1.8 -1.2
3.923.4 22.9
21.5 21.820.7
23.521.0 20.7
19.4 19.2 19.6 19.3 19.7 20.1 20.020.8 21.3
27.7
23.1
-5
0
5
10
15
20
25
30
Q1/17 Q2/17 Q3/17 Q4/17 Q1/18 Q2/18 Q3/18 Q4/18 Q1/19 Q2/19 Q3/19 Q4/19 Q1/20 Q2/20 Q3/20 Q4/20 Q1/21 Q2/21 Q3/21
Borrowing and lending Liquidity portfolio Hedging with interest rate derivatives Other
Net interest income mix
25
14.7 15.8 15.8
21.624.2
5.55.4 5.4
5.5
5.4
2.32.4 2.2
2.7
2.4
0.40.3 0.3
0.5
0.6
1.31.5 1.3
1.4
1.0
0
5
10
15
20
25
30
35
Q3/2020 Q4/2020 Q1/2021 Q2/2021 Q3/2021
EUR million
4 November 2021Aktia Q3 2021 Results Presentation
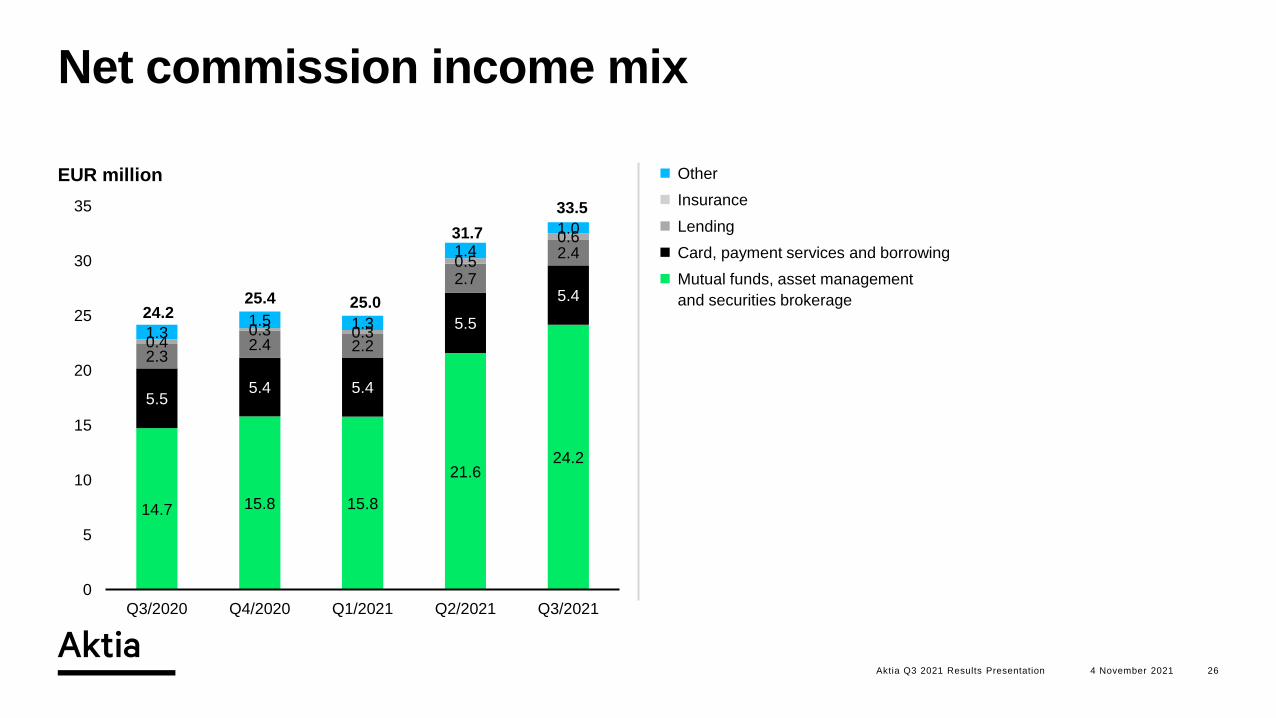
Net commission income mix
26
25.025.0
33.5
24.225.4
◼ Other
◼ Insurance
◼ Lending
◼ Card, payment services and borrowing
◼ Mutual funds, asset management
and securities brokerage
31.7

Building wealth for our customers and society
Investor Relations contacts:
Lotta Borgström
Director, Investor Relations and Communications
+358 10 247 6838