Q3 - ir.adler-group.com
35
Q3 QUARTERLY FINANCIAL STATEMENTS 2021
Transcript of Q3 - ir.adler-group.com

Q3Q
UA
RTE
RLY
FIN
AN
CIA
L S
TATE
MEN
TS 2
02
1

Key FiguresQ3
Profit and loss statement
For the nine months ended For the three months endedFor the
year ended
In EUR thousand30 Sep
202130 Sep
202030 Sep
202130 Sep
202031 Dec
2020
Income from rental activities 344,350 266,114 113,843 118,217 383,906
EBITDA from rental activities 169,180 133,771 56,636 56,450 187,014
EBITDA from rental activities margin 65.2% 65.8% 66.4% 63.8% 63.7%
EBITDA Total 238,389 157,710 71,199 72,030 247,349
FFO 1 (from rental activities) 101,900 74,738 35,098 31,804 107,128
FFO 2 (incl. disposal results and development activities) 148,963 73,670 59,657 25,500 126,654
Further KPIs
Residential(*) 30 Sep 2021 31 Dec 2020
Monthly in-place rent (EUR per m2) EUR 6.61 EUR 6.30
Total vacancy rate 3.3% 3.4%
Number of units 69,435 69,722
Like-for-like rental growth 3.9% 2.2%
Balance sheet
In EUR thousand except per share data 30 Sep 2021 31 Dec 2020
Fair value of properties 13,018,158 11,430,611
LTV 57.0% 53.4%
EPRA NRV 6,599,040 6,037,159
EPRA NRV per share (EUR) 56.16 51.38
EPRA NTA 5,005,812 4,442,583
EPRA NTA per share (EUR) 42.60 37.81
(*) Including ground floor commercial units and excluding units under renovation and development projects.
Adler Group Q3 2021 Quarterly Financial Statements 32 Adler Group Q3 2021 Quarterly Financial Statements

We want to ensure people have the living space they need – today and tomorrow. We provide affordable contemporary housing and create new visionary real estate projects that are fit for the future.
adler-group.com
4 5Adler Group Q3 2021 Quarterly Financial Statements Adler Group Q3 2021 Quarterly Financial Statements
1 To our Shareholders
08 About the Company
10 Key Facts & Figures
12 Shareholder Letter Q3
14 2021 Milestones
24 Adler Group Share
2 Interim Management Report
28 Fundamentals of the Group
32 Portfolio Overview
38 Financial Overview
48 Material Events in the Reporting Period and Subsequent Events
53 Forecast Report
54 Responsibility Statement
3 Condensed Consolidated Interim Financial Statements
58 Condensed Consolidated Interim Statement of Financial Position
60 Condensed Consolidated Interim Statement of Profit or Loss
61 Condensed Consolidated Interim Statement of Comprehensive Income
62 Condensed Consolidated Interim Statement of Cash Flows
64 Condensed Consolidated Interim Statement of Changes in Equity
4 Financial Calendar & Imprint
Content
76 Adler Group Q3 2021 Quarterly Financial Statements Adler Group Q3 2021 Quarterly Financial Statements

Welcome to Adler GroupAdler Group is a leading housing company in the Ger-
man residential real estate market. With a portfolio
comprising about 70,000 residential units spread out
across Germany and a development pipeline of approx-
imately 12,000 flats in the country’s top 7 cities, we are
actively shaping the future of the German real estate
market.
ADLER can look back on a long and distinguished histo-
ry. As a manufacturer of bicycles, cars and typewriters
the Company has been a household name since 1880
and has become a synonym for reliability and pioneering
spirit. Adler Group aspires to nurture this spirit and as a
housing company create living spaces where people feel
comfortable and will wish to live for years to come.
We excel through our role as a pioneer in the field of
technology and our pursuit of perfection. We are a mod-
ern company which goes about doing what it does best
with true passion: the creation of holistic, visionary and
sustainable living spaces.
As a brand that can fall back on a long tradition in Ger-
many, we see ourselves as being an integral part of the
society we live in. And we are here to stay.
RESIDENTIAL RENTAL PORTFOLIO
69,435units
DEVELOPMENT PIPELINE
c. 12,000units
1 TO OUR SHAREHOLDERS About the Company
1 TO OUR SHAREHOLDERS About the Company
8 9Adler Group Q3 2021 Quarterly Financial Statements Adler Group Q3 2021 Quarterly Financial Statements
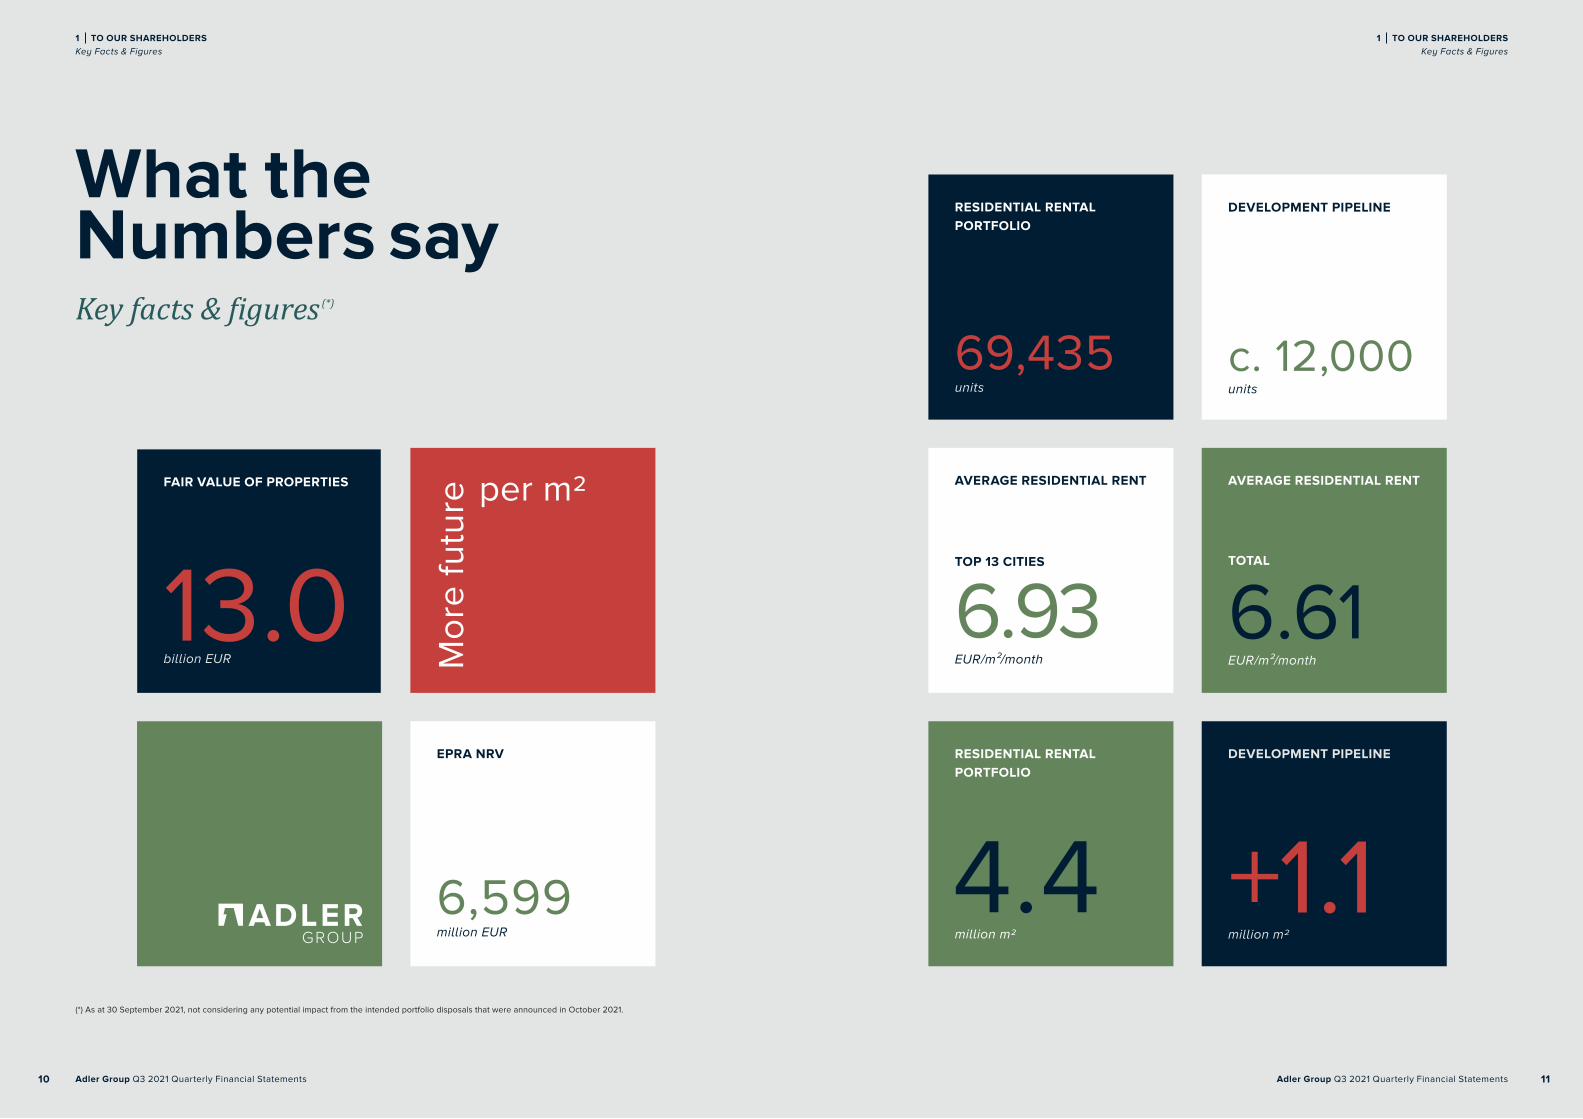
What theNumbers sayKey facts & figures (*)
EPRA NRV
6,599million EUR
AVERAGE RESIDENTIAL RENT
TOP 13 CITIES
6.93EUR/m²/month
AVERAGE RESIDENTIAL RENT
TOTAL
6.61EUR/m²/month
FAIR VALUE OF PROPERTIES
13.0billion EUR
RESIDENTIAL RENTAL PORTFOLIO
4.4million m2
DEVELOPMENT PIPELINE
+1.1million m2
RESIDENTIAL RENTAL PORTFOLIO
69,435units
DEVELOPMENT PIPELINE
c. 12,000units
(*) As at 30 September 2021, not considering any potential impact from the intended portfolio disposals that were announced in October 2021.
1 TO OUR SHAREHOLDERS Key Facts & Figures
1 TO OUR SHAREHOLDERS Key Facts & Figures
Adler Group Q3 2021 Quarterly Financial Statements Adler Group Q3 2021 Quarterly Financial Statements10 11
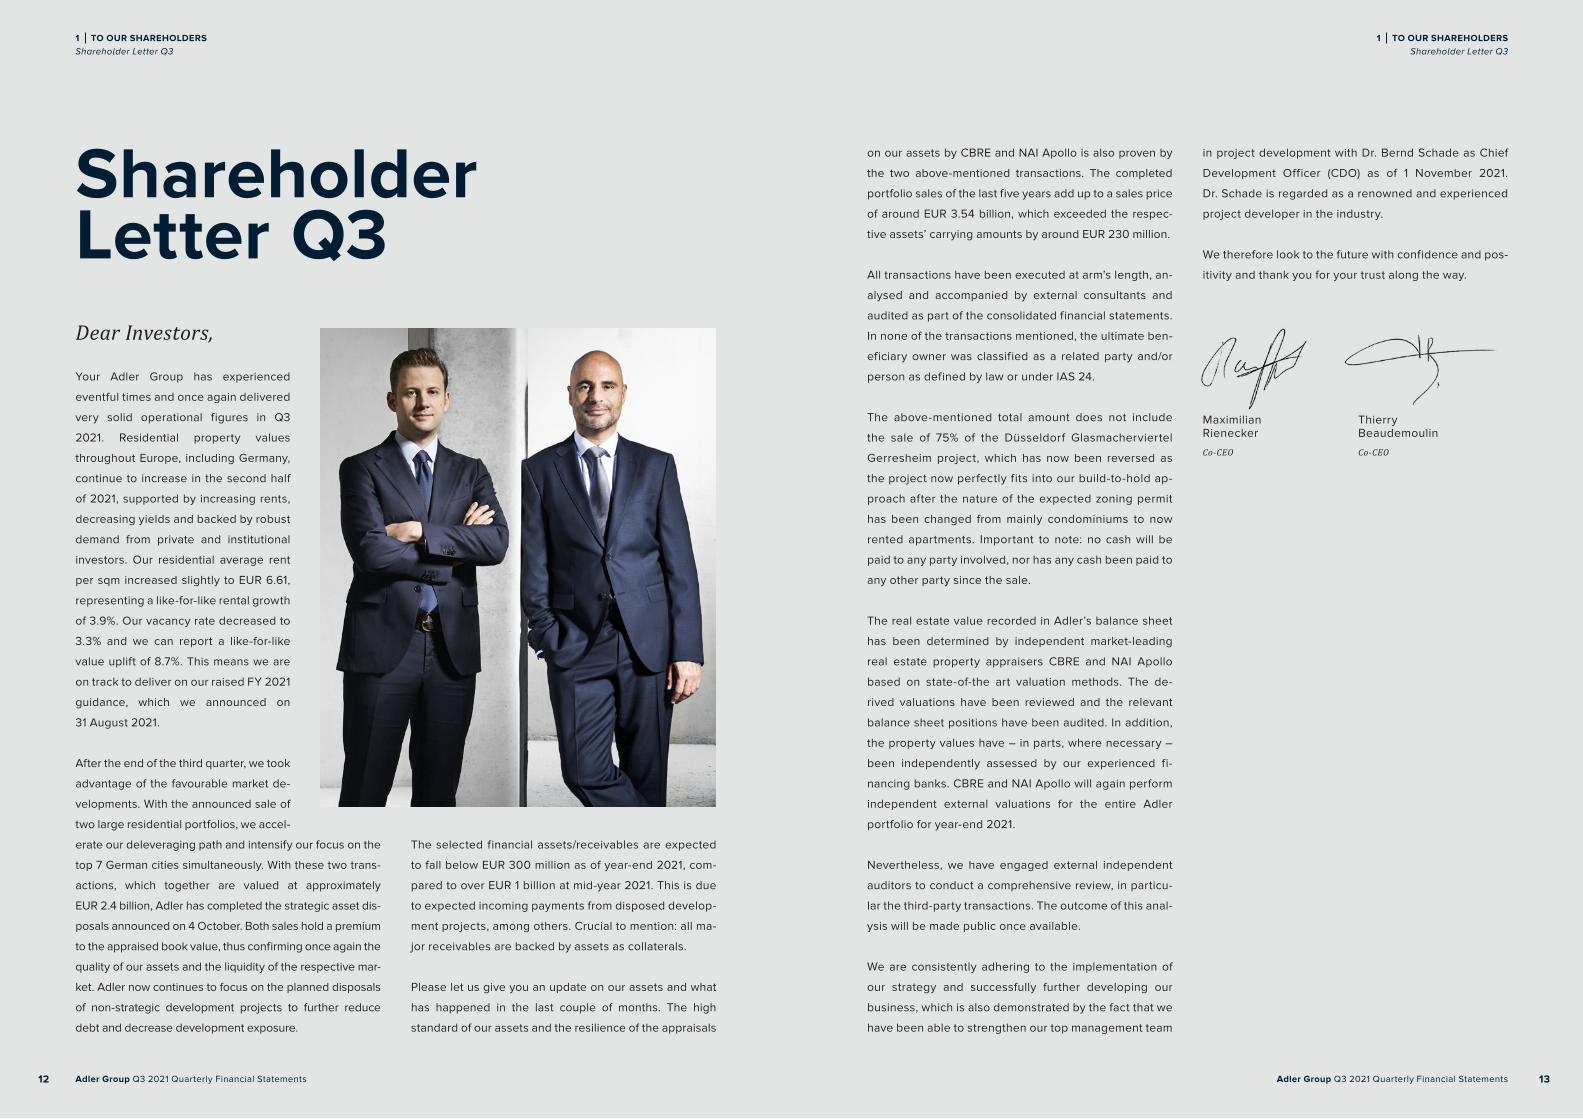
Maximilian Rienecker
Co-CEO
Thierry Beaudemoulin
Co-CEO
Dear Investors,
Your Adler Group has experienced
eventful times and once again delivered
very solid operational figures in Q3
2021. Residential property values
throughout Europe, including Germany,
continue to increase in the second half
of 2021, supported by increasing rents,
decreasing yields and backed by robust
demand from private and institutional
investors. Our residential average rent
per sqm increased slightly to EUR 6.61,
representing a like-for-like rental growth
of 3.9%. Our vacancy rate decreased to
3.3% and we can report a like-for-like
value uplift of 8.7%. This means we are
on track to deliver on our raised FY 2021
guidance, which we announced on
31 August 2021.
After the end of the third quarter, we took
advantage of the favourable market de-
velopments. With the announced sale of
two large residential portfolios, we accel-
erate our deleveraging path and intensify our focus on the
top 7 German cities simultaneously. With these two trans-
actions, which together are valued at approximately
EUR 2.4 billion, Adler has completed the strategic asset dis-
posals announced on 4 October. Both sales hold a premium
to the appraised book value, thus confirming once again the
quality of our assets and the liquidity of the respective mar-
ket. Adler now continues to focus on the planned disposals
of non-strategic development projects to further reduce
debt and decrease development exposure.
Shareholder Letter Q3
The selected financial assets/receivables are expected
to fall below EUR 300 million as of year-end 2021, com-
pared to over EUR 1 billion at mid-year 2021. This is due
to expected incoming payments from disposed develop-
ment projects, among others. Crucial to mention: all ma-
jor receivables are backed by assets as collaterals.
Please let us give you an update on our assets and what
has happened in the last couple of months. The high
standard of our assets and the resilience of the appraisals
on our assets by CBRE and NAI Apollo is also proven by
the two above-mentioned transactions. The completed
portfolio sales of the last five years add up to a sales price
of around EUR 3.54 billion, which exceeded the respec-
tive assets’ carrying amounts by around EUR 230 million.
All transactions have been executed at arm’s length, an-
alysed and accompanied by external consultants and
audited as part of the consolidated financial statements.
In none of the transactions mentioned, the ultimate ben-
eficiary owner was classified as a related party and/or
person as defined by law or under IAS 24.
The above-mentioned total amount does not include
the sale of 75% of the Düsseldorf Glasmacherviertel
Gerresheim project, which has now been reversed as
the project now perfectly fits into our build-to-hold ap-
proach after the nature of the expected zoning permit
has been changed from mainly condominiums to now
rented apartments. Important to note: no cash will be
paid to any party involved, nor has any cash been paid to
any other party since the sale.
The real estate value recorded in Adler’s balance sheet
has been determined by independent market-leading
real estate property appraisers CBRE and NAI Apollo
based on state-of-the art valuation methods. The de-
rived valuations have been reviewed and the relevant
balance sheet positions have been audited. In addition,
the property values have – in parts, where necessary –
been independently assessed by our experienced fi-
nancing banks. CBRE and NAI Apollo will again perform
independent external valuations for the entire Adler
portfolio for year-end 2021.
Nevertheless, we have engaged external independent
auditors to conduct a comprehensive review, in particu-
lar the third-party transactions. The outcome of this anal-
ysis will be made public once available.
We are consistently adhering to the implementation of
our strategy and successfully further developing our
business, which is also demonstrated by the fact that we
have been able to strengthen our top management team
in project development with Dr. Bernd Schade as Chief
Development Officer (CDO) as of 1 November 2021.
Dr. Schade is regarded as a renowned and experienced
project developer in the industry.
We therefore look to the future with confidence and pos-
itivity and thank you for your trust along the way.
1 TO OUR SHAREHOLDERS Shareholder Letter Q3
1 TO OUR SHAREHOLDERS Shareholder Letter Q3
Adler Group Q3 2021 Quarterly Financial Statements Adler Group Q3 2021 Quarterly Financial Statements12 13

2021 MilestonesAn overview
1 TO OUR SHAREHOLDERS 2021 Milestones
1 TO OUR SHAREHOLDERS 2021 Milestones
1514 Adler Group Q3 2021 Quarterly Financial Statements Adler Group Q3 2021 Quarterly Financial Statements

JAN
UA
RY
FE
BR
UA
RY
MA
RC
H
AP
RIL
MARKET ACTIVITIES
Berlin rent freeze over-turned by Germany’s Constitutional Court
On 15 April 2021, the Federal Consti-
tutional Court declared the Berlin rent
freeze unconstitutional and obsolete.
As 19,853 out of 69,712 of our flats
are located in Berlin, which repre-
sents 54% of total gross asset value
and 37% of net rental income, the
court ruling has material impact on
the business. Adler Group welcomes
the unambiguous ruling as it restores
legal certainty and confidence in the
Berlin housing market, which is in the
interest of tenants, housing providers
and investors alike.
CAPITAL MEASURES
Successful placement of a EUR 1.5bn 5- and 8-year dual tranche bond
On 8 January 2021, the Group successfully placed
a EUR 1.5 billion dual tranche bond comprising a
EUR 700 million 5-year maturity with a 1.875%
fixed coupon and a EUR 800 million 8-year matu-
rity with a 2.25% fixed coupon. The Notes were
placed with institutional investors across Europe
with a total order book of EUR 4.0 billion. Together
with existing liquidity, all upcoming debt maturi-
ties in 2021 are covered.
CORPORATE ACTIVITIES
Corporate structure further simplified
On 20 April 2021, WESTGRUND, a subsidi-
ary of Adler Group, announced a squeeze-
out of the remaining minority shareholders
in order to further simplify the corporate
structure. The shareholders will receive a
cash compensation of EUR 13.24 per
WESTGRUND share. The resolution of the
transfer was passed at the extraordinary
general meeting of WESTGRUND, which
was held on 9 June 2021.
2021 MilestonesSignificant achievements since January
JANUARY
EUR
1.5 bn
dual tranche bond
APRIL
EUR
13.24
cash compensation
1 TO OUR SHAREHOLDERS 2021 Milestones
1 TO OUR SHAREHOLDERS 2021 Milestones
Adler Group Q3 2021 Quarterly Financial Statements Adler Group Q3 2021 Quarterly Financial Statements16 17

MA
Y
JUN
E
CORPORATE ACTIVITIES
Great progress on build-to-hold projects
In June, Adler Group and the City of
Hamburg agreed the urban development
plan for the Holsten Quartier in Hamburg-
Altona. The Group will build approximately
1,200 apartments. Currently, the project is
valued with a GAV of EUR 364 million. Com-
pletion is expected by the end of 2026.
CORPORATE ACTIVITIES
First ESG report - measurable goals set for future climate protection
On 4 May 2021, Adler Group published its
first ESG report in which a detailed ESG
strategy is outlined for the entire Group.
Three sustainability priorities were de-
fined: sustainability in construction, sus-
tainable relationships with tenants and
employees, and sustainable management
through digitalisation. The Company’s goal
is to reduce CO2 emissions within the
whole portfolio by 50% until 2030.
CAPITAL MEASURES
Successful refinancing through a placement of a EUR 500m 6-year bond
On 21 April 2021, the Group successfully
placed a EUR 500 million single tranche
bond with a 6-year maturity and a 2.25%
fixed coupon under its newly established
EMTN programme. The Notes were placed
with institutional investors across Europe
with a total order book of EUR 1.1 billion.
The proceeds will be used to call and re-
pay the EUR 450 million 9.625% high yield
bond issued by Consus Real Estate AG
which enabled the Group to realise
EUR 33 million annualised financial
synergies.
CORPORATE ACTIVITIES
AGM and dividend payment
On 29 June 2021, the Group held
its annual General Meeting and
declared a dividend payment
of EUR 0.46 per share. The
aggregate dividend amount of
EUR 54,054,707 was paid out to
our shareholders on 1 July 2021.
MAY
reduce CO2 emissions by
50%
until 2030
JUNE
EUR
54.0m
aggregate dividend payout
JUNE
Completion of
1,200new flats by end of 2026
APRIL
EUR
500 m
single tranche bond
1 TO OUR SHAREHOLDERS 2021 Milestones
1 TO OUR SHAREHOLDERS 2021 Milestones
Adler Group Q3 2021 Quarterly Financial Statements Adler Group Q3 2021 Quarterly Financial Statements18 19

JULY
AU
GU
ST
CORPORATE ACTIVITIES
German Association of Sustainable Building membership
On 6 July 2021, Adler Group became a
member of the German Association of
Sustainable Building (DGNB). It has
committed to ensuring that all new
buildings will comply with the DGNB
Gold standard or the comparable LEED
standard, building carbon-neutral
buildings for a better future.
CORPORATE ACTIVITIES
Global Compact Network membership
On 15 July 2021, Adler Group became
an active member of the United
Nations Global Compact. By taking this
approach, the Company is particularly
able to positively impact on eight se-
lected principles.
PORTFOLIO DISPOSALS
Disposal of non-core office development project
at book value
On 20 July 2021, Adler Group sold
an office development project for
EUR 185 million at book value to a project
developer. The building was part of the
upfront sales of the build-to-sell develop-
ment pipeline, in a prime location in the fi-
nancial metropolis Frankfurt. This disposal
is an important milestone in the process of
streamlining and simplifying the portfolio
and strengthening the balance sheet in
line with the Group’s strategy.
CORPORATE ACTIVITIES
Sustainalytics rating
On 16 August 2021, Sustainalytics as-
signed a new rating to Adler Group of
10.7, ranking the Company as the
46th best real estate company in
Sustainalytics’ global coverage of
1,001 real estate companies. This is a
very strong rating and positions the
Company in the top 5% of the real es-
tate coverage in terms of ESG.
JULY
EUR
185m
disposal of non-core development project
AUGUST
New ESG rating
Top 5% of global real estate companies
1 TO OUR SHAREHOLDERS 2021 Milestones
1 TO OUR SHAREHOLDERS 2021 Milestones
Adler Group Q3 2021 Quarterly Financial Statements Adler Group Q3 2021 Quarterly Financial Statements20 21

SE
PT
EM
BE
R
OC
TO
BE
R
NO
VE
MB
ER
CORPORATE ACTIVITIES
Review of strategic options regarding residential yielding portfolio
On 4 October 2021, Adler Group decided
to initiate a review of strategic options af-
ter being approached multiple times by in-
stitutional parties interested to acquire
parts of the Company’s residential yielding
portfolio. This process could result in the
sale of a significant part of Adler Group’s
yielding assets above book value, thereby
achieving material value creation for the
Company’s stakeholders. Proceeds from
such disposals are intended to significant-
ly reduce leverage and also to return capi-
tal to bond and equity holders.
PORTFOLIO DISPOSALS
Adler Group concludes term sheet with LEG
On 11 October 2021, Adler Group signed a
term sheet with LEG Immobilien SE regard-
ing the sale of approximately 15,500 units.
The transaction is based on a real estate
portfolio value in an amount of approxi-
mately EUR 1.4 billion which is above the
respective book values as of 30 June
2021. Proceeds from this disposal are in-
tended to accelerate deleveraging to-
wards the LTV target of below 50%. The
assets to be disposed of are located
amongst others in Wilhelmshaven,
Göttingen and Wolfsburg, leading to a re-
maining portfolio being more focussed on
Germany’s top 7 cities. The closing of the
transaction is expected to take place by
the end of 2021.
PORTFOLIO DISPOSALS
Additional portfolio disposal to accelerate
deleveraging
On 26 October 2021, Adler Group signed a
term sheet with a leading alternative invest-
ment firm in order to sell approximately
14,300 units for the agreed transaction valua-
tion of approximately EUR 1 billion. This is a
premium compared to the respective book
values as of 30 June 2021 and would lead to
an LTV of below 50%. The units are mainly lo-
cated in the Eastern part of Germany which
will further increase the quality of the remain-
ing portfolio. This intended transaction with
expected closing in Q1 2022 concludes the in-
itiated strategic review process.
CORPORATE ACTIVITIES
Dr. Bernd Schade becomes new CDO of the Adler Group
On 1 November 2021, Dr. Bernd
Schade joined Adler Group as new
Chief Development Officer. Bernd
Schade has decades of experience in
project management of real estate
projects throughout Germany. Prior
to joining Adler Group, Dr. Schade
was member of the Management
Board of Bauwert AG.
OCTOBER
EUR
1.4bn
disposal of yielding assets
OCTOBER
EUR
1.0bn
disposal of yielding assets
1 TO OUR SHAREHOLDERS 2021 Milestones
1 TO OUR SHAREHOLDERS 2021 Milestones
Adler Group Q3 2021 Quarterly Financial Statements Adler Group Q3 2021 Quarterly Financial Statements22 23

Adler Group Share
The share
Share information (as at 30 September 2021)
1st day of trading 23 July 2015
Subscription price EUR 20.00
Price at the end of Q3 2021 EUR 14.70
Highest share price LTM EUR 29.00
Lowest share price LTM EUR 14.70
Total number of shares 117.5 million
ISIN LU1250154413
WKN A14U78
Symbol ADJ
Class Dematerialised shares
Free float 68.39%
Stock exchange Frankfurt Stock Exchange
Market segment Prime Standard
Market index SDAX
ERPA indices FTSE EPRA / NAREIT
Global Index, FTSE EPRA /
NAREIT Developed Europe
Index, FTSE EPRA /
NAREIT Germany Index
Key stock market data
Adler Group shares are traded on the Prime Standard of
the Frankfurt Stock Exchange. During the 12 months end-
ed 30 September 2021, the shares traded between
EUR 14.70 and EUR 29.00. Adler Group shares are includ-
ed in the SDAX index of Deutsche Börse and the relevant
real estate sector indices of the EPRA index family.
Shareholder structure
As at 30 September 2021, the total number of outstanding
shares of Adler Group amounted to 117.5 million. On that
date, the main shareholders with holdings of over 5%
were(*): Aggregate Holdings S.A. (26.59%) and Fairwater
Multi- Strategy Investment ICAV (5.02%). The remaining
68.39% free float shares are mainly held by institutional
investors.
As notified on 15 October 2021, Fairwater Multi- Strategy
Investment ICAV reduced its stake to 0.04% with effect
from 13 October 2021. Therefore, the free float shares in-
creased to approximately 73.4%.
Dividend policy
As a dividend policy, the Company intends to pay divi-
dends in an amount of approximately 50% of FFO 1. In
accordance with this dividend policy, the amount shall
be distributed as annual dividends to the shareholders.
The distribution of dividends is subject to a respective
resolution of the annual General Meeting (AGM).
For the 2020 financial year, the Company paid out a div-
idend amounting to 50% of FFO 1 realised in full year
2020. This equalled EUR 54 million or EUR 0.46 per
share and was confirmed by the shareholders at the
AGM in June 2021.
(*) According to official notifications received from the shareholders.
Shareholder structure
(as at 30 September 2021)
Free Float Shares
68.39%
Aggre gate Holdings S.A.
26.59%
Fairwater Multi-Strategy Investment ICAV
5.02%
1 TO OUR SHAREHOLDERS Adler Group Share
1 TO OUR SHAREHOLDERS Adler Group Share
2524 Adler Group Q3 2021 Quarterly Financial Statements Adler Group Q3 2021 Quarterly Financial Statements
Adler Group Q3 2021 Quarterly Financial Statements Adler Group Q3 2021 Quarterly Financial Statements26 27
2 Interim Management Report
28 Fundamentals of the Group
32 Portfolio Overview
38 Financial Overview
48 Material Events in the Reporting Period and Subsequent Events
53 Forecast Report
54 Responsibility Statement
Interim Management Report
Adler Group Q3 2021 Quarterly Financial Statements Adler Group Q3 2021 Quarterly Financial Statements26 27

Adler Group Q3 2021 Quarterly Financial Statements Adler Group Q3 2021 Quarterly Financial Statements28 29
RESIDENTIAL RENTAL PORTFOLIO
69,435units
OPERATIONAL EMPLOYEES
1,337 people
Fundamentals of the GroupBusiness model
Adler Group S.A. is a well-diversified residential real es-
tate company with properties in Germany valued at
EUR 13.0 billion. We hold and manage approximately
70,000 apartments across Germany, with an additional
12,000 units under development in Germany’s top 7 cities.
Our business model focuses on asset and portfolio man-
agement, property and facility management and identify-
ing residential properties throughout Germany that pre-
sent opportunities to create value by increasing rents and
decreasing vacancy. With our strategic land bank in the
top 7 German cities and our highly experienced develop-
ment platform, we expect the build-to-hold development
projects to be completed over the next 6-8 years. We will
deliver approximately 12,000 new residential units in a
strategic effort to address the ongoing housing shortage
in Germany. Our 1,337 operational employees are based
modernise, refurbish and/or re-position our properties al-
lowing for higher rent levels. Lastly, we reduce the portfo-
lio vacancy through active marketing with an approach
tailored to the respective micro-location.
We seek to optimise our portfolio and recycle capital
through selective investments and disposals.
By disposing of non-core assets, we aim at streamlining
our rental portfolio by increasing our focus on large cities
where we can manage a critical mass of assets and simul-
taneously improve our profitability and portfolio KPIs. By
selling selected assets above book value, we aim to con-
tinuously demonstrate the resilience of the German resi-
dential real estate market. Active capital recycling ena-
bles us to fund the construction of our development
pipeline, which will further improve the quality of our port-
folio. Furthermore, we also expect to benefit from Consus’
ongoing forward sales and condominium sales of its de-
velopment projects to yield NAV accretive growth over
the next three to four years.
We are committed to adding value through develop-
ment and modernisation thereby driving organic growth.
In 2020, we combined our business with ADLER Real
Estate AG (“ADLER”) and Consus Real Estate AG
(“Consus”) in order to create one of the largest listed res-
idential real estate companies in Germany. Through the
integration of the assets held by ADLER, we have grown
and diversified our business and by integrating Consus,
we have secured a clear and profitable organic growth
path, which rests upon our high-quality build-to-hold de-
velopment pipeline with a gross asset value (GAV) of
EUR 2.0 billion. We aim to develop approximately
1.1 million m² of additional rental area across c. 12,000 ad-
ditional rental units in Germany’s top 7 cities over the next
6-8 years. In addition to that, selected CAPEX and mod-
ernisation measures in our core portfolio will elevate the
quality of our rental portfolio and simultaneously improve
the energy efficiency.
in our office in Berlin as well as in several locations across
Germany bringing us closer to our assets and tenants.
Objectives and strategy
We focus on actively managing our core portfolio to
grow earnings and improve EBITDA margins.
By focussing on increasing rents through active asset
management and targeted modernisation investments,
we refurbish and re-position our properties, while con-
stantly screening and anticipating developments in differ-
ent sub-markets. Our strategy to realise upside potential
consists of the following approaches: We pursue regular
rent increases up to the market levels (i) within the regula-
tory and legal limits as well as (ii) through tenant fluctua-
tion without CAPEX investment. In addition, we continu-
ously review rent potentials and pursue growth beyond
the rent tables through targeted CAPEX investments to
We plan to further simplify our capital structure.
Our financial policy includes a target of LTV below 50% in
the medium-term, without equity raising requirements.
This is to be achieved via the following measures: (1) the
two disposals of portfolios announced in October 2021,
(2) the sale of identified non-core assets in line with the
strategic focus of the Group, (3) projects being forward
sold to institutional purchasers prior to the start of con-
struction, thereby minimising development risks and
pre-funding the developments, and further development
profits from condo sales, (4) German residential proper-
ties continue to be considered a safe haven, and we ex-
pect positive valuation effects at least in line with like-for-
like rental growth and (5) operational performance of the
newly formed combined Group. Ultimately, it is our focus
to obtain an investment grade credit rating.
We will leverage operational and financial synergies to
be realised from streamlining our operations and finan-
cial discipline.
By integrating ADLER and Consus into Adler Group, it al-
lows us to capitalise on significant run-rate synergies with
reduced debt and simplified capital structure.
We target continuous dividends with a payout ratio of
up to 50% of our annual FFO 1 (from rental activities).
Our portfolio and operational excellence combined with
our sustainable financing strategy allows us to distribute
stable dividends on an annual basis with a targeted pay-
out ratio of up to 50% of FFO 1 (from rental activities).
2 INTERIM MANAGEMENT REPORT Fundamentals of the Group
2 INTERIM MANAGEMENT REPORT Fundamentals of the Group

Adler Group Q3 2021 Quarterly Financial Statements Adler Group Q3 2021 Quarterly Financial Statements30 31
Corporate Governance
The Company’s corporate governance practices are gov-
erned by Luxembourg Law (particularly the Luxembourg
law of 10 August 1915 on commercial companies, as
amended) and the Company’s articles of association. As a
Luxembourg company with its shares admitted to trading
on the regulated market (Prime Standard) of the Frankfurt
Stock Exchange, the Company is not subject to any spe-
cific mandatory corporate governance rules. The corpo-
rate governance practices applied by the Company are
those applied under general Luxembourg law.
Composition of the Board
As at 30 September 2021, the Board comprised as
follows:
Dr. Peter Maser, Chairman
Independent Director
Mr Maximilian Rienecker
Director
Mr Thierry Beaudemoulin
Director
Ms Arzu Akkemik
Independent Director
Dr. Michael Bütter
Independent Director
Mr Claus Jørgensen
Independent Director
Mr Thilo Schmid
Independent Director
Mr Thomas Zinnöcker
Independent Director
Note: the composition of the Board remains unchanged as at the time of publication of this report.
2 INTERIM MANAGEMENT REPORT Fundamentals of the Group
2 INTERIM MANAGEMENT REPORT Fundamentals of the Group
Adler Group Q3 2021 Quarterly Financial Statements 31
Adler Group Q3 2021 Quarterly Financial Statements Adler Group Q3 2021 Quarterly Financial Statements32 3332 33
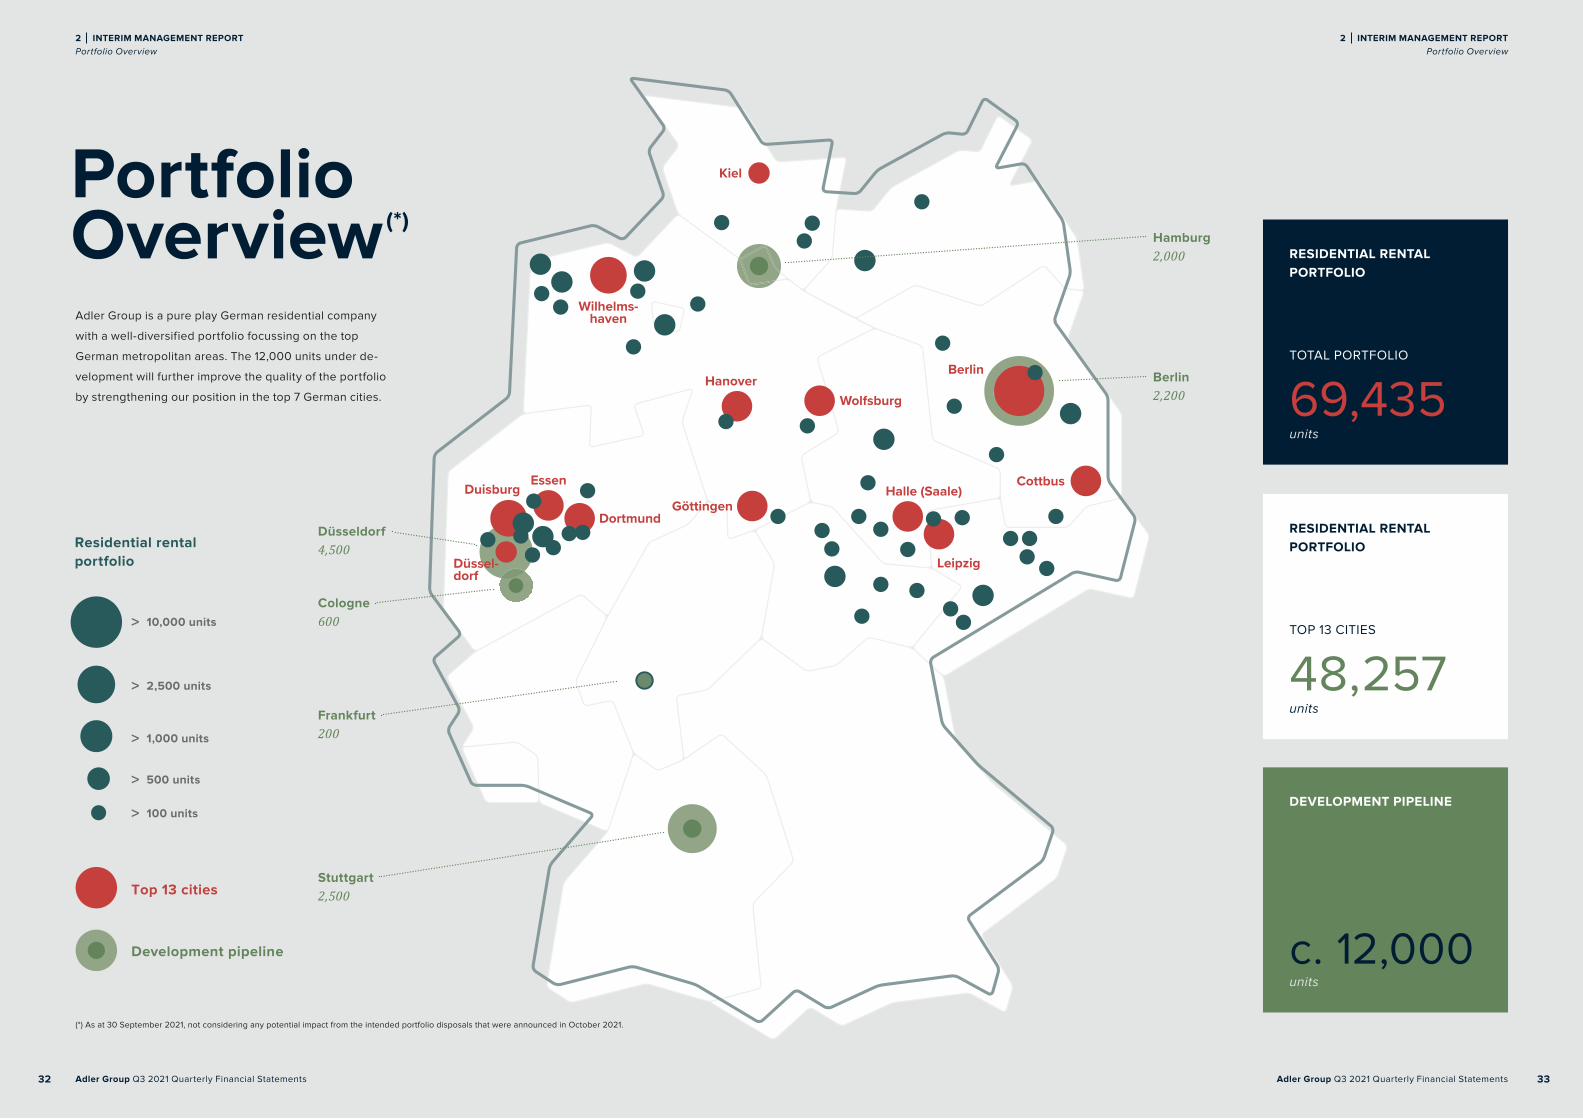
Berlin
Cottbus
Leipzig
Halle (Saale)Göttingen
Wolfsburg
Kiel
Hanover
Duisburg
Düssel-dorf
Dortmund
Essen
Wilhelms-haven
Residential rental
portfolio
> 10,000 units
> 2,500 units
> 1,000 units
> 500 units
> 100 units
Development pipeline
Top 13 cities
Düsseldorf4,500
Cologne600
Frankfurt200
Stuttgart2,500
Hamburg2,000
Berlin2,200
Adler Group Q3 2021 Quarterly Financial Statements Adler Group Q3 2021 Quarterly Financial Statements
DEVELOPMENT PIPELINE
c. 12,000 units
RESIDENTIAL RENTALPORTFOLIO
TOP 13 CITIES
48,257units
RESIDENTIAL RENTALPORTFOLIO
TOTAL PORTFOLIO
69,435units
Portfolio Overview(*)
Adler Group is a pure play German residential company
with a well-diversified portfolio focussing on the top
German metropolitan areas. The 12,000 units under de-
velopment will further improve the quality of the portfolio
by strengthening our position in the top 7 German cities.
(*) As at 30 September 2021, not considering any potential impact from the intended portfolio disposals that were announced in October 2021.
2 INTERIM MANAGEMENT REPORT Portfolio Overview
2 INTERIM MANAGEMENT REPORT Portfolio Overview
Adler Group Q3 2021 Quarterly Financial Statements Adler Group Q3 2021 Quarterly Financial Statements34 35
LIKE-FOR-LIKERENTAL GROWTH
3.9%
AVERAGE RESIDENTIAL IN-PLACE RENT
EUR/M2/MONTH
6.61
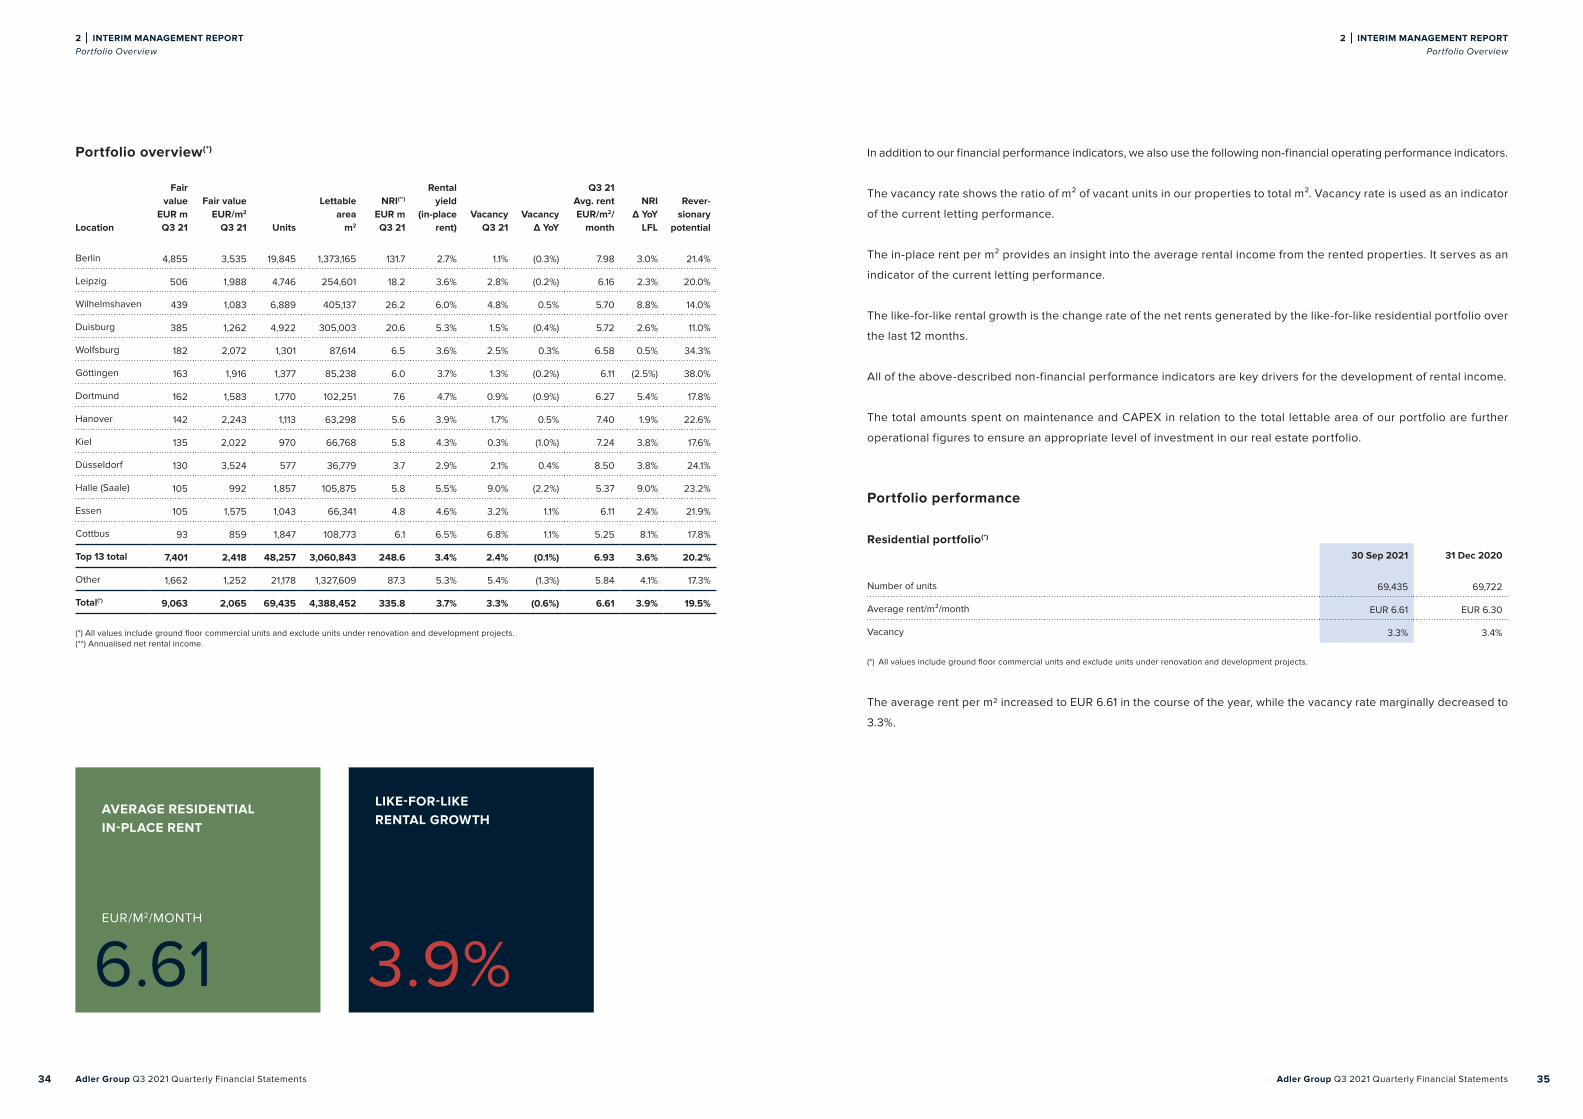
Portfolio overview(*)
Location
Fair value
EUR m Q3 21
Fair value EUR/m2
Q3 21 Units
Lettable area
m2
NRI(**) EUR m Q3 21
Rental yield
(in-place rent)
Vacancy Q3 21
Vacancy Δ YoY
Q3 21 Avg. rent EUR/m2/
month
NRI Δ YoY
LFL
Rever-sionary
potential
Berlin 4,855 3,535 19,845 1,373,165 131.7 2.7% 1.1% (0.3%) 7.98 3.0% 21.4%
Leipzig 506 1,988 4,746 254,601 18.2 3.6% 2.8% (0.2%) 6.16 2.3% 20.0%
Wilhelmshaven 439 1,083 6,889 405,137 26.2 6.0% 4.8% 0.5% 5.70 8.8% 14.0%
Duisburg 385 1,262 4,922 305,003 20.6 5.3% 1.5% (0.4%) 5.72 2.6% 11.0%
Wolfsburg 182 2,072 1,301 87,614 6.5 3.6% 2.5% 0.3% 6.58 0.5% 34.3%
Göttingen 163 1,916 1,377 85,238 6.0 3.7% 1.3% (0.2%) 6.11 (2.5%) 38.0%
Dortmund 162 1,583 1,770 102,251 7.6 4.7% 0.9% (0.9%) 6.27 5.4% 17.8%
Hanover 142 2,243 1,113 63,298 5.6 3.9% 1.7% 0.5% 7.40 1.9% 22.6%
Kiel 135 2,022 970 66,768 5.8 4.3% 0.3% (1.0%) 7.24 3.8% 17.6%
Düsseldorf 130 3,524 577 36,779 3.7 2.9% 2.1% 0.4% 8.50 3.8% 24.1%
Halle (Saale) 105 992 1,857 105,875 5.8 5.5% 9.0% (2.2%) 5.37 9.0% 23.2%
Essen 105 1,575 1,043 66,341 4.8 4.6% 3.2% 1.1% 6.11 2.4% 21.9%
Cottbus 93 859 1,847 108,773 6.1 6.5% 6.8% 1.1% 5.25 8.1% 17.8%
Top 13 total 7,401 2,418 48,257 3,060,843 248.6 3.4% 2.4% (0.1%) 6.93 3.6% 20.2%
Other 1,662 1,252 21,178 1,327,609 87.3 5.3% 5.4% (1.3%) 5.84 4.1% 17.3%
Total(*) 9,063 2,065 69,435 4,388,452 335.8 3.7% 3.3% (0.6%) 6.61 3.9% 19.5%
(*) All values include ground floor commercial units and exclude units under renovation and development projects.(**) Annualised net rental income.
In addition to our financial performance indicators, we also use the following non-financial operating performance indicators.
The vacancy rate shows the ratio of m² of vacant units in our properties to total m². Vacancy rate is used as an indicator
of the current letting performance.
The in-place rent per m² provides an insight into the average rental income from the rented properties. It serves as an
indicator of the current letting performance.
The like-for-like rental growth is the change rate of the net rents generated by the like-for-like residential portfolio over
the last 12 months.
All of the above-described non-financial performance indicators are key drivers for the development of rental income.
The total amounts spent on maintenance and CAPEX in relation to the total lettable area of our portfolio are further
operational figures to ensure an appropriate level of investment in our real estate portfolio.
Portfolio performance
Residential portfolio(*)
30 Sep 2021 31 Dec 2020
Number of units 69,435 69,722
Average rent/m²/month EUR 6.61 EUR 6.30
Vacancy 3.3% 3.4%
(*) All values include ground floor commercial units and exclude units under renovation and development projects.
The average rent per m2 increased to EUR 6.61 in the course of the year, while the vacancy rate marginally decreased to
3.3%.
2 INTERIM MANAGEMENT REPORT Portfolio Overview
2 INTERIM MANAGEMENT REPORT Portfolio Overview

Adler Group Q3 2021 Quarterly Financial Statements Adler Group Q3 2021 Quarterly Financial Statements36 37
VACANCY RATE
TOTAL PORTFOLIO
3.3%
VACANCY RATE
TOP 13 CITIES
2.4%
Like-for-like rental growth(*)
In %LTM(**)
30 Sep 20211 Jan -
31 Dec 2020
Like-for-like rental growth 3.9% 2.2%
(*) All values include ground floor commercial units and exclude units under renovation and development projects.(**) Last 12 months (LTM).
Like-for-like rental growth of our Berlin portfolio amounted to 3.0% while like-for-like rental growth of the remaining
portfolio stood at 4.5%.
Our fully integrated active asset management is focused on rental growth and employs dedicated strategies to drive all
relevant components. In units that require modernisation, we invest CAPEX to improve quality to meet today’s stand-
ards and regulations. Applying the relevant regulatory framework accurately and efficiently is key to our success in
maximising rental growth for our let units.
Maintenance and CAPEX
In EUR per m²1 Jan -
30 Sep 20211 Jan -
31 Dec 2020
Maintenance 4.0 6.3
CAPEX(*) 19.2 24.4
Total 23.2 30.7
(*) Includes EUR 2.9 of modernisation CAPEX.
Maintenance and CAPEX
In EUR million1 Jan -
30 Sep 20211 Jan -
31 Dec 2020
Maintenance 17.6 30.5
CAPEX(*) 85.0 118.4
Total 102.6 148.9
(*) Includes EUR 13.0 million of modernisation CAPEX.
Total investment in the portfolio amounted to EUR 102.6 million resulting in the maintenance and CAPEX cost per m2 in
the first nine months of 2021 of EUR 23.2.
Vacancy split
Our active asset management aims to minimise our vacancy rate while keeping the necessary flexibility for our portfo-
lio optimisation.
Vacancy(*)
30 Sep 2021 31 Dec 2020
Total vacancy (units) 2,374 2,523
Total vacancy (m²) 144,241 149,369
Vacancy rate (top 13) 2.4% 2.3%
Total vacancy rate 3.3% 3.4%
(*) All values include ground floor commercial units and exclude units under renovation and development projects.
2 INTERIM MANAGEMENT REPORT Portfolio Overview
2 INTERIM MANAGEMENT REPORT Portfolio Overview

Adler Group Q3 2021 Quarterly Financial Statements Adler Group Q3 2021 Quarterly Financial Statements38 39
Financial performance indicators
The European Public Real Estate Association (EPRA)
changed its definition of net asset value (NAV) in Octo-
ber 2019 and it was applied for the first time in the 2020
financial year. The key figures NAV and NNNAV have
been replaced by three new figures: Net Reinstatement
Value (NRV), Net Tangible Asset (NTA) and Net Disposal
Value (NDV).
In addition to the new EPRA NAV metrics, we continue to
show EPRA NAV based on the previous EPRA Best Prac-
tice Recommendations (BPRs).
EPRA NAV represents the fair value of net assets on an
ongoing, long-term basis. Assets and liabilities that are
not expected to crystallise in normal circumstances, such
as the fair value of financial derivatives and deferred taxes
on property valuation surpluses, are therefore excluded.
Similarly, trading properties are adjusted to their fair value
under the EPRA NAV measure.
EPRA NAV makes adjustments to IFRS NAV to provide
stakeholders with the most relevant information on the fair
value of the assets and liabilities within a true real estate
investment company with a long-term investment strategy.
Adler Group has an outstanding convertible bond, which
might be converted into equity at maturity. To take this
fact into account, we present all the NAV metrics on a di-
luted basis as well which includes the fair value of the
convertible bond and the fully diluted number of shares at
the corresponding reporting date.
Financial Overview
Calculation of EPRA NAV
Total equity attributable to owners of the Company
(+) Revaluation of inventories1)
(–) Fair value of financial instruments2)
(–) Deferred taxes3)
= EPRA NAV
1) Difference between inventories carried in the balance sheet at cost (IAS 2) and the fair value of inventories.
2) Fair value of financial instruments that are used for hedging purposes where the Company has the intention of keeping the hedge position until the end of the contractual duration.
3) For EPRA NAV and EPRA NRV: Deferred tax as per the IFRS balance sheet in respect of the difference between the fair value and the tax book value of in-vestment property, development property held for investment, intangible assets, or other non-current investments.
For EPRA NTA: Only deferred taxes relating to the proportion of the portfolio that is intended to be held in the long-run and not sold are excluded.
The objective of the EPRA NRV measure is to highlight the
value of net assets on a long-term basis. Assets and liabil-
ities which are not expected to crystallise in normal cir-
cumstances, such as the fair value movements on finan-
cial derivatives and deferred taxes on property valuation
surpluses, are therefore excluded. Since the indicator
also aims at reflecting what would be needed to recreate
the Company through the investment markets based on
its current capital and financing structure, related costs
(such as real estate transfer taxes) are included.
Calculation of EPRA NRV
Total equity attributable to owners of the Company
(+) Revaluation of inventories1)
(–) Fair value of financial instruments2)
(–) Deferred taxes3)
(+) Real estate transfer tax4)
= EPRA NRV
4) For EPRA NRV: Real Estate Transfer Tax on investment properties is the gross value as provided in the valuation certificate (i.e. the value prior to any deduction of purchasers’ costs).
For EPRA NTA: The Company has a history of successfully completing share deals; and there is a reasonable expectation that the Company can also do so in the future. Therefore, transfer tax optimisation adjustment has been used by applying the implied average transfer tax consistently achieved in the past.
The underlying assumption behind the EPRA Net Tangible
Assets calculation assumes that entities buy and sell as-
sets, thereby crystallising certain levels of deferred tax lia-
bility.
Calculation of EPRA NTA
Total equity attributable to owners of the Company
(+) Revaluation of inventories1)
(–) Fair value of financial instruments2)
(–) Deferred taxes3)
(–) Goodwill
(+) Real estate transfer tax4)
= EPRA NTA
EPRA Net Disposal Value presents a scenario where de-
ferred tax, financial instruments and certain other adjust-
ments are calculated as to the full extent of their liability, in-
cluding tax exposure not reflected in the balance sheet, net
of any resulting tax. This measure should not be viewed as a
“liquidation NAV” because, in many cases, fair values do not
represent liquidation values.
Calculation of EPRA NDV
Total equity attributable to owners of the Company
(+) Revaluation of inventories1)
(–) Fair value of fixed interest rate debt5)
(–) Goodwill
= EPRA NDV
5) The difference between the fair value of fixed interest rate debt and book value included in the balance sheet as per IFRS.
NOI (net operating income) equals total revenue from the
property portfolio less all reasonably necessary operat-
ing expenses. Aside from rent, a property might also gen-
erate revenue from parking and service fees. NOI is used
to track the real estate portfolio’s capability of generating
income.
EBITDA from rental activities is an indicator of a company’s
financial performance and is calculated by deducting the
overhead costs from NOI. It is used as a proxy to assess the
recurring earnings potential of the letting business.
EBITDA Total can be derived by adding the net profit from
project development activities, the fair value gain from
build-to-hold development and the net profit from privati-
sations to EBITDA from rental activities.
In addition, we present the NOI margin from rental activ-
ities – calculated as NOI divided by net rental income, as
well as EBITDA margin from rental activities – calculated
as EBITDA from rental activities divided by net rental in-
come. These metrics are useful to analyse the operation-
al efficiency at real estate portfolio level as well as at
company level.
2 INTERIM MANAGEMENT REPORT Financial Overview
2 INTERIM MANAGEMENT REPORT Financial Overview

Adler Group Q3 2021 Quarterly Financial Statements Adler Group Q3 2021 Quarterly Financial Statements40 41
Calculation of EBITDA (from rental activities)
Net rental income
(+) Income from facility services and recharged
utilities costs
= Income from rental activities
(–) Cost from rental activities6)
= Net operating income (NOI) from rental activities
(–) Overhead costs from rental activities7)
= EBITDA from rental activities
6) Cost from rental activities is the aggregate amount of (a) Salaries and other expenses related to rental activities; (b) Net cost of utilities recharged; and (c) Property operations and maintenance, excluding one-off costs.
7) Overhead costs from rental activities represent the “General and adminis-trative expenses” from the profit or loss statement excluding one-off costs and depreciation and amortisation relating to rental activities. Adjustments for one-off costs include items that are of a non-periodic nature, recur irregularly, are not typical for operations, or are non-cash-effective like impairment losses on trade receivables.
Calculation of EBITDA Total
Income from rental activities
(+) Income from property development
(+) Income from real estate inventories disposed of
(+) Income from other services
(+) Income from selling of trading properties
= Revenue
(–) Cost from rental activities6)
(–) Other operational costs from development
and privatisation sales8)
= Net operating income (NOI)
(–) Overhead costs from rental activities7)
(–) Overhead costs from development and
privatisation sales9)
(+) Fair value gain from build-to-hold development10)
= EBITDA Total
(–) Net cash interest11)
(+/–) Other net financial costs12)
(–) Depreciation and amortisation
(+) Change in fair value of investment properties
(+/–) Other expenses/income13)
(–) Net income from at-equity valued investment14)
= EBT
8) Other operational costs from development and privatisation sales is the aggregate amount of (a) Costs of real estate inventories disposed of; (b) Costs of property development; and (c) Costs of selling of trading property (condominiums) excluding one-off costs and depreciation and amortisation.
9) Overhead costs from development and privatisation sales represent the “General and administrative expenses” from the profit or loss statement excluding one-off costs and depreciation and amortisation excluding costs relating to rental activities. Adjustments for one-off costs include items that are of a non-periodic nature, recur irregularly, are not typical for operations, or are non-cash-effective.
10) Our internally developed build-to-hold portfolio allows the Company to generate fair value gain.
11) Net cash interest is equal to “Interest on other loans and borrowings”, excluding day-1 fair value non-cash adjustment and interest capitalised for development projects, plus the nominal interest expense on bonds.
12) Other net financial costs is equal to the total “Net finance costs” from the profit or loss statement less “Net cash interest” as calculated in footnote 11) above.
13) Other expenses/income relates to adjustments for one-off costs which include items that are of a non-periodic nature, recur irregularly, are not typical for opera-tions, or are non-cash-effective.
14) Net income from at-equity valued investment from the profit and loss statement.
Starting with EBITDA from rental activities, we calculate
the main performance figure in the sector, the FFO 1 (from
rental activities). This KPI serves as an indicator of the sus-
tained operational earnings power after cash interest ex-
penses and current income taxes of our letting business.
Calculation of FFO 1 (from rental activities)
EBITDA from rental activities
(–) Net cash interest relating to rental activities15)
(–) Current income taxes relating to rental activities16)
(–) Interest of minority shareholders17)
= FFO 1 (from rental activities)
15) Net cash interest relating to rental activities is equal to “Interest on other loans and borrowings” relating to rental activities, excluding day-1 fair value non-cash adjustment, plus the nominal interest expense on bonds.
16) Only current income taxes relating to rental activities.
17) Interest of minority shareholders in ADLER’s subsidiary Brack Capital Proper-ties N.V. (“BCP”) as ADLER’s share is only 69.80%.
Starting from EBITDA Total, we calculate FFO 2 (incl. dis-
posal results and development activities). FFO 2 is used
to indicate the total operational earnings power.
Calculation of FFO 2
(incl. disposal results and development activities)
EBITDA Total
(–) Net cash interest11)
(–) Current income taxes18)
(–) Interest of minority shareholders17)
= FFO 2
(incl. disposal results and development activities)
18) Current income taxes as presented in the financial statements exclude the deferred taxes and current taxes relating to the disposal of the non-core portfolio.
The loan-to-value ratio (LTV ratio) indicates the degree to
which the net financial liabilities, calculated as the book
value of the interest-bearing loans and borrowings plus
bonds less cash and cash equivalents, are covered by the
fair market value of the real estate portfolio. This indicator
helps us to ensure a sustainable ratio of borrowings com-
pared to the fair value of our real estate portfolio.
The LTV ratio was adjusted to align with the methodology of
ADLER Real Estate AG. The net financial liabilities are adjust-
ed for selected financial assets like purchase price receiva-
bles and financial assets, among others. The fair value of
the properties includes advances paid in respect of invest-
ment properties and is adjusted for property, plant and
equipment used for energy management and property
management services and for investments in real estate
companies.
Calculation of LTV
Bonds, other loans and borrowings
(+) Convertible bonds
(–) Cash and cash equivalents
(–) Selected financial assets19)
(–) Contract assets
(–) Assets and liabilities classified as held for sale
= Net financial liabilities
(+) Fair value of properties20)
(+) Investment in real estate companies21)
= GAV (Gross Asset Value)
= Loan-to-value ratio (LTV ratio)
19) Including financial receivables, trade receivables from the sale of real estate investment and other financial assets.
20) Including investment properties and inventories at their fair value, advances paid in respect of investment properties as well as property, plant and equip-ment used for energy management and property management services at its book value as at the reporting date.
21) Including investment in financial instruments and investments in associated companies from the consolidated financial statements.
2 INTERIM MANAGEMENT REPORT Financial Overview
2 INTERIM MANAGEMENT REPORT Financial Overview

Adler Group Q3 2021 Quarterly Financial Statements Adler Group Q3 2021 Quarterly Financial Statements42 43
INCOME FROM RENTAL ACTIVITIES
EUR
344.4million
We believe that the alternative performance measures
described in this section constitute the most important
indicators for measuring the operating and financial per-
formance of the Group’s business.
We expect all of the above-described alternative per-
formance measures to be of use for our investors in
evaluating the Group’s operating performance, the net
value of the Group’s property portfolio and the level of
the Group’s indebtedness.
Due to rounding, the figures reported in tables and
cross-references may deviate from their exact values as
calculated.
Profit situation
At the beginning of the second quarter of 2020, the Adler
Group gained control of ADLER and its subsidiaries and
consolidated the company and its subsidiaries for the first
time. At the beginning of the third quarter of 2020, the
Adler Group gained control of Consus and its subsidiaries
and consolidated the company and its subsidiaries for the
first time. A comparison with the previous year’s figures is
therefore only possible to a limited extent.
Income from rental activities and EBITDA from rental activ-
ities increased in the first nine months of the year on a
year-on-year basis mainly due to the first-time consolida-
tion of ADLER and the unconstitutionality of the Berlin rent
freeze.
The illustrated EBITDA Total / EBT calculation as of 30
September 2020 deviates from the condensed consoli-
dated interim statement of profit and loss as of 30 Sep-
tember 2020 on page 60 compared to the report pub-
lished in the prior year for the purpose of comparability.
The prior period’s revenue (EUR -29.5 million), cost of
sales (EUR -27.3 million) and profit (EUR -2.2 million) were
adjusted retrospectively according to IFRS 3.45 (refer to
note 5 Annual Report 2020).
At 30 September 2021 the net interest-bearing debt
amounted to around EUR 8.3 billion. As at Q3 2021, our
average interest rate on all outstanding debt is 2.1%, with a
weighted average maturity of 4.2 years and an interest
coverage ratio of 3.2(*). The weighted average cost of debt
on Consus side is around 3.9% with an average maturity
of 1.6 years.
(*) The interest coverage ratio (“ICR”) is defined as the EBITDA Total relative to the Net cash Interest in the most recent four consecutive quarters.
EBITDAEBITDA from rental activities
For the nine months ended For the three months endedFor the
year ended
In EUR thousand30 Sep
202130 Sep
202030 Sep
202130 Sep
202031 Dec
2020
Net rental income 259,329 203,223 85,312 88,432 293,387
Income from facility services and recharged utilities costs 85,021 62,891 28,531 29,785 90,519
Income from rental activities 344,350 266,114 113,843 118,217 383,906
Cost from rental activities (133,746) (101,916) (43,826) (48,078) (153,274)
Net operating income (NOI) from rental activities 210,604 164,197 70,017 70,139 230,633
NOI from rental activities margin (%) 81.2% 80.8% 82.1% 79.3% 78.6%
Overhead costs from rental activities (41,424) (30,427) (13,382) (13,689) (43,619)
EBITDA from rental activities 169,180 133,771 56,636 56,450 187,014
EBITDA margin from rental activities (%) 65.2% 65.8% 66.4% 63.8% 63.7%
EBITDA Total
For the nine months ended For the three months endedFor the
year ended
In EUR thousand30 Sep
202130 Sep
202030 Sep
202130 Sep
202031 Dec
2020
Income from rental activities 344,350 266,114 113,843 118,217 383,906
Income from property development 78,544 141,506 19,636 117,536 134,634
Income from other services 10,446 4,538 5,568 4,538 14,893
Income from real estate inventory disposed of - - - - 218,667
Income from sale of trading properties 5,122 4,724 205 1,973 6,637
Revenue 438,462 416,882 139,252 242,264 758,737
Cost from rental activities (133,746) (101,916) (43,826) (48,078) (153,274)
Other operational costs from development and privatisation sales (74,674) (111,920) (9,119) (93,558) (330,162)
Net operating income (NOI) 230,041 203,045 86,307 100,628 275,302
Overhead costs from rental activities (41,424) (30,427) (13,382) (13,689) (43,619)
Overhead costs from development and privatisation sales (11,612) (14,909) (1,726) (14,909) (24,114)
Fair value gain from build-to-hold development 61,384 - - - 39,780
EBITDA Total 238,389 157,710 71,199 72,030 247,349
Net cash interest (69,560) (68,173) (14,691) (38,455) (101,954)
Other net financial costs (176,120) (144,702) (73,582) (20,137) (88,112)
Depreciation and amortisation (11,397) (6,922) (3,813) (4,162) (11,304)
Other income/(expenses) 10,220 16,691 (9,517) (27,643) (65,667)
Change in valuation 509,397 189,084 30,829 47,856 373,895
Net income from at-equity valued investments (47) (1,373) 53 (1,737) (5,666)
EBT 500,882 142,315 478 27,752 348,542
2 INTERIM MANAGEMENT REPORT Financial Overview
2 INTERIM MANAGEMENT REPORT Financial Overview

Adler Group Q3 2021 Quarterly Financial Statements Adler Group Q3 2021 Quarterly Financial Statements44 45
FFO 1
EUR
101.9million
FFO
FFO 1 (from rental activities)
For the nine months ended For the three months endedFor the
year ended
In EUR thousand30 Sep
202130 Sep
202030 Sep
202130 Sep
202031 Dec
2020
EBITDA from rental activities 169,180 133,771 56,636 56,450 187,014
Net cash interest (56,468) (50,346) (18,749) (20,628) (70,157)
Current income taxes (5,013) (4,688) (833) (1,971) (3,648)
Interest of minority shareholders (5,799) (3,999) (1,956) (2,047) (6,080)
FFO 1 (from rental activities) 101,900 74,738 35,098 31,804 107,128
No. of shares(*) 117,510 70,565 117,510 97,991 79,771
FFO 1 per share 0.87 1.06 0.30 0.32 1.34
(*) The number of shares is calculated as weighted average for the related period.
FFO 2 (incl. disposal results and development activities)
For the nine months ended For the three months endedFor the
year ended
In EUR thousand30 Sep
202130 Sep
202030 Sep
202130 Sep
202031 Dec
2020
EBITDA Total 238,389 157,710 71,199 72,030 247,349
Net cash interest (69,560) (68,173) (14,691) (38,455) (101,954)
Current income taxes (14,067) (11,868) 5,105 (6,028) (12,660)
Interest of minority shareholders (5,799) (3,999) (1,956) (2,047) (6,080)
FFO 2 148,963 73,670 59,657 25,500 126,654
No. of shares(*) 117,510 70,565 117,510 97,991 79,771
FFO 2 per share 1.27 1.04 0.51 0.26 1.59
(*) The number of shares is calculated as weighted average for the related period.
Financial and asset position
The Group’s total assets increased from EUR 14.8 billion on 31 December 2020 to EUR 15.8 billion as at 30 September
2021. The Company has updated the fair value of the yielding properties based on a third-party valuation.
Financial position
In EUR thousand 30 Sep 2021 31 Dec 2020
Investment properties and advances related to investment properties 11,212,701 10,110,842
Other non-current assets 1,427,934 1,839,086
Non-current assets 12,640,635 11,949,928
Cash and cash deposits 395,944 371,574
Inventories 1,711,400 1,254,460
Other current assets 1,046,883 1,122,316
Current assets 3,154,227 2,748,350
Non-current assets held for sale 36,628 139,361
Total assets 15,831,490 14,837,639
Interest-bearing debts 8,552,204 7,965,429
Other liabilities 1,014,133 994,171
Deferred tax liabilities 1,073,128 933,226
Liabilities classified as available for sale - 27,271
Total liabilities 10,639,465 9,920,097
Total equity attributable to owner of the Company 4,441,326 4,145,531
Non-controlling interests 750,699 772,011
Total equity 5,192,025 4,917,542
Total equity and liabilities 15,831,490 14,837,639
2 INTERIM MANAGEMENT REPORT Financial Overview
2 INTERIM MANAGEMENT REPORT Financial Overview
Adler Group Q3 2021 Quarterly Financial Statements Adler Group Q3 2021 Quarterly Financial Statements46 47
LTV
57.0%
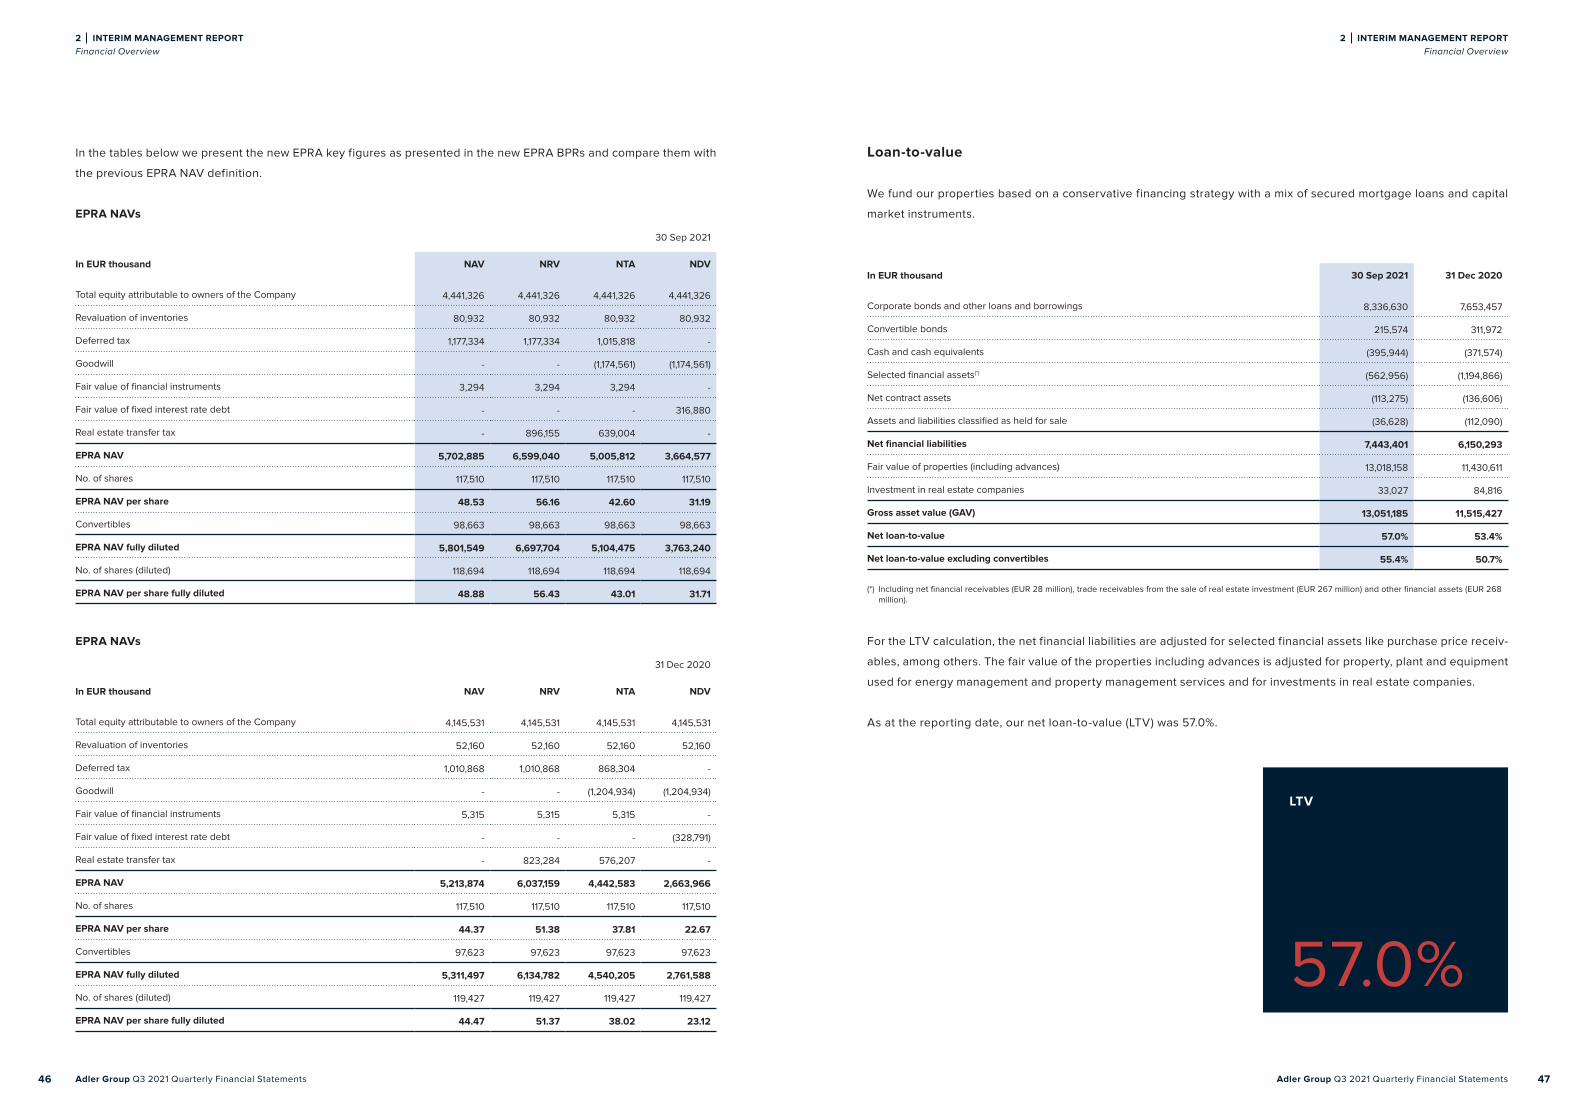
In the tables below we present the new EPRA key figures as presented in the new EPRA BPRs and compare them with
the previous EPRA NAV definition.
EPRA NAVs
30 Sep 2021
In EUR thousand NAV NRV NTA NDV
Total equity attributable to owners of the Company 4,441,326 4,441,326 4,441,326 4,441,326
Revaluation of inventories 80,932 80,932 80,932 80,932
Deferred tax 1,177,334 1,177,334 1,015,818 -
Goodwill - - (1,174,561) (1,174,561)
Fair value of financial instruments 3,294 3,294 3,294 -
Fair value of fixed interest rate debt - - - 316,880
Real estate transfer tax - 896,155 639,004 -
EPRA NAV 5,702,885 6,599,040 5,005,812 3,664,577
No. of shares 117,510 117,510 117,510 117,510
EPRA NAV per share 48.53 56.16 42.60 31.19
Convertibles 98,663 98,663 98,663 98,663
EPRA NAV fully diluted 5,801,549 6,697,704 5,104,475 3,763,240
No. of shares (diluted) 118,694 118,694 118,694 118,694
EPRA NAV per share fully diluted 48.88 56.43 43.01 31.71
EPRA NAVs
31 Dec 2020
In EUR thousand NAV NRV NTA NDV
Total equity attributable to owners of the Company 4,145,531 4,145,531 4,145,531 4,145,531
Revaluation of inventories 52,160 52,160 52,160 52,160
Deferred tax 1,010,868 1,010,868 868,304 -
Goodwill - - (1,204,934) (1,204,934)
Fair value of financial instruments 5,315 5,315 5,315 -
Fair value of fixed interest rate debt - - - (328,791)
Real estate transfer tax - 823,284 576,207 -
EPRA NAV 5,213,874 6,037,159 4,442,583 2,663,966
No. of shares 117,510 117,510 117,510 117,510
EPRA NAV per share 44.37 51.38 37.81 22.67
Convertibles 97,623 97,623 97,623 97,623
EPRA NAV fully diluted 5,311,497 6,134,782 4,540,205 2,761,588
No. of shares (diluted) 119,427 119,427 119,427 119,427
EPRA NAV per share fully diluted 44.47 51.37 38.02 23.12
Loan-to-value
We fund our properties based on a conservative financing strategy with a mix of secured mortgage loans and capital
market instruments.
In EUR thousand 30 Sep 2021 31 Dec 2020
Corporate bonds and other loans and borrowings 8,336,630 7,653,457
Convertible bonds 215,574 311,972
Cash and cash equivalents (395,944) (371,574)
Selected financial assets(*) (562,956) (1,194,866)
Net contract assets (113,275) (136,606)
Assets and liabilities classified as held for sale (36,628) (112,090)
Net financial liabilities 7,443,401 6,150,293
Fair value of properties (including advances) 13,018,158 11,430,611
Investment in real estate companies 33,027 84,816
Gross asset value (GAV) 13,051,185 11,515,427
Net loan-to-value 57.0% 53.4%
Net loan-to-value excluding convertibles 55.4% 50.7%
(*) Including net financial receivables (EUR 28 million), trade receivables from the sale of real estate investment (EUR 267 million) and other financial assets (EUR 268 million).
For the LTV calculation, the net financial liabilities are adjusted for selected financial assets like purchase price receiv-
ables, among others. The fair value of the properties including advances is adjusted for property, plant and equipment
used for energy management and property management services and for investments in real estate companies.
As at the reporting date, our net loan-to-value (LTV) was 57.0%.
2 INTERIM MANAGEMENT REPORT Financial Overview
2 INTERIM MANAGEMENT REPORT Financial Overview
Adler Group Q3 2021 Quarterly Financial Statements Adler Group Q3 2021 Quarterly Financial Statements48 49
Material Events in the Reporting Period and Sub-sequent Events
A. On 30 January 2020, the World Health Organisation
(WHO) declared an international health emergency due
to the outbreak of the coronavirus. Since 11 March 2020,
the WHO has classified the spread of the coronavirus as
a pandemic. Adler Group is continuously assessing the
impact of Covid-19. The valuation of the investment prop-
erties, financial assets and financial liabilities as at
30 September 2021 as disclosed in these consolidated
interim financial statements reflects the economic condi-
tions in existence at that date. The Company does not
expect the crisis to have any material impact on rental
income. In Germany, rents are still continuing to rise and
the demand for living space is increasing as well. This
leads to a very low risk of losing tenants and a high occu-
pancy rate due to a change in the general condition on
the residential markets.
B. On 7 January 2021, Consus, a 94 percent subsidiary of
the Group, successfully completed the disposal of 24
non-strategic projects. Together with proceeds received
from the successful closing of the disposal of approxi-
mately 5,000 residential units as announced in Septem-
ber 2020, the Group generated total proceeds in the
amount of EUR 850 million. These proceeds were used to
repay existing debt, to further smoothen the maturity pro-
file and to reduce the average cost of debt.
C. On 8 January 2021, the Group successfully placed
EUR 1.5 billion fixed rate senior unsecured notes compris-
ing of two tranches, a EUR 700 million 5-year maturity
with a 1.875 percent fixed coupon and a EUR 800 million
8-year maturity with a 2.25 percent fixed coupon. The
proceeds of the issue of the notes were used to repay
existing indebtedness, to further smoothen and extend
the Group’s debt maturity profile and as a next step to
achieve the targeted financial synergies. Subsequent to
the placement, the Group redeemed approximately EUR
329 million of ADLER Real Estate AG’s EUR 500 million
bond due in December 2021.
D. In January 2021, BCP, a subsidiary of the Group, signed
a refinancing agreement with a German banking corpora-
tion for a loan of approximately EUR 100.5 million. The
loan bears an average annual interest rate of approxi-
mately 1.41% with maturity date in June 2023.
E. In January 2021, the outstanding amount under the
bridge loan facility agreement (outstanding volume as at
31 December 2020: EUR 371 million) was repaid. At the same
time the bridge loan facility agreement was terminated.
F. Upon entry into the commercial register on 23 February
2021, the debt-to-equity swap agreement concluded in
2020 became legally effective. As a result, the Group’s
share in ADLER Real Estate Aktiengesellschaft increased
from approximately 93.9 percent to 96.6 percent. In the
course of this transaction, Adler Group S.A. acquired
35,107,487 additional ADLER shares against contribution
in kind of EUR 478 million. Due to the consolidation of
ADLER, the step up did not have an impact on the Group’s
assets and liabilities. However, the Group adjusted the
carrying amounts of the controlling and non-controlling
interests to reflect the changes in the relative interests in
the subsidiary accordingly.
G. On 15 March 2021, the Company signed a EUR 300 million
syndicated revolving credit facility with JP Morgan, Deutsche
Bank and Barclays as lenders for a 3-year term with two ex-
tension options, each for one year. At the same time the
three bilateral RCFs with the same lenders were terminated.
At the time of the approval of these consolidated financial
statements, the total amount of EUR 300 million were bor-
rowed under the RCF as a further liquidity cushion and to
enhance the Group’s flexibility.
H. In March 2021, Westgrund, a subsidiary of the Group,
raised a secured loan of EUR 400 million with a 7-year
term and a fixed interest rate of 1.6 percent, replacing the
current outstanding loan of EUR 191 million due in Decem-
ber 2021.
I. In March and April 2021, the Group raised a secured bank-
ing loan of EUR 100 million in total. The loan has an interest
rate of 1.25 percent p.a. and a maturity term to 2028.
J. On 16 April 2021, the Federal Constitutional Court in
Karlsruhe ruled that Berlin’s rent freeze is unconstitutional,
thus declaring the highly controversial Act on Rent Restric-
tions in the Housing Sector in Berlin (MietenWoG Bln) in-
compatible with Basic Law and therefore null and void. In
the opinion of the Second Senate of the Federal Constitu-
tional Court, the state of Berlin had no right to limit rent
levels by means of a so-called “rent freeze” in the German
capital due to a lack of legislative competence, as the fed-
eral legislation had exhaustively regulated rent law in the
German Civil Code (BGB). The Adler Group has offered its
tenants individual solutions for repayments.
K. On 21 April 2021, Adler Group S.A. successfully placed
EUR 500 million fixed rate senior unsecured notes with a
6-year maturity and a 2.25 percent fixed coupon under its
newly established EMTN programme. The notes were
placed with institutional investors across Europe with a to-
tal order book of EUR 1.1 billion. The proceeds of the issue
of the notes were used to call and repay the EUR 450 mil-
lion 9.625 percent high yield bond issued by Consus Real
Estate AG. In addition to the announced EUR 93.8 million
run-rate financial synergies, which were realised as at the
end of 31 March 2021, this refinancing will enable Adler
Group to realise a further EUR 33 million of annualised fi-
nancial synergies. It will have a positive impact on all debt
KPIs, including average cost of debt, which is expected to
come down to 2.2 percent, as well as extending the debt
maturity profile to 4.5 years. The notes are rated BB+ with
S&P, driven by the strong recovery rating of the bonds and
influenced by Adler Group’s valuable asset base.
L. On 17 May 2021, the Consus Bond 2019/2024 with a
nominal outstanding amount of EUR 450 million was re-
deemed before its due date. In connection with the re-
demption, early repayment fees of EUR 21.7 million were
incurred. The derecognition of the bond including the em-
bedded derivative led to a net loss of EUR 24.6 million
which is shown in net finance costs.
M. In the second quarter of 2021, Adler Group increased its
shareholding in Consus from 93.9 percent to 96.9 percent.
The Group adjusted the carrying amounts of the controlling
and non-controlling interests to reflect the changes in the
relative interests in the subsidiary accordingly.
N. On 25 June 2021, Adler Group established a commer-
cial paper programme which allows the Company to issue
short-term notes up to a maximum aggregate amount of
2 INTERIM MANAGEMENT REPORT Material Events in the Reporting Period and Subsequent Events
2 INTERIM MANAGEMENT REPORT Material Events in the Reporting Period and Subsequent Events
Adler Group Q3 2021 Quarterly Financial Statements Adler Group Q3 2021 Quarterly Financial Statements50 51
EUR 500 million for interim financings of general corpo-
rate purposes. As per the balance sheet date, an amount
of EUR 5 million was outstanding under the commercial
paper programme.
O. At the annual General Meeting of shareholders held on
29 June 2021, a dividend in an amount of EUR 0.46 per
share (gross dividend in an aggregate amount of
EUR 54.1 million) was declared.
P. On 20 July 2021, Adler Group sold 30,000 m² of the
office development project in Frankfurt’s banking dis-
trict as part of the build-to-sell development pipeline
(upfront sales) for EUR 185 million. Proceeds are expect-
ed to be received in Q4 of 2021 and will be used to repay
debt in line with Group’s deleveraging strategy. The sale
follows the previously announced corporate strategy of
focussing on the core business of residential real estate.
Q. On 11 August 2021, the international rating agency
Standard and Poor’s (S&P) published a full analysis report
on Adler Group’s “BB/stable” rating.
R. On 16 August 2021, Sustainalytics assigned a new ESG
rating to Adler Group of 10.7, ranking the Group as the 46th
best real estate company in Sustainalytics’ global cover-
age of 1,001 real estate companies, positioning the Group
in the top 5% of the real estate coverage. Adler Group has
also become a member of the UN Global Compact and the
German Association of Sustainable Building (DGNB), com-
mitting to build carbon-neutral buildings for a better future.
S. In August 2021 the Group learned that there are delays
of the zoning plan approvals in connection with the
Gerresheim project in Düsseldorf (Glasmacherviertel
GmbH & Co. KG), which has already been sold, due to ob-
jections by Deutsche Bahn AG. According to the Group’s
estimation and based on the information provided to it by
the authorities in Germany, the approval is expected during
the year 2022. In order to prevent further delays caused by
the objections of Deutsche Bahn AG, the Group is holding
discussions with the Düsseldorf municipality regarding the
possibility of dividing the zoning plan.
Due to the delays of the zoning plan approvals in connec-
tion with the project in Düsseldorf, which has already
been sold, and the process initiated as a result to prepare
a cancellation of the sales agreement, the Company reas-
sessed its rights and obligations under the contract in
particular its right to cancel the agreement. As a conclu-
sion the Company effectively controls the investee which
was previously held as an investment accounted for un-
der the equity method. Therefore, the Company fully con-
solidated the investee which mainly includes a develop-
ment property and the associated financing arrangement.
As a main result of the full consolidation of the investee,
the investment properties increased by EUR 270 million
and other loans and borrowings by EUR 148 million re-
spectively. In return, the at equity investment and pur-
chase price receivable were derecognised, while the
shareholder loan is consolidated again. The fair value
measurement of the development according to IAS 40 led
to a negative change in an amount of EUR 126 million (be-
fore deferred tax gain of EUR 20 million). The fair value of
the investment property was determined by an independ-
ent valuation expert with appropriate, recognised profes-
sional qualifications and recent experience regarding the
location and category of the properties being valued.
T. In the third quarter of 2021 the Group raised secured
financings in an aggregate amount of approximately
EUR 177 million with maturities ranging from 4 to 10 years
and interest rates between 0.8% and 1.6%. A project loan
of EUR 170 million carrying a coupon of 3.5% was repaid.
The repayment of this loan for the Holsten Quartier pro-
ject, a subsidiary of Consus, led to a further reduction of
debt at the level of Consus in line with our financing strat-
egy. The ADLER convertible bond 2016/2021 with a cou-
pon of 1.5% was redeemed at maturity. The nominal
amount at maturity that was not converted amounted to
EUR 90.3 million.
U. On 4 October 2021 Adler Group decided to initiate a re-
view of strategic options after being approached multiple
times by interested institutional parties relating to its yield-
ing assets portfolio which could result in a sale of a materi-
al part of its yielding assets, following strong inbound de-
mand and recent upward market valuations. Proceeds from
such disposals aim to significantly reduce leverage and
also to return capital to bond and equity holders.
V. Adler Group has appointed KPMG’s specialised foren-
sic accounting division to review amongst others certain
historical transactions. Adler Group will receive a full re-
port from KPMG upon completion of its review and KPMG
will in the meantime immediately notify Adler Group
board of any material findings.
W. On 11 October 2021, the international rating agency
Standard and Poor’s (S&P) has downgraded Adler Group’s
rating to “B+/watch negative” from BB/stable. The notes
are rated BB- with S&P.
X. On 11 October 2021, Adler Group and LEG Immobilien
SE (“LEG”) signed a term sheet setting out the key points
of a transaction regarding the sale of a total of 15,350 res-
idential units and 185 commercial units. The transaction is
based on a real estate portfolio value of approximately
EUR 1.4 billion. This is above the respective book values
as of 30 June 2021. The assets to be disposed of are lo-
cated amongst others in Wilhelmshaven, Göttingen and
Wolfsburg, thus increasing the focus of the remaining
Adler Group portfolio on Germany’s strong top 7 cities.
The transaction shall be executed by way of share deals.
Therefore, the cash inflow, also due to customary pur-
chase price adjustments, will deviate from the real estate
valuation. The sale may lead to a significant reduction in
ADLER’s leverage and return capital to its bond holders.
The closing of the transaction is subject to due diligence
conducted by LEG, the conclusion of final agreements
and the fulfillment of customary market conditions, in par-
ticular regulatory approvals, and is expected to take place
by the end of 2021.
Y. On 26 October 2021, Adler Group signed a term sheet
with a leading alternative investment firm setting out the
key points of a transaction regarding a total of 14,368
units. These units are mainly located in the Eastern part of
Germany. According to the term sheet, the agreed real es-
tate value for the portfolio amounts to more than
EUR 1 billion. This is a premium compared to the respec-
tive book values appraised by CBRE as of 30 June 2021.
The sale may lead to a significant reduction in Adler
Group’s leverage and return capital to its bond holders.
The closing of the transaction is subject to due diligence
conducted by the buyer, the conclusion of final agree-
ments and the fulfillment of customary market conditions,
in particular regulatory approvals, and is expected to take
place in Q1 2022. As this transaction marks the end of the
announced strategic asset disposals, Adler Group is now
focussing on selling non-core development projects to
further decrease its LTV and its development exposure.
Z. On 28 October 2021, Adler Group announced that as of
1 November 2021, Dr. Bernd Schade will become Chief
Development Officer (CDO) of Adler Group. He will also
join Theo Gorens on the Executive Board of the Group
company Consus Real Estate AG. Bernd Schade succeeds
Jürgen Kutz. Bernd Schade has decades of experience in
project development and project management of real es-
tate projects throughout Germany.
2 INTERIM MANAGEMENT REPORT Material Events in the Reporting Period and Subsequent Events
2 INTERIM MANAGEMENT REPORT Material Events in the Reporting Period and Subsequent Events

Adler Group Q3 2021 Quarterly Financial Statements 53
Forecast ReportForecast for 2021
For the 2021 financial year, Adler Group expects to generate net rental income in the range of EUR 340-345 million and
FFO 1 in the range of EUR 135-140 million.(*)
The Company has also added additional KPIs and targets to its guidance, all details of which are included in the table
below:
FY 2021 guidance
Net rental income EUR 340-345m
FFO 1 EUR 135-140m
Dividend EUR 0.57-0.60 per share(**)
50% of FFO 1
Mid-term Guidance
LFL rental growth approx. 3% p.a.
Medium-term LTV target <50%
(*) Please note that the guidance for both net rental income and FFO 1 was increased in August 2021 on the back of the better-than-expected operational performance of the portfolio in cities outside Berlin as well as the cancellation of the Berlin rent freeze.(**) Implied dividend range on basis of the FFO 1 guidance range of EUR 135-140m, and company dividend policy of 50% payout ratio, subject to final board approval and shareholder approval in the annual General Meeting in 2022.
2 INTERIM MANAGEMENT REPORT Forecast Report
2 INTERIM MANAGEMENT REPORT Forecast Report
52 Adler Group Q3 2021 Quarterly Financial Statements
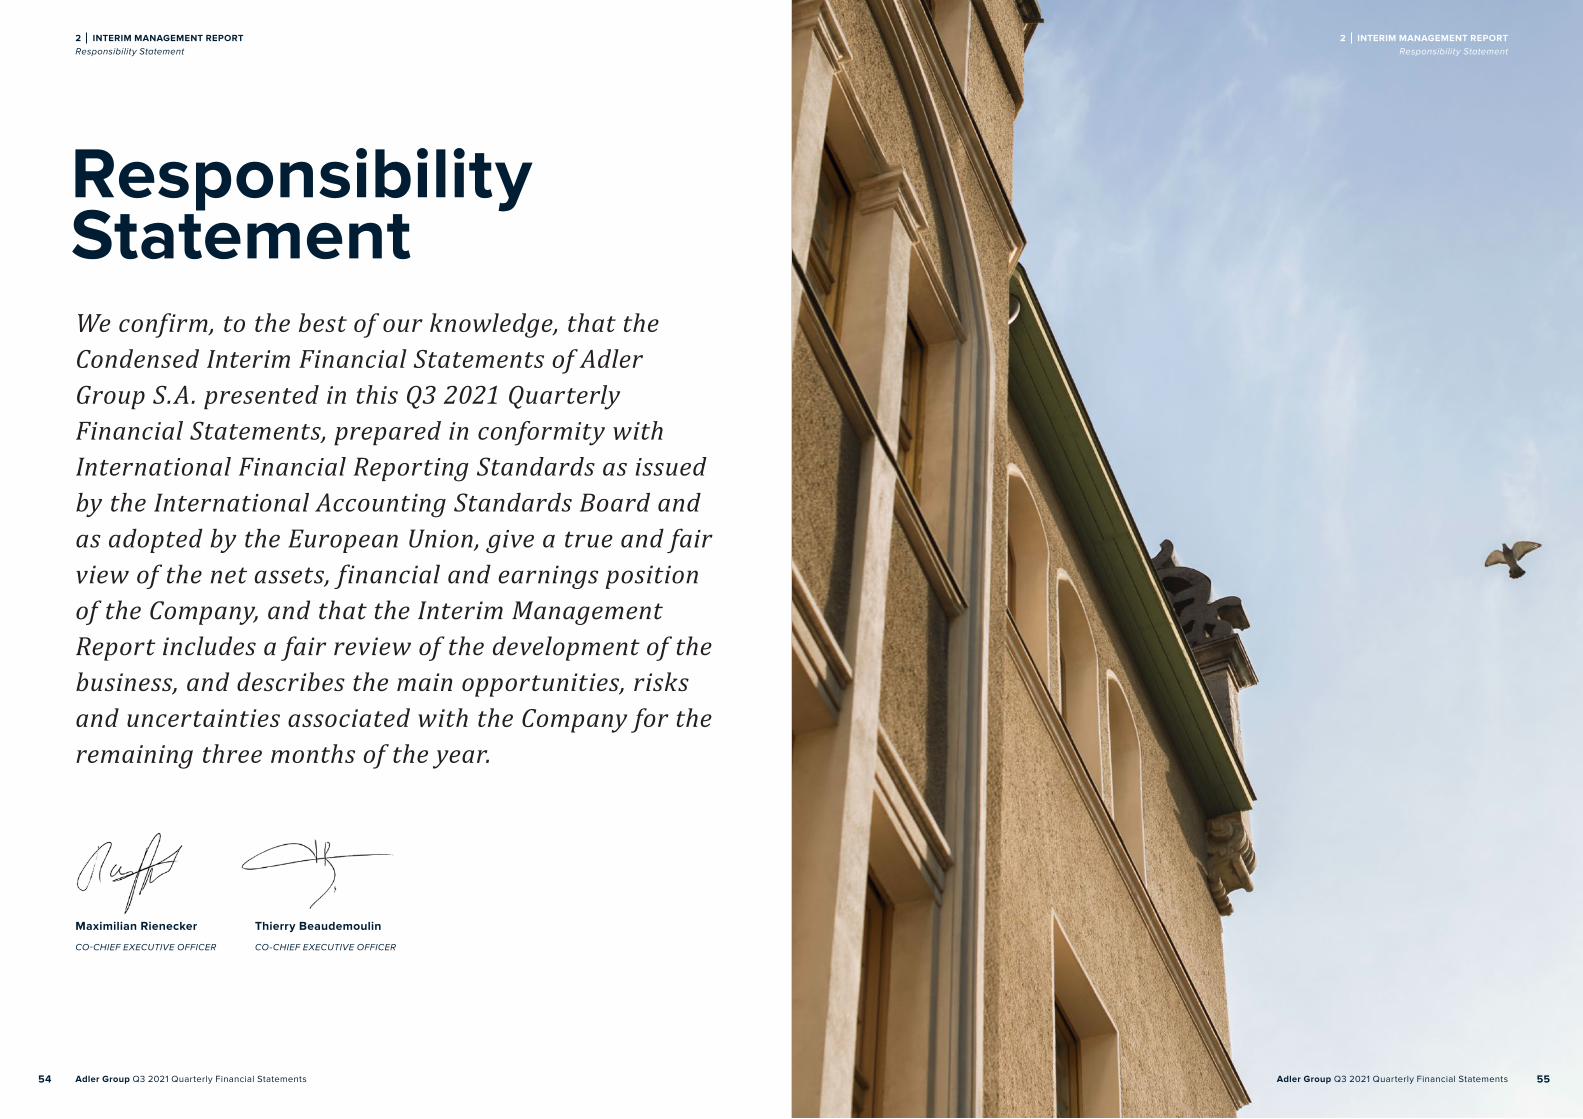
Adler Group Q3 2021 Quarterly Financial Statements Adler Group Q3 2021 Quarterly Financial Statements54 55
Maximilian Rienecker
CO-CHIEF EXECUTIVE OFFICER
Thierry Beaudemoulin
CO-CHIEF EXECUTIVE OFFICER
Responsibility StatementWe confirm, to the best of our knowledge, that the Condensed Interim Financial Statements of Adler Group S.A. presented in this Q3 2021 Quarterly Financial Statements, prepared in conformity with International Financial Reporting Standards as issued by the International Accounting Standards Board and as adopted by the European Union, give a true and fair view of the net assets, financial and earnings position of the Company, and that the Interim Management Report includes a fair review of the development of the business, and describes the main opportunities, risks and uncertainties associated with the Company for the remaining three months of the year.
2 INTERIM MANAGEMENT REPORT Responsibility Statement
2 INTERIM MANAGEMENT REPORT Responsibility Statement
55Adler Group Q3 2021 Quarterly Financial Statements

Adler Group Q3 2021 Quarterly Financial Statements Adler Group Q3 2021 Quarterly Financial Statements56 5756
3 Condensed Consolidated Interim Financial Statements
58 Condensed Consolidated Interim Statement of Financial Position
60 Condensed Consolidated Interim Statement of Profit or Loss
61 Condensed Consolidated Interim Statement of Comprehensive Income
62 Condensed Consolidated Interim Statement of Cash Flows
64 Condensed Consolidated Interim Statement of Changes in Equity
Adler Group Annual Report 2020 57Adler Group Q3 2021 Quarterly Financial Statements56
Condensed Consolidated Interim Financial Statements

Adler Group Q3 2021 Quarterly Financial Statements Adler Group Q3 2021 Quarterly Financial Statements58 59
In EUR thousand 30 Sep 2021 31 Dec 2020
Assets
Non-current assets
Investment properties 11,210,596 10,108,888
Investments in financial instruments 23,030 23,219
Investments accounted under the equity method 33,027 84,816
Advances related to investment properties 2,105 1,954
Property, plant and equipment 35,008 36,663
Other financial assets 98,777 416,207
Restricted bank deposits 23,405 34,587
Deferred expenses 977 342
Right-of-use assets 16,019 17,858
Goodwill 1,174,561 1,204,934
Other intangible assets 3,424 4,538
Contract assets 11,126 8,044
Deferred tax assets 8,580 7,878
Total non-current assets 12,640,635 11,949,928
Current assets
Inventories 1,711,400 1,254,460
Restricted bank deposits 53,252 62,633
Trade receivables 351,191 424,998
Other receivables 519,858 477,248
Contract assets 110,933 154,432
Cash and cash equivalents 395,944 371,574
Advances paid on inventories 11,649 3,005
Total current assets 3,154,227 2,748,350
Non-current assets held for sale 36,628 139,361
Total assets 15,831,490 14,837,639
In EUR thousand 30 Sep 2021 31 Dec 2020
Shareholders’ equity and liabilities
Shareholders’ equity
Share capital 146 146
Share premium 1,844,164 1,892,145
Reserves 206,073 197,551
Retained earnings 2,390,943 2,055,689
Total equity attributable to owners of the Company 4,441,326 4,145,531
Non-controlling interests 750,699 772,011
Total equity 5,192,025 4,917,542
Liabilities
Non-current liabilities
Corporate bonds 4,270,367 3,216,058
Convertible bonds 213,949 212,485
Other loans and borrowings 2,762,932 2,658,653
Other financial liabilities 34,434 38,878
Derivatives 3,377 20,848
Pension provisions 1,855 1,817
Lease liabilities 21,012 25,714
Other payables 11,117 11,905
Deferred tax liabilities 1,073,128 933,226
Total non-current liabilities 8,392,171 7,119,584
Current liabilities
Corporate bonds 579,293 512,904
Convertible bonds 1,625 99,487
Other loans and borrowings 724,038 1,265,842
Other financial liabilities 1,915 1,915
Trade payables 66,363 118,610
Other payables 622,497 440,842
Lease liabilities 7,303 8,019
Prepayments received 235,151 299,361
Contract liabilities 8,784 25,870
Derivatives 325 392
Total current liabilities 2,247,294 2,773,242
Non-current liabilities held for sale - 27,271
Total shareholders’ equity and liabilities 15,831,490 14,837,639
Condensed ConsolidatedInterim Statement ofFinancial Position
Date of approval: 29 November 2021
3 CONDENSED CONSOLIDATED INTERIM FINANCIAL STATEMENTS Condensed Consolidated Interim Statement of Financial Position
3 CONDENSED CONSOLIDATED INTERIM FINANCIAL STATEMENTS Condensed Consolidated Interim Statement of Financial Position
Maximilian Rienecker
CO-CHIEF EXECUTIVE OFFICER
Thierry Beaudemoulin
CO-CHIEF EXECUTIVE OFFICER

Adler Group Q3 2021 Quarterly Financial Statements Adler Group Q3 2021 Quarterly Financial Statements60 61
For the nine months ended 30 September
For the three months ended 30 September
In EUR thousand 2021 2020(*) 2021 2020(*)
Profit / (loss) for the period 379,521 97,637 (8,701) 11,947
Items that may be reclassified subsequently to profit or loss
Hedging reserve classified to profit or loss, net of tax 317 - 256 -
Effective portion of changes in fair value of cash flow hedges 254 312 (106) (222)
Related tax 159 73 61 138
Currency translation reserve 10,526 (6,252) 7,364 (6,252)
Reserve from financial assets measured at fair value through other comprehensive income
(2,734) (4,883) (2,350) (320)
Items that may not be reclassified subsequently to profit or loss
Reserve from financial assets measured at fair value through other comprehensive income
- (42,803) - (300)
Total other comprehensive income / (loss) 8,522 (53,553) 5,225 (6,957)
Total comprehensive income for the period 388,043 44,084 (3,476) 4,990
attributable to:
Owners of the Company 343,192 8,393 14,191 (2,252)
Non-controlling interests 44,851 35,691 (17,667) 7,242
Total comprehensive income for the period 388,043 44,084 (3,476) 4,990
(*) Prior period’s profit (EUR -2.2 million) retrospectively restated according to IFRS 3.45. Refer to Note 5 Annual Report 2020.
Condensed ConsolidatedInterim Statement ofComprehensive Income
For the nine months ended 30 September
For the three months ended 30 September
In EUR thousand 2021 2020(*) 2021 2020(*)
Revenue 438,462 387,429 139,252 212,811
Cost of operations (209,939) (194,296) (63,084) (120,116)
Gross profit 228,523 193,133 76,168 92,695
General and administrative expenses (85,347) (66,872) (23,910) (39,887)
Other expenses (13,984) (51,638) (1,886) (26,696)
Other income 46,636 90,744 7,497 12,001
Changes in fair value of investment properties 570,781 189,084 30,829 47,856
Results from operating activities 746,609 354,451 88,698 85,969
Finance income 117,459 62,325 (7,483) 58,002
Finance costs (363,139) (275,200) (80,790) (116,594)
Net finance income / (costs) (245,680) (212,875) (88,273) (58,592)
Net income (losses) from investments in associated companies (47) (1,373) 53 (1,737)
Profit / (loss) before tax 500,882 140,203 478 25,640
Income tax benefit (expenses) (121,361) (42,566) (9,179) (13,693)
Profit / (loss) for the period 379,521 97,637 (8,701) 11,947
Profit attributable to:
Owners of the Company 334,670 61,946 8,967 4,705
Non-controlling interests 44,851 35,691 (17,668) 7,242
Profit / (loss) for the period 379,521 97,637 (8,701) 11,947
Earnings per share in EUR (undiluted) 2.85 0.88 0.08 0.05
Earnings per share in EUR (diluted) 2.78 0.88 0.08 0.05
(*) Prior period’s revenue (EUR -29.5 million), cost of sales (EUR -27.3 million) and profit (EUR -2.2 million) retrospectively restated according to IFRS 3.45. Refer to Note 5 Annual Report 2020.
Condensed ConsolidatedInterim Statement ofProfit or Loss
3 CONDENSED CONSOLIDATED INTERIM FINANCIAL STATEMENTS Condensed Consolidated Interim Statement of Comprehensive Income
3 CONDENSED CONSOLIDATED INTERIM FINANCIAL STATEMENTS Condensed Consolidated Interim Statement of Profit or Loss

Adler Group Q3 2021 Quarterly Financial Statements Adler Group Q3 2021 Quarterly Financial Statements62 63
Condensed Consolidated Interim Statement of Cash Flows
For the nine months ended 30 September
For the three months ended 30 September
In EUR thousand 2021 2020(*) 2021 2020(*)
Cash flows from operating activities
Profit / (loss) for the period 379,521 97,637 (8,701) 11,947
Adjustments for:
Depreciation 11,098 6,922 3,694 4,129
Change in fair value of investment properties (570,781) (189,084) (30,829) (47,856)
Non-cash other income and expense (3,683) (54,769) (6,455) 20,019
Change in contract assets 24,419 (70,139) 17,731 (70,139)
Non-cash income from at-equity valued investment associates 47 1,373 (53) 1,737
Change in contract liabilities (24,817) (4,187) 2,169 (4,187)
Net finance costs / (income) 245,680 212,875 88,273 58,592
Income tax expense 121,361 42,566 9,179 13,693
Share-based payments 567 358 189 131
Change in short-term restricted bank deposits related to tenants 488 (44,203) 935 (23,539)
Change in long-term restricted bank deposits from condominium sales 2,171 (620) 646 (220)
Change in trade receivables 31,135 30,043 (6,478) 397,058
Change in other receivables 63,431 52,181 (16,191) 47,732
Change in inventories (257,786) 48,543 3,084 43,549
Change in advances received (64,210) (22,995) 2,314 (22,995)
Change in advances on development projects - 48,757 - 48,757
Change in trade payables 3,040 (55,501) 4,506 (425,811)
Change in other payables 60,466 96,621 (9,431) 119,868
Income tax paid (19,646) (4,328) (12,442) (3,727)
Net cash from operating activities 2,501 192,050 42,140 168,738
Cash flows from investing activities
Purchase of and CAPEX on investment properties (221,765) (239,025) (81,609) (183,752)
Advances paid for purchase of investment properties (188) 6,300 (188) -
Grant of long-term loans (3,704) (103,547) - (60,005)
Proceeds from disposals of investment properties 189,638 38,129 24,108 107
Investments in financial instruments (171,590) (40,159) (68,075) 49,026
For the nine months ended 30 September
For the three months ended 30 September
In EUR thousand 2021 2020(*) 2021 2020(*)
Proceeds from sale of financial instruments 53,835 11,058 14,849 11,058
Purchase of and CAPEX on property, plant and equipment (2,765) (1,969) (1,174) (1,196)
Interest received 5,680 2,473 2,845 2,455
Proceeds from sale of fixed assets 698 17 - 17
Acquisition of subsidiaries, net of acquired cash 1,114 (64,235) 1,114 -
Change in short-term restricted bank deposits, net 4,666 (601) (284) 7
Net cash from (used in) investing activities (144,381) (391,559) (108,414) (182,283)
Cash flows from financing activities
Acquisition of non-controlling interests (78,461) (20,220) (18,000) (13,962)
Issuance of ordinary shares - 457,338 - 457,338
Repayment of bonds (870,699) (16,419) (91,119) (836)
Long-term loans received 832,611 1,376,821 258,634 53,631
Repayment of long-term loans (1,618,045) (1,895,956) (262,503) (613,062)
Proceeds from issuance of corporate bonds, net 1,951,053 390,601 - 390,601
Short-term loans received 314,999 175,522 314,999 522
Upfront fees paid for credit facilities (1,361) (217) (322) -
Dividend distributed (54,054) - (54,054) -
Repayment of short-term loans (55,387) (284,703) (619) (284,703)
Interest paid (216,609) (115,703) (49,332) (76,583)
Payment of lease liabilities (7,072) (4,277) (2,324) (2,794)
Tax payments (15,994) - (634) -
Transaction costs (13,496) (25,137) (2,011) (18,481)
Prepaid costs of raising debt (1,235) (26,477) (371) (80)
Net cash from (used in) financing activities 166,250 11,173 92,344 (108,409)
Change in cash and cash equivalents during the period 24,370 (188,336) 26,070 (121,954)
Net cash and cash equivalents acquired as a result of business combination - 178,379 - 103,284
Cash and cash equivalents at the beginning of the period 371,574 387,558 369,874 396,271
Cash and cash equivalents at the end of the period 395,944 377,601 395,944 377,601
(*) Prior period’s profit (EUR -2.2 million) retrospectively restated according to IFRS 3.45. Refer to Note 5 Annual Report 2020.
3 CONDENSED CONSOLIDATED INTERIM FINANCIAL STATEMENTS Condensed Consolidated Interim Statement of Cash Flows
3 CONDENSED CONSOLIDATED INTERIM FINANCIAL STATEMENTS Condensed Consolidated Interim Statement of Cash Flows
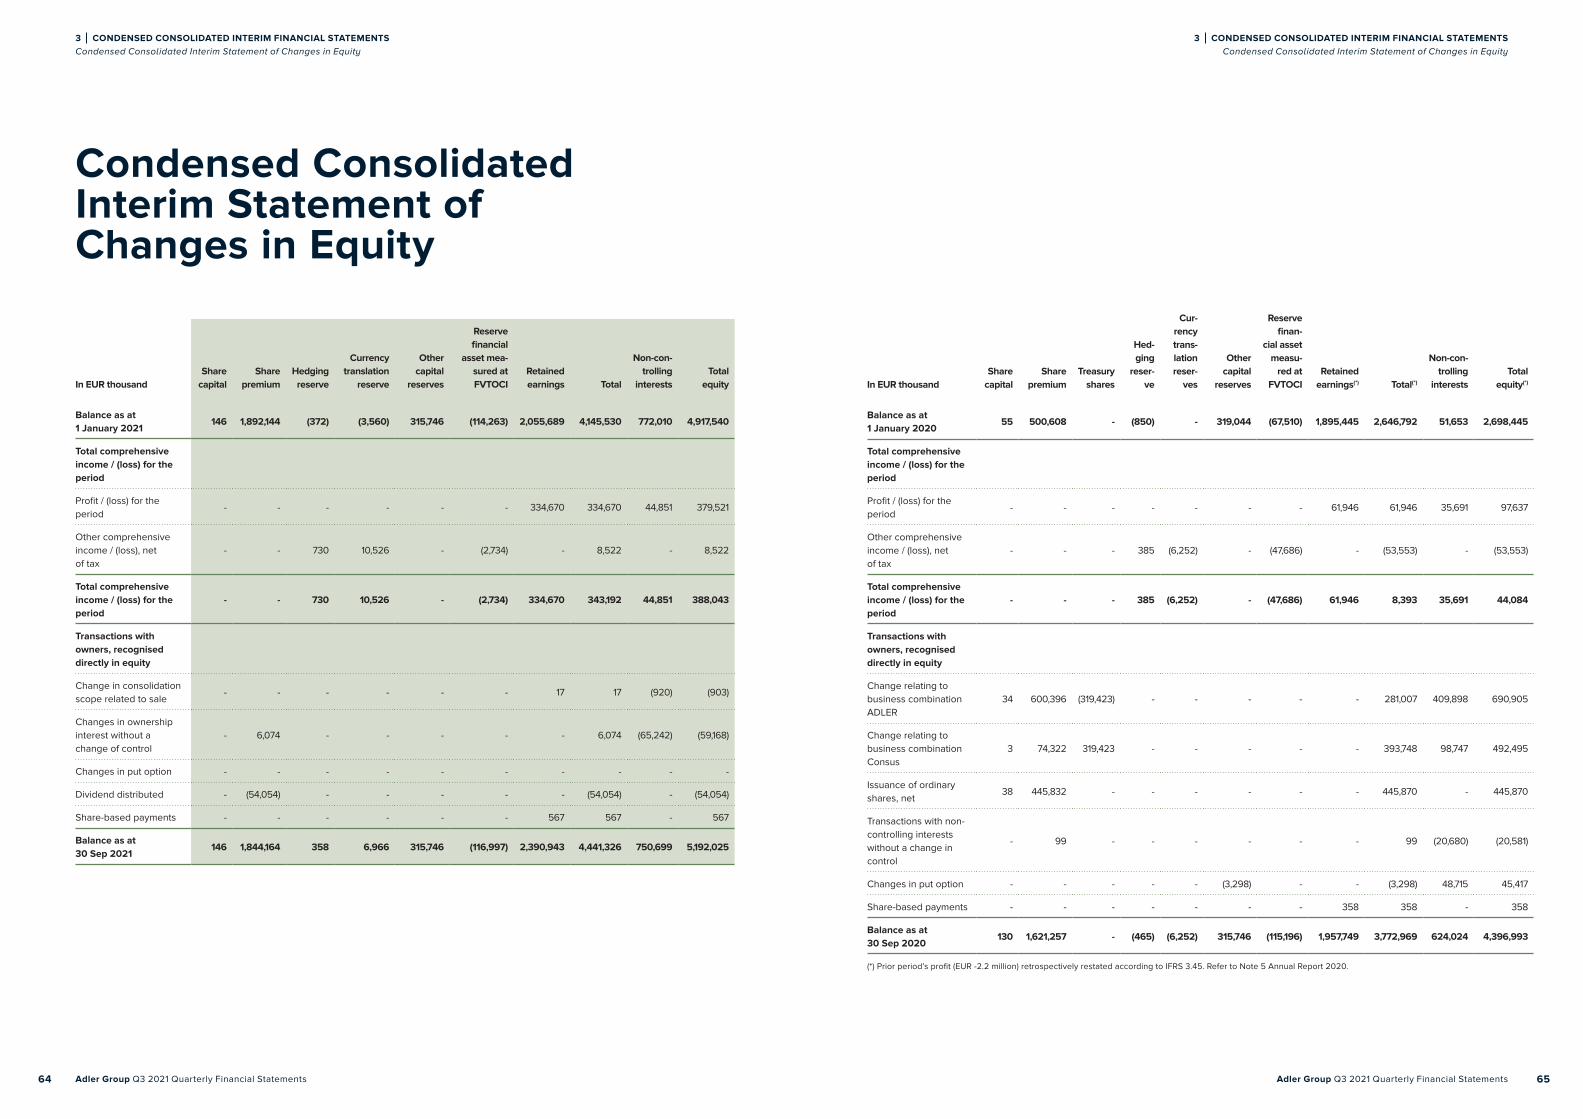
Adler Group Q3 2021 Quarterly Financial Statements Adler Group Q3 2021 Quarterly Financial Statements64 65
Condensed ConsolidatedInterim Statement ofChanges in Equity
In EUR thousand Share capital
Share premium
Hedging reserve
Currency translation
reserve
Other capital
reserves
Reserve financial
asset mea-sured at FVTOCI
Retained earnings Total
Non-con-trolling
interestsTotal
equity
Balance as at 1 January 2021
146 1,892,144 (372) (3,560) 315,746 (114,263) 2,055,689 4,145,530 772,010 4,917,540
Total comprehensive income / (loss) for the period
Profit / (loss) for the period
- - - - - - 334,670 334,670 44,851 379,521
Other comprehensive income / (loss), net of tax
- - 730 10,526 - (2,734) - 8,522 - 8,522
Total comprehensive income / (loss) for the period
- - 730 10,526 - (2,734) 334,670 343,192 44,851 388,043
Transactions with owners, recognised directly in equity
Change in consolidation scope related to sale
- - - - - - 17 17 (920) (903)
Changes in ownership interest without a change of control
- 6,074 - - - - - 6,074 (65,242) (59,168)
Changes in put option - - - - - - - - - -
Dividend distributed - (54,054) - - - - - (54,054) - (54,054)
Share-based payments - - - - - - 567 567 - 567
Balance as at 30 Sep 2021
146 1,844,164 358 6,966 315,746 (116,997) 2,390,943 4,441,326 750,699 5,192,025
In EUR thousand Share capital
Share premium
Treasury shares
Hed-ging
reser-ve
Cur-rency trans-lation reser-
ves
Other capital
reserves
Reserve finan-
cial asset measu-
red at FVTOCI
Retained earnings(*) Total(*)
Non-con-trolling
interestsTotal
equity(*)
Balance as at 1 January 2020
55 500,608 - (850) - 319,044 (67,510) 1,895,445 2,646,792 51,653 2,698,445
Total comprehensive income / (loss) for the period
Profit / (loss) for the period
- - - - - - - 61,946 61,946 35,691 97,637
Other comprehensive income / (loss), net of tax
- - - 385 (6,252) - (47,686) - (53,553) - (53,553)
Total comprehensive income / (loss) for the period
- - - 385 (6,252) - (47,686) 61,946 8,393 35,691 44,084
Transactions with owners, recognised directly in equity
Change relating to business combination ADLER
34 600,396 (319,423) - - - - - 281,007 409,898 690,905
Change relating to business combination Consus
3 74,322 319,423 - - - - - 393,748 98,747 492,495
Issuance of ordinary shares, net
38 445,832 - - - - - - 445,870 - 445,870
Transactions with non-controlling interests without a change in control
- 99 - - - - - - 99 (20,680) (20,581)
Changes in put option - - - - - (3,298) - - (3,298) 48,715 45,417
Share-based payments - - - - - - - 358 358 - 358
Balance as at 30 Sep 2020
130 1,621,257 - (465) (6,252) 315,746 (115,196) 1,957,749 3,772,969 624,024 4,396,993
(*) Prior period’s profit (EUR -2.2 million) retrospectively restated according to IFRS 3.45. Refer to Note 5 Annual Report 2020.
3 CONDENSED CONSOLIDATED INTERIM FINANCIAL STATEMENTS Condensed Consolidated Interim Statement of Changes in Equity
3 CONDENSED CONSOLIDATED INTERIM FINANCIAL STATEMENTS Condensed Consolidated Interim Statement of Changes in Equity

4 FINANCIAL CALENDAR & IMPRINT
Adler Group Q3 2021 Quarterly Financial Statements Adler Group Q3 2021 Quarterly Financial Statements66 67
FinancialCalendar 2022
Imprint
Coordination:
Investor Relations Adler Group S.A.
Concept, Design & Artwork:
brandcooks GmbH by UPWIRE Group
Hamburg, Zurich, Cape Town
Felix Ernesti
Art Director & Graphic Designer, Berlin
The Company‘s quarterly financial statements are
published in English and German. In case of conflicts,
the English version shall always prevail. Both versions
of the quarterly financial statements can be found on
the website at:
www.adler-group.com
Online Financial Calender
www.adler-group.com
Adler Group S.A. publication dates 2022
31 March 2022 Publication Annual Report 2021
31 May 2022 Publication Q1 2022 Results
31 August 2022 Publication Q2 2022 Results
30 November 2022 Publication Q3 2022 Results
QU
AR
TER
LY F
INA
NC
IAL
STA
TEM
ENTS
20
21
Adler Group S.A.
1B Heienhaff
1736 Senningerberg
Grand Duchy of Luxembourg
www.adler-group.com