Q3 CTU Quarterly Report eng v1 - LE CHÂTEAU...On behalf of the Board of Directors, I am pleased to...
16
QUARTERLY REPORT FOR THE NINE MONTHS ENDED OCTOBER 25, 2008
Transcript of Q3 CTU Quarterly Report eng v1 - LE CHÂTEAU...On behalf of the Board of Directors, I am pleased to...

QuaRteRly RepoRtfoR the nine months ended octobeR 25, 2008

1
MESSAGE TO SHAREHOLDERS On behalf of the Board of Directors, I am pleased to provide the results of Le Château Inc. for the third quarter ended October 25, 2008. Net earnings for the third quarter increased 2.0% to $10.0 million from $9.8 million for the same period in the prior year. Earnings per share for the third quarter increased to $0.40 per share from $0.39 per share for the same period in the previous year. Sales increased 2.1% to $83.8 million for the third quarter ended October 25, 2008 as compared with sales of $82.1 million for the third quarter ended October 27, 2007. Comparable store sales decreased by 1.5% in the third quarter of 2008 compared with the same period a year ago. At the Board of Directors meeting held December 4, 2008, a quarterly cash dividend of $0.175 per share was declared on the Class A subordinate voting and Class B voting shares outstanding. The dividend is payable on February 17, 2009 to shareholders of record at the close of business on January 30, 2009. I wish to thank our employees, customers, suppliers and our shareholders for their continued support. (signed) Jane Silverstone Segal, B.A.LLL Chairman of the Board and Chief Executive Officer December 4, 2008

2
MANAGEMENT’S DISCUSSION AND ANALYSIS Management’s Discussion and Analysis (“MD&A”) should be read in conjunction with the unaudited interim consolidated financial statements for the nine months ended October 25, 2008 and the audited consolidated financial statements and MD&A for the year ended January 26, 2008. All amounts in the MD&A from prior periods have been restated as a result of a change in the accounting policy affecting inventory, as disclosed below. The risks and uncertainties faced by the Company are substantially the same as those outlined in the Company’s 2007 Annual Information Form and in the annual MD&A contained in the 2007 Annual Report. The MD&A has been prepared as at December 4, 2008. Results of Operations Sales increased 2.1% to reach $83.8 million for the third quarter October 25, 2008 as compared with $82.1 million last year. Comparable store sales decreased 1.5% as compared to the same period last year. On a year-to-date basis, sales increased 3.0% to $243.1 million as compared with $236.1 million last year. Comparable store sales decreased 1.5% for the first nine months as compared to last year. Year-to-date, the Company has opened eleven new stores and expanded nine existing locations, resulting in the addition of 72,000 square feet or 7.5% to the Le Château network, bringing the total floor space at end of period to 1,037,000 square feet. As at October 25, 2008, there were 220 stores (including 30 fashion outlets) in operation as compared with 210 stores (including 22 fashion outlets) at the end of the same period last year. Net earnings for the third quarter increased 2.0% to $10.0 million or $0.40 per share from $9.8 million or $0.39 per share for the same period last year. For the nine months ended October 25, 2008, net earnings increased 25.7% to $25.4 million or $1.02 per share compared to $20.2 million or $0.81 per share the previous year, resulting primarily from operating efficiencies and continued improvements in gross margins partially due to the strength in the Canadian dollar. Earnings before interest, income taxes, depreciation and amortization (EBITDA) (see supplementary measures below) for the third quarter increased 2.6% to $19.6 million or 23.4% of sales, compared to $19.1 million or 23.3% of sales last year. EBITDA for the first nine months increased 12.4% to $50.6 million or 20.8% of sales, compared to $45.0 million or 19.1% of sales last year. Liquidity and Capital Resources Cash flow from operations (see supplementary measures below) amounted to $14.1 million for the third quarter ended October 25, 2008, compared with $13.9 million for the same period last year. On a year-to-date basis, cash flow from operations increased to $36.8 million from $33.2 million the previous year, mainly as a result of higher net earnings before depreciation reported for the period. The Company continues to be in a strong financial position with cash, cash equivalents and short-term investments of $59.0 million at the end of the third quarter as compared with $47.5 million at the end of the same period last year. Short-term cash is conservatively invested in bank bearer deposit notes and bank term deposits with major Canadian chartered banks. The Company closely monitors its short-term cash investments and does not hold any asset backed commercial paper. Capital expenditures for the third quarter amounted to $4.6 million, compared to $4.9 million for the same period last year. Capital expenditures for the first nine months of 2008 totalled $19.9 million compared to $21.2 million for the same period last year and related primarily to the opening of eleven new stores and the renovation and/or expansion of existing stores. Capital expenditures were financed with cash and cash equivalents as well as long-term debt financing of $18.0 million drawn upon in the first quarter. Financial Position Working capital stood at $78.4 million at the end of the third quarter of 2008, compared to $63.9 million as at October 27, 2007 and $74.4 million as at January 26, 2008. The increase in working capital at the end of the third quarter is the result of improvements in operating efficiencies and the increase in fair value of the derivative financial instruments. Inventories increased 4.8% to $57.2 million at the end of the third quarter, from $54.6 million a year earlier, due to an increase of 7.6% in retail square footage when compared to the same period last year.

3
MANAGEMENT’S DISCUSSION AND ANALYSIS (continued) Financial Position (continued) Long-term debt and capital lease obligations, including the current portions, amounted to $31.6 million as at October 25, 2008, compared with $24.4 million as at October 27, 2007, after the additional long-term financing of $18.0 million obtained during the first quarter of 2008. The long-term debt to equity ratio increased slightly to 0.23:1 as at October 25, 2008 from 0.20:1 the previous year. Dividends On September 8, 2008, the Board of Directors declared a quarterly dividend of $0.175 per Class A subordinate voting share and Class B voting share, representing an increase of 16.7% from the previous dividend rate of $0.15 per share. The dividend was paid on November 10, 2008 to shareholders of record at the close of business on October 24, 2008. On December 4, 2008, the Board of Directors declared a quarterly dividend of $0.175 per Class A subordinate voting share and Class B voting share. The dividend is payable on February 17, 2009 to shareholders of record at the close of business on January 30, 2009. This represents the 61st consecutive quarterly dividend declared by Le Château. The Company designated the above dividends to be eligible dividends pursuant to the Income Tax Act (Canada) and its provincial equivalents. Share Capital As at December 4, 2008, there are 19,836,764 Class A subordinate voting and 4,560,000 Class B voting shares outstanding. Further, there are 1,172,800 stock options outstanding with exercise prices ranging from $7.56 to $15.14, of which 292,640 are exercisable. On September 16, 2008, the principal shareholder of the Company converted 2,000,000 Class B voting shares with a paid-up capital of $176,153 into Class A subordinate voting shares. The Company announced on June 5, 2008 that it intended to proceed with a normal course issuer bid which was subsequently approved by the Toronto Stock Exchange. Under the bid, the Company may purchase up to 925,148 Class A subordinate voting shares of the Company, representing 5% of the issued shares of such class as at June 5, 2008. The bid commenced on June 19, 2008 and may continue to June 18, 2009. The average daily trading volume for the 6-month period preceding June 1, 2008 was 27,359 shares. In accordance with TSX requirements, a maximum daily repurchase of 25% of this average may be made, representing 6,839 shares. The TSX has temporarily (from November 3, 2008 until March 31, 2009 unless extended) increased the daily limit on purchases under normal course issuer bids from 25% of the average daily trading volume to 50%. The shares will be purchased on behalf of the Company by a registered broker through the facilities of the Toronto Stock Exchange. The price paid for the shares will be the market price at the time of acquisition, and the number of shares purchased and the timing of any such purchases will be determined by the Company. All shares purchased by the Company will be cancelled. Since June 19, 2008, the Company purchased 747,400 Class A subordinate voting shares at an average price of $12.35 per share for a total of $9.2 million. The directors of the Company have concluded that purchases of up to 925,148 of the issued and outstanding Class A subordinate voting shares are an appropriate and desirable use of the Company's available funds and, therefore, would be in the best interests of the Company. As a result of such purchases, the number of issued shares will be decreased and, consequently, the proportionate share interest of all remaining shareholders will be increased on a pro rata basis. Accounting Policies Critical Accounting Estimates: The Company’s critical accounting estimates are substantially the same as those disclosed in the Management’s Discussion and Analysis section of its 2007 Annual Report. Accounting Standards Implemented in 2008: On January 27, 2008, the Company adopted the recommendations of the following Sections of the Canadian Institute of Chartered Accountants (“CICA”) Handbook:
4
MANAGEMENT’S DISCUSSION AND ANALYSIS (continued) Accounting Policies (continued) Section 3031, Inventory, was developed based on International Financial Reporting Standards (“IFRS”). The standard was revised to provide more extensive guidance than Section 3030, to facilitate the CICA’s move towards IFRS, and to reduce the number of alternatives for the measurement of inventories. Section 3031 requires inventories to be measured at the lower of cost and net realizable value. The Company previously valued its inventory at the lower of average cost and net realizable value less a normal profit margin, using the retail inventory method. The Company has adopted this new standard retrospectively, with restatement of prior period amounts. The initial impact of measuring the inventories under the new standard was an increase to the carrying amount of opening inventories as at January 27, 2008 of $2.9 million ($4.4 million as at January 28, 2007). Opening retained earnings as at January 27, 2008 have been increased by $2.0 million, equal to the change in opening inventories net of tax of $927,000. For the previous year, opening retained earnings as at January 28, 2007 have been increased by $3.0 million, equal to the change in opening inventories net of tax of $1.4 million. The adoption of the new standard resulted in an increase in net earnings for the third quarter ended October 25, 2008 of $631,000 or $0.02 per share. The carrying amount of inventories as at October 25, 2008 increased by $1.8 million to $57.2 million. As a result of the restatement, net earnings for the third quarter ended October 27, 2007 decreased by $146,000 or $0.01 per share. The carrying amount of inventories as at October 27, 2007 increased by $2.7 million to $54.6 million. On a year-to-date basis, the adoption of the new standard resulted in a reduction of net earnings for the nine months ended October 25, 2008 of $762,000 or $0.03 per share (2007 - $1.1 million or $0.05 per share). The cost of inventory recognized as an expense and included in cost of sales and selling, general and administrative expenses for the three and nine-month periods ended October 25, 2008 is $24.4 million and $75.3 million, respectively. Section 1535, Capital Disclosures, establishes guidelines for disclosure of both qualitative and quantitative information that enables users of financial statements to evaluate the entity’s objectives, policies and processes for managing capital. Section 3862, Financial Instruments – Disclosures, describes the required disclosure for the assessment of the significance of financial instruments for an entity’s financial position and performance and of the nature and extent of risks arising from financial instruments to which the entity is exposed and how the entity manages those risks. Section 3863, Financial Instruments – Presentation, establishes standards for presentation of the financial instruments and non-financial derivatives. It carries forward the presentation related requirements of Section 3861, Financial Instruments – Disclosure and Presentation. Section 1400, General Standards of Financial Statement Presentation, has been amended to include requirements to assess and disclose an entity’s ability to continue as a going concern. The adoption of this section had no impact on the Company’s interim financial statements. The Company refers the reader to note 2 to the unaudited interim consolidated financial statements for the third quarter ended October 25, 2008, for further details regarding the adoption of these standards. Recently Issued Accounting Standards: International Financial Reporting Standards The CICA plans to converge Canadian GAAP with IFRS over a transition period ending in 2011. The Company is reviewing the transition to IFRS on its financial statements and has not yet determined the impact. Supplementary Measures In addition to discussing earnings measures in accordance with Canadian generally accepted accounting principles (“GAAP”), this MD&A provides EBITDA as a supplementary earnings measure. Depreciation and amortization include the write-off of fixed assets. EBITDA is provided to assist readers in determining the ability of the Company to generate cash from operations and to cover financial charges. It is also widely used for valuation purposes for public companies in our industry.

5
MANAGEMENT’S DISCUSSION AND ANALYSIS (continued) Supplementary Measures (continued) The following table reconciles EBITDA to GAAP measures disclosed in the unaudited interim consolidated statements of earnings for the three and nine-month periods ended October 25, 2008 and October 27, 2007 For the three months ended For the nine months ended (in thousands of dollars) October 25, 2008 October 27, 2007 October 25, 2008 October 27, 2007 Earnings before income taxes $ 15,338 $ 14,906 $ 38,354 $ 31,497 Depreciation and amortization 4,267 4,257 12,472 12,226 Write-off of fixed assets 11 - 184 1,597 Interest on long-term debt and capital lease obligations 444 372 1,372 1,105 Interest income (484) (455) (1,794) (1,387) EBITDA $ 19,576 $ 19,080 $ 50,588 $ 45,038 This MD&A also discloses cash flow from operations as a supplementary measure. Cash flow from operations is defined as cash flow from operating activities before the net change in non-cash working capital items related to operations and deferred lease inducements. This measure provides an indication of the Company’s ability to generate cash flows without considering certain timing and other factors causing variations in non-cash items. The Company also discloses comparable store sales which are defined as sales generated by stores that have been opened for at least one year. The above measures do not have a standardized meaning prescribed by GAAP and may not be comparable to similar measures presented by other companies. Summary of Quarterly Results Earnings before Net Earnings per Share (in thousands of dollars, except per share amounts) Sales Income Taxes Earnings Basic Diluted Third quarter ended October 25, 2008 $ 83,763 $ 15,338 $ 9,988 $ 0.40 $ 0.40 Second quarter ended July, 26 2008 88,680 14,536 9,821 0.39 0.39 First quarter ended April 26, 2008 70,616 8,480 5,645 0.23 0.22 Fourth quarter ended January 26, 2008 (*) 99,973 19,026 12,858 0.34 0.34 Third quarter ended October 27, 2007 (*) 82,103 14,906 9,751 0.39 0.38 Second quarter ended July 28, 2007 (*) 83,609 10,099 6,305 0.25 0.25 First quarter ended April 28, 2007 (*) 70,385 6,492 4,181 0.17 0.17 Fourth quarter ended January 27, 2007 92,959 12,858 8,248 0.34 0.33 (*) Restated to reflect the change in the accounting policy affecting inventories as described in note 2 to the unaudited interim consolidated financial statements. The Company’s business is seasonal in nature. As the Company executes its strategy of broadening its customer base, the Company expects that its business will become less seasonal. However, retail sales are traditionally higher in the fourth quarter due to the holiday season. In addition, fourth quarter earnings results are usually reduced by post holiday sale promotions. Internal Control over Financial Reporting Internal control over financial reporting (“ICFR”) is designed to provide reasonable assurance regarding the reliability of the Company’s financial reporting and its compliance with GAAP in its financial statements. The Chief Executive Officer and Chief Financial Officer have evaluated whether there were changes to its ICFR during the three and nine-month periods ended October 25, 2008 that have materially affected, or are reasonably likely to materially affect, the ICFR. No such changes were identified through their evaluation.

6
MANAGEMENT’S DISCUSSION AND ANALYSIS (continued) Forward-looking Statements This “Management’s Discussion and Analysis” may contain forward-looking statements relating to the Company and/or the environment in which it operates that are based on the Company's expectations, estimates and forecasts. These statements are not guarantees of future performance and involve risks and uncertainties that are difficult to predict and/or are beyond the Company's control. A number of factors may cause actual outcomes and results to differ materially from those expressed. These factors include those set forth in other public filings of the Company. Therefore, readers should not place undue reliance on these forward-looking statements. In addition, these forward-looking statements speak only as of the date made and the Company disavows any intention or obligation to update or revise any such statements as a result of any event, circumstance or otherwise. Factors which could cause actual results or events to differ materially from current expectations include, among other things: the ability of the Company to successfully implement its business initiatives and whether such business initiatives will yield the expected benefits; competitive conditions in the businesses in which the Company participates; changes in consumer spending; general economic conditions and normal business uncertainty; customer preferences towards product offerings; seasonal weather patterns; fluctuations in foreign currency exchange rates; changes in the Company’s relationship with its suppliers; interest rate fluctuations and other changes in borrowing costs; and changes in laws, rules and regulations applicable to the Company.

7
FINANCIAL HIGHLIGHTS (Unaudited) October 25, 2008 October 27, 2007 (In units except where otherwise stated) (restated – note 2)
Working capital ($’000) $ 78,411 $ 63,897 Current ratio 2.63 2.42 Quick ratio 1.44 1.21 Long-term debt * to equity 0.23 0.20 Capital expenditures ($’000) $ 19,856 $ 21,156 Number of stores at end of quarter 220 210 Total number of square feet (‘000) 1,037 964 Book value per share $ 5.62 $ 4.91 * Including capital lease obligations. CONSOLIDATED BALANCE SHEETS As at As at As at (Unaudited) October 25, 2008 October 27, 2007 January 26, 2008 (In thousands of dollars) (restated – note 2 ) (restated – note 2) ASSETS Current Cash and cash equivalents $ 2,405 $ 11,144 $ 3,846 Short-term investments (note 3) 56,643 36,322 66,354 Accounts receivable, prepaid expenses and other assets 5,202 6,796 6,307 Derivative financial instruments 5,060 - - Inventories (note 4) 57,233 54,644 45,903 Total current assets 126,543 108,906 122,410 Fixed assets 91,666 85,976 84,466 $ 218,209 $ 194,882 $ 206,876 LIABILITIES AND SHAREHOLDERS' EQUITY Current Accounts payable and accrued liabilities $ 30,681 $ 29,490 $ 30,377 Dividend payable 4,278 3,128 3,133 Income taxes payable 824 1,747 5,092 Derivative financial instruments - 944 - Current portion of capital lease obligations 1,443 1,403 1,384 Current portion of long-term debt (note 5) 9,297 7,437 7,113 Future income taxes 1,609 860 927 Total current liabilities 48,132 45,009 48,026 Capital lease obligations - 1,335 1,008 Long-term debt (note 5) 20,863 14,228 12,689 Future income taxes 2,891 2,573 2,975 Deferred lease inducements 9,316 8,870 8,573 Total liabilities 81,202 72,015 73,271 Shareholders' Equity Capital stock (note 6) 31,266 31,383 31,794 Contributed surplus (note 6) 2,270 1,451 1,761 Retained earnings 100,020 90,659 99,884 Accumulated other comprehensive income (note 7) 3,451 (626) 166 Total shareholders' equity 137,007 122,867 133,605 $ 218,209 $ 194,882 $ 206,876

8
CONSOLIDATED STATEMENTS OF RETAINED EARNINGS For the three months ended For the nine months ended (Unaudited) October 25, 2008 October 27, 2007 October 25, 2008 October 27, 2007 (In thousands of dollars) (restated – note 2) (restated – note 2) Balance, beginning of period – as previously reported $ 99,373 $ 82,057 $ 97,914 $ 76,814 Adjustment to opening retained earnings resulting from adoption of new accounting standard for inventories, net of income taxes of $927 (2007 – 3 month period $929; 2007 – 9 month period $1,400) - 1,979 1,970 2,978 Excess of cost over stated value of Class A subordinate voting shares purchased and cancelled (5,063) - (7,955) - Net earnings 9,988 9,751 25,454 20,237 104,298 93,787 117,383 100,029 Dividends declared 4,278 3,128 17,363 9,370 Balance, end of period $ 100,020 $ 90,659 $ 100,020 $ 90,659 CONSOLIDATED STATEMENTS OF EARNINGS
For the three months ended For the nine months ended (Unaudited) October 25, 2008 October 27, 2007 October 25, 2008 October 27, 2007 (In thousands of dollars, except per share data) (restated – note 2) (restated – note 2) Sales $ 83,763 $ 82,103 $ 243,059 $ 236,097 Cost of sales and expenses Cost of sales and selling, general and administrative (note 2) 64,187 63,023 192,471 191,059 Depreciation and amortization 4,267 4,257 12,472 12,226 Write-off of fixed assets 11 - 184 1,597 Interest on long-term debt and capital lease obligations 444 372 1,372 1,105 Interest income (484) (455) (1,794) (1,387) 68,425 67,197 204,705 204,600 Earnings before income taxes 15,338 14,906 38,354 31,497 Provision for income taxes 5,350 5,155 12,900 11,260 Net earnings $ 9,988 $ 9,751 $ 25,454 $ 20,237 Net earnings per share (note 8)
Basic $ 0.40 $ 0.39 $ 1.02 $ 0.81 Diluted 0.40 0.38 1.01 0.80
Weighted average number of shares outstanding (‘000) 24,752 25,025 24,954 24,959 CONSOLIDATED STATEMENTS OF COMPREHENSIVE INCOME
For the three months ended For the nine months ended (Unaudited) October 25, 2008 October 27, 2007 October 25, 2008 October 27, 2007 (In thousands of dollars) (restated – note 2) (restated – note 2) Net earnings $ 9,988 $ 9,751 $ 25,454 $ 20,237 Other comprehensive income Change in fair value of forward exchange contracts 4,962 234 5,454 (944) Realized forward exchange contracts reclassified to net earnings (242) (583) (644) (320) Income tax (expense) recovery (1,501) 117 (1,525) 426 3,219 (232) 3,285 (838) Comprehensive income $ 13,207 $ 9,519 $ 28,739 $ 19,399

9
CONSOLIDATED STATEMENTS OF CASH FLOWS
For the three months ended For the nine months ended (Unaudited) October 25, 2008 October 27, 2007 October 25, 2008 October 27, 2007 (In thousands of dollars) (restated - note 2) (restated - note 2) OPERATING ACTIVITIES Net earnings $ 9,988 $ 9,751 $ 25,454 $ 20,237 Adjustments to determine net cash from operating activities
Depreciation and amortization 4,267 4,257 12,472 12,226 Write-off of fixed assets 11 - 184 1,597 Amortization of deferred lease inducements (372) (311) (1,056) (751) Stock-based compensation 193 268 646 466 Future income taxes - (70) (927) (540)
14,087 13,895 36,773 33,235 Net change in non-cash working capital
items related to operations (5,923) (3,497) (14,439) (14,104) Deferred lease inducements 373 2,544 1,799 4,337 Cash flows related to operating activities 8,537 12,942 24,133 23,468 FINANCING ACTIVITIES Repayment of capital lease obligations (321) (418) (949) (1,601) Proceeds of long-term debt - - 18,000 16,344 Repayment of long-term debt (2,507) (1,710) (7,642) (5,005) Issue of capital stock upon exercise of options 212 - 614 - Purchase of Class A subordinate voting shares for cancellation (6,239) - (9,234) 1,008 Dividends paid (9,952) (3,128) (16,218) (27,234) Cash flows related to financing activities (18,807) (5,256) (15,429) (16,488) INVESTING ACTIVITIES Decrease (increase) in short-term investments (2,915) (3,409) 9,711 22,577 Additions to fixed assets (4,626) (4,946) (19,856) (21,156) Cash flows related to investing activities (7,541) (8,355) (10,145) 1,421 Increase (decrease) in cash and cash equivalents (17,811) (669) (1,441) 8,401 Cash and cash equivalents, beginning of period 20,216 11,813 3,846 2,743 Cash and cash equivalents, end of period $ 2,405 $ 11,144 $ 2,405 $ 11,144 Supplementary information: Interest paid during the period $ 444 $ 372 $ 1,372 $ 1,105 Income taxes paid during the period 4,652 3,189 17,803 10,878

10
NOTES TO THE INTERIM CONSOLIDATED FINANCIAL STATEMENTS (Unaudited –Tabular figures in thousands of dollars except share information) 1. Disclosure
The unaudited interim consolidated financial statements (the “financial statements”) have been prepared in accordance with
Canadian generally accepted accounting principles with the exception that they do not include all disclosure required for annual financial statements. The financial statements should be read in conjunction with the audited annual consolidated financial statements and related notes contained in the Company’s 2007 Annual Report.
The Company’s business is seasonal in nature. As the Company executes its strategy of broadening its customer base, the
Company expects that its business will become less seasonal. However, retail sales are traditionally higher in the fourth quarter due to the holiday season. In addition, fourth quarter earnings results are usually reduced by post holiday sale promotions.
2. Accounting policies
Changes in accounting policies
These financial statements follow the same accounting policies and methods of their application as the most recent annual
financial statements for the 52-week period ended January 26, 2008, except as noted below: On January 27, 2008, the Company adopted the following new accounting standards issued by the Canadian Institute of
Chartered Accountants (“CICA”): Section 3031, Inventory, was issued by the CICA in June 2007, which replaces Section 3030, Inventory. The new standard was
developed based on International Financial Reporting Standards (“IFRS”). The standard was revised to provide more extensive guidance than Section 3030, to facilitate the CICA’s move towards IFRS, and to reduce the number of alternatives for the measurement of inventories. Section 3031 requires inventories to be measured at the lower of cost and net realizable value. The Company values inventory at the lower of average cost and net realizable value. The Company previously valued its inventory at the lower of average cost and net realizable value less a normal profit margin, using the retail inventory method.
The Company has adopted this new standard retrospectively, with restatement of prior period amounts. The initial impact of
measuring the inventories under the new standard was an increase to the carrying amount of opening inventories as at January 27, 2008 of $2.9 million ($4.4 million as at January 28, 2007). Opening retained earnings as at January 27, 2008 have been increased by $2.0 million, equal to the change in opening inventories net of tax of $927,000. For the previous year, opening retained earnings as at January 28, 2007 have been increased by $3.0 million, equal to the change in opening inventories net of tax of $1.4 million.
The adoption of the new standard resulted in an increase in net earnings for the third quarter ended October 25, 2008 of $631,000 or $0.02 per share. The carrying amount of inventories as at October 25, 2008 increased by $1.8 million to $57.2 million. As a result of the restatement, net earnings for the third quarter ended October 27, 2007 decreased by $146,000 or $0.01 per share. The carrying amount of inventories as at October 27, 2007 increased by $2.7 million to $54.6 million. On a year-to-date basis, the adoption of the new standard resulted in a reduction of net earnings for the nine months ended October 25, 2008 of $762,000 or $0.03 per share (2007 - $1.1 million or $0.05 per share). The cost of inventory recognized as an expense and included in cost of sales and selling, general and administrative expenses for the three and nine-month periods ended October 25, 2008 is $24.4 million and $75.3 million, respectively.
Section 1535, Capital Disclosures establishes guidelines for disclosure of both qualitative and quantitative information that enables users of financial statements to evaluate the entity’s objectives, policies and processes for managing capital. The new disclosure is included in note 11.
Section 3862, Financial Instruments – Disclosures and Section 3863, Financial Instruments – Presentation replace Section
3861, Financial Instruments – Disclosure and Presentation to revise and enhance the disclosure requirements, and to carry forward its presentation requirements. These new sections place increased emphasis on disclosures about the nature and extent of risks arising from financial instruments and how the entity manages those risks. The new disclosures are included in note 10.
11
NOTES TO THE INTERIM CONSOLIDATED FINANCIAL STATEMENTS (continued) 2. Accounting policies (continued)
Section 1400, General Standards of Financial Statement Presentation, has been amended to include requirements to assess and disclose an entity’s ability to continue as a going concern. The adoption of this section had no impact on the Company’s interim financial statements.
3. Short-term investments Short-term investments include investments with original maturity terms of 90 days or more. As at October 25, 2008, the
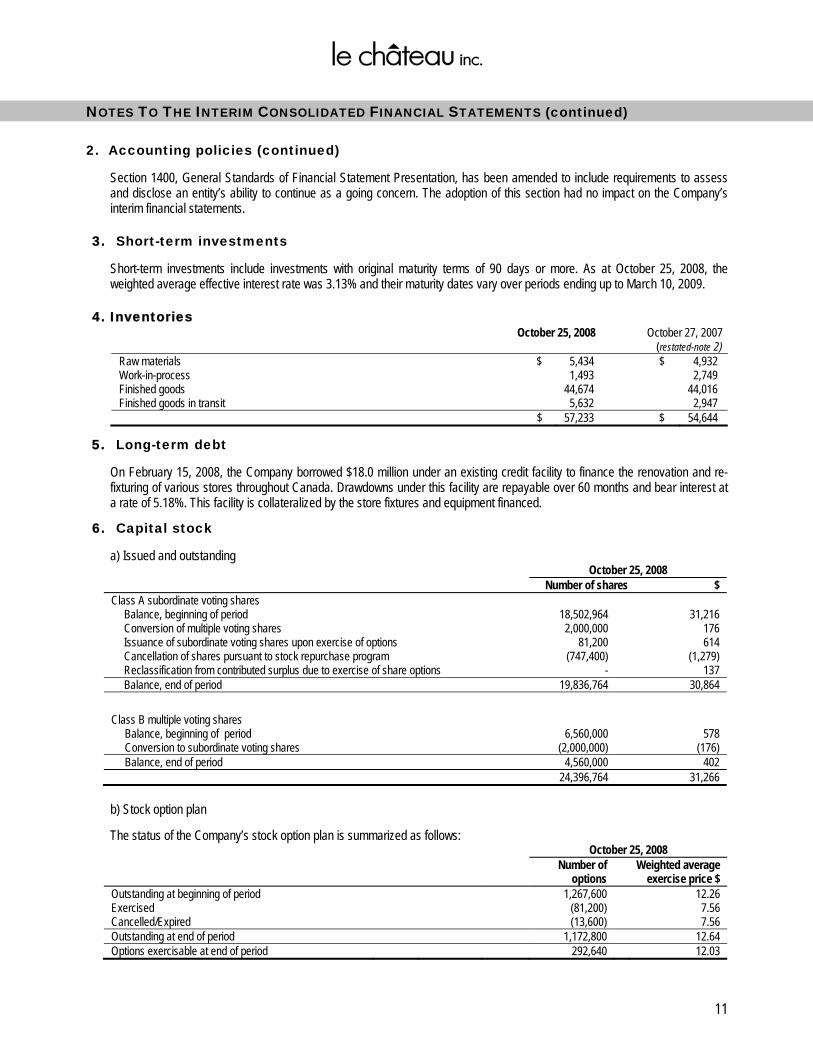
weighted average effective interest rate was 3.13% and their maturity dates vary over periods ending up to March 10, 2009. 4. Inventories
October 25, 2008 October 27, 2007 (restated-note 2)
Raw materials $ 5,434 $ 4,932 Work-in-process 1,493 2,749 Finished goods 44,674 44,016 Finished goods in transit 5,632 2,947 $ 57,233 $ 54,644
5. Long-term debt
On February 15, 2008, the Company borrowed $18.0 million under an existing credit facility to finance the renovation and re-fixturing of various stores throughout Canada. Drawdowns under this facility are repayable over 60 months and bear interest at a rate of 5.18%. This facility is collateralized by the store fixtures and equipment financed.
6. Capital stock
a) Issued and outstanding October 25, 2008
Number of shares $ Class A subordinate voting shares
Balance, beginning of period 18,502,964 31,216 Conversion of multiple voting shares 2,000,000 176 Issuance of subordinate voting shares upon exercise of options 81,200 614 Cancellation of shares pursuant to stock repurchase program (747,400) (1,279) Reclassification from contributed surplus due to exercise of share options - 137 Balance, end of period 19,836,764 30,864
Class B multiple voting shares Balance, beginning of period 6,560,000 578 Conversion to subordinate voting shares (2,000,000) (176) Balance, end of period 4,560,000 402
24,396,764 31,266
b) Stock option plan
The status of the Company’s stock option plan is summarized as follows: October 25, 2008
Number of options
Weighted average exercise price $
Outstanding at beginning of period 1,267,600 12.26 Exercised (81,200) 7.56 Cancelled/Expired (13,600) 7.56 Outstanding at end of period 1,172,800 12.64 Options exercisable at end of period 292,640 12.03

12
NOTES TO THE INTERIM CONSOLIDATED FINANCIAL STATEMENTS (continued) 6. Capital stock (continued)
c) Contributed surplus
The changes in contributed surplus are summarized as follows:
For the three months ended For the nine months ended October 25, 2008 October 27, 2007 October 25, 2008 October 27, 2007 Contributed surplus, beginning of period $ 2,116 $ 1,183 $ 1,761 $ 1,139 Stock-based compensation expense 193 268 646 466 Exercise of share options (39) - (137) (154) Contributed surplus, end of period $ 2,270 $ 1,451 $ 2,270 $ 1,451
d) Normal course issuer bid The Company announced on June 5, 2008 that it intended to proceed with a normal course issuer bid which was subsequently approved by the Toronto Stock Exchange. Under the bid, the Company may purchase up to 925,148 Class A subordinate voting shares of the Company, representing 5% of the issued shares of such class as at June 5, 2008. The bid commenced June 19, 2008 and may continue to June 18, 2009. The average daily trading volume for the 6-month period preceding June 1, 2008 was 27,359 shares. In accordance with TSX requirements, a maximum daily repurchase of 25% of this average may be made, representing 6,839 shares. The TSX has temporarily (from November 3, 2008 until March 31, 2009 unless extended) increased the daily limit on purchases under normal course issuer bids from 25% of the average daily trading volume to 50%. The shares will be purchased on behalf of the Company by a registered broker through the facilities of the Toronto Stock Exchange. The price paid for the shares will be the market price at the time of acquisition, and the number of shares purchased and the timing of any such purchases will be determined by the Company. All shares purchased by the Company will be cancelled. Since June 19, 2008, the Company purchased 747,400 Class A subordinate voting shares at an average price of $12.35 per share for a total of $9.2 million. The excess of the total purchase price over the stated value has been charged to retained earnings in the amount of $8.0 million.
7. Accumulated other comprehensive income
Changes in accumulated other comprehensive income were as follows:
For the three months ended For the nine months ended October 25, 2008 October 27, 2007 October 25, 2008 October 27, 2007 Balance, beginning of period $ 232 $ (394) $ 166 $ 212 Other comprehensive income for the period 3,219 (232) 3,285 (838) Balance, end of period $ 3,451 $ (626) $ 3,451 $ (626)
8. Earnings per share
The numbers of shares used in the earnings per share calculation is as follows:
For the three months ended For the nine months ended October 25, 2008 October 27, 2007 October 25, 2008 October 27, 2007 Weighted average number of shares outstanding - basic 24,751,977 25,025,364 24,953,677 24,958,562 Dilutive effect of stock options 124,619 254,582 147,234 352,749 Weighted average number of shares outstanding - diluted 24,876,596 25,279,946 25,100,911 25,311,311

13
NOTES TO THE INTERIM CONSOLIDATED FINANCIAL STATEMENTS (continued) 9. Segmented information
For the three months ended For the nine months ended October 25, 2008 October 27, 2007 October 25, 2008 October 27, 2007 Sales by country Canada $ 82,396 $ 80,575 $ 238,678 $ 230,590 United States 1,367 1,528 4,381 5,507 $ 83,763 $ 82,103 $ 243,059 $ 236,097 Sales by division Ladies’ Clothing $ 46,535 $ 48,390 $ 137,127 $ 136,618 Men’s Clothing 13,576 12,043 39,385 34,300 Footwear 10,033 9,613 27,843 29,513 Accessories 13,619 12,057 38,704 35,666 $ 83,763 $ 82,103 $ 243,059 $ 236,097 Net earnings (loss) Canada $ 10,165 $ 10,196 $ 25,736 $ 22,323 United States (177) (445) (282) (2,086) $ 9,988 $ 9,751 $ 25,454 $ 20,237 Identifiable assets Canada $ 215,984 $ 192,080 $ 215,984 $ 192,080 United States 2,225 2,802 2,225 2,802 $ 218,209 $ 194,882 $ 218,209 $ 194,882
10. Financial instruments
Financial instrument fair values Financial assets and financial liabilities are measured on an ongoing basis at fair value or amortized cost. The disclosures in the “Financial Instruments – Recognition and Measurement” section of note 1 to the Company’s 2007 consolidated financial statements describe how the categories of financial instruments are measured and how income and expenses, including fair value gains and losses, are recognized. As at October 25, 2008, the classification of the financial instruments, as well as their carrying values and fair values are shown in the table below: Available for
sale $ Held for
trading $ Loans and
receivables $ Other financial
liabilities $ Total Carrying
value $ Fair value
$ Financial assets Cash and cash equivalents - 2,405 - - 2,405 2,405 Short-term investments 56,643 - - - 56,643 56,643 Accounts receivable - - 3,506 - 3,506 3,506 Total 56,643 2,405 3,506 - 62,554 62,554 Financial liabilities Accounts payable and accrued
liabilities
-
-
-
30,681
30,681
30,681 Dividend payable - - - 4,278 4,278 4,278 Long-term debt - - - 30,160 30,160 30,160 Capital lease obligations - - - 1,443 1,443 1,443 Total - - - 66,562 66,562 66,562
14
NOTES TO THE INTERIM CONSOLIDATED FINANCIAL STATEMENTS (continued)
10. Financial instruments (continued)
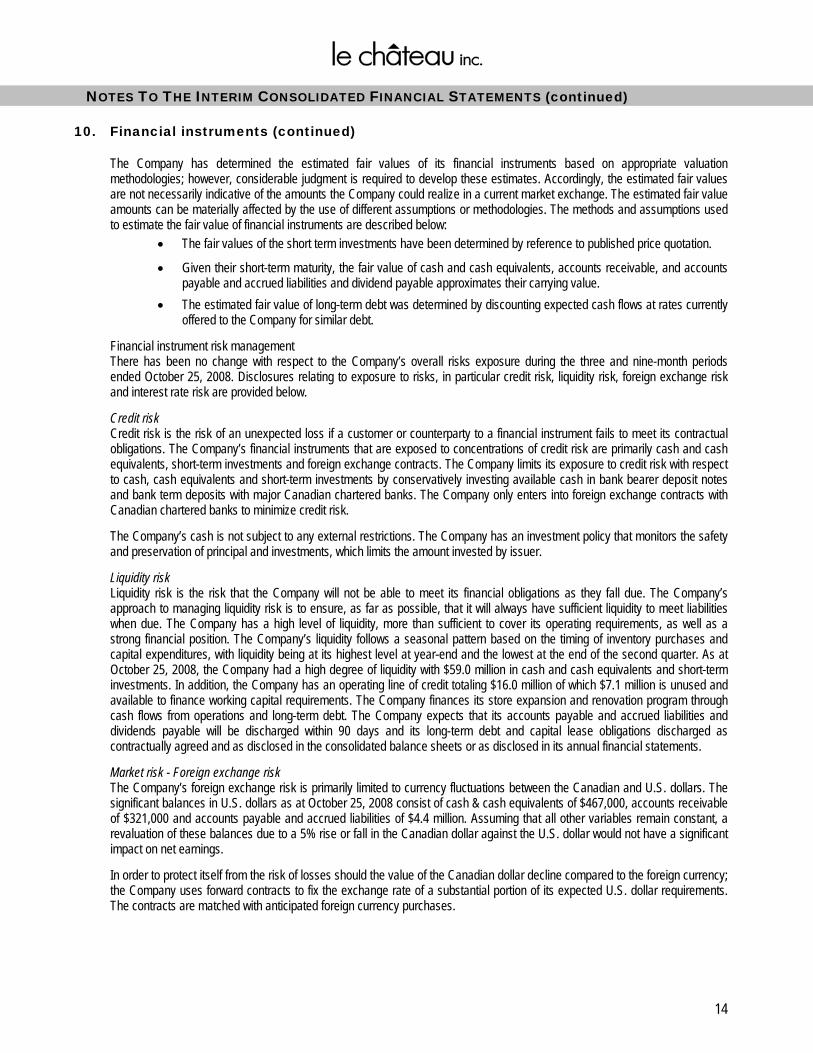
The Company has determined the estimated fair values of its financial instruments based on appropriate valuation methodologies; however, considerable judgment is required to develop these estimates. Accordingly, the estimated fair values are not necessarily indicative of the amounts the Company could realize in a current market exchange. The estimated fair value amounts can be materially affected by the use of different assumptions or methodologies. The methods and assumptions used to estimate the fair value of financial instruments are described below:
• The fair values of the short term investments have been determined by reference to published price quotation.
• Given their short-term maturity, the fair value of cash and cash equivalents, accounts receivable, and accounts payable and accrued liabilities and dividend payable approximates their carrying value.
• The estimated fair value of long-term debt was determined by discounting expected cash flows at rates currently offered to the Company for similar debt.
Financial instrument risk management There has been no change with respect to the Company’s overall risks exposure during the three and nine-month periods ended October 25, 2008. Disclosures relating to exposure to risks, in particular credit risk, liquidity risk, foreign exchange risk and interest rate risk are provided below.
Credit risk Credit risk is the risk of an unexpected loss if a customer or counterparty to a financial instrument fails to meet its contractual obligations. The Company’s financial instruments that are exposed to concentrations of credit risk are primarily cash and cash equivalents, short-term investments and foreign exchange contracts. The Company limits its exposure to credit risk with respect to cash, cash equivalents and short-term investments by conservatively investing available cash in bank bearer deposit notes and bank term deposits with major Canadian chartered banks. The Company only enters into foreign exchange contracts with Canadian chartered banks to minimize credit risk.
The Company’s cash is not subject to any external restrictions. The Company has an investment policy that monitors the safety and preservation of principal and investments, which limits the amount invested by issuer.
Liquidity risk Liquidity risk is the risk that the Company will not be able to meet its financial obligations as they fall due. The Company’s approach to managing liquidity risk is to ensure, as far as possible, that it will always have sufficient liquidity to meet liabilities when due. The Company has a high level of liquidity, more than sufficient to cover its operating requirements, as well as a strong financial position. The Company’s liquidity follows a seasonal pattern based on the timing of inventory purchases and capital expenditures, with liquidity being at its highest level at year-end and the lowest at the end of the second quarter. As at October 25, 2008, the Company had a high degree of liquidity with $59.0 million in cash and cash equivalents and short-term investments. In addition, the Company has an operating line of credit totaling $16.0 million of which $7.1 million is unused and available to finance working capital requirements. The Company finances its store expansion and renovation program through cash flows from operations and long-term debt. The Company expects that its accounts payable and accrued liabilities and dividends payable will be discharged within 90 days and its long-term debt and capital lease obligations discharged as contractually agreed and as disclosed in the consolidated balance sheets or as disclosed in its annual financial statements.
Market risk - Foreign exchange risk The Company’s foreign exchange risk is primarily limited to currency fluctuations between the Canadian and U.S. dollars. The significant balances in U.S. dollars as at October 25, 2008 consist of cash & cash equivalents of $467,000, accounts receivable of $321,000 and accounts payable and accrued liabilities of $4.4 million. Assuming that all other variables remain constant, a revaluation of these balances due to a 5% rise or fall in the Canadian dollar against the U.S. dollar would not have a significant impact on net earnings.
In order to protect itself from the risk of losses should the value of the Canadian dollar decline compared to the foreign currency; the Company uses forward contracts to fix the exchange rate of a substantial portion of its expected U.S. dollar requirements. The contracts are matched with anticipated foreign currency purchases.

15
NOTES TO THE INTERIM CONSOLIDATED FINANCIAL STATEMENTS (continued)
10. Financial instruments (continued)
Their nominal values and contract values as at October 25, 2008 are as follows:
Average contractual exchange rate
Nominal foreign currency value
Contract value
$ [000’s] [000’s] Purchase contracts U.S. dollar 1.0318 21,200 21,874
The range of maturity of these contracts is from October 27, 2008 to May 4, 2009. As at October 25, 2008, the fair value of these contracts amounted to an unrealized foreign exchange gain of $5.1 million (2007 – unrealized foreign exchange loss of $944,000).
Market Risk - Interest rate risk Financial instruments that potentially subject the Company to significant cash flow interest rate risk include financial assets and liabilities with variable interest rate and consist of cash and cash equivalents.
Financial assets and financial liabilities that bear interest at fixed rates are subject to fair value interest rate risk. The Company’s cash and cash equivalents and short-term investments are the only financial assets bearing fixed interest rate, and the long-term debt is the only financial liability bearing a fixed interest rate. The Company does not believe that the results of operations or cash flows would be affected to any significant degree by a sudden change in market interest rates relative to fixed interest rates on the cash and cash equivalents and short-term investments, owing to their relative short-term nature.
To manage the interest rate risk, the Company’s investments are made to achieve the highest rate of return while complying with the two primary objectives for its investment portfolio: liquidity and capital preservation.
11. Management of capital
The Company’s objectives in managing capital are:
• To ensure sufficient liquidity to enable the internal financing of capital projects thereby facilitating its expansion; • To maintain a strong capital base so as to maintain investor, creditor and market confidence; • To provide an adequate return to shareholders.
The Company’s capital is composed of long-term debt and capital lease obligations, including the current portions, and shareholders’ equity. $ Long-term debt 30,160 Capital lease obligations 1,443 Shareholders’ equity (excluding accumulated other comprehensive income) 133,556 Total 165,159
The Company’s primary uses of capital are to finance increases in non-cash working capital along with capital expenditures for its store expansion and renovation program as well as office and distribution centre improvements. The Company currently funds these requirements from cash flows from operations and can also draw upon its financial resources, which include cash and cash equivalents and short-term investments of $59.0 million as at October 25, 2008 and the unused portion of its line of credit. The Board of Directors does not establish quantitative return on capital criteria for management; but rather promotes year over year sustainable profitable growth. On a quarterly basis, the Company reviews the level of dividends paid to the Company’s shareholders. The Company is not subject to any externally imposed capital requirements.
The Company is subject to certain non-financial covenants related to the long-term debt and the Company complied with these covenants as at October 25, 2008. There has been no change with respect to the overall capital risk management strategy during the three and nine-month periods ended October 25, 2008.
12. Comparative figures
Certain comparative figures have been reclassified to conform to the presentation adopted in the current period.


![Le Château Inc. · Le Château Inc. Years ended January 26, 2019 and January 27, 2018 [in thousands of Canadian dollars, except per share information] 2019 2018 $ $ Sales [note 20]](https://static.fdocuments.us/doc/165x107/601b4de036cb4e54e010acfe/le-chteau-inc-le-chteau-inc-years-ended-january-26-2019-and-january-27-2018.jpg)