
Q3 2020 Earnings Call Presentation - Appian
17
Q3 2020 Earnings Call Presentation Matt Calkins, Founder & CEO Mark Lynch, CFO
Transcript of Q3 2020 Earnings Call Presentation - Appian

Q3 2020 Earnings Call Presentation
Matt Calkins, Founder & CEO
Mark Lynch, CFO

Disclaimer
In this presentation, we may make statements related to our business that are forward-looking statements under federal securities laws and are made pursuant to the Safe Harbor provisions of the Private Securities Litigation Reform Act of 1995, including statements related to our financial results, trends and guidance for the fourth quarter and full year 2020, the impact of COVID-19 on our business and on the global economy, the benefits of our platform, industry and market trends, our go-to-market and growth strategy, our market opportunity and ability to expand our leadership position, our ability to maintain and upsell existing customers, and our ability to acquire new customers. The words “anticipate,” “continue,” “estimate,” “expect,” “intend,” “will” and similar expressions are intended to identify forward-looking statements or similar indications of future expectations. These statements reflect our views only as of today and should not be reflected upon as representing our views as of any subsequent date. These statements are subject to a variety of risks and uncertainties that could cause actual results to differ materially from expectations.
For a discussion of the material risks and other important factors that could affect our actual results, please refer to those contained in our 2019 10-K filing and our other periodic filings with SEC. These documents are available in the Investors section of our website at www.appian.com.
Additionally, non-GAAP financial measures will be shared. Please refer to the tables in our earnings release and the Investors section of our website for a reconciliation of these measures to their most directly comparable GAAP financial measure.
2

Q3 2020 Business Highlights
Partners increase their contributions
• More than doubled new logos year-to-date compared to the same period in 2019
• Influenced 77% of new logos during Q3 2020
• Helped us win most of our seven-figure deals in Q3 2020
Federal industry grows
• Doubled software bookings compared to Q3 2019
• Increased new logos by 33% compared to Q3 2019
• Launched the Requirements Management solution, which automates an early step in a federal agency’s acquisition process
EMEA region grows
• Subscriptions revenue grew by 68% compared to Q3 2019
• Added a top-5 global oil and gas company as a new customer
• Doubled attendance at Appian Europe user conference compared to 2019
3

Q3 2020 Financial HighlightsRevenue
• Cloud Subscription Revenue was $34.3m in Q3 2020, growth of 40% over Q3 2019
• Subscriptions Revenue was $50.8m in Q3 2020, growth of 34% over Q3 2019
• Total Revenue was $77.3m in Q3 2020, growth of 17% over Q3 2019
Retention
• Cloud Subscription Revenue Retention Rate was 115% as of September 30, 2020
Gross Margins*
• Subscriptions Margin was 90%
• Professional Services Margin was 40%
• Overall Gross Margin was 73%
4
*Non-GAAP - Data does not include any stock-based compensation expense

55
Cloud Subscription Revenue
5
USD Millions
24.626.4
28.429.6
34.3
Q3 2019 Q4 2019 Q1 2020 Q2 2020 Q3 2020

66
Total Revenue*
6
24.6 26.4 28.4 29.634.3
9.211.6
17.87.4
11.84.0
4.1
4.3
4.5
4.628.4
26.5
28.4
25.4
26.5
66.268.6
78.9
66.8
77.3
Q3 2019 Q4 2019 Q1 2020 Q2 2020 Q3 2020
Cloud Subscription Revenue On-prem Subscription Revenue Maintenance & Support Professional Services
USD Millions
*Total revenue may not foot due to rounding

77
Cloud Subscription Revenue Retention
7
121%
115% 115%
113%
115%
100%
Q3 2019 Q4 2019 Q1 2020 Q2 2020 Q3 2020
125%

88
Mix of Subscriptions and Professional Services Revenue
8
20%
25%
30%
35%
40%
45%
50%
55%
60%
65%
70%
IPO Q32017
Q12018
Q32018
Q12019
Q32019
Q12020
Q32020
Subscriptions Professional Services

99
89% 89% 90% 89% 90%
Q32019
Q42019
Q12020
Q22020
Q32020
Subscriptions
Gross Margins*
32% 34% 35% 36%40%
Q32019
Q42019
Q12020
Q22020
Q32020
Professional Services
64% 67% 70% 69%73%
Q32019
Q42019
Q12020
Q22020
Q32020
Overall
9
*Non-GAAP - Data does not include any stock-based compensation expense

1010
Q3 2020 Highlights
Cloud Subscription
Revenue Retention*
24.6
34.3
Q3 2019 Q3 2020
Cloud Subscription Revenue ($MM)
115% 64%
73%
Q3 2019 Q3 2020
Overall Gross Margins**
*As of September 30, 2020
**Non-GAAP - Data does not include any stock-based compensation expense

1111
GuidanceGiven on November 5, 2020
*Based on 70.5 million basic and diluted weighted average common shares outstanding for Q4 2020
**Based on 69.1 million basic and diluted weighted average common shares outstanding for FY 2020
In $ Millions except for EPS Q4 2020 FY 2020
Cloud Subscription Revenue 35.0 – 35.5 127.3 – 127.8
Cloud Subscription Revenue Growth Y/Y 33% - 35% 34%
Total Revenue 73.0 – 74.0 296.0 – 297.0
Total Revenue Growth Y/Y 6% - 8% 14%
Adjusted EBITDA Loss (11.0) – (10.0) (24.0) – (23.0)
Non-GAAP Loss per Share (0.18) – (0.16)* (0.42) – (0.40) **

12
Appendix

13
As of As of
September 30, December 31,
2020 2019
(unaudited)
$ in thousands
Assets
Cash and cash equivalents $ 251,088 $ 159,755
Accounts receivable, net of allowance of $1,200 and $600 as of September 30, 2020 and December 31, 2019, respectively 89,219 70,408
Deferred commissions, current 16,292 14,543
Prepaid expenses and other current assets 25,909 32,955
Property and equipment, net 36,415 39,554
Goodwill 4,637 —
Intangible assets, net of accumulated amortization of $307 as of September 30, 2020 1,765 —
Operating right-of-use assets 30,855 24,205
Deferred commissions, net of current portion 31,580 28,979
Other assets 4,696 1,086
Total assets $ 492,456 $ 371,485
Liabilities and Stockholders’ Equity
Deferred revenue, current $ 96,902 $ 82,201
Operating lease liabilities, current 6,592 3,836
Finance lease liabilities, current 1,549 1,447
Other current liabilities 27,851 24,796
Operating lease liabilities, net of current portion 51,727 44,416
Finance lease liabilities, net of current portion 1,192 2,375
Deferred revenue, net of current portion 4,371 7,139
Other non-current liabilities 4,530 38
Total liabilities 194,714 166,248
Stockholders’ equity
Common stock 7 6
Additional paid-in capital 462,686 340,929
Accumulated other comprehensive loss (2,442) (285)
Accumlated deficit (162,509) (135,413)
Total stockholders’ equity 297,742 205,237
Total liabilities and stockholders’ equity $ 492,456 $ 371,485
Balance Sheet

14
Three monds ended September 30, Nine months ended September 30,
2020 2019 2020 2019
(unaudited) (unaudited)
$ in thousands, except for shares
Revenue:
SaaS (cloud) subscriptions $ 34,312 $ 24,573 $ 92,282 $ 68,647
Term license (on prem) subscriptions 11,830 9,199 37,002 28,859
Maintenance and support 4,618 4,002 13,330 11,685
Total subscriptions revenue 50,760 37,774 142,614 109,191
Professional services 26,544 28,381 80,329 82,543
Total revenue 77,304 66,155 222,943 191,734
Cost of revenue:
Subscriptions 5,101 4,484 15,185 12,105
Professional services 16,450 19,467 51,641 58,963
Total cost of revenue 21,551 23,951 66,826 71,068
Gross Profit 55,753 42,204 156,117 120,666
Operating expenses:
Sales and marketing 31,633 27,603 94,891 86,186
Research and development 18,150 15,697 51,366 42,418
General and administrative 13,485 11,191 38,076 29,468
Total operating expenses 63,268 54,491 184,333 158,072
Operating loss (7,515) (12,287) (28,216) (37,406)
Other (income) expense:
Other (income) expense, net (4,277) 2,262 (1,845) 1,881
Interest expense 119 96 390 236
Total other (income) expense (4,158) 2,358 (1,455) 2,117
Loss before income taxes (3,357) (14,645) (26,761) (39,523)
Income tax expense 255 5 335 394
Net loss $ (3,612) $ (14,650) $ (27,096) $ (39,917)
Net loss per share attributable to common stockholders:
Basic and diluted $ (0.05) $ (0.22) $ (0.39) $ (0.62)
Weighted average common shares outstanding
Basic and diluted 69,923,553 65,508,113 68,611,994 64,860,342
Income Statement

15
Three months ended September 30, Nine months ended September 30,
2020 2019 2020 2019
(unaudited) (unaudited)
$ in thousands, except for shares
Reconciliation of non-GAAP operating loss:
GAAP operating loss $ (7,515) $ (12,287) $ (28,216) $ (37,406)
Add back:
Stock-based compensation expense 3,578 3,141 10,668 13,055
Non-GAAP operating loss $ (3,937) $ (9,146) $ (17,548) $ (24,351)
Reconciliation of non-GAAP net loss:
GAAP net loss $ (3,612) $ (14,650) $ (27,096) $ (39,917)
Add back:
Stock-based compensation expense 3,578 3,141 10,668 13,055
Loss on disposal of property and equipment — 1 22 146
Non-GAAP net loss $ (34) $ (11,508) $ (16,406) $ (26,716)
GAAP net loss per share, basic and diluted $ (0.05) $ (0.22) $ (0.39) $ (0.62)
Non-GAAP weighted average shares used to compute net loss per share, basic and diluted 69,923,553 65,508,113 68,611,994 64,860,342
Non-GAAP net loss per share, basic and diluted $ (0.00) $ (0.18) $ (0.24) $ (0.41)
Reconciliation of adjusted EBITDA
GAAP net loss $ (3,612) $ (14,650) $ (27,096) $ (39,917)
Other (income) expense, net (4,277) 2,262 (1,845) 1,881
Interest expense 119 96 390 236
Income tax expense 255 5 335 394
Depreciation and amortization expense 1,505 1,340 4,485 3,273
Stock-based compensation expense 3,578 3,141 10,668 13,055
Adjusted EBITDA $ (2,432) $ (7,806) $ (13,063) $ (21,078)
Reconciliation of Non-GAAP Measures
16
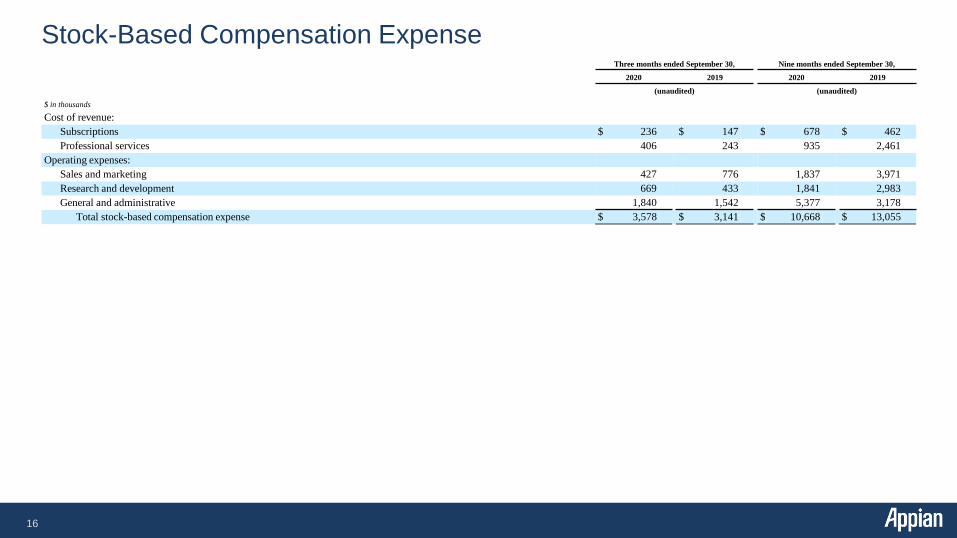
Three months ended September 30, Nine months ended September 30,
2020 2019 2020 2019
(unaudited) (unaudited)
$ in thousands
Cost of revenue:
Subscriptions $ 236 $ 147 $ 678 $ 462
Professional services 406 243 935 2,461
Operating expenses:
Sales and marketing 427 776 1,837 3,971
Research and development 669 433 1,841 2,983
General and administrative 1,840 1,542 5,377 3,178
Total stock-based compensation expense $ 3,578 $ 3,141 $ 10,668 $ 13,055
Stock-Based Compensation Expense

17