Q3 2019 Results - MTU Aero Engines · The information contained herein is proprietary to the MTU...
22
Q3 2019 Results 25 October 2019 - Investor Relations Conference Call with Investors & Analysts
Transcript of Q3 2019 Results - MTU Aero Engines · The information contained herein is proprietary to the MTU...

Q3 2019 Results
25 October 2019 - Investor Relations
Conference Call with Investors & Analysts
© MTU Aero Engines AG. The information contained herein is proprietary to the MTU Aero Engines group companies.
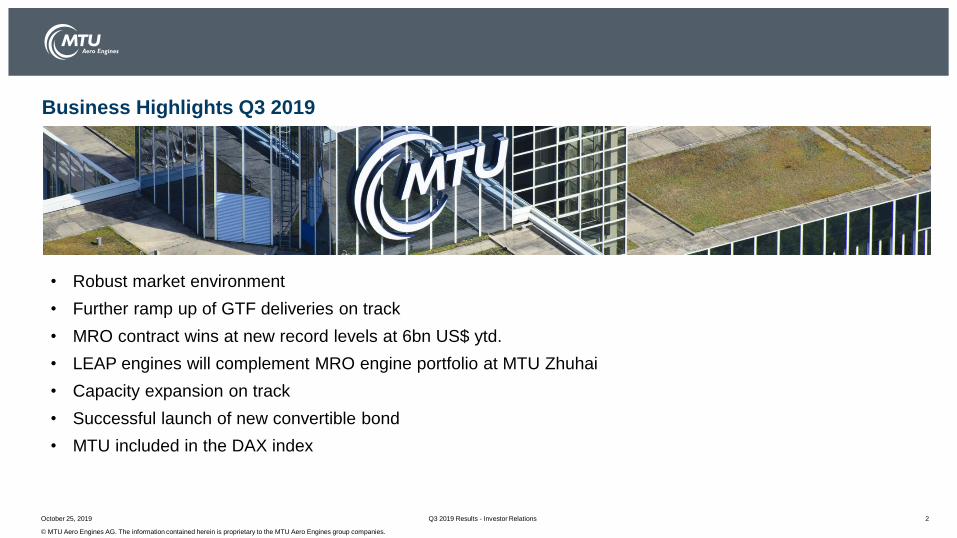
Business Highlights Q3 2019
• Robust market environment
• Further ramp up of GTF deliveries on track
• MRO contract wins at new record levels at 6bn US$ ytd.
• LEAP engines will complement MRO engine portfolio at MTU Zhuhai
• Capacity expansion on track
• Successful launch of new convertible bond
• MTU included in the DAX index
Q3 2019 Results - Investor RelationsOctober 25, 2019 2

© MTU Aero Engines AG. The information contained herein is proprietary to the MTU Aero Engines group companies.
Revenues
(in m€)
EBIT adjusted
(in m€)
Net income adj.
(in m€)
Free Cash Flow
(in m€)
3,3193,404
9M 2018 9M 2019
509
558
9M 2018 9M 2019
363392
9M 2018 9M 2019
163
303
9M 2018 9M 2019
(15.3%)
(16.4%)
Financial Highlights Q3 2019
October 25, 2019 Q3 2019 Results - Investor Relations
+3%+10%
+8%
+85%
3

© MTU Aero Engines AG. The information contained herein is proprietary to the MTU Aero Engines group companies.
(in m €) 9M 2018 9M 2019 Change
Revenues 1,340 1,461 9%
Military Business 303 324 7%
Commercial Business 1,037 1,138 10%
EBIT adj. 341 370 9%
EBIT adj. margin % 25.4% 25.3%
OEM Segment
Q3 2019 Results - Investor RelationsOctober 25, 2019
• US$ Commercial business growth: ~ 3%
• Military revenues up by 7%
• EBIT margin stable
4

© MTU Aero Engines AG. The information contained herein is proprietary to the MTU Aero Engines group companies.
Commercial MRO
Q3 2019 Results - Investor RelationsOctober 25, 2019
(in m €) 9M 2018 9M 2019 Change
Revenues 2,020 1,996 -1%
EBIT adj. 168 187 12%
EBIT adj. margin % 8.3% 9.4%
• Organic Revenue growth ~ 8%
• EBIT margin increase due to process change* and performance MTU Zhuhai
*see page 4 of 2019 Q1 presentation
5
© MTU Aero Engines AG. The information contained herein is proprietary to the MTU Aero Engines group companies.
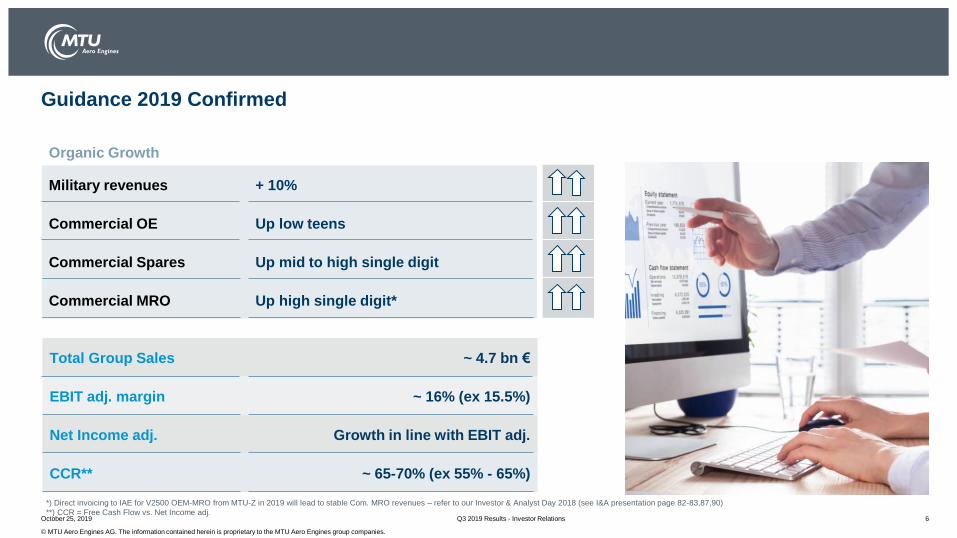
Organic Growth
Military revenues + 10%
Commercial OE Up low teens
Commercial Spares Up mid to high single digit
Commercial MRO Up high single digit*
Guidance 2019 Confirmed
*) Direct invoicing to IAE for V2500 OEM-MRO from MTU-Z in 2019 will lead to stable Com. MRO revenues – refer to our Investor & Analyst Day 2018 (see I&A presentation page 82-83,87,90)
**) CCR = Free Cash Flow vs. Net Income adj.
Total Group Sales ~ 4.7 bn €
EBIT adj. margin ~ 16% (ex 15.5%)
Net Income adj. Growth in line with EBIT adj.
CCR** ~ 65-70% (ex 55% - 65%)
October 25, 2019 Q3 2019 Results - Investor Relations 6

© MTU Aero Engines AG. The information contained herein is proprietary to the MTU Aero Engines group companies.
Appendix
Q3 2019 Results - Investor RelationsOctober 25, 2019 7

© MTU Aero Engines AG. The information contained herein is proprietary to the MTU Aero Engines group companies.
Group Order Book up 18 %
Appendix
October 25, 2019 Q3 2019 Results - Investor Relations
Order book 2018/12/31 Order book 2019/09/30
+18%
17.6 bn€
20.8 bn€
8

© MTU Aero Engines AG. The information contained herein is proprietary to the MTU Aero Engines group companies.
US$ Exchange Rate / Hedge Portfolio
Hedge book as of October 25, 2019 (% of net exposure)
1,450
(=97%)
1,230
(=70%)
920
(=51%)420
(=22%)
80
(=4%)
2019 2020 2021 2022 2023
in m$
1.17 1.19Average hedge
rate (US$/€) 1.18
October 25, 2019 Q3 2019 Results - Investor Relations
1.18 1.19
Appendix
9
© MTU Aero Engines AG. The information contained herein is proprietary to the MTU Aero Engines group companies.
10
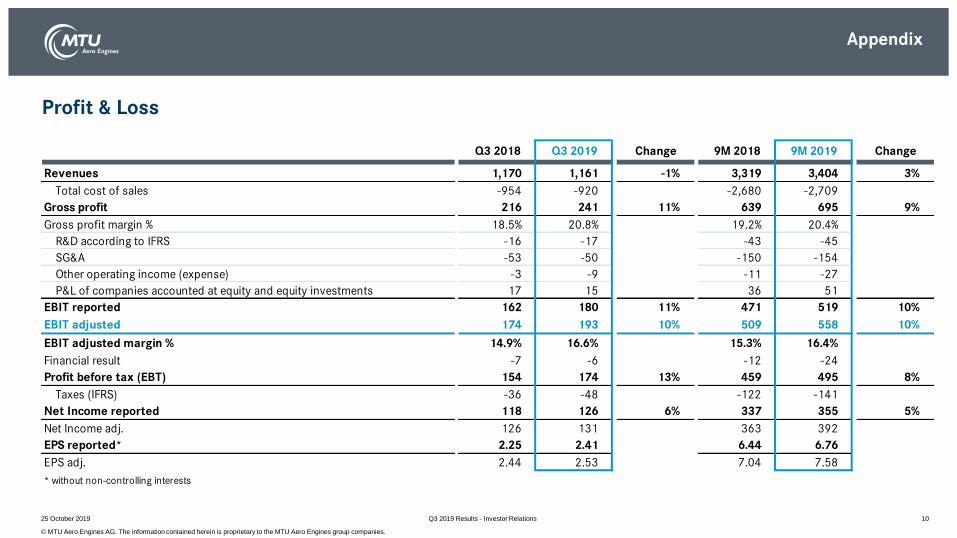
Profit & Loss
Q3 2019 Results - Investor Relations25 October 2019
Appendix
Q3 2018 Q3 2019 Change 9M 2018 9M 2019 Change
Revenues 1,170 1,161 -1% 3,319 3,404 3%
Total cost of sales -954 -920 -2,680 -2,709
Gross profit 216 241 11% 639 695 9%
Gross profit margin % 18.5% 20.8% 19.2% 20.4%
R&D according to IFRS -16 -17 -43 -45
SG&A -53 -50 -150 -154
Other operating income (expense) -3 -9 -11 -27
P&L of companies accounted at equity and equity investments 17 15 36 51
EBIT reported 162 180 11% 471 519 10%
EBIT adjusted 174 193 10% 509 558 10%
EBIT adjusted margin % 14.9% 16.6% 15.3% 16.4%
Financial result -7 -6 -12 -24
Profit before tax (EBT) 154 174 13% 459 495 8%
Taxes (IFRS) -36 -48 -122 -141
Net Income reported 118 126 6% 337 355 5%
Net Income adj. 126 131 363 392
EPS reported* 2.25 2.41 6.44 6.76
EPS adj. 2.44 2.53 7.04 7.58
* without non-controlling interests
© MTU Aero Engines AG. The information contained herein is proprietary to the MTU Aero Engines group companies.
11Q3 2019 Results - Investor RelationsOctober 25, 2019
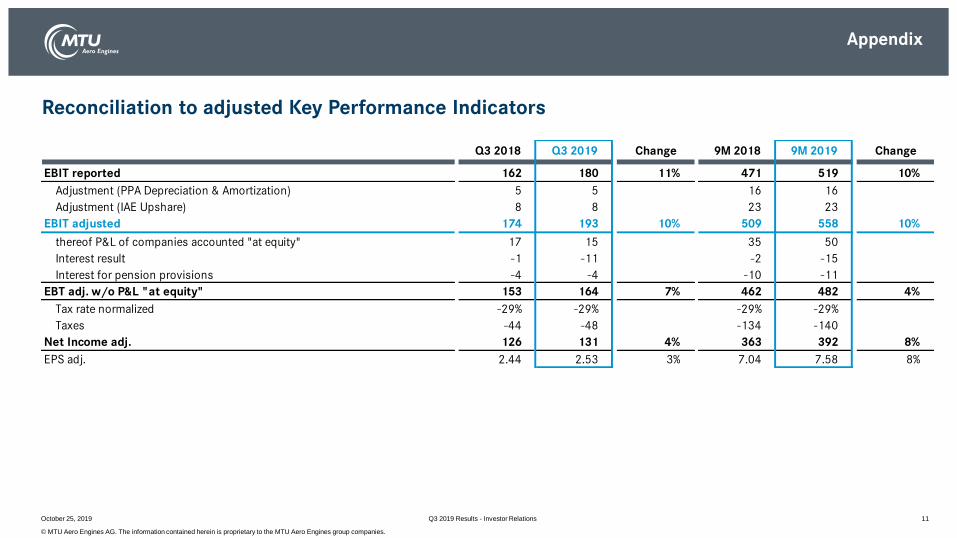
Q3 2018 Q3 2019 Change 9M 2018 9M 2019 Change
EBIT reported 162 180 11% 471 519 10%
Adjustment (PPA Depreciation & Amortization) 5 5 16 16
Adjustment (IAE Upshare) 8 8 23 23
EBIT adjusted 174 193 10% 509 558 10%
thereof P&L of companies accounted "at equity" 17 15 35 50
Interest result -1 -11 -2 -15
Interest for pension provisions -4 -4 -10 -11
EBT adj. w/o P&L "at equity" 153 164 7% 462 482 4%
Tax rate normalized -29% -29% -29% -29%
Taxes -44 -48 -134 -140
Net Income adj. 126 131 4% 363 392 8%
EPS adj. 2.44 2.53 3% 7.04 7.58 8%
Appendix
Reconciliation to adjusted Key Performance Indicators

© MTU Aero Engines AG. The information contained herein is proprietary to the MTU Aero Engines group companies.
Segment Revenues and EBIT adj.
Q3 2019 Results - Investor RelationsOctober 25, 2019
Appendix
Q3 2018 Q3 2019 Change 9M 2018 9M 2019 Change
Revenues Group 1,170 1,161 -1% 3,319 3,404 3%
OEM Commercial 350 365 4% 1,037 1,138 10%
OEM Military 104 108 3% 303 324 7%
MRO 731 709 -3% 2,020 1,996 -1%
Consolidation -15 -20 -41 -54
EBIT adjusted Group 174 193 10% 509 558 10%
OEM (Commercial / Military) 112 127 14% 341 370 9%
MRO 62 65 4% 168 187 12%
Consolidation 0 0 0 0
EBIT adjusted margin Group 14.9% 16.6% 15.3% 16.4%
OEM (Commercial / Military) 24.6% 27.0% 25.4% 25.3%
MRO 8.5% 9.2% 8.3% 9.4%
12
© MTU Aero Engines AG. The information contained herein is proprietary to the MTU Aero Engines group companies.
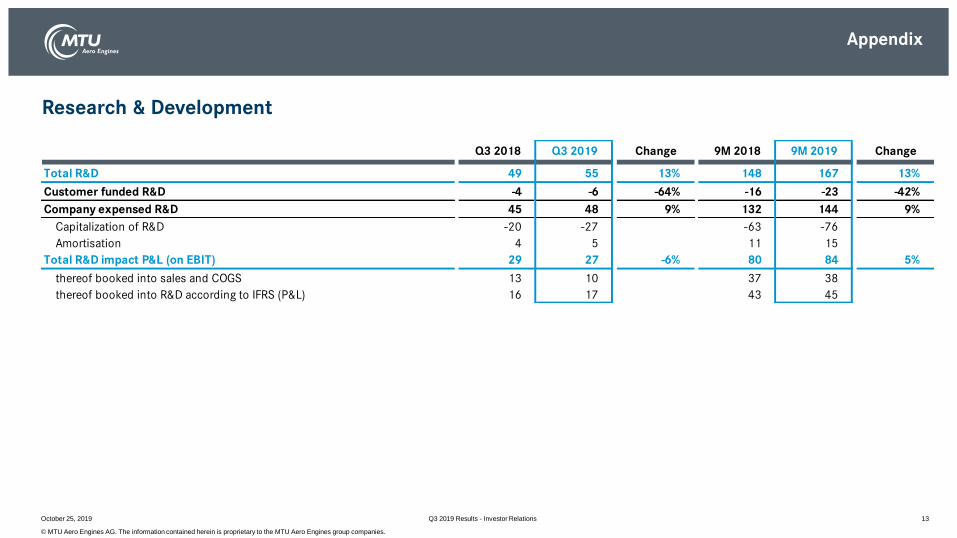
Research & Development
Q3 2019 Results - Investor RelationsOctober 25, 2019
Appendix
Q3 2018 Q3 2019 Change 9M 2018 9M 2019 Change
Total R&D 49 55 13% 148 167 13%
Customer funded R&D -4 -6 -64% -16 -23 -42%
Company expensed R&D 45 48 9% 132 144 9%
Capitalization of R&D -20 -27 -63 -76
Amortisation 4 5 11 15
Total R&D impact P&L (on EBIT) 29 27 -6% 80 84 5%
thereof booked into sales and COGS 13 10 37 38
thereof booked into R&D according to IFRS (P&L) 16 17 43 45
13
© MTU Aero Engines AG. The information contained herein is proprietary to the MTU Aero Engines group companies.
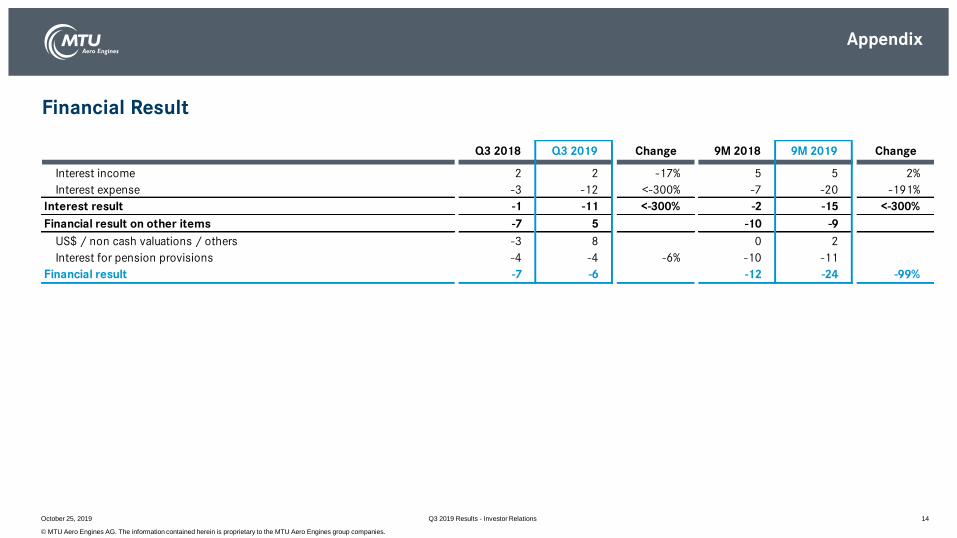
Financial Result
Q3 2019 Results - Investor RelationsOctober 25, 2019
Appendix
Q3 2018 Q3 2019 Change 9M 2018 9M 2019 Change
Interest income 2 2 -17% 5 5 2%
Interest expense -3 -12 <-300% -7 -20 -191%
Interest result -1 -11 <-300% -2 -15 <-300%
Financial result on other items -7 5 -10 -9
US$ / non cash valuations / others -3 8 0 2
Interest for pension provisions -4 -4 -6% -10 -11
Financial result -7 -6 -12 -24 -99%
14

© MTU Aero Engines AG. The information contained herein is proprietary to the MTU Aero Engines group companies.
MTU’s Cash development January – September 2019
Q3 2019 Results - Investor RelationsOctober 25, 2019
Appendix
99
609
-277
0-31 1
-302
430
133
CF from
operating
activities
CF from
investing
activities
Payments for
liquidity
management
Sales
Financing
Cash and
cash
equivalents
Sep 30th
2019
Cash and
cash
equivalents
Jan 1st
2019
34
Acquisition
payments for
program shares
CF from
financing
activities
Translation
differences
Adjustments
+303Free Cashflow:
Adjusted Non-operating
exceptional items: -30
15

© MTU Aero Engines AG. The information contained herein is proprietary to the MTU Aero Engines group companies.
Q3 2019 Results - Investor RelationsOctober 25, 2019
Appendix
Cash Flow
(in m €) 9M 2018 9M 2019 Change
Net Income IFRS 337 355 5%
Depreciation and amortization 144 189
Change in provisions and liabilities 157 139
Change in working capital -207 -124
Taxes 20 32
Interest, derivatives, others 7 18
Cash Flow from operating activities 457 609 33%
Net Investment in intangible assets -52 -79
Net Investment in R&D payments and entry fees -18 -17
Net Capital expenditure on property, plant and equipment -134 -166
Net Investments in financial assets -84 -16
Cash Flow from investing activities -288 -277 4%
Adjustments -6 -30
Free Cash Flow 163 303 85%
Cash Flow from financing activities -212 -302 -42%
Cash and cash equivalents at 30.09. 61 133
16

© MTU Aero Engines AG. The information contained herein is proprietary to the MTU Aero Engines group companies.
17Q3 2019 Results - Investor Relations25 October 2019
Appendix
Net debt
(in m €) 31.12.2018 30.09.2019 Change
Bonds and notes 100 99
Convertible bonds 483 692
Financial liabilities to bank 54 40
thereof Revolving Credit Facility 15 0
thereof Note Purchase Agreement 30 30
Financial lease liabilities 10 148
Loans from related companies and third parties 35 1
Financial liabilities arising from program participation 350 315
thereof arising from IAE V2500 Upshare 302 284
Gross financial debt 1,032 1,295 25%
Cash and cash equivalents 99 133
Loans to third parties 60 51
Loans to related companies 20 1
Financial assets 178 184 3%
Net financial debt 854 1,111 30%

© MTU Aero Engines AG. The information contained herein is proprietary to the MTU Aero Engines group companies.
Working capital
Q3 2019 Results - Investor RelationsOctober 25, 2019
Appendix
(in m €) 31.12.2018 30.09.2019 Change
Inventories 996 1,169
Prepayments -293 -389
Receivables 1,996 2,122
Payables -1,331 -1,411
Working Capital 1,368 1,492 9%
18

© MTU Aero Engines AG. The information contained herein is proprietary to the MTU Aero Engines group companies.
Balance Sheet
Q3 2019 Results - Investor RelationsOctober 25, 2019
Appendix
(in m €) 31.12.2018 30.09.2019 Change
Intangible assets 1,073 1,125
Property, plant, equipment 799 1,006
other non-current assets 1,844 1,900
Total non-current assets 3,716 4,031 8%
Current assets 3,135 3,540 13%
Total assets 6,851 7,571 11%
Equity 2,144 2,092 -2%
Non-current liabilities 1,902 2,332 23%
Current liabilities 2,804 3,148 12%
Total equity and liabilities 6,851 7,571 11%
thereof pension provisions 879 991
19

© MTU Aero Engines AG. The information contained herein is proprietary to the MTU Aero Engines group companies.
PPA Depreciation / Amortization
Q3 2019 Results - Investor RelationsOctober 25, 2019
Appendix
Q3 2018 Q3 2019 Change 9M 2018 9M 2019 Change
OEM 40 45 119 132
MRO 8 23 25 57
Total depreciation / amortization* 48 68 41% 144 189 31%
PPA OEM 5 5 14 14
PPA MRO 1 1 2 2
IAE Upshare OEM 8 8 23 23
PPA depreciation / amortization & IAE Upshare amortization (EBIT adjustments) 13 13 0% 38 38 0%
OEM 28 33 82 96
MRO 8 23 23 55
Depreciation / amortization w/o PPA and w/o IAE Upshare 36 55 56% 105 150 43%
* incl. amortization of intangible assets, capitalized program assets and purchased development
20

© MTU Aero Engines AG. The information contained herein is proprietary to the MTU Aero Engines group companies.
Cautionary Note Regarding Forward-Looking Statements
Certain of the statements contained herein may be statements of future expectations and other forward-looking statements that are based on management’s currentviews and assumptions and involve known and unknown risks and uncertainties that could cause actual results, performance or events to differ materially from thoseexpressed or implied in such statements. In addition to statements that are forward-looking by reason of context, the words “may,” “will,” “should,” “expect,” “plan,”“intend,” “anticipate,” “forecast,” “believe,” “estimate,” “predict,” “potential,” or “continue” and similar expressions identify forward-looking statements.
Actual results, performance or events may differ materially from those in such statements due to, without limitation, (i) competition from other companies in MTU’sindustry and MTU’s ability to retain or increase its market share, (ii) MTU’s reliance on certain customers for its sales, (iii) risks related to MTU’s participation inconsortia and risk and revenue sharing agreements for new aero engine programs, (iv) the impact of non-compete provisions included in certain of MTU’s contracts,(v) the impact of a decline in German or other European defense budgets or changes in funding priorities for military aircraft, (vi) risks associated with governmentfunding, (vii) the impact of significant disruptions in MTU’s supply from key vendors, (viii) the continued success of MTU’s research and development initiatives, (ix)currency exchange rate fluctuations, (x) changes in tax legislation, (xi) the impact of any product liability claims, (xii) MTU’s ability to comply with regulations affectingits business and its ability to respond to changes in the regulatory environment, (xiii) the cyclicality of the airline industry and the current financial difficulties ofcommercial airlines, (xiv) our substantial leverage and (xv) general local and global economic conditions. Many of these factors may be more likely to occur, or morepronounced, as a result of terrorist activities and their consequences.
The company assumes no obligation to update any forward-looking statement.
Any securities referred to herein have not been and will not be registered under the U.S. Securities Act of 1933, as amended (the “Securities Act”), and may not be offered or sold without registration thereunder or pursuant to an available exemption therefrom. Any public offering of securities of MTU Aero Engines to be made in the United States would have to be made by means of a prospectus that would be obtainable from MTU Aero Engines and would contain detailed information about the issuer of the securities and its management, as well as financial statements.
Neither this document nor the information contained herein constitutes an offer to sell or the solicitation of an offer to buy any securities.
These materials do not constitute an offer of securities for sale in the United States; the securities may not be offered or sold in the United States absent registration or an exemption from registration.
No money, securities or other consideration is being solicited, and, if sent in response to the information contained herein, will not be accepted.
Q3 2019 Results - Investor RelationsOctober 25, 2019 21

© MTU Aero Engines AG. The information contained herein is proprietary to the MTU Aero Engines group companies.
This document contains proprietary information of the MTU Aero Engines AG group companies. The document and its contents shall not
be copied or disclosed to any third party or used for any purpose other than that for which it is provided, without the prior written
agreement of MTU Aero Engines AG.
Proprietary Notice
October 25, 2019 Q3 2019 Results - Investor Relations 22