Q3 2019 Activity - Air Liquide...Q3 –Robust Europe, Solid Americas Sales Q3 2019 €2,137m Sales...
32
Q3 2019 Activity Robust Sales Growth Despite Softening Environment Very Active Business Development Paris, 24 October 2019
Transcript of Q3 2019 Activity - Air Liquide...Q3 –Robust Europe, Solid Americas Sales Q3 2019 €2,137m Sales...
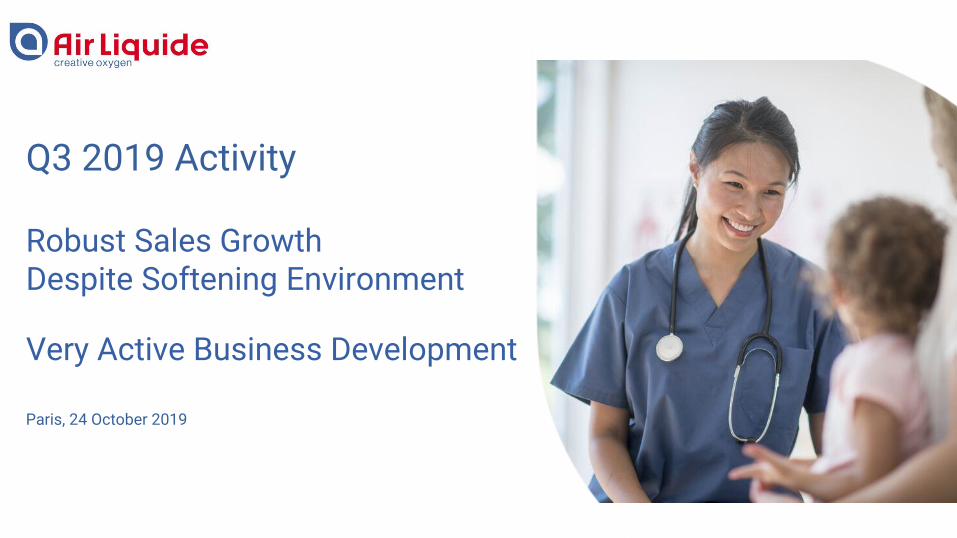
Q3 2019 Activity
Robust Sales Growth Despite Softening Environment
Very Active Business Development
Paris, 24 October 2019

2
Q3 Highlights
Robust sales growth at +3.5% despite a softening environment
Performance improvement plans continue to deliver
Strong cash flow
Sustained business development with high levels of
opportunities and decisions
24 October 2019 Q3 2019 Activity A world leader in gases, technologies and services for Industry and Health

EL
HC
3
Markets Softening Through Q4 2019
24 October 2019 Q3 2019 Activity A world leader in gases, technologies and services for Industry and Health
Chemicals
Oil & gas
Steel
Metal Fab.
Construction
Energy
Food & Pharma
Techno & Research
Integrated Circuit
IM
LI
Memory market driving sales growth
Back to normalized level of customers capex
Softening Chemicals in all regions
High demand from Refining in Northern Europe
Active projects signing
Continued softening in U.S.
Growth in consumption related sectors
Contrasted dynamics in China
Medical gases
Home Healthcare
Healthcare strong fundamentals

Robust Sales Growth
4 24 October 2019 Q3 2019 Activity A world leader in gases, technologies and services for Industry and Health
+2.1% FX Impact -2.7% Energy Impact +0.6% ScopeQ3 Group sales:

5
HC and EL, Key Growth Drivers in Q3
24 October 2019 Q3 2019 Activity A world leader in gases, technologies and services for Industry and Health
Main Geographies contributingWBLs
+2%Industrial Merchant
+3%LargeIndustries
Healthcare +6%
+6%Electronics
Europe, Asia, Middle East
Asia, H2 in Europe
G&S comparable sales growth
Asia
Europe, Americas

6
Resilient Base Business Activity
24 October 2019 Q3 2019 Activity A world leader in gases, technologies and services for Industry and Health
(1) Comparable growth based on 2016 adjusted sales
G&S quarterly growth analysis
(Tech Air in 2019)

Q3 – Robust Europe, Solid Americas
SalesQ3 2019
€2,137m
SalesQ3 2019
€1,742m
7 24 October 2019 Q3 2019 Activity A world leader in gases, technologies and services for Industry and Health
G&S comparable sales growth
Americas – Solid HC, Resilient IM
Europe – IM and HC Driving Growth
- strong H2 for refining in Benelux- slow activity in Germany & Italy
- +4.6%: sustained pricing- solid Food & Pharma markets
- pursued high organic growth in HHC
LI
IM
HC
EL
LI
IM
HC
- several turnarounds
- resilient despite softening in Construction and Metal Fab
- sustained pricing
- growing medical gases in U.S. - high HHC in Latin America
- strong Carrier Gases

The world leader in gases, technologies and services for Industry and HealthH1 2017 Results28 July 20178
Q3 – High Asia, Solid Middle East and Africa
SalesQ3 2019
€1,207m
SalesQ3 2019
€156m
24 October 2019 Q3 2019 Activity A world leader in gases, technologies and services for Industry and Health
G&S comparable sales growth
Asia – LI and EL driving Growth
Middle East and Africa – Dynamic IM
- O2 Ramp-Ups in China for Chemicals
- strong cylinder volumes, lower bulk pricing in China
- solid SE Asia- high helium volumes and pricing
- >+10% growth excluding E&I
- stable base business
- continuous high growth in Middle East, Egypt and India
- high sales of helium
LI
IM
EL
LI
IM

9
Q3 – Solid Growth in LI, Resilient IM
SalesQ3 2019
€1,374m
SalesQ3 2019
€2,471m
24 October 2019 Q3 2019 Activity A world leader in gases, technologies and services for Industry and Health
G&S comparable sales growth
Large Industries – Asia Driving Growth
Industrial Merchant – Solid Growth in Europe & Asia
strong Oil & gas in Benelux with high H2 volumes
Ramp-ups in China & Europe
softening Chemicals & low Metals
successful pricing management at +3.8%, including helium
softening end markets:- positive Food & Pharma, Research- slowing Automotive, Construction
and Metal Fab
favorable working day

The world leader in gases, technologies and services for Industry and HealthH1 2017 Results28 July 201710
Q3 – Strong HC, High EL
SalesQ3 2019
SalesQ3 2019
€482m
€915m
24 October 2019 Q3 2019 Activity A world leader in gases, technologies and services for Industry and Health
G&S comparable sales growth
Healthcare – Organic Growth
Electronics – +8.6% Growth excluding E&I
strong HHC in Europe especially with diabetes and sleep therapies
solid medical gases in U.S.
strong activity in Latin America
>+10% growth in Carrier Gases; 3 Start-Ups
high sales to Memory market
strong Flat Panel Display in China

Q1 Q2 Q3 Q4 Q1 Q2 Q3 Q4 Q1 Q2 Q3 Q4 Q1 Q2 Q3
+0.2%
+1.3%
+2.9%
+3.8%
Pursued Management of Pricing and Product Mix
11 24 October 2019 Q3 2019 Activity A world leader in gases, technologies and services for Industry and Health
IM pricing momentum Q3 Product Mix
2016 2017 2018 2019
Positive mix effect contributing to higher margin:
less E&I in EL and hardgoods in IM
higher Cylinder growth compared to bulk in IM
local review of activities and customers portfolio in IM

12
Strengthened Efficiency Program Ramping-Up
24 October 2019 Q3 2019 Activity A world leader in gases, technologies and services for Industry and Health
€310m
Accelerated Airgas delivery
Increased efficiencies from digital deployment
Launch of European Support Center
Bulk supply chain renewal in Asia
Streamlining of O2 supply network in HHC
YTD Q3 2019
2019 efficiencies
Cumulated efficiencies
2017-2020>€400m
€984m
>€1.5bn
~30% linked to energy transition

13 24 October 2019 Q3 2019 Activity A world leader in gases, technologies and services for Industry and Health
Continuous Portfolio Management
2 in Europe
non-core activity in Hygiene
hospital piping business in Germany
1 in Asia: Fujian
2 at Airgas
1 in Canada
1 in Italy
Focus on Core business Densification of operations
New Divestitures in Q3 New Acquisitions in Q3
21 acquisitions YTD (incl. Tech Air) 6 divestitures YTD (incl. Fujian)

14
Strong Cash Flow
€1.8bn
YTD 2019 figures
(1) Operating Cash Flows before changes in Working Capital requirements(2) 19.9% excluding IFRS 16
Cash Flow(1)
• €3.5bn
• 21.1% of sales(2)
• €1.8bn
• 11% of sales
Net Capex
• €13.2bn
• 67% gearing(4)
Net Debt(3)
(3) Excluding IFRS 16
(4) Adjusted for dividend seasonality
24 October 2019 Q3 2019 Activity A world leader in gases, technologies and services for Industry and Health

Q3 18 Q1 19 Q3 19 Q3 2018 Q3 2019
15
Very Active Business Development
InvestmentOpportunities(1)
12-month portfolio
Investment Decisions(1)
Start-up/Ramp-upSales Growth Contribution
• well-balanced by geography
• mostly Chemicals, Oil & gas, IC
• ~25% projects linked to climate objectives
• High level of signings
- 2 large LI projects in U.S.
- pursued investments in EL
- >10%(2) in efficiency projects
• 5 Start-Ups
‐ 2 in LI: Saudi Arabia and Benelux
‐ 3 in EL: China and Taiwan
24 October 2019 Q3 2019 Activity A world leader in gases, technologies and services for Industry and Health
€2.8bn €983m
Q3 2018 Q3 2019
€98m €283mYTD€2.6bn
€2.7bnYTD
€2.7bn
(1) See definitions in appendix (2) of industrial decisions

EL Project
Asia
16 24 October 2019 Q3 2019 Activity A world leader in gases, technologies and services for Industry and Health
Contribution from 2019 Start-Ups Slightly Faster than Expected
PemexT/O
Mexico
Major Start-Ups
Sales growth contribution - FY 2019
~€320m
2019
Q1 Q2 Q3 Q4
LIProjectMiddle-
East
ELProjects
Asia
ELProjects
Asia
SteelProject
Europe
LIProject
South America
Note: T/O = Take Over
Increased Backlog €2.5bn
Yearly Sales Backlogafter full Ramp-ups
€ 0.9bn
2019
Q1 Q2 Q3 Q4
2020
Q1 Q2
ELProject
Asia
ELProject
Asia
LIProject
Asia
17
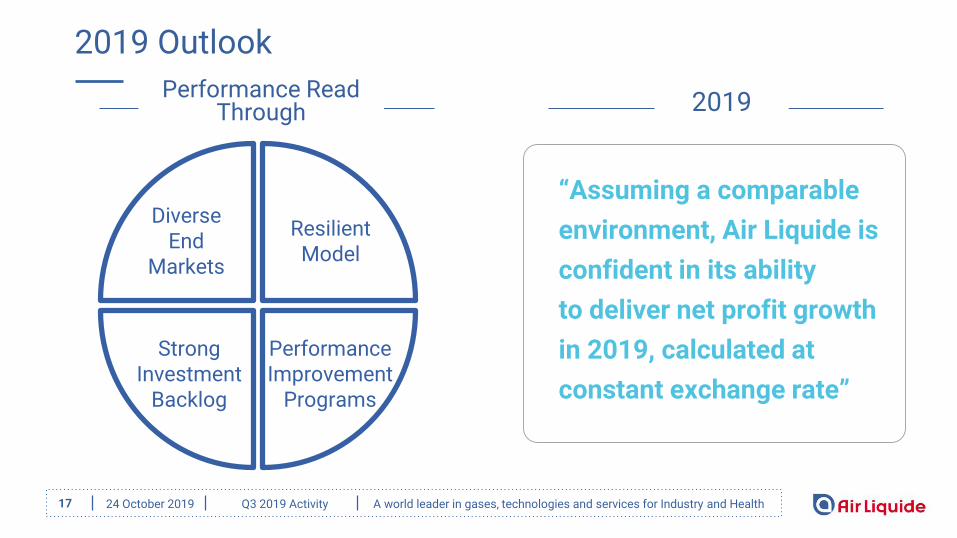
2019 Outlook
24 October 2019 Q3 2019 Activity A world leader in gases, technologies and services for Industry and Health
“Assuming a comparable
environment, Air Liquide is
confident in its ability
to deliver net profit growth
in 2019, calculated at
constant exchange rate”
2019Performance Read
Through
Diverse End
Markets
Resilient Model
StrongInvestment
Backlog
Performance Improvement
Programs

18
Q3 2019Appendix
24 October 2019 Q3 2019 Activity A world leader in gases, technologies and services for Industry and Health

19
Q3 2019 G&S Revenue Breakdown by Region
AMERICAS
€2.1bn
EUROPE
€1.7bn ASIA-PACIFIC
€1.2bn
Large Industries ElectronicsHealthcareIndustrial Merchant
24 October 2019 Q3 2019 Activity A world leader in gases, technologies and services for Industry and Health
€5,242m
20
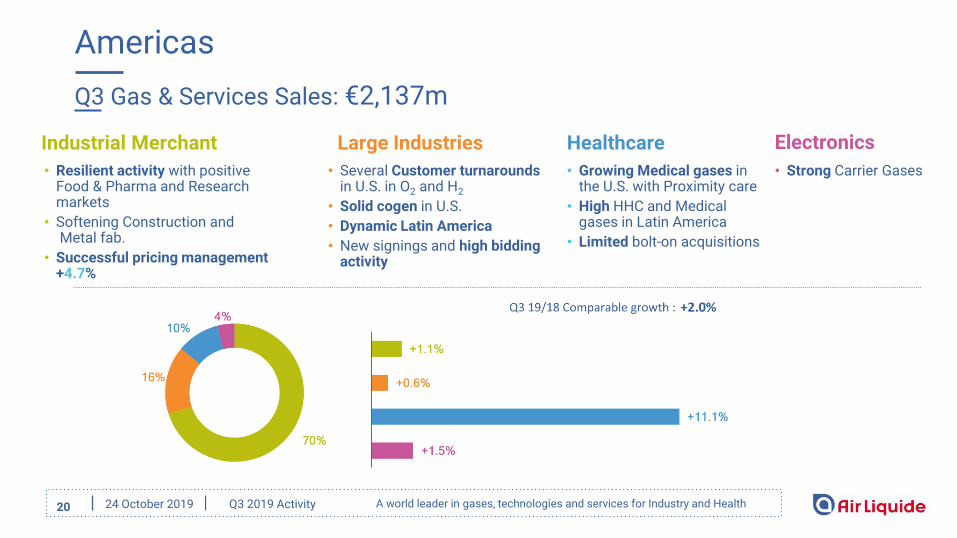
Americas
Q3 Gas & Services Sales: €2,137m
Industrial Merchant Large Industries Healthcare Electronics
• Resilient activity with positive Food & Pharma and Research markets
• Softening Construction andMetal fab.
• Successful pricing management +4.7%
• Several Customer turnarounds in U.S. in O2 and H2
• Solid cogen in U.S.
• Dynamic Latin America
• New signings and high bidding activity
• Growing Medical gases in the U.S. with Proximity care
• High HHC and Medical gases in Latin America
• Limited bolt-on acquisitions
• Strong Carrier Gases
24 October 2019 Q3 2019 Activity A world leader in gases, technologies and services for Industry and Health

21
Europe
Q3 Gas & Services Sales: €1,742m
Industrial Merchant Large Industries Healthcare
• High refining demand in H2
(Benelux)
• Slow Steel and Chemicals in Germany and Italy
• Ramp-Ups in Eastern Europe
• Solid Food and Pharma markets in all countries
• Sustained pricing: +3.3%
• +0.9 working days
• High steady organic growth
• Strong HHC, especially diabetes in Nordics & France and sleep apnea in France
• Robust sales in Hygiene
24 October 2019 Q3 2019 Activity A world leader in gases, technologies and services for Industry and Health

22
Asia-Pacific
Q3 Gas & Services Sales: €1,207m
Industrial Merchant Large Industries Electronics
• Ramp-Ups in China, including Fujian for 2 months
• Strong H2 in Singapore
• China: strong cylinder volumes, lower bulk pricing
• Solid South East Asia
• High Helium across the zone
• Contrasted end-markets by country
• >+10% growth excluding E&I
• High Carrier Gases growth in China, Taiwan, Singapore, Japan and Korea
• Dynamic Advanced Materials in Korea and China
• Lower E&I sales vs. high level in Q3 18
24 October 2019 Q3 2019 Activity A world leader in gases, technologies and services for Industry and Health

23
Industrial Merchant Pricing
24 October 2019 Q3 2019 Activity A world leader in gases, technologies and services for Industry and Health

YTD 2019 – E&C and GM&T Activities
24 24 October 2019 Q3 2019 Activity A world leader in gases, technologies and services for Industry and Health
Engineering & Construction
Sales to third parties(1)
-11%
Order Intake
-24%
Global Markets & Technologies
+17%
+9%
Sales(1)
Order Intake
€500m €362m
€257m €371m
Total Sales: +20%
(1) Comparable growth

25
Increasing Backlog to €2.5bn
See definitions in appendix
24 October 2019 Q3 2019 Activity A world leader in gases, technologies and services for Industry and Health
Dec 2016 Dec 2017 Dec 2018 Decisions Start-ups Sept 2019
Start-upsDecisions
Yearly Sales Backlogafter full Ramp-ups
2.1 2.12.2
€2.5bn
€ 0.9bn
in €bn

26
Impact of Currency and Energy on G&S Revenue
24 October 2019 Q3 2019 Activity A world leader in gases, technologies and services for Industry and Health

27
Revenue Analysis by Quarter and by Business Line
24 October 2019 Q3 2019 Activity A world leader in gases, technologies and services for Industry and Health
28
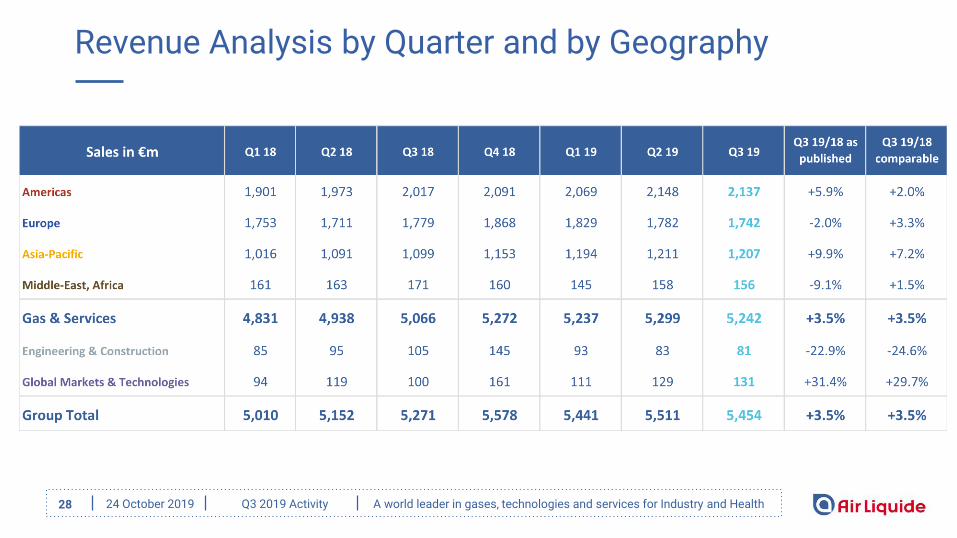
Revenue Analysis by Quarter and by Geography
24 October 2019 Q3 2019 Activity A world leader in gases, technologies and services for Industry and Health

29
G&S Revenue Growth by Quarter and by Impact
24 October 2019 Q3 2019 Activity A world leader in gases, technologies and services for Industry and Health

30
Investment Cycle – Definitions
● Investment opportunities at end of the period
– Investment opportunities under consideration by the Group for decision within 12 months.
– Industrial projects with investment value > €5m for Large Industries and > €3m for other business lines.
– Includes asset replacements or efficiency projects. Excludes maintenance and safety.
● Investment backlog at end of the period
– Cumulated industrial investment value of projects decided but not yet started.
– Industrial projects with value > €10m, including asset replacements or efficiency projects, excluding maintenance and safety.
●Sales backlog
– Cumulated expected sales per year generated by the current investment backlog after full ramp-up.
●Decisions of the period
– Cumulated value of industrial and financial investment decisions.
– Industrial, growth and non-growth projects including asset replacements, efficiency, maintenance and safety.
– Financial decisions (acquisitions).
24 October 2019 Q3 2019 Activity A world leader in gases, technologies and services for Industry and Health

0,0
0,5
1,0
1,5
2,0
2,5
3,0
1988 1990 1992 1994 1996 1998 2000 2002 2004 2006 2008 2010 2012 2014 2016 2018
0,0
1,0
2,0
3,0
4,0
5,0
1988 1990 1992 1994 1996 1998 2000 2002 2004 2006 2008 2010 2012 2014 2016 2018
Regular and Sustained Performance
0
4 000
8 000
12 000
16 000
20 000
24 000
1988 1990 1992 1994 1996 1998 2000 2002 2004 2006 2008 2010 2012 2014 2016 2018
0
1 000
2 000
3 000
4 000
1988 1990 1992 1994 1996 1998 2000 2002 2004 2006 2008 2010 2012 2014 2016 2018
Revenue (in €m) EPS(2) (in €)
Cashflow (in €m)
(1) Calculated according to prevailing accounting rules over 30 years.(2) Adjusted for the 2-for-1 share split in 2007, for attributions of free shares and for a factor of 0.974 reflecting the value of the rights of the capital increase
completed in October 2016.
Dividend(2) (in € per share)
31 24 October 2019 Q3 2019 Activity A world leader in gases, technologies and services for Industry and Health
CAGR over 30 years(1)
+5.8% +6.9%
+6.5% +8.3%
32
For further information, please contact:
Investor Relations
Aude Rodriguez + 33 (0)1 40 62 57 08
Ludmilla Binet + 33 (0)1 40 62 57 37
Muriel Légeron + 33 (0)1 40 62 50 18
Joseph Marczely + 1 610 263 8277
Communication
Alexandra Rocca + 33 (0)1 40 62 50 93
Annie Fournier + 33 (0)1 40 62 51 31
www.airliquide.com Follow us on Twitter @AirLiquideGroup
L’Air Liquide S.A.
Corporation for the study and application of processes developed by Georges Claude
with registered capital of 2,601,601,920.50 euros
Corporate Headquarters:
75, Quai d’Orsay
75321 Paris Cedex 07
Tel : +33 (0)1 40 62 55 55
RCS Paris 552 096 281
A world leader in gases, technologies and services for Industry and Health24 October 2019 Q3 2019 Activity