Q3 2016 Tech Tracker Report - Ipsos€¦ · ... q3 2016 tech tracker quarterly release: q3 2016....
41
TECHNOLOGY TRACKER | QUARTERLY RELEASE: Q3 2016 TECH TRACKER QUARTERLY RELEASE: Q3 2016
-
Upload
duongkhanh -
Category
Documents
-
view
216 -
download
0
Transcript of Q3 2016 Tech Tracker Report - Ipsos€¦ · ... q3 2016 tech tracker quarterly release: q3 2016....
TECHNOLOGY TRACKER | QUARTERLY RELEASE: Q3 2016
TECH TRACKERQUARTERLY RELEASE:
Q3 2016
TECHNOLOGY TRACKER | QUARTERLY RELEASE: Q3 2016
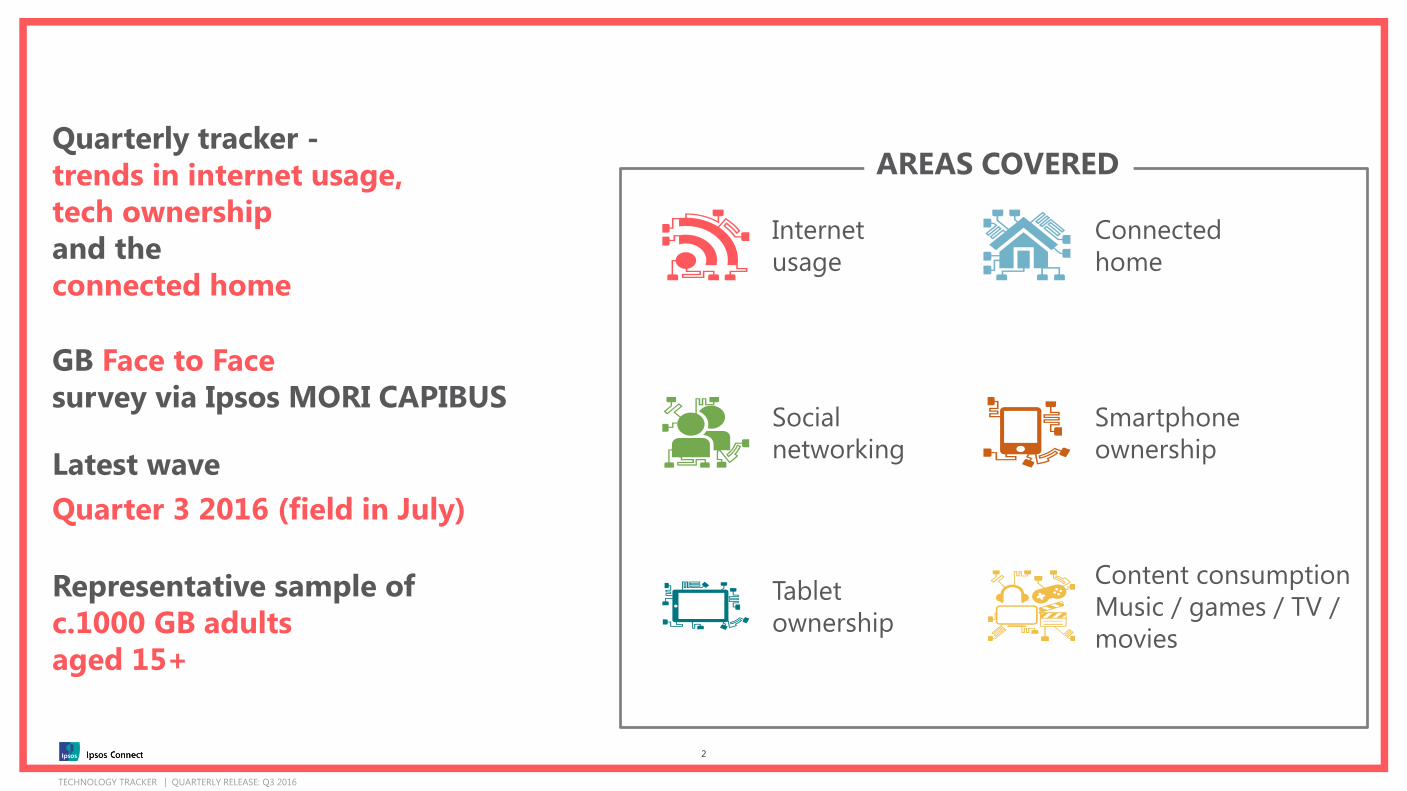
Quarterly tracker -
trends in internet usage,
tech ownership
and the
connected home
GB Face to Face
survey via Ipsos MORI CAPIBUS
Latest wave
Quarter 3 2016 (field in July)
Representative sample of
c.1000 GB adults
aged 15+
2
Smartphone
ownership
Social
networking
Connected
home
Internet
usage
Content consumption
Music / games / TV /
movies
Tablet
ownership
AREAS COVERED
TECHNOLOGY TRACKER | QUARTERLY RELEASE: Q3 2016
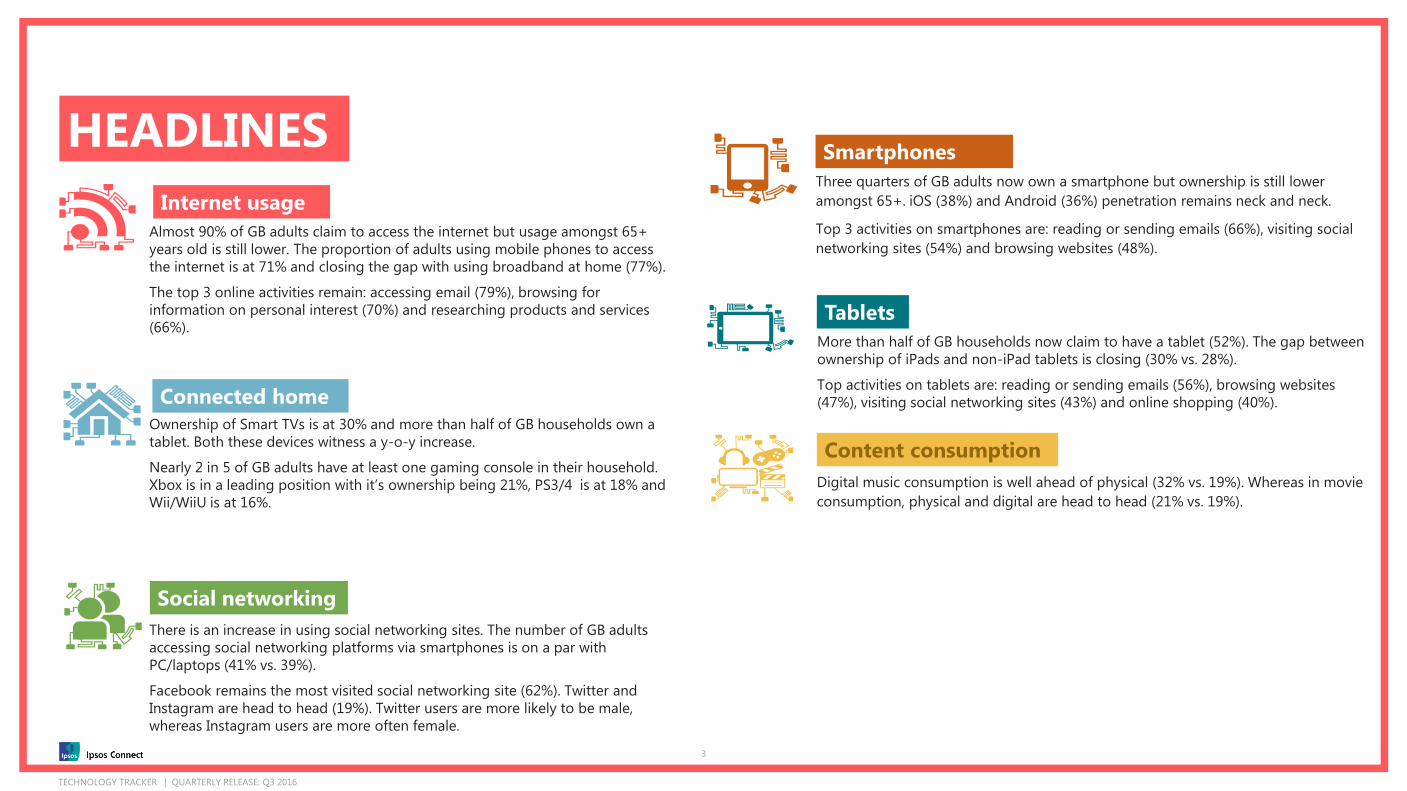
HEADLINES
3
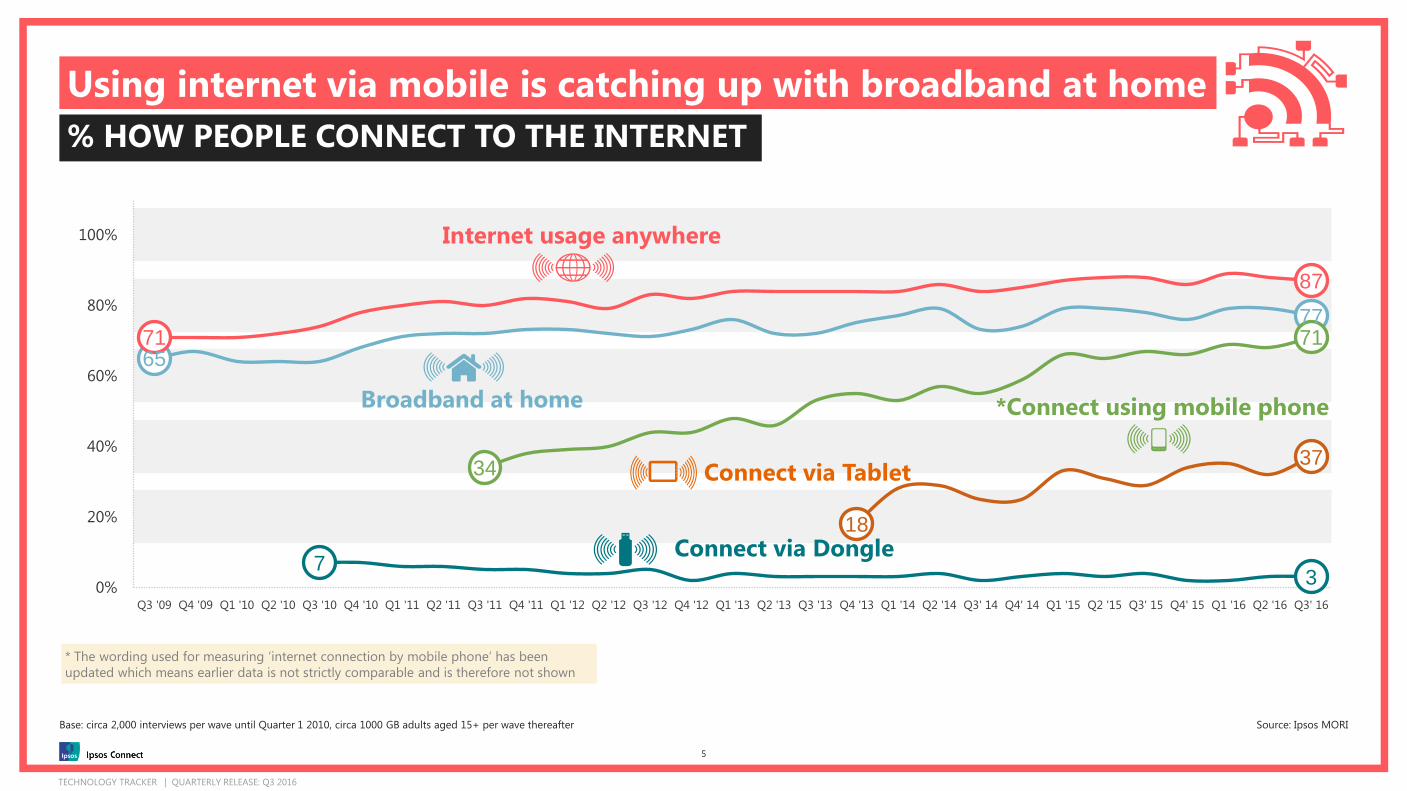
Almost 90% of GB adults claim to access the internet but usage amongst 65+
years old is still lower. The proportion of adults using mobile phones to access
the internet is at 71% and closing the gap with using broadband at home (77%).
The top 3 online activities remain: accessing email (79%), browsing for
information on personal interest (70%) and researching products and services
(66%).
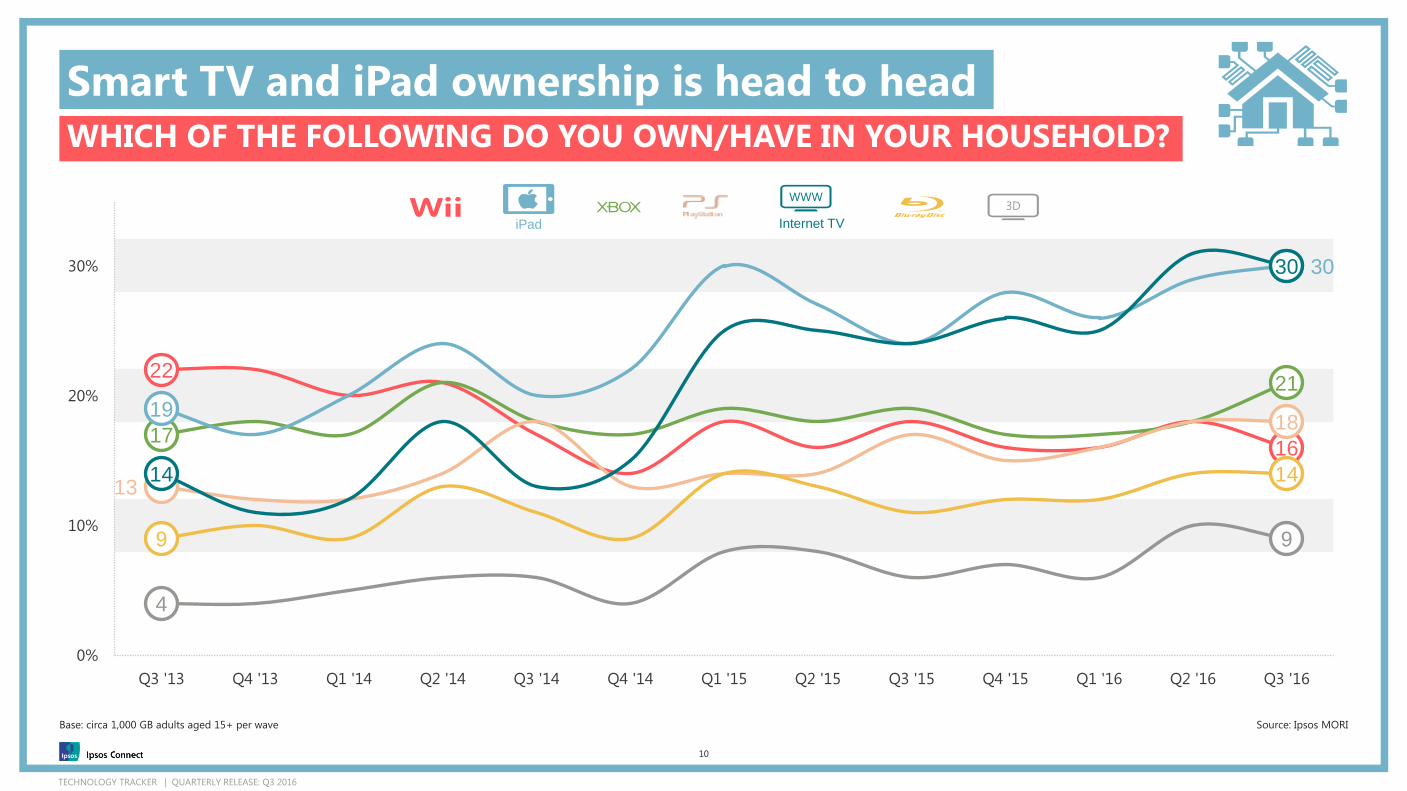
Ownership of Smart TVs is at 30% and more than half of GB households own a
tablet. Both these devices witness a y-o-y increase.
Nearly 2 in 5 of GB adults have at least one gaming console in their household.
Xbox is in a leading position with it’s ownership being 21%, PS3/4 is at 18% and
Wii/WiiU is at 16%.
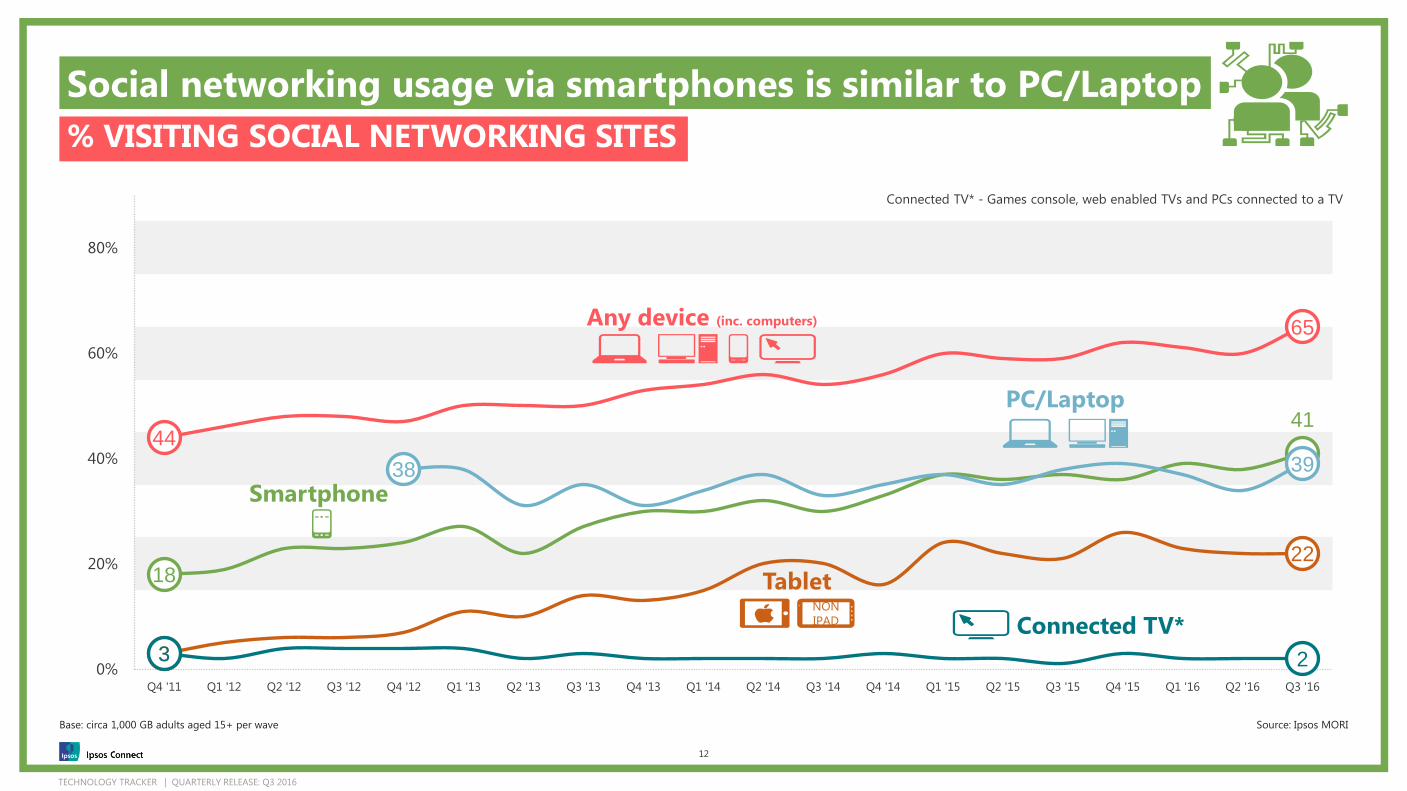
There is an increase in using social networking sites. The number of GB adults
accessing social networking platforms via smartphones is on a par with
PC/laptops (41% vs. 39%).
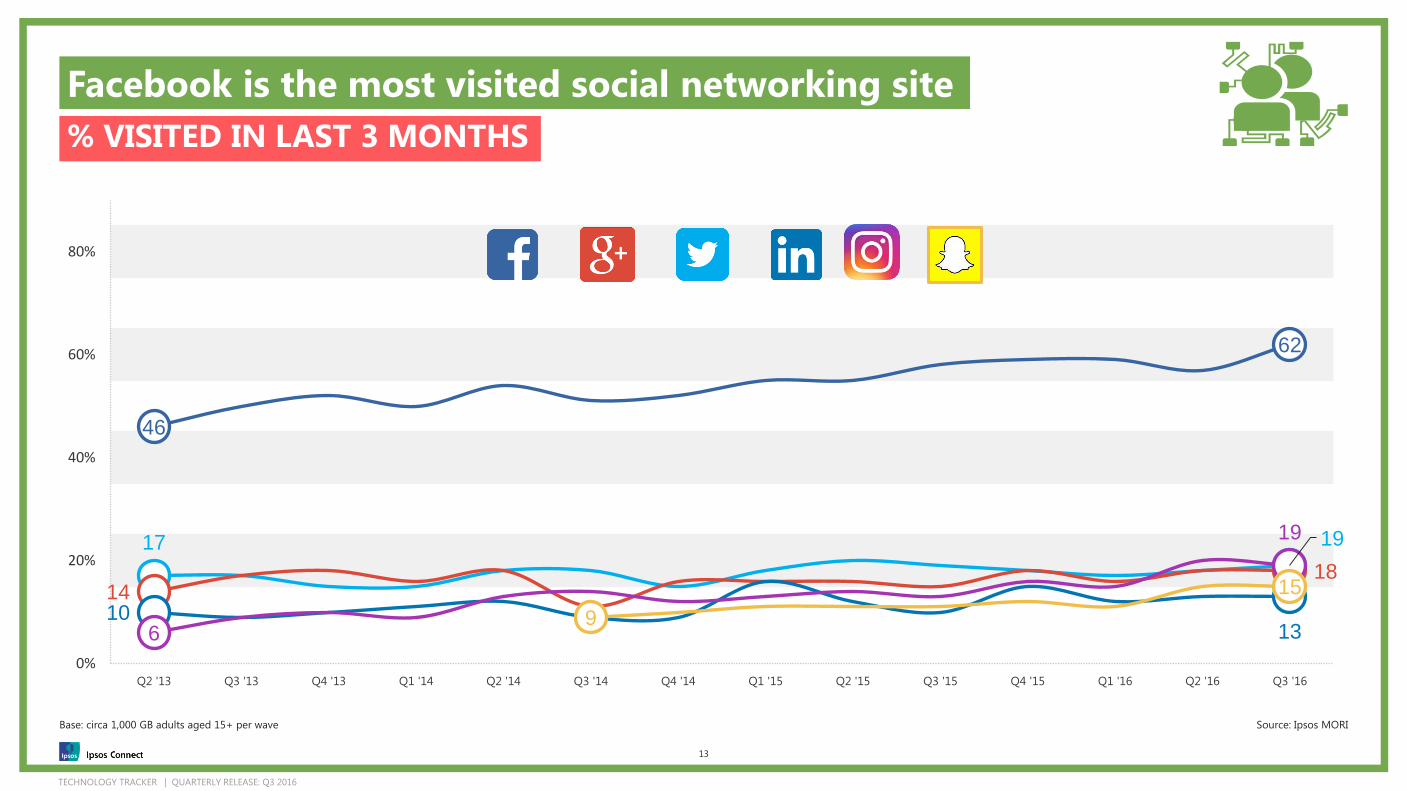
Facebook remains the most visited social networking site (62%). Twitter and
Instagram are head to head (19%). Twitter users are more likely to be male,
whereas Instagram users are more often female.
More than half of GB households now claim to have a tablet (52%). The gap between
ownership of iPads and non-iPad tablets is closing (30% vs. 28%).
Top activities on tablets are: reading or sending emails (56%), browsing websites
(47%), visiting social networking sites (43%) and online shopping (40%).
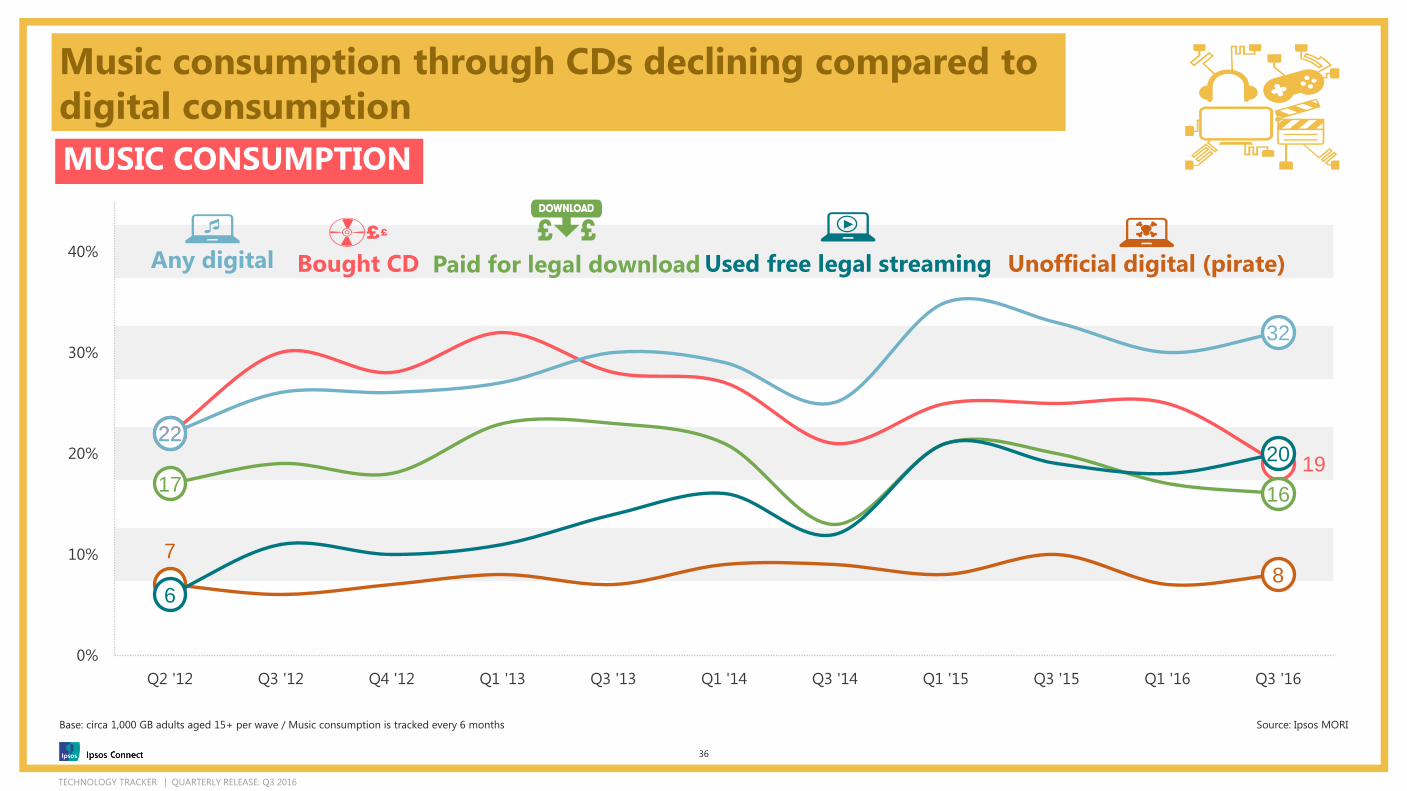
Digital music consumption is well ahead of physical (32% vs. 19%). Whereas in movie
consumption, physical and digital are head to head (21% vs. 19%).
Internet usage
Connected home
Social networking
Tablets
Content consumption
Three quarters of GB adults now own a smartphone but ownership is still lower
amongst 65+. iOS (38%) and Android (36%) penetration remains neck and neck.
Top 3 activities on smartphones are: reading or sending emails (66%), visiting social
networking sites (54%) and browsing websites (48%).
Smartphones
TECHNOLOGY TRACKER | QUARTERLY RELEASE: Q3 2016 | Strictly Confidential
INTERNET USAGEHOW, WHEN, WHERE
TECHNOLOGY TRACKER | QUARTERLY RELEASE: Q3 2016
65
7771
87
73
34
71
18
37
0%
20%
40%
60%
80%
100%
Q3 '09 Q4 '09 Q1 '10 Q2 '10 Q3 '10 Q4 '10 Q1 '11 Q2 '11 Q3 '11 Q4 '11 Q1 '12 Q2 '12 Q3 '12 Q4 '12 Q1 '13 Q2 '13 Q3 '13 Q4 '13 Q1 '14 Q2 '14 Q3' 14 Q4' 14 Q1 '15 Q2 '15 Q3' 15 Q4' 15 Q1 '16 Q2 '16 Q3' 16
Using internet via mobile is catching up with broadband at home
% HOW PEOPLE CONNECT TO THE INTERNET
5
Base: circa 2,000 interviews per wave until Quarter 1 2010, circa 1000 GB adults aged 15+ per wave thereafter Source: Ipsos MORI
* The wording used for measuring ‘internet connection by mobile phone’ has been
updated which means earlier data is not strictly comparable and is therefore not shown
Internet usage anywhere
Broadband at home *Connect using mobile phone
Connect via Dongle
Connect via Tablet
* The wording used for measuring ‘internet connection by mobile phone’ has been
updated which means earlier data is not strictly comparable and is therefore not shown
TECHNOLOGY TRACKER | QUARTERLY RELEASE: Q3 2016
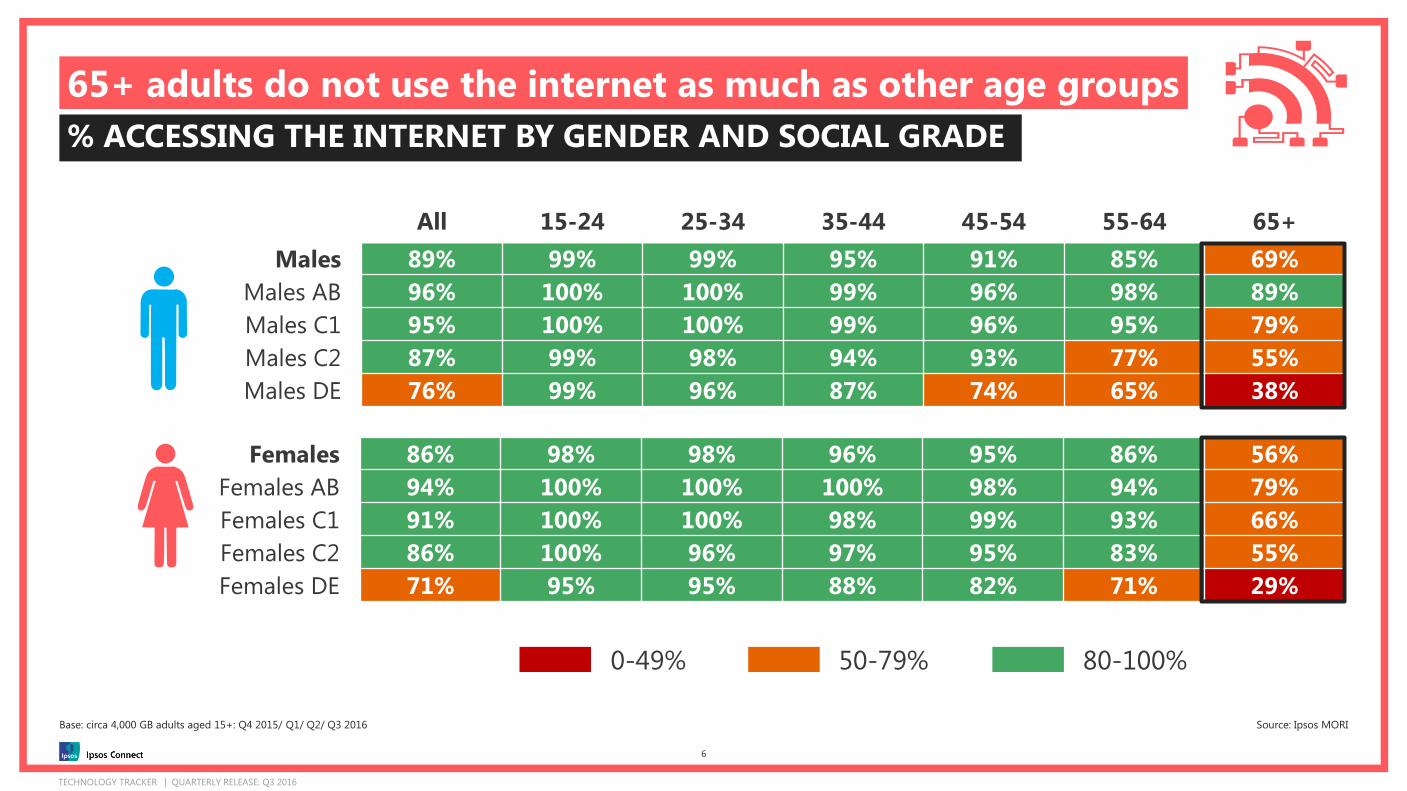
Females 86% 98% 98% 96% 95% 86% 56%
Females AB 94% 100% 100% 100% 98% 94% 79%
Females C1 91% 100% 100% 98% 99% 93% 66%
Females C2 86% 100% 96% 97% 95% 83% 55%
Females DE 71% 95% 95% 88% 82% 71% 29%
65+ adults do not use the internet as much as other age groups
% ACCESSING THE INTERNET BY GENDER AND SOCIAL GRADE
6
Source: Ipsos MORI
80-100%50-79%0-49%
All 15-24 25-34 35-44 45-54 55-64 65+
Males 89% 99% 99% 95% 91% 85% 69%
Males AB 96% 100% 100% 99% 96% 98% 89%
Males C1 95% 100% 100% 99% 96% 95% 79%
Males C2 87% 99% 98% 94% 93% 77% 55%
Males DE 76% 99% 96% 87% 74% 65% 38%
Base: circa 4,000 GB adults aged 15+: Q4 2015/ Q1/ Q2/ Q3 2016

TECHNOLOGY TRACKER | QUARTERLY RELEASE: Q3 2016
0%
20%
40%
60%
80%
Q3 '12 Q4 '12 Q1 '13 Q2 '13 Q3 '13 Q4 '13 Q1 '14 Q2 '14 Q3 '14 Q4 '14 Q1 '15 Q2 '15 Q4 '15 Q1 '16 Q2 '16 Q3 '16
79% Emails
70% Visit sites for info on personal interests
66% Visit sites for info on products thinking of buying
63% Visit sites to buy products online
56% Social networking
52% Check bank account/ other financial holdings
33% Download/ stream TV
30% Download/ stream music
25% Download/ stream movies
19% Play video games online
Downloading and streaming content increasing overtime
% USE OF THE INTERNET IN THE PAST 3 MONTHS
7
Base: circa 2,000 interviews per wave until Quarter 1 2010, circa 1,000 GB adults aged 15+ per wave thereafter Source: Ipsos MORI
Not asked in Q3 2015
TECHNOLOGY TRACKER | QUARTERLY RELEASE: Q3 2016 | Strictly Confidential
CONNECTED HOME

TECHNOLOGY TRACKER | QUARTERLY RELEASE: Q3 2016
More than half of the GB households own a tablet
(y-o-y increase)
82%
71%
59%
35%
14%
49%
51%
30%
9%
39%
16%
18%
21%
52%
25%
30%
Personal computer OR Laptop
Laptop
DVD player
Personal video recorder (PVR)
Blu-ray player (excl. PS3)
Digital TV via aerial/Freeview/Freesat
Satellite/ Cable TV
TV with internet built in
3D TV
Games consoles
Wii/WiiU
PS3/4
Xbox360/XboxOne
Tablet computer
ebook reader
iPad
WHICH OF THE FOLLOWING DO YOU OWN/HAVE IN YOUR HOUSEHOLD?
9
Source: Ipsos MORI
Q3'15
82%
71%
58%
34%
11%
54%
51%
24%
6%
37%
18%
17%
19%
43%
19%
24%
Base: circa 1,000 GB adults aged 15+: Quarter 3 2016
TECHNOLOGY TRACKER | QUARTERLY RELEASE: Q3 2016
Smart TV and iPad ownership is head to head
22
1617
21
13
18
9
14
19
30
14
30
4
9
0%
10%
20%
30%
Q3 '13 Q4 '13 Q1 '14 Q2 '14 Q3 '14 Q4 '14 Q1 '15 Q2 '15 Q3 '15 Q4 '15 Q1 '16 Q2 '16 Q3 '16
WHICH OF THE FOLLOWING DO YOU OWN/HAVE IN YOUR HOUSEHOLD?
10
Base: circa 1,000 GB adults aged 15+ per wave Source: Ipsos MORI
3D
iPad
WWW
Internet TV

TECHNOLOGY TRACKER | QUARTERLY RELEASE: Q3 2016
SOCIAL NETWORKING
TECHNOLOGY TRACKER | QUARTERLY RELEASE: Q3 2016
Social networking usage via smartphones is similar to PC/Laptop
3
2218
41
3 2
44
65
38 39
0%
20%
40%
60%
80%
Q4 '11 Q1 '12 Q2 '12 Q3 '12 Q4 '12 Q1 '13 Q2 '13 Q3 '13 Q4 '13 Q1 '14 Q2 '14 Q3 '14 Q4 '14 Q1 '15 Q2 '15 Q3 '15 Q4 '15 Q1 '16 Q2 '16 Q3 '16
% VISITING SOCIAL NETWORKING SITES
12
Base: circa 1,000 GB adults aged 15+ per wave Source: Ipsos MORI
Smartphone
Any device (inc. computers)
Connected TV* - Games console, web enabled TVs and PCs connected to a TV
NON
IPAD
Tablet
Connected TV*
PC/Laptop
TECHNOLOGY TRACKER | QUARTERLY RELEASE: Q3 2016
Facebook is the most visited social networking site
46
62
17 19
1418
10136
19
9
15
0%
20%
40%
60%
80%
Q2 '13 Q3 '13 Q4 '13 Q1 '14 Q2 '14 Q3 '14 Q4 '14 Q1 '15 Q2 '15 Q3 '15 Q4 '15 Q1 '16 Q2 '16 Q3 '16
% VISITED IN LAST 3 MONTHS
13
Base: circa 1,000 GB adults aged 15+ per wave Source: Ipsos MORI

TECHNOLOGY TRACKER | QUARTERLY RELEASE: Q3 2016
48
52
21
24
20
17
19
28
27
23
23
90
61
Male
Female
15-24
25-34
35-44
45-54
55+
AB
C1
C2
DE
Own Smartphone
Own Tablet
ALL ADULTS
49%
51%
15%
17%
16%
17%
36%
27%
27%
21%
24%
75%
52%
Facebook users are almost evenly spread across demographic groups…
14
Source: Ipsos MORIBase: circa GB adults (1,000) / All visiting / using Facebook in last 3 months (573) Q3 2016
The profile of Facebook users
continues to be evenly spread
across the GB adult population in
terms of age, with both the young
and older demographics making
up relatively level proportions of
usage.
Smartphone and tablet ownership
is higher amongst Facebook users
than the GB adult population with
in 9 in 10 owning a smartphone
and more than 3 in 5 owning a
tablet.
TECHNOLOGY TRACKER | QUARTERLY RELEASE: Q3 2016
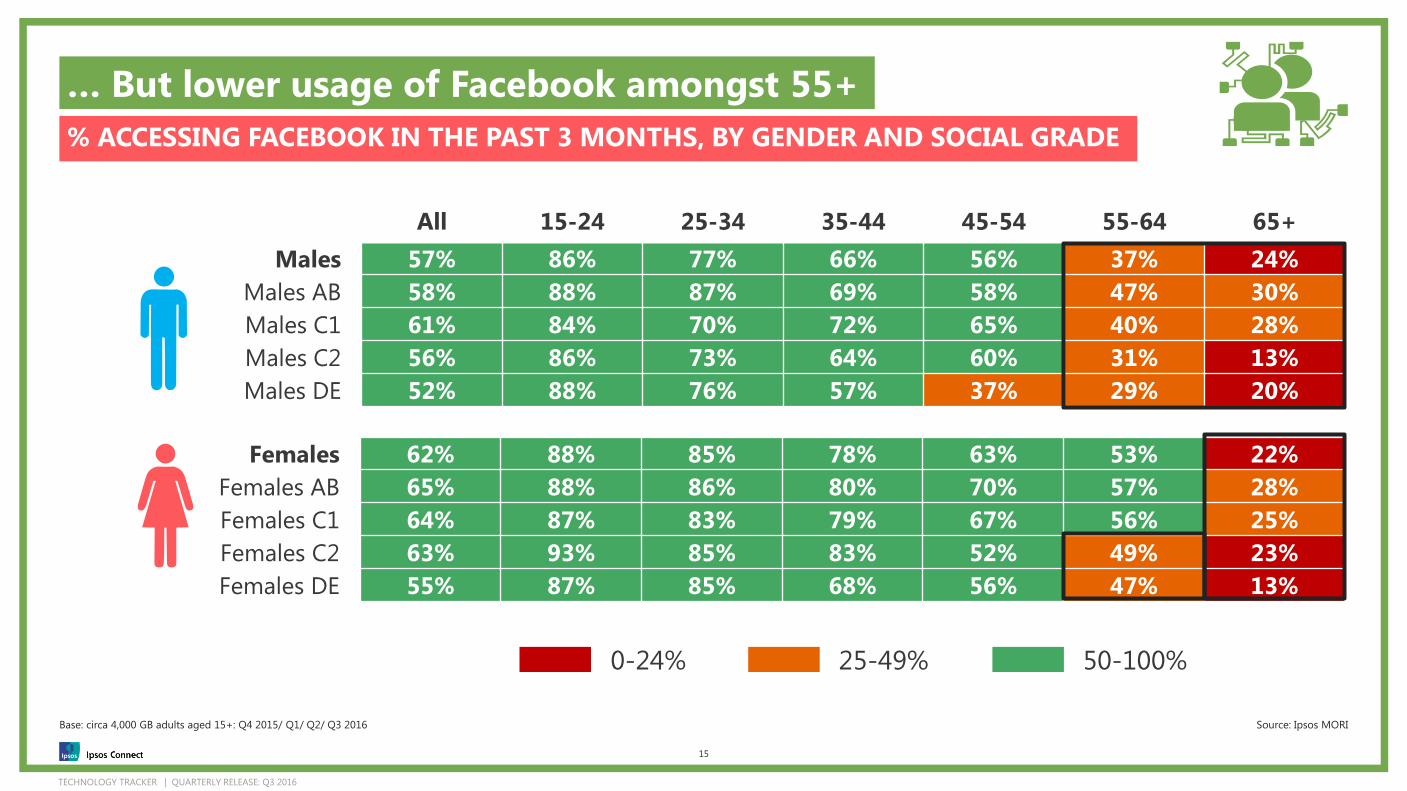
Females 62% 88% 85% 78% 63% 53% 22%
Females AB 65% 88% 86% 80% 70% 57% 28%
Females C1 64% 87% 83% 79% 67% 56% 25%
Females C2 63% 93% 85% 83% 52% 49% 23%
Females DE 55% 87% 85% 68% 56% 47% 13%
… But lower usage of Facebook amongst 55+
% ACCESSING FACEBOOK IN THE PAST 3 MONTHS, BY GENDER AND SOCIAL GRADE
15
Source: Ipsos MORI
50-100%25-49%0-24%
All 15-24 25-34 35-44 45-54 55-64 65+
Males 57% 86% 77% 66% 56% 37% 24%
Males AB 58% 88% 87% 69% 58% 47% 30%
Males C1 61% 84% 70% 72% 65% 40% 28%
Males C2 56% 86% 73% 64% 60% 31% 13%
Males DE 52% 88% 76% 57% 37% 29% 20%
Base: circa 4,000 GB adults aged 15+: Q4 2015/ Q1/ Q2/ Q3 2016

TECHNOLOGY TRACKER | QUARTERLY RELEASE: Q3 2016
49
51
21
21
19
17
22
33
28
15
23
93
66
Male
Female
15-24
25-34
35-44
45-54
55+
AB
C1
C2
DE
Own Smartphone
Own Tablet
ALL ADULTS
49%
51%
15%
17%
16%
17%
36%
27%
27%
21%
24%
75%
52%
Similar usage of Google+ amongst 55+ vs. younger adults (15-34)
16
Source: Ipsos MORI
Google+ users are
also evenly split among males
and females and all age
groups.
More than 9 in 10 own
smartphones and 3 in 5 own
tablets. Both smartphone and
tablet ownership continues to
be higher than the GB
population
Base: circa GB adults (1,000) / All visiting / using Google+ in last 3 months (181) Q3 2016

TECHNOLOGY TRACKER | QUARTERLY RELEASE: Q3 2016
Females 18% 29% 22% 23% 21% 15% 5%
Females AB 18% 26% 21% 24% 23% 16% 7%
Females C1 19% 32% 22% 23% 18% 16% 7%
Females C2 17% 27% 20% 18% 18% 16% 5%
Females DE 19% 28% 27% 27% 27% 13% 3%
Overall low usage of Google+ across demographics
% ACCESSING GOOGLE+ IN THE PAST 3 MONTHS, BY GENDER AND SOCIAL GRADE
17
Source: Ipsos MORI
50-100%25-49%0-24%
All 15-24 25-34 35-44 45-54 55-64 65+
Males 17% 24% 19% 20% 16% 17% 8%
Males AB 18% 16% 25% 26% 14% 21% 11%
Males C1 17% 23% 15% 20% 20% 12% 13%
Males C2 14% 21% 13% 18% 18% 16% 2%
Males DE 18% 33% 25% 15% 12% 18% 3%
Base: circa 4,000 GB adults aged 15+: Q4 2015/ Q1/ Q2/ Q3 2016
TECHNOLOGY TRACKER | QUARTERLY RELEASE: Q3 2016
53
47
27
23
24
14
12
39
33
19
9
97
71
Male
Female
15-24
25-34
35-44
45-54
55+
AB
C1
C2
DE
Own Smartphone
Own Tablet
ALL ADULTS
49%
51%
15%
17%
16%
17%
36%
27%
27%
21%
24%
75%
52%
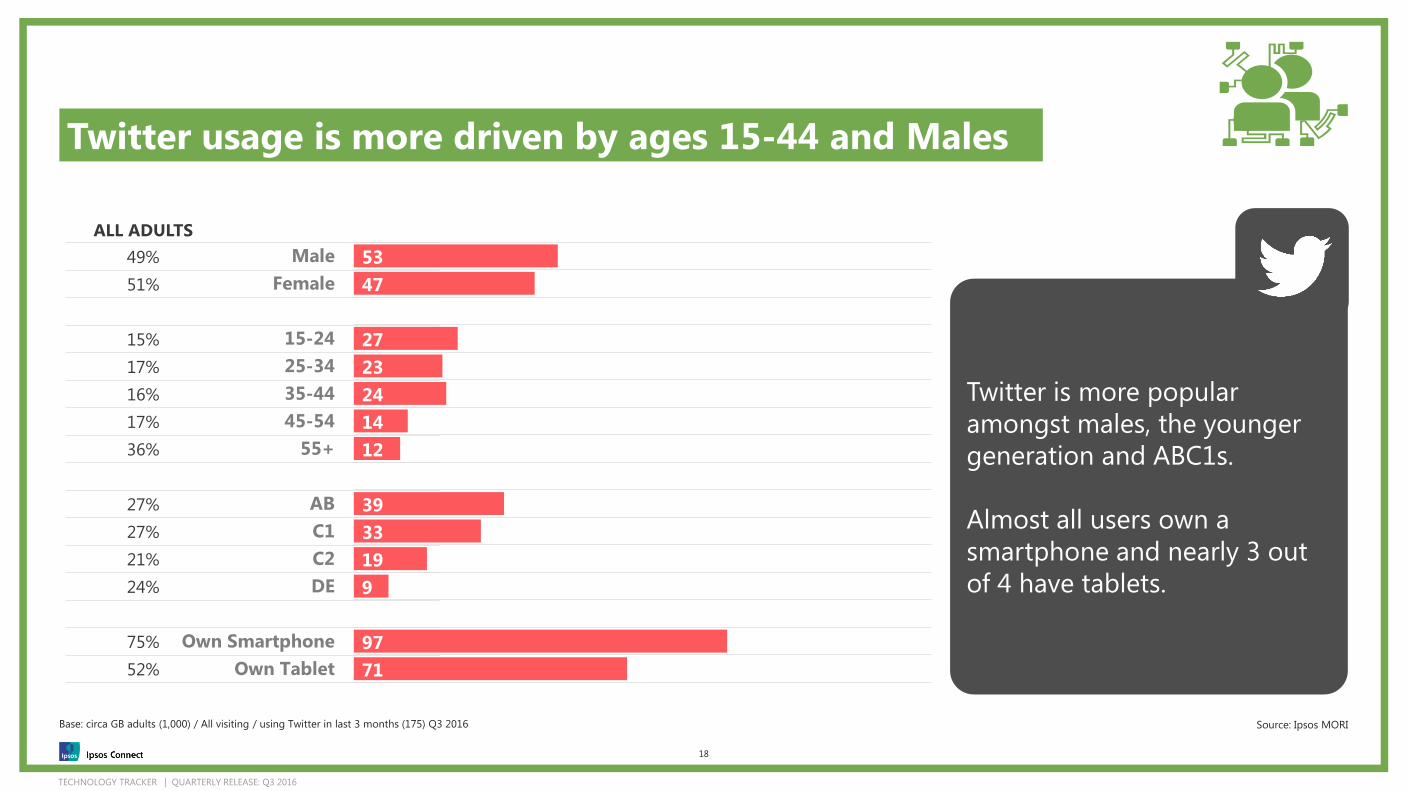
Twitter usage is more driven by ages 15-44 and Males
18
Source: Ipsos MORIBase: circa GB adults (1,000) / All visiting / using Twitter in last 3 months (175) Q3 2016
Twitter is more popular
amongst males, the younger
generation and ABC1s.
Almost all users own a
smartphone and nearly 3 out
of 4 have tablets.
TECHNOLOGY TRACKER | QUARTERLY RELEASE: Q3 2016
Females 16% 35% 21% 19% 14% 10% 2%
Females AB 22% 39% 30% 29% 25% 18% 3%
Females C1 17% 38% 20% 20% 17% 7% 4%
Females C2 14% 40% 20% 11% 3% 10% 3%
Females DE 10% 28% 14% 13% 3% 3% 0%
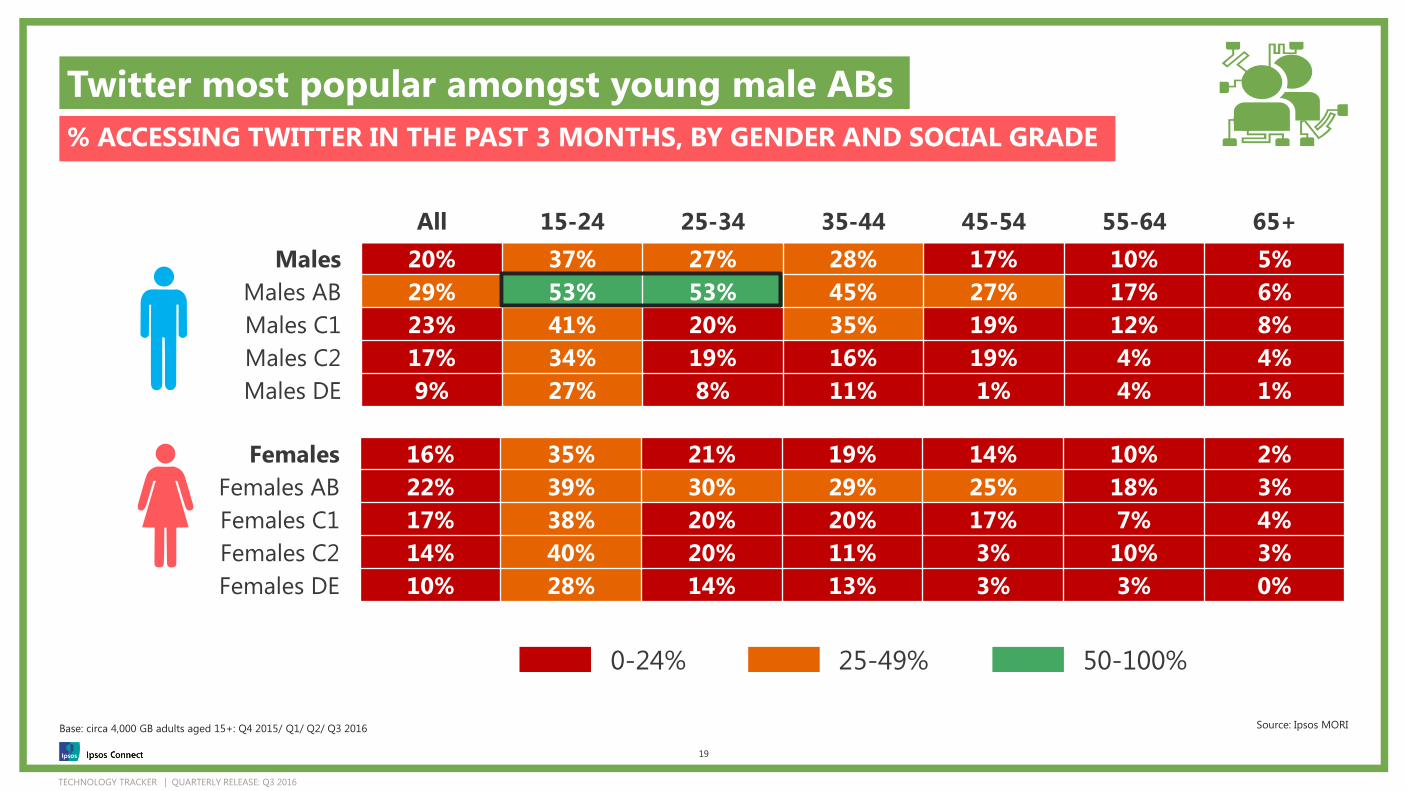
Twitter most popular amongst young male ABs
% ACCESSING TWITTER IN THE PAST 3 MONTHS, BY GENDER AND SOCIAL GRADE
19
Source: Ipsos MORI
50-100%25-49%0-24%
All 15-24 25-34 35-44 45-54 55-64 65+
Males 20% 37% 27% 28% 17% 10% 5%
Males AB 29% 53% 53% 45% 27% 17% 6%
Males C1 23% 41% 20% 35% 19% 12% 8%
Males C2 17% 34% 19% 16% 19% 4% 4%
Males DE 9% 27% 8% 11% 1% 4% 1%
Base: circa 4,000 GB adults aged 15+: Q4 2015/ Q1/ Q2/ Q3 2016
TECHNOLOGY TRACKER | QUARTERLY RELEASE: Q3 2016
64
36
12
21
26
23
19
47
35
12
6
95
75
Male
Female
15-24
25-34
35-44
45-54
55+
AB
C1
C2
DE
Own Smartphone
Own Tablet
ALL ADULTS
49%
51%
15%
17%
16%
17%
36%
27%
27%
21%
24%
75%
52%
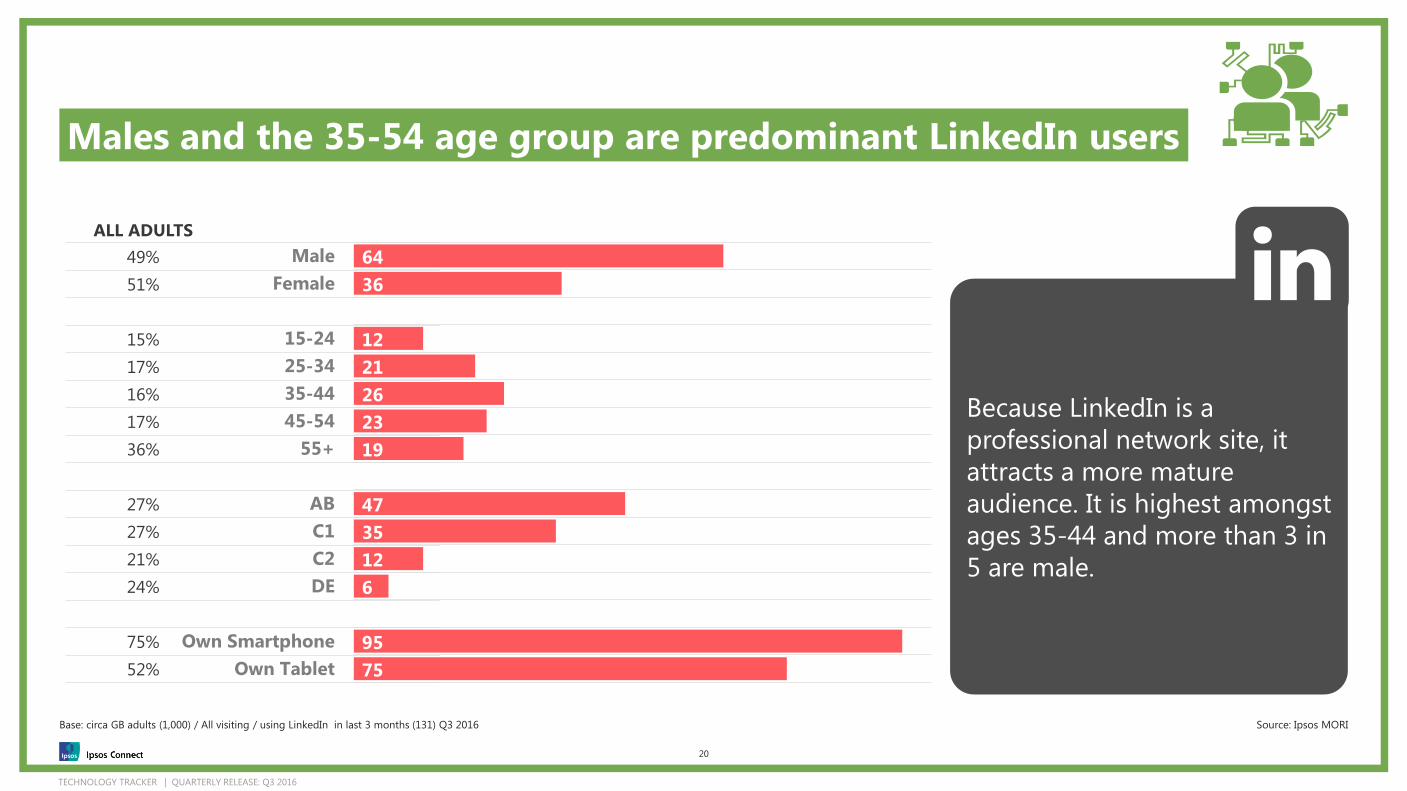
Males and the 35-54 age group are predominant LinkedIn users
20
Source: Ipsos MORI
Because LinkedIn is a
professional network site, it
attracts a more mature
audience. It is highest amongst
ages 35-44 and more than 3 in
5 are male.
Base: circa GB adults (1,000) / All visiting / using LinkedIn in last 3 months (131) Q3 2016

TECHNOLOGY TRACKER | QUARTERLY RELEASE: Q3 2016
Females 10% 10% 13% 13% 14% 10% 3%
Females AB 22% 15% 24% 29% 28% 21% 11%
Females C1 11% 17% 18% 10% 16% 5% 1%
Females C2 5% 4% 5% 6% 5% 12% 0%
Females DE 2% 4% 3% 3% 0% 1% 0%
LinkedIn is used more by ABs
% ACCESSING LINKEDIN IN THE PAST 3 MONTHS, BY GENDER AND SOCIAL GRADE
21
Source: Ipsos MORI
50-100%25-49%0-24%
All 15-24 25-34 35-44 45-54 55-64 65+
Males 17% 12% 19% 25% 22% 17% 8%
Males AB 31% 25% 40% 44% 39% 33% 13%
Males C1 22% 14% 25% 33% 32% 19% 7%
Males C2 6% 8% 6% 7% 9% 4% 1%
Males DE 5% 7% 0% 5% 1% 8% 5%
Base: circa 4,000 GB adults aged 15+: Q4 2015/ Q1/ Q2/ Q3 2016

TECHNOLOGY TRACKER | QUARTERLY RELEASE: Q3 2016
41
59
42
27
17
7
7
32
34
17
18
98
71
Male
Female
15-24
25-34
35-44
45-54
55+
AB
C1
C2
DE
Own Smartphone
Own Tablet
ALL ADULTS
49%
51%
15%
17%
16%
17%
36%
27%
27%
21%
24%
75%
52%
Instagram is more popular amongst females and 15-24 year olds
22
Source: Ipsos MORIBase: circa GB adults (1,000) / All visiting / using Instagram in last 3 months (172) Q3 2016
More than half of Instagram
users are female, almost half of
them aged 15-24 and with
more than 6 in 10 being ABC1.
Instagram’s functionality lends
itself to almost universal
Smartphone ownership
amongst its users.
TECHNOLOGY TRACKER | QUARTERLY RELEASE: Q3 2016
Females 19% 55% 32% 21% 10% 6% 1%
Females AB 21% 70% 41% 24% 18% 8% 1%
Females C1 21% 56% 30% 24% 13% 7% 1%
Females C2 18% 48% 28% 21% 3% 6% 1%
Females DE 16% 52% 29% 11% 3% 3% 0%
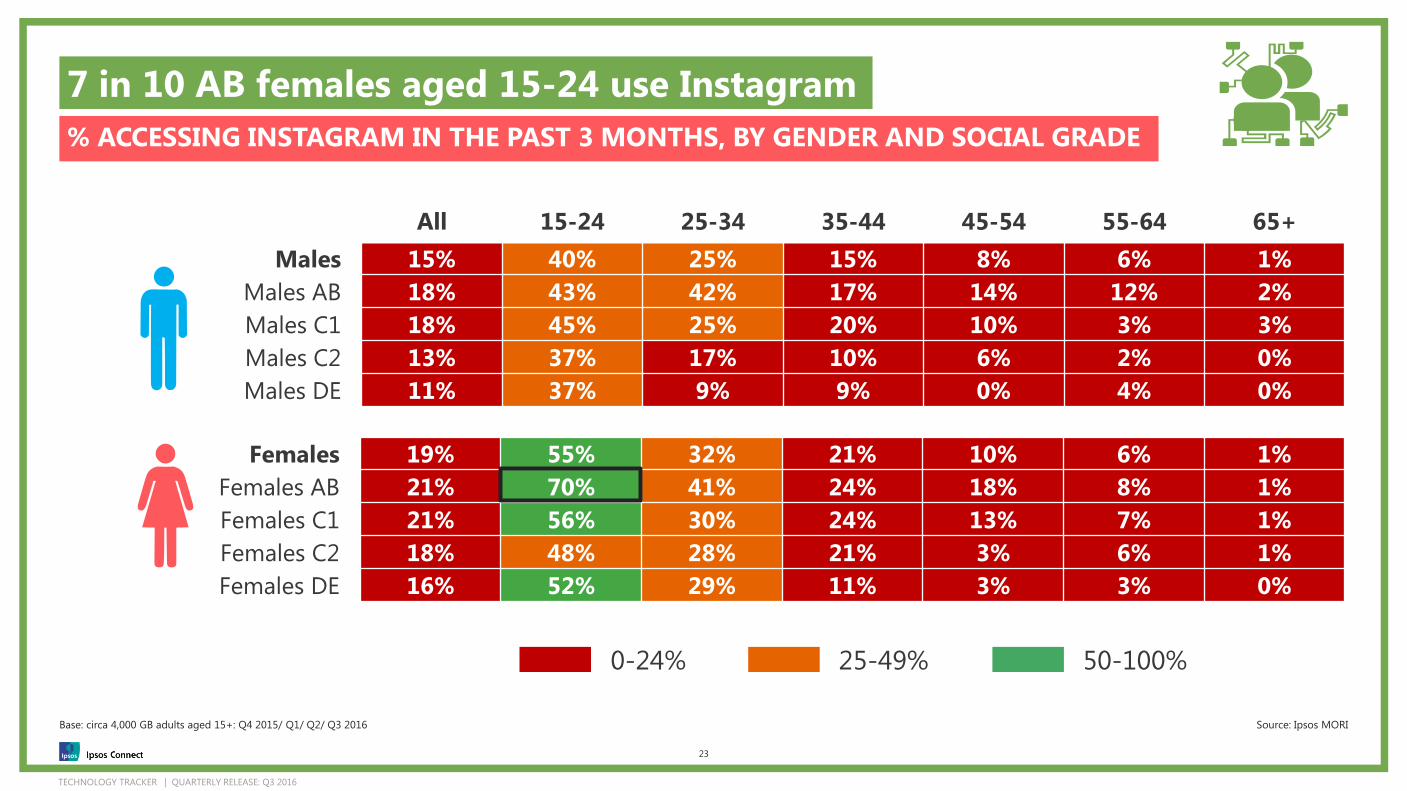
7 in 10 AB females aged 15-24 use Instagram
% ACCESSING INSTAGRAM IN THE PAST 3 MONTHS, BY GENDER AND SOCIAL GRADE
23
Source: Ipsos MORI
50-100%25-49%0-24%
All 15-24 25-34 35-44 45-54 55-64 65+
Males 15% 40% 25% 15% 8% 6% 1%
Males AB 18% 43% 42% 17% 14% 12% 2%
Males C1 18% 45% 25% 20% 10% 3% 3%
Males C2 13% 37% 17% 10% 6% 2% 0%
Males DE 11% 37% 9% 9% 0% 4% 0%
Base: circa 4,000 GB adults aged 15+: Q4 2015/ Q1/ Q2/ Q3 2016

TECHNOLOGY TRACKER | QUARTERLY RELEASE: Q3 2016
ALL ADULTS
49%
51%
15%
17%
16%
17%
36%
27%
27%
21%
24%
75%
52%
38
62
55
31
5
7
2
30
29
20
21
98
74
Male
Female
15-24
25-34
35-44
45-54
55+
AB
C1
C2
DE
Own Smartphone
Own Tablet
Snapchat users are also mainly female and 15-24 years old
24
Source: Ipsos MORI
More than half of all Snapchat
users are aged 15-24. They are
more likely to be ABC1 and
female.
Snapchat functionality also
lends itself to almost universal
smartphone ownership.
Base: circa GB adults (1,000) / All visiting / using Snapchat in last 3 months (131) Q3 2016

TECHNOLOGY TRACKER | QUARTERLY RELEASE: Q3 2016
Females 15% 55% 21% 9% 8% 2% 1%
Females AB 15% 77% 23% 11% 13% 2% 1%
Females C1 16% 60% 18% 9% 7% 3% 1%
Females C2 13% 44% 20% 13% 4% 0% 0%
Females DE 15% 49% 24% 5% 5% 1% 1%
Almost 8 in 10 Snapchat users are AB females aged 15-24
% ACCESSING SNAPCHAT IN THE PAST 3 MONTHS, BY GENDER AND SOCIAL GRADE
25
Source: Ipsos MORI
50-100%25-49%0-24%
All 15-24 25-34 35-44 45-54 55-64 65+
Males 12% 45% 20% 6% 4% 2% 0%
Males AB 12% 52% 32% 8% 6% 2% 0%
Males C1 14% 51% 20% 7% 2% 1% 1%
Males C2 12% 37% 17% 2% 7% 2% 1%
Males DE 11% 42% 7% 4% 0% 2% 0%
Base: circa 4,000 GB adults aged 15+: Q4 2015/ Q1/ Q2/ Q3 2016
TECHNOLOGY TRACKER | QUARTERLY RELEASE: Q3 2016
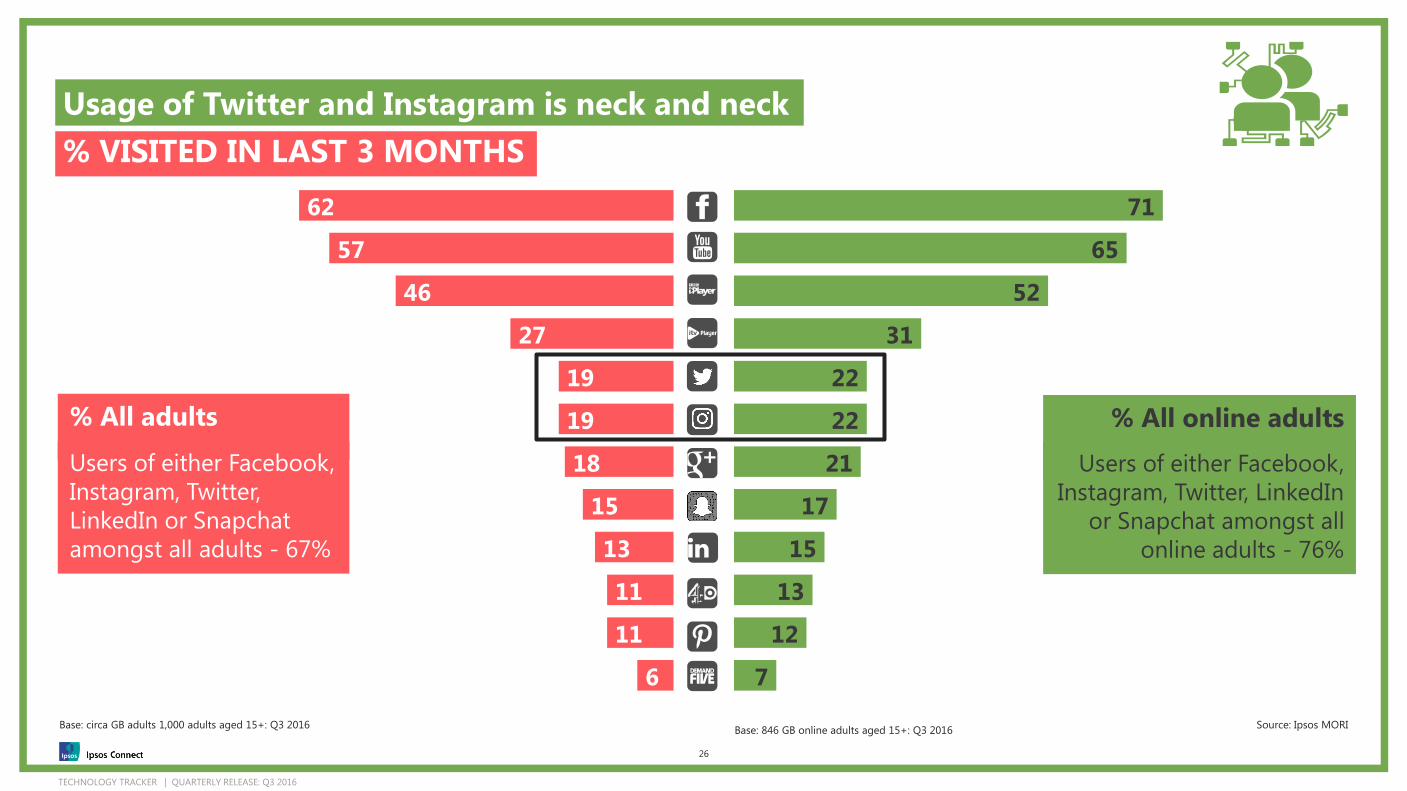
Usage of Twitter and Instagram is neck and neck
62
57
46
27
19
19
18
15
13
11
11
6
71
65
52
31
22
22
21
17
15
13
12
7
% VISITED IN LAST 3 MONTHS
26
Source: Ipsos MORI
% All adults
Base: 846 GB online adults aged 15+: Q3 2016
% All online adults
…Users of either Facebook,
Instagram, Twitter,
LinkedIn or Snapchat
amongst all adults - 67%
Users of either Facebook,
Instagram, Twitter, LinkedIn
or Snapchat amongst all
online adults - 76%
Base: circa GB adults 1,000 adults aged 15+: Q3 2016

TECHNOLOGY TRACKER | QUARTERLY RELEASE: Q3 2016
SMARTPHONE OWNERSHIP

TECHNOLOGY TRACKER | QUARTERLY RELEASE: Q3 2016
Three quarters of GB adults have a smartphone
49
75
22
38
13
1
15
36
13
0%
20%
40%
60%
80%
Q3 '12 Q4 '12 Q1 '13 Q2 '13 Q3'13 Q4'13 Q1'14 Q2'14 Q3'14 Q4'14 Q1 '15 Q2 '15 Q3 '15 Q4 '15 Q1 '16 Q2 '16 Q3 '16
% OWNED BY MANUFACTURER
28
Base: circa 1,000 GB adults aged 15+ per wave Source: Ipsos MORI
Any Smartphone (net)
Windows
TECHNOLOGY TRACKER | QUARTERLY RELEASE: Q3 2016
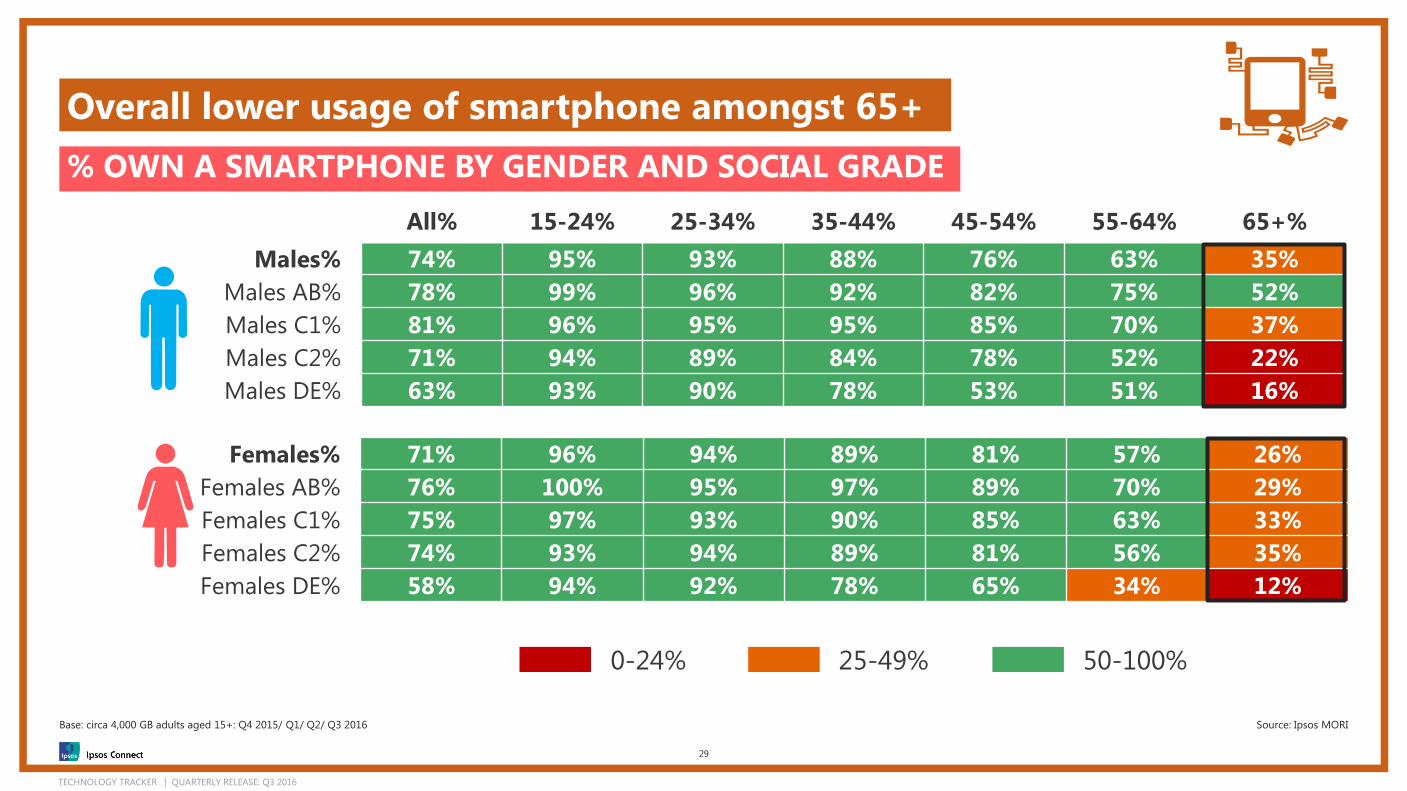
Females% 71% 96% 94% 89% 81% 57% 26%
Females AB% 76% 100% 95% 97% 89% 70% 29%
Females C1% 75% 97% 93% 90% 85% 63% 33%
Females C2% 74% 93% 94% 89% 81% 56% 35%
Females DE% 58% 94% 92% 78% 65% 34% 12%
Overall lower usage of smartphone amongst 65+
% OWN A SMARTPHONE BY GENDER AND SOCIAL GRADE
29
Source: Ipsos MORI
50-100%25-49%0-24%
% All% 15-24% 25-34% 35-44% 45-54% 55-64% 65+%
Males% 74% 95% 93% 88% 76% 63% 35%
Males AB% 78% 99% 96% 92% 82% 75% 52%
Males C1% 81% 96% 95% 95% 85% 70% 37%
Males C2% 71% 94% 89% 84% 78% 52% 22%
Males DE% 63% 93% 90% 78% 53% 51% 16%
Base: circa 4,000 GB adults aged 15+: Q4 2015/ Q1/ Q2/ Q3 2016
TECHNOLOGY TRACKER | QUARTERLY RELEASE: Q3 2016
0%
20%
40%
60%
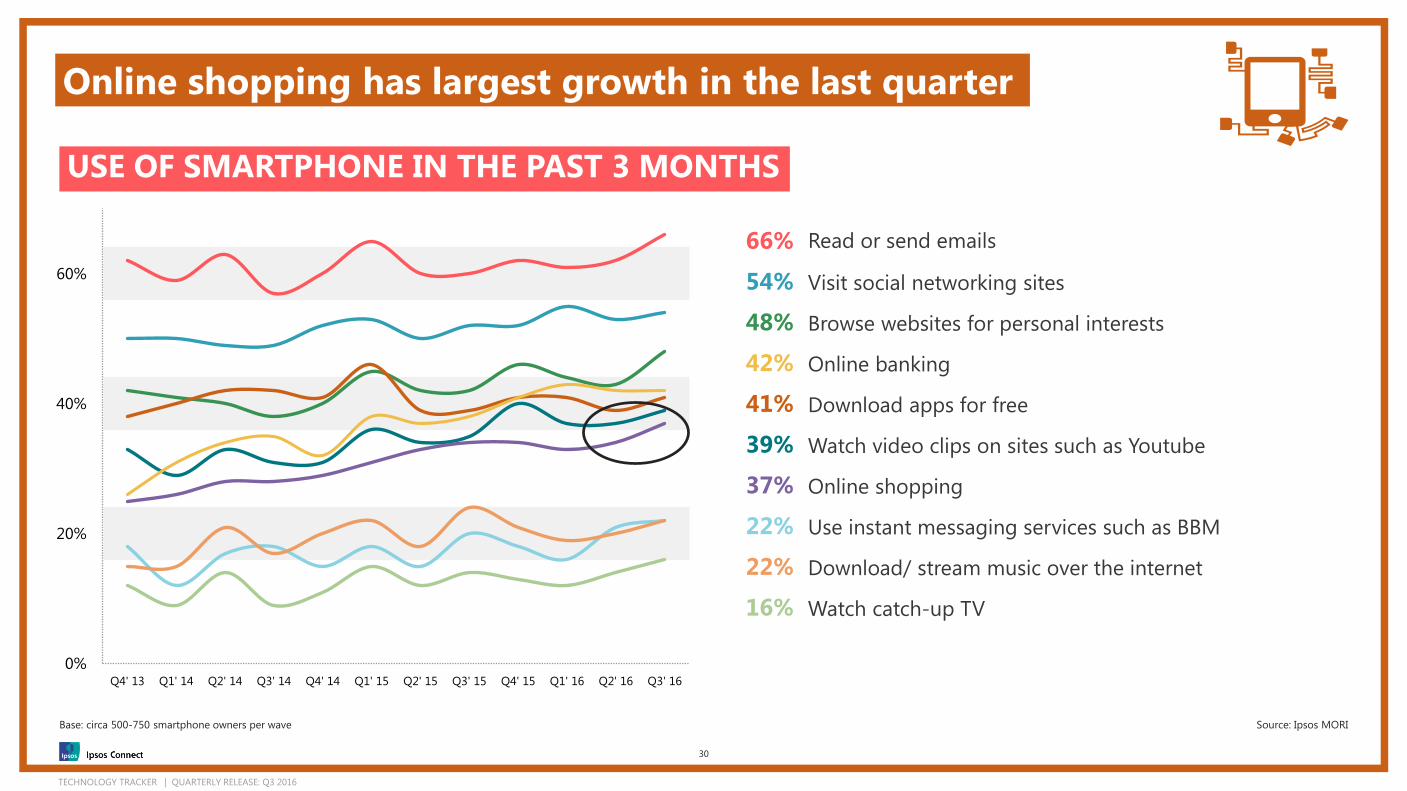
Q4' 13 Q1' 14 Q2' 14 Q3' 14 Q4' 14 Q1' 15 Q2' 15 Q3' 15 Q4' 15 Q1' 16 Q2' 16 Q3' 16
66% Read or send emails
54% Visit social networking sites
48% Browse websites for personal interests
42% Online banking
41% Download apps for free
39% Watch video clips on sites such as Youtube
37% Online shopping
22% Use instant messaging services such as BBM
22% Download/ stream music over the internet
16% Watch catch-up TV
Online shopping has largest growth in the last quarter
USE OF SMARTPHONE IN THE PAST 3 MONTHS
30
Base: circa 500-750 smartphone owners per wave Source: Ipsos MORI

TECHNOLOGY TRACKER | QUARTERLY RELEASE: Q3 2016
TABLET OWNERSHIP

TECHNOLOGY TRACKER | QUARTERLY RELEASE: Q3 2016
Ownership of iPad vs. non iPad is similar
24
52
16
30
9
28
0%
20%
40%
60%
Q2 '13 Q3 '13 Q4 '13 Q1 '14 Q2 '14 Q3 '14 Q4 '14 Q1 '15 Q2 '15 Q3 '15 Q4 '15 Q1 '16 Q2 '16 Q3 '16
% OWN A TABLET IN THE HOUSEHOLD
32
Base: circa 1,000 GB adults aged 15+ per wave Source: Ipsos MORI
NON
IPAD
Any Tablet
iPad
NON
IPAD
Tablet (non iPad)

TECHNOLOGY TRACKER | QUARTERLY RELEASE: Q3 2016
Females 48% 51% 55% 56% 55% 48% 30%
Females AB 62% 67% 62% 64% 75% 59% 47%
Females C1 49% 47% 54% 59% 53% 56% 34%
Females C2 43% 41% 58% 53% 45% 39% 27%
Females DE 36% 53% 48% 44% 37% 34% 14%
Higher ownership of tablets amongst ABs compared to others
% OWN A TABLET BY GENDER AND SOCIAL GRADE ACROSS
33
Source: Ipsos MORI
50-100%25-49%0-24%
All 15-24 25-34 35-44 45-54 55-64 65+
Males 51% 47% 61% 58% 53% 51% 37%
Males AB 65% 67% 83% 69% 72% 66% 47%
Males C1 52% 48% 58% 63% 48% 56% 37%
Males C2 46% 41% 54% 52% 54% 38% 35%
Males DE 36% 42% 43% 42% 33% 37% 21%
Base: circa 4,000 GB adults aged 15+: Q4 2015/ Q1/ Q2/ Q3 2016
TECHNOLOGY TRACKER | QUARTERLY RELEASE: Q3 2016
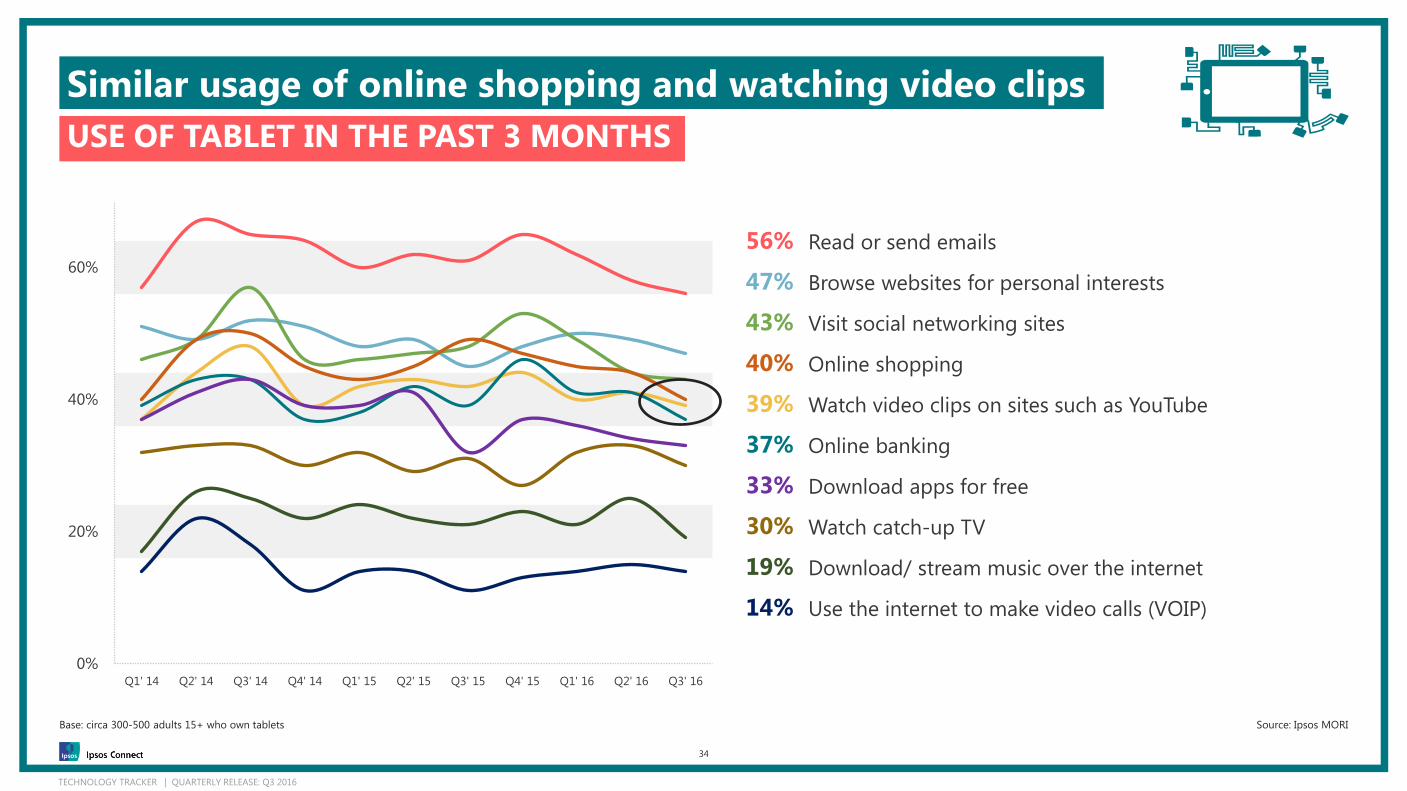
Similar usage of online shopping and watching video clips
0%
20%
40%
60%
Q1' 14 Q2' 14 Q3' 14 Q4' 14 Q1' 15 Q2' 15 Q3' 15 Q4' 15 Q1' 16 Q2' 16 Q3' 16
USE OF TABLET IN THE PAST 3 MONTHS
34
Base: circa 300-500 adults 15+ who own tablets Source: Ipsos MORI
56% Read or send emails
47% Browse websites for personal interests
43% Visit social networking sites
40% Online shopping
39% Watch video clips on sites such as YouTube
37% Online banking
33% Download apps for free
30% Watch catch-up TV
19% Download/ stream music over the internet
14% Use the internet to make video calls (VOIP)
TECHNOLOGY TRACKER | QUARTERLY RELEASE: Q3 2016
CONTENT CONSUMPTION
Music / Games / TV / Movies
TECHNOLOGY TRACKER | QUARTERLY RELEASE: Q3 2016
Music consumption through CDs declining compared to
digital consumption
22
1917
16
78
22
32
6
20
0%
10%
20%
30%
40%
Q2 '12 Q3 '12 Q4 '12 Q1 '13 Q3 '13 Q1 '14 Q3 '14 Q1 '15 Q3 '15 Q1 '16 Q3 '16
MUSIC CONSUMPTION
36
Base: circa 1,000 GB adults aged 15+ per wave / Music consumption is tracked every 6 months Source: Ipsos MORI
Any digital Bought CD Paid for legal download Unofficial digital (pirate)Used free legal streaming
TECHNOLOGY TRACKER | QUARTERLY RELEASE: Q3 2016
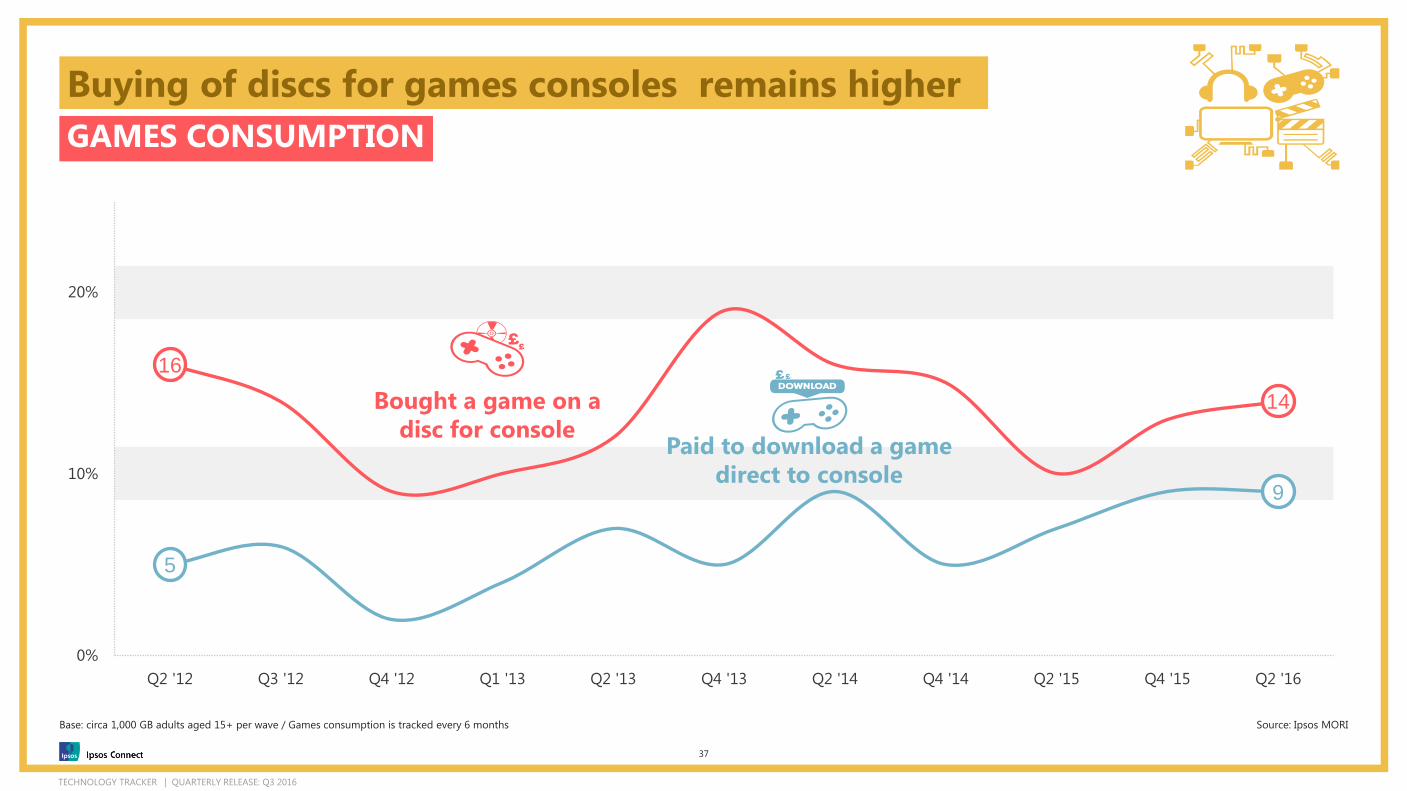
Buying of discs for games consoles remains higher
16
14
5
9
0%
10%
20%
Q2 '12 Q3 '12 Q4 '12 Q1 '13 Q2 '13 Q4 '13 Q2 '14 Q4 '14 Q2 '15 Q4 '15 Q2 '16
GAMES CONSUMPTION
37
Base: circa 1,000 GB adults aged 15+ per wave / Games consumption is tracked every 6 months Source: Ipsos MORI
Bought a game on a
disc for consolePaid to download a game
direct to console

TECHNOLOGY TRACKER | QUARTERLY RELEASE: Q3 2016
Digital consumption closes the gap with DVDs and Blu-rays
31
21
1012
6
9
14
19
0%
10%
20%
30%
40%
Q1 '13 Q3 '13 Q1 '14 Q3 '14 Q1 '15 Q3 '15 Q1 '16 Q3 '16
MOVIE CONSUMPTION
38
Base: circa 1,000 GB adults aged 15+ per wave / Movie consumption is tracked every 6 months Source: Ipsos MORI
Bought DVD/Blu-ray
Paid official digital (DTO/VOD)
Any digital
Unofficial digital (pirate)

TECHNOLOGY TRACKER | QUARTERLY RELEASE: Q3 2016
4 in 10 GB adults watch catch-up TV
TV SERIES CONSUMPTION
39
Base: circa 1,000 GB adults aged 15+ per wave / TV consumption is tracked every 6 months Source: Ipsos MORI
27
42
12
1513
27
4
10
15
31
0%
10%
20%
30%
40%
Q2 '13 Q4 '13 Q1 '14 Q2 '14 Q4 '14 Q2 '15 Q4 '15 Q2 '16
Catch-up TV
ANY Any digital
OFFICIAL Official digital
Bought DVD/Blu-ray
Unofficial digital (pirate)
TECHNOLOGY TRACKER | QUARTERLY RELEASE: Q3 2016
TECH TRACKER TECHNICAL DETAILS
Ipsos MORI interviewed a quota sample of 1001 adults aged 15+ in GB.
The latest interviews were carried out face to face
15th – 21st July 2016.
Data is weighted to a nationally representative profile.
A variety of other demographic breakdowns are available,
including working status, household composition, ethnicity,
income and newspaper readership.
40
If you are interested in
adding a question(s) these
can be added for a single
measure on a single wave or
on a tracking basis.
While the Tech Tracker is a
multi-client study, results of
customised questions would
be made available exclusively
to you. The standard Ipsos MORI terms and conditions apply to this report, as with all studies the company undertakes.
No press release or publication of the findings shall be made without the prior approval of Ipsos MORI. Approval
will only be withheld on the grounds of inaccuracy or misinterpretation of results. Ipsos MORI reserves the right to
amend the Internet Usage Statistics at any time.

TECHNOLOGY TRACKER | QUARTERLY RELEASE: Q3 2016
www.ipsos-mori.com/ipsosconnect
Ipsos Connect is a global specialised business to co-ordinate
Ipsos services in the domains of Brand Communications,
Advertising and Media. Ipsos Connect amalgamates the legacy
brands of Ipsos ASI and Ipsos MediaCT.
As the world of brand communications, advertising and media
become increasingly complex, fragmented and digitalised, Ipsos
is helping clients better embrace this modern complexity with
investment in new approaches and products that will fit with the
digital age. Ipsos Connect aims to be the preferred global
partner for companies to measure and amplify how media,
brands and consumers connect through compelling content,
great communication and relevant media planning.
Ipsos Connect is a specialist division within Ipsos, one of the
world’s largest market research agencies. Ipsos has offices in 87
countries, generating global revenues of €1.669,5 million
(2 218,4M$) in 2014.
Prachi Jain
Ipsos MORI
3 Thomas More Square
London
E1W 1YW
t: +44 (0)20 3059 4792
ipsos-mori.com/ipsosconnect
@ipsosconnectuk
Eda Koray
Ipsos MORI
Kings House, Kymberley Road
Harrow
HA1 1PT
t: +44 (0)20 8861 8775
ipsos-mori.com/ipsosconnect
@ipsosconnectuk
For more information
Jonny Pollick
Ipsos MORI
Kings House, Kymberley Road
Harrow
HA1 1PT
t: +44 (0)20 8861 8013
ipsos-mori.com/ipsosconnect
@ipsosconnectuk