Q3 2015 results - Bourse · PDF fileWelcome and introduction Louis Schmid, IR 1. Q3 in a...
49
Q3 2015 results Analyst and investor presentation 05 November 2015
Transcript of Q3 2015 results - Bourse · PDF fileWelcome and introduction Louis Schmid, IR 1. Q3 in a...
Q3 2015 results
Analyst and investor presentation05 November 2015

Welcome and introduction Louis Schmid, IR
1. Q3 in a nutshell Urs Schaeppi, CEO2. Quality key in Switzerland3. Strengthening of Swiss position4. Fastweb performance
5. Group financials Mario Rossi, CFO6. Guidance 2015
Q&A All
Backup
2
Agenda
3
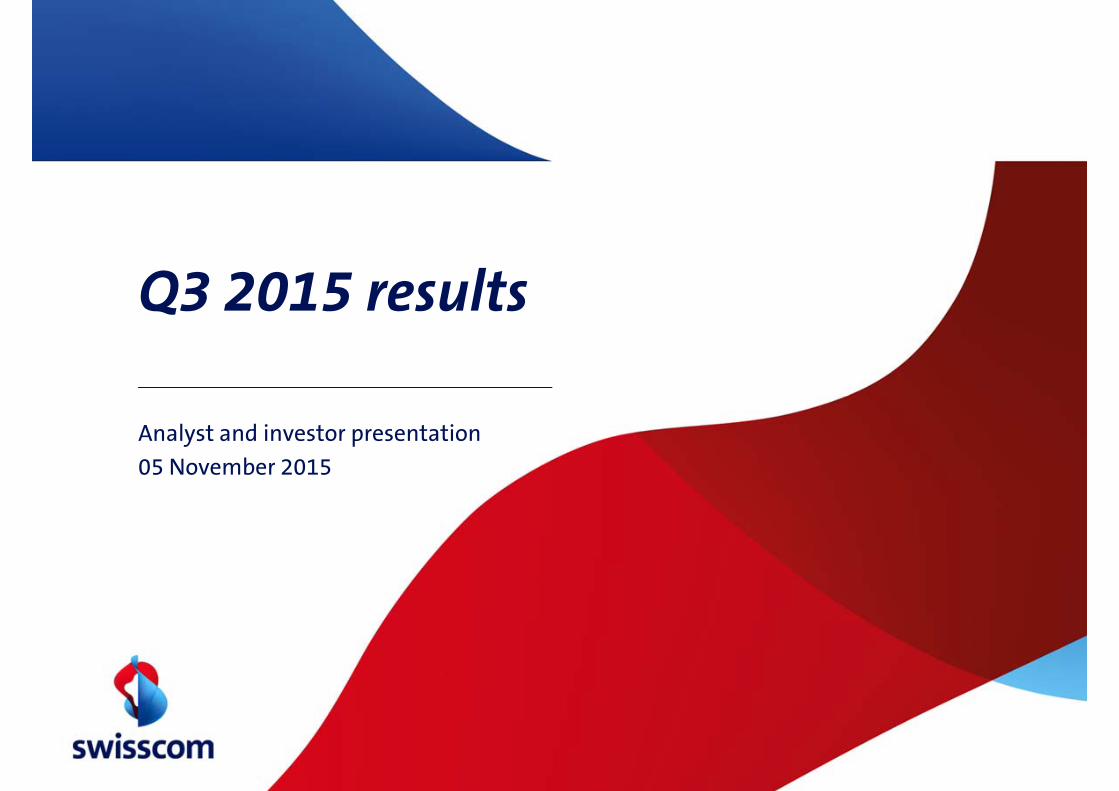
1. Q3 key financialsSolid underlying performance
4
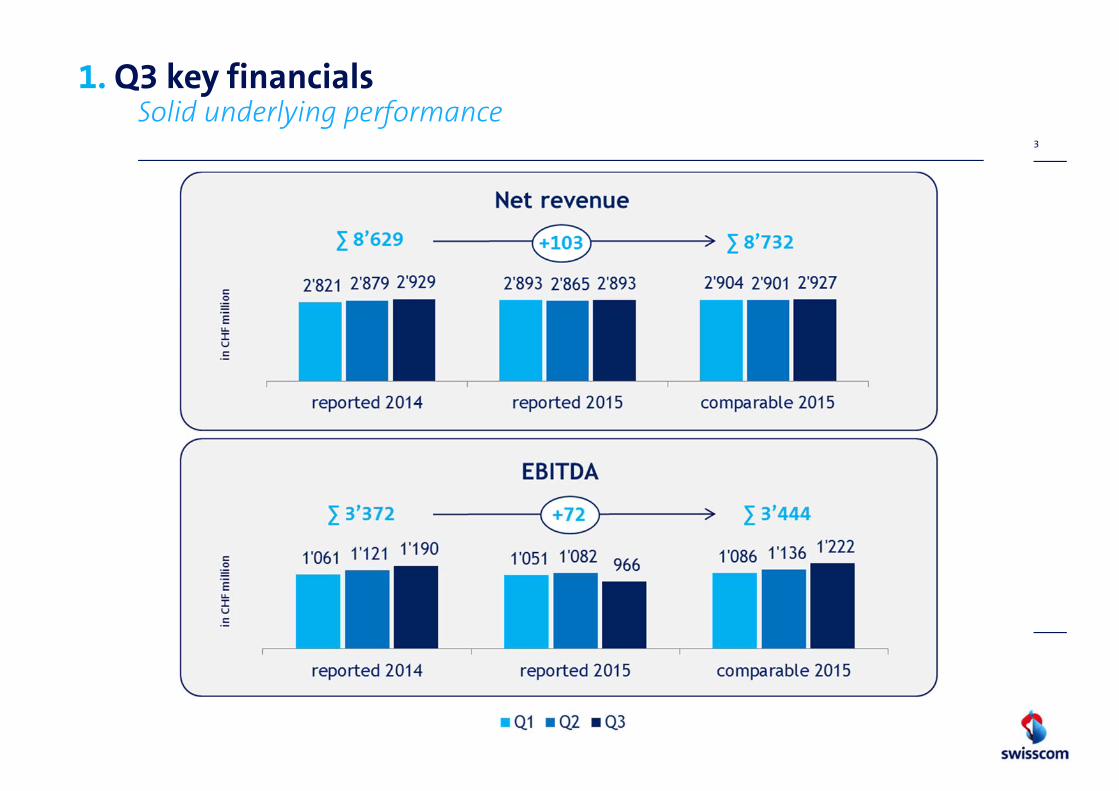
1. Q3 key financials3rd quarter in row with underlying EBITDA growth
Underlying Q3 2015 revenue almost flat YOY and underlying 9m 2015 up by CHF +103 million YOY
Comparable Q3 2015 EBITDA
increased by CHF +32 million YOY, 9m 2015 margin went
up YOY by a total of CHF +72 million
CAPEX YOY flat at CHF 1.7 billion as per end of Sept
2015
* FeAC = Federal Administrative Court** BBCS = Broadband Connectivity Services

• >1mm subs (thereof +78k net adds in Q3) on our fixed bundle Vivo• TV subs base increased to >1.2mm (thereof +36k net adds in Q3), whereof
>50% are on Swisscom TV 2.0• Announcement of a UHD ready set-top box for spring 2016 & improved TV
and gaming portfolio (cloud gaming)• >1.8mm subs (thereof +36k net adds in Q3) on infinity. Of those, >0.5mm
(thereof +237k net adds in Q3) on infinity plus
• Strong performance of SME’s bundle offering My KMU Office
• Different successful launches: App Cloud, own UCC solution and in-house mobile service standard (3G/4G access points for voice in-house coverage)
• Strong acquisition performance: 9m order intake increased +42% YOY
• Announcement of VoLTE rollout (in H2 2015), WiFi Calling and increasing network capacity in urban areas with microcells (from 2016 onwards)
• Broadband Connectivity Services up to 2007: FeAC reduces COMCO sanction to CHF 186 mm. Swisscom booked a provision in the same amount and will file an appeal with the Federal Supreme Court
• Successful EURO bond issuance (€ 500mm)
5
1. Q3 highlightsPrimarily driven by consumer demand and innovation
Residential Customers
Technology
Financing
SME
Enterprise Customers
Regulation

6
2. Quality matters in SwitzerlandInvesting into quality pays off
Key quality criteria
Unique customerexperience
Superior network performance
Volume *
= Net revenue
- OPEX
- CAPEX
= Free cash flow
a
b
c d
e
f
Price

2a. Increasing broadband footprint High(er) investments make long-term sense ...
7
* Homes passed as per Q3 2015: FTTC/Vectoring = 457’000, FTTS/B = 241’000, FTTH = 1’015’000 ** HDTV: high-definition television, provides about five times as many pixels as standard-definition television (SDTV)
Ultra broadbandtechnologies
• 1.7mm homes* withlatest fibre technologies• >93% coverage with digital TV• ≈90% coverage with HDTV
Mobilebroadband
•>99% coverage 2G•>99% coverage 3G•>98% coverage 4G/LTE•6th consecutive time
winner of Connecttest
Fibre to the Home (FTTH)• 1'015'000 homes • Fastest Surf-Speed
in Switzerland: 1 Gbit/s
8
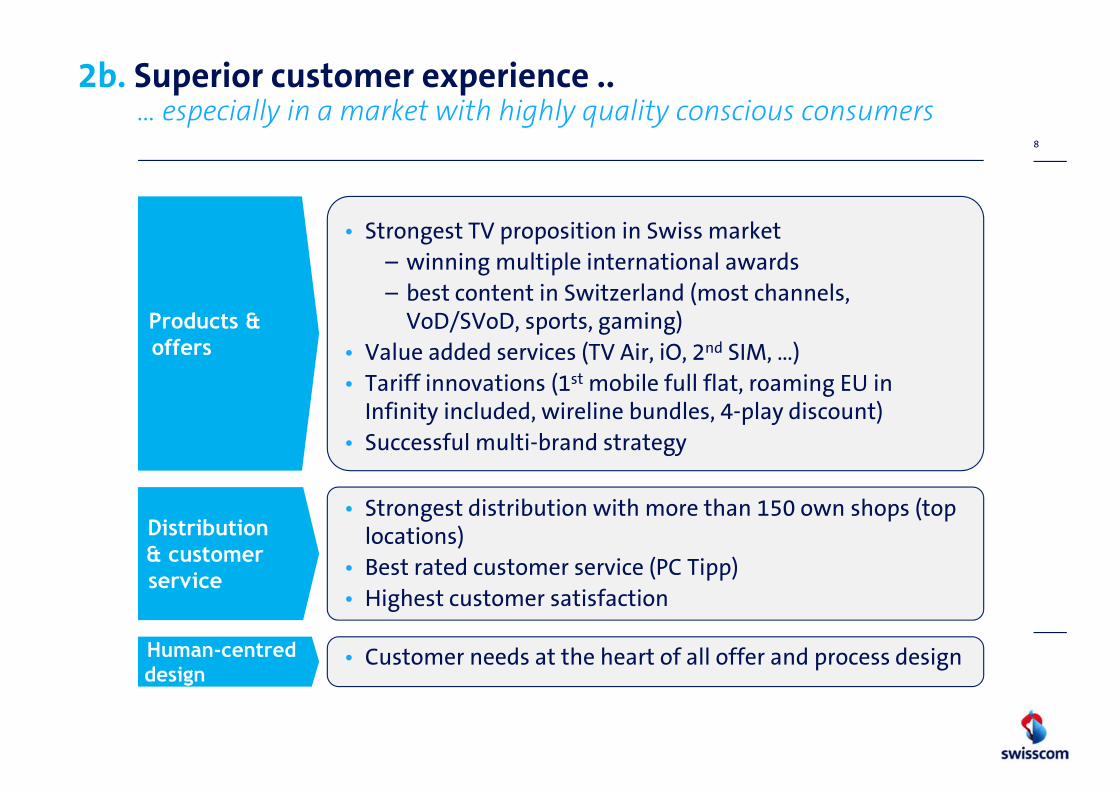
2b. Superior customer experience ..… especially in a market with highly quality conscious consumers
• Strongest TV proposition in Swiss market– winning multiple international awards– best content in Switzerland (most channels,
VoD/SVoD, sports, gaming)• Value added services (TV Air, iO, 2nd SIM, …)• Tariff innovations (1st mobile full flat, roaming EU in
Infinity included, wireline bundles, 4-play discount)• Successful multi-brand strategy
• Strongest distribution with more than 150 own shops (top locations)
• Best rated customer service (PC Tipp)• Highest customer satisfaction
• Customer needs at the heart of all offer and process design
Products & offers
Distribution & customer service
Human-centred design

9
2b. … thanks to an attractive TV propositionOn track for further growth and becoming market leader
A compelling proposition…− widest variety of channels and content
− superior picture quality (UHD coming Q2 ‘16)
− exceptional usability (easy content discovery, personal recommendation)
− Multi-screen convergent offering
− Cloud-based recording (up to 7 days replay, live pause, easy recording up to 1’200 hrs)
2010 2011 2012 2013 2014 2015 2016E
…and more loyal customers with significantly lower churn rates than non-bundled customers
− More than 1.2 million customers are already using Swisscom TV, of which over 1 million customers have a Vivo bundle subscription
Vivo M Plus Trio HomeAll-in-One Gold
129.- 128.95110.-~111.-
AccessService
132.95 *
* Price increase of upc access as of January 2016
…combined with a competitive and stable pricing …
…is resulting in a growing TV subs base …
10
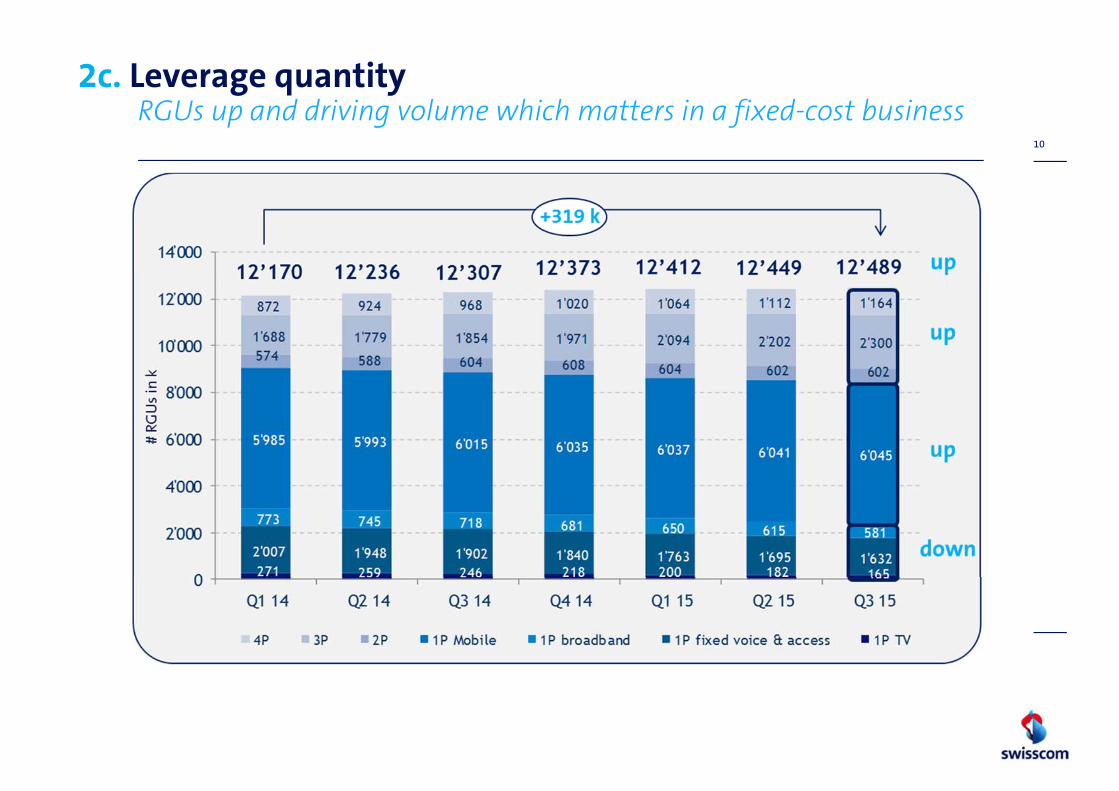
2c. Leverage quantityRGUs up and driving volume which matters in a fixed-cost business
11
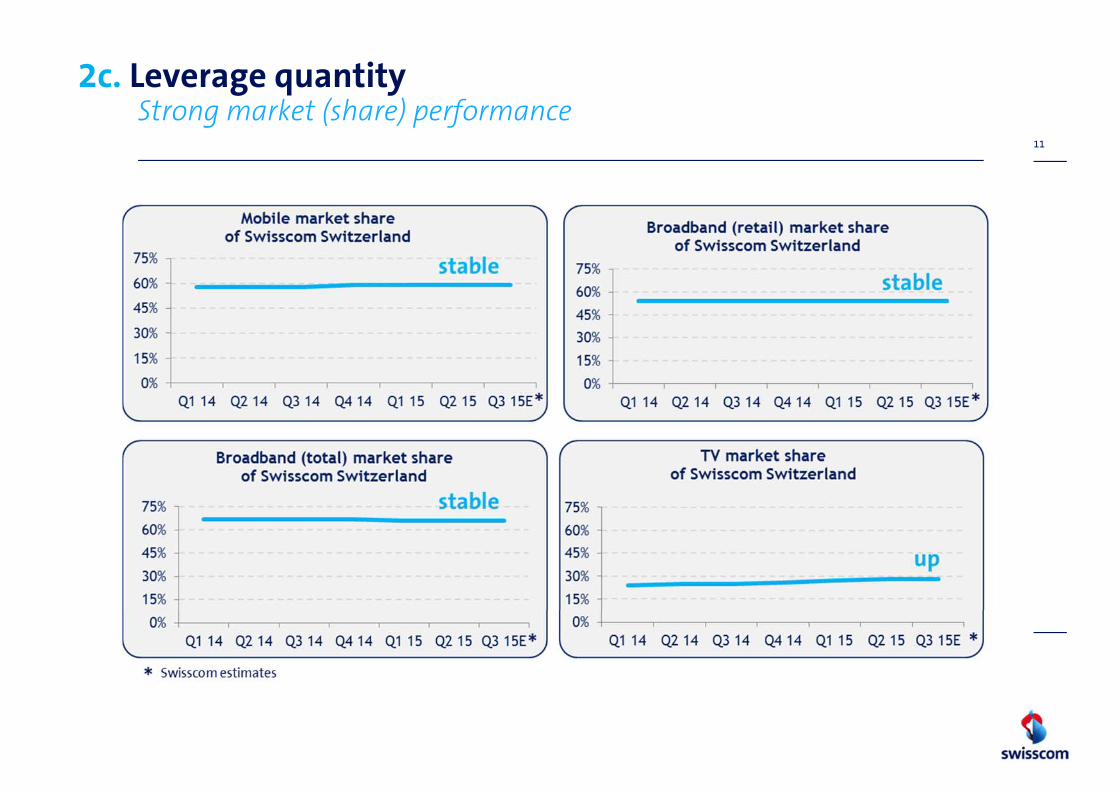
2c. Leverage quantityStrong market (share) performance

12
2c. Leverage quantityStable churn rates (at relatively low levels) thanks to satisfied consumers and high loyalty
0.0%
10.0%
20.0%
30.0%
Q1 14 Q2 14 Q3 14 Q4 14 Q1 15 Q2 15 Q3 15
Mobile (blended) churn rateof Swisscom Switzerland
0.0%
10.0%
20.0%
30.0%
Q1 14 Q2 14 Q3 14 Q4 14 Q1 15 Q2 15 Q3 15
Broadband churn rateof Swisscom Switzerland
0.0%
10.0%
20.0%
30.0%
Q1 14 Q2 14 Q3 14 Q4 14 Q1 15 Q2 15 Q3 15
TV churn rateof Swisscom Switzerland
0.0%
10.0%
20.0%
30.0%
Q1 14 Q2 14 Q3 14 Q4 14 Q1 15 Q2 15 Q3 15
Bundle churn rateof Swisscom Switzerland
stable
stablestable
stable
0
20
40
60
80
100
Q1 14 Q2 14 Q3 14 Q4 14 Q1 15 Q2 15 Q3 15
TV ARPU (1P)of Swisscom Switzerland
0
20
40
60
80
100
Q1 14 Q2 14 Q3 14 Q4 14 Q1 15 Q2 15 Q3 15
Broadband (retail) ARPU (1P)of Swisscom Switzerland
0
20
40
60
80
100
Q1 14 Q2 14 Q3 14 Q4 14 Q1 15 Q2 15 Q3 15
Mobile ARPU (1P)of Swisscom Switzerland
0
20
40
60
80
100
Q1 14 Q2 14 Q3 14 Q4 14 Q1 15 Q2 15 Q3 15
Fixed voice and access ARPU (1P)of Swisscom Switzerland
13
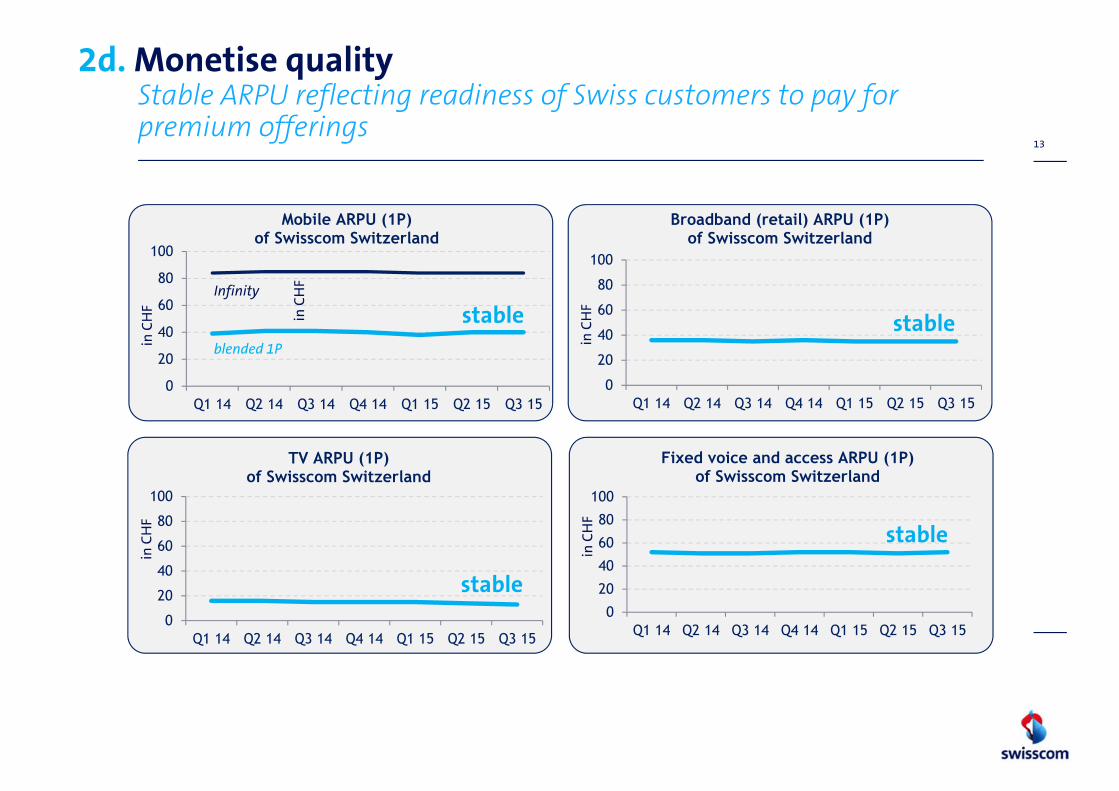
2d. Monetise quality Stable ARPU reflecting readiness of Swiss customers to pay for premium offerings
in C
HF
in C
HF
Infinity
blended 1Pstable
stable
stable
stable
in C
HF
in C
HF
in C
HF
14
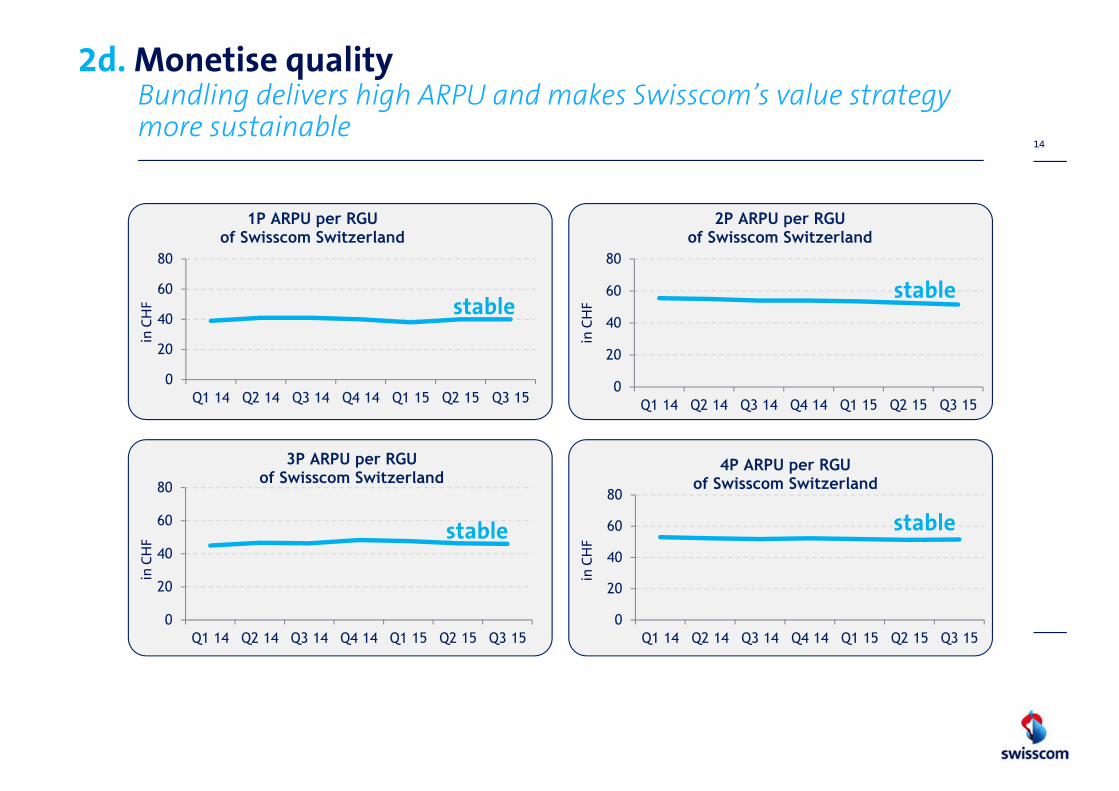
2d. Monetise qualityBundling delivers high ARPU and makes Swisscom’s value strategy more sustainable
0
20
40
60
80
Q1 14 Q2 14 Q3 14 Q4 14 Q1 15 Q2 15 Q3 15
1P ARPU per RGUof Swisscom Switzerland
0
20
40
60
80
Q1 14 Q2 14 Q3 14 Q4 14 Q1 15 Q2 15 Q3 15
2P ARPU per RGUof Swisscom Switzerland
0
20
40
60
80
Q1 14 Q2 14 Q3 14 Q4 14 Q1 15 Q2 15 Q3 15
3P ARPU per RGUof Swisscom Switzerland
0
20
40
60
80
Q1 14 Q2 14 Q3 14 Q4 14 Q1 15 Q2 15 Q3 15
4P ARPU per RGUof Swisscom Switzerland
in C
HF
in C
HF
stablestable
stable
in C
HF
in C
HFstable

23 23 21 19 18 13 15 314 298 289 285 271 260 255
178 176 171 170 163 162 158
673 695 711 697 671 691 703
94 93 90 97 95 94 93
214 238 262 267 278 290 305
131 139 144 152 157 163 172
0
200
400
600
800
1'000
1'200
1'400
1'600
1'800
Q1 14 Q2 14 Q3 14 Q4 14 Q1 15 Q2 15 Q3 15
4P 3P 2P 1P Mobile 1P broadband 1P fixed voice & access 1P TV
15
2e. Swiss 1P and bundle revenue Revenue slightly improved thanks to solid volume trends and sustainable price levels
in C
HF
mill
ion
1’627 1’662 1’688 1’687 1’653 1’673 1’701
up
up
down
stable

16
2f. FCF generation Swisscom SwitzerlandSuccessful monetisation (∅ CHF ~0.5bln/quarter) is a function of high investments (OPEX and CAPEX)
in C
HF
mill
ion
940 968 1'036
891 955 977
1'054
594 545 566
386
567 524
595
-
250
500
750
1'000
Q1 14 Q2 14 Q3 14 Q4 14 Q1 15 Q2 15 Q3 15
Comparable EBITDA OpFCF proxy
∅ 974
∅ 540 stable
stable
17
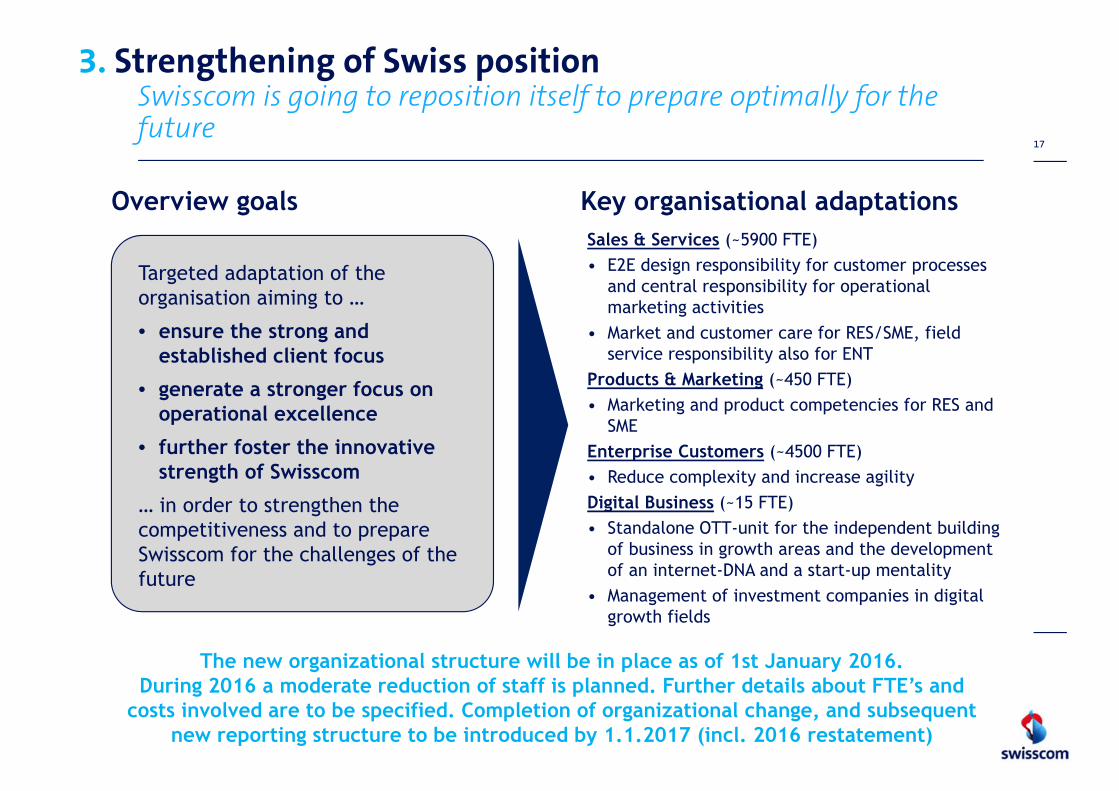
Sales & Services (~5900 FTE)• E2E design responsibility for customer processes
and central responsibility for operational marketing activities
• Market and customer care for RES/SME, field service responsibility also for ENT
Products & Marketing (~450 FTE)• Marketing and product competencies for RES and
SMEEnterprise Customers (~4500 FTE)• Reduce complexity and increase agilityDigital Business (~15 FTE)• Standalone OTT-unit for the independent building
of business in growth areas and the development of an internet-DNA and a start-up mentality
• Management of investment companies in digital growth fields
Targeted adaptation of the organisation aiming to …
• ensure the strong and established client focus
• generate a stronger focus on operational excellence
• further foster the innovative strength of Swisscom
… in order to strengthen the competitiveness and to prepare Swisscom for the challenges of the future
Overview goals Key organisational adaptations
3. Strengthening of Swiss positionSwisscom is going to reposition itself to prepare optimally for the future
The new organizational structure will be in place as of 1st January 2016. During 2016 a moderate reduction of staff is planned. Further details about FTE’s and
costs involved are to be specified. Completion of organizational change, and subsequent new reporting structure to be introduced by 1.1.2017 (incl. 2016 restatement)

18
Overview high-level adaptations and target organisation
CEO *
Group Security
Group Strategy & Board Services
Group Communi-cations & Responsibility
Group Human Resources *
Group Business Steering *
Digital Business(DBU)
FastwebEnterprise Customers *
Products & Marketing *
Sales & Services *
IT, Network & Infra-structure *
Digital Business
3. Realigned organisational setup in SwitzerlandMerge RES and SME: consolidate Sales & Service functions and synchronise/harmonise Products & Marketing
* Executive Board

9M 2014
74k
9M 2015
100k
Fastweb broadband net adds evolution In the first 9m 2015
Fastweb net adds grew 35% YOY to 100k
Net adds market co-leader also in Q3 2015
Fastweb revenues evolution (€ million)
Significant revenue growth in all business segments
– Consumer +4%
– Enterprise +3%
– Wholesale +17%
9M 2014 9M 2015
1,230 1,286
Consumer
Enterprise
+17%Wholesale
+3%
+4%
19
4. Fastweb - revenue and net adds Strong 9m performance
+5%
+35%

4. Fastweb - broadband performanceGaining further traction in UBB areas
… representing almost 30% of Fastweb active customers …
FTTH/FTTS LLU/BITSTREAM
~2.1 mm residential customers
FTTx customer base grew 33% YoY to over 600k …450k
>600k
… thanks to increased sales penetration and lower churn … 82%
~7,5 mm UBB target coverage
Fastweb current NGAN footprint vs.
target
To be completed by
YE 2016
… over an UBB coverage now at 6.2 million HHs and businesses at the end of Q3 (+7% vs. 2Q)
Churn Sales penetration
+33%
+66% -40%
20
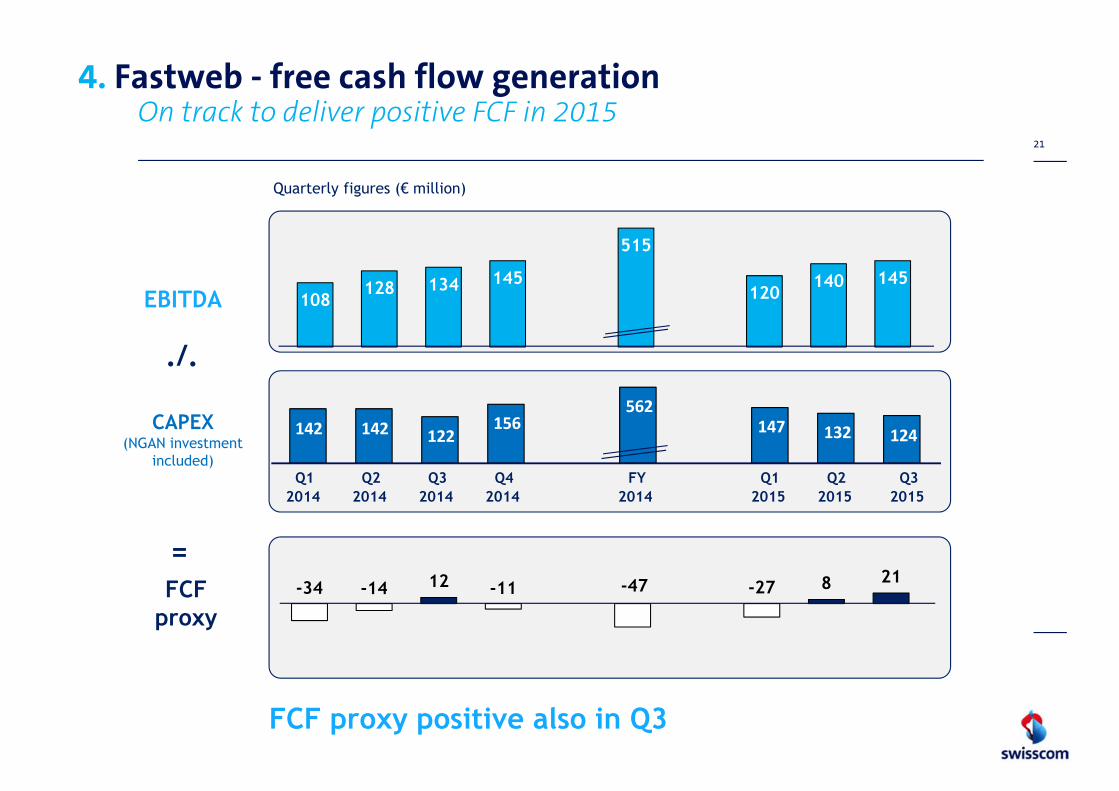
108128 134 145
515
120140 145
142 142 122156
562147 132 124
-34 -14 12 -11 -47 -27 8 21
Quarterly figures (€ million)
EBITDA
CAPEX (NGAN investment
included)
4. Fastweb - free cash flow generationOn track to deliver positive FCF in 2015
Q12014
Q22014
Q32014
Q42014
FY2014
Q12015
Q22015
Q32015
./.
FCF proxy positive also in Q3
FCFproxy
=
21

Welcome and introduction Louis Schmid, IR
1. Q3 in a nutshell Urs Schaeppi, CEO2. Quality key in Switzerland3. Strengthening of Swiss position4. Fastweb results
5. Group financials Mario Rossi, CFO6. Guidance 2015
Q&A All
Backup
22
Agenda
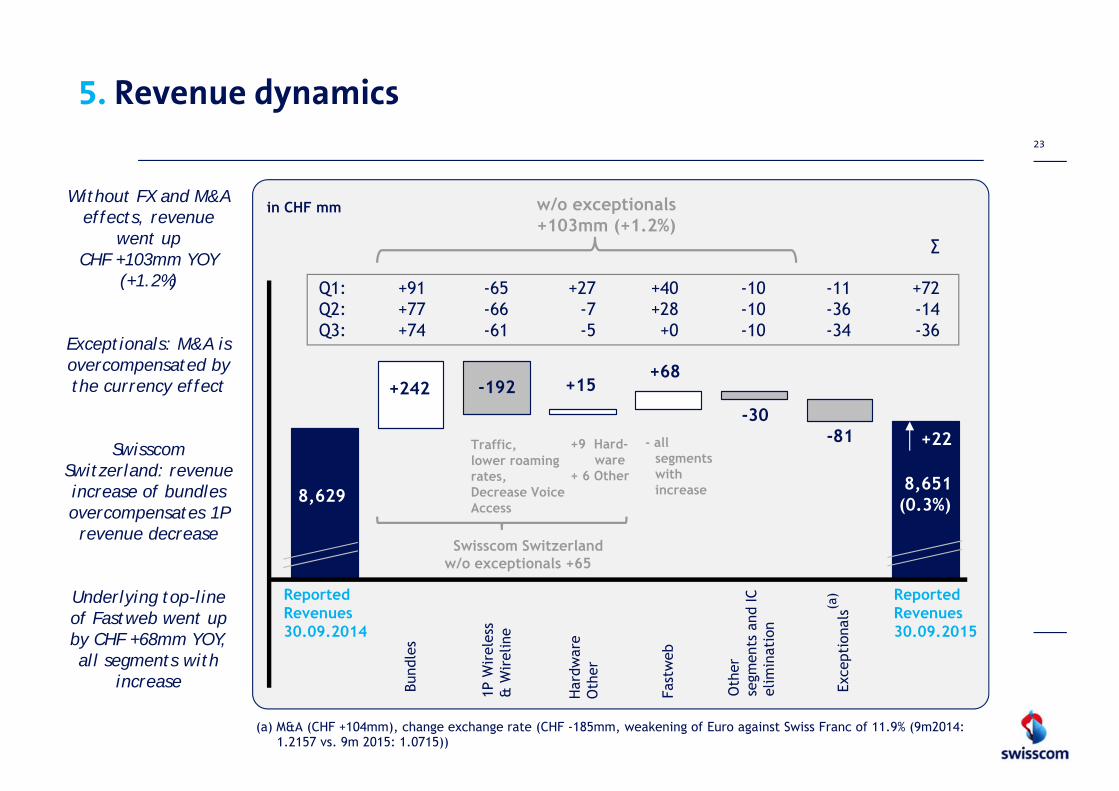
5. Revenue dynamics23
Without FX and M&A effects, revenue
went up CHF +103mm YOY
(+1.2%)
Exceptionals: M&A is overcompensated by the currency effect
Swisscom Switzerland: revenue increase of bundles overcompensates 1P revenue decrease
Underlying top-line of Fastweb went up by CHF +68mm YOY, all segments with
increase
ReportedRevenues30.09.2014
ReportedRevenues30.09.2015
Fast
web
Bund
les
in CHF mm
8,651(0.3%)
-192
-30
8,629
+68+242 +15
-81
Swisscom Switzerlandw/o exceptionals +65
1P W
irel
ess
& W
irel
ine
Har
dwar
e O
ther
Oth
erse
gmen
ts a
nd IC
el
imin
atio
n
- all segmentswith increase
Traffic, lower roaming rates, Decrease Voice Access
+9 Hard-ware
+ 6 Other
(a) M&A (CHF +104mm), change exchange rate (CHF -185mm, weakening of Euro against Swiss Franc of 11.9% (9m2014: 1.2157 vs. 9m 2015: 1.0715))
Exce
ptio
nals
(a)
+22
w/o exceptionals+103mm (+1.2%)
Q1:Q2:Q3:
+91+77+74
-10-10-10
∑
+72-14-36
-65-66-61
+27-7-5
+40+28+0
-11-36-34

5. Comparable revenue breakdown by segments24
in CHF mmTop-line w/o exceptionals
increased by CHF +103mm
Top-line of Swisscom
Switzerland up by CHF +65mm
driven by Residential,
especially Service Revenue Retail
Fastweb underlying revenue up
CHF +68mm, revenue increase in
all segments. Lower one-off revenues in Q3 Fa
stw
eb
+5+68
+20+79
-39-30
Oth
erse
gmen
ts a
nd IC
el
imin
atio
n
8,732(+1.2%)
Who
lesa
le,
Oth
er &
in
ters
egm
ent
elim
inat
ion
+61 Service Revenue Retail
+ 9 Hardware+ 9 Other
Resi
dent
ial
Cust
omer
s
Smal
l & M
ediu
mEn
terp
rise
s
Ente
rpri
seCu
stom
ers
ComparableRevenue30.09.2015
(a)Reported Revenue30.09.2014
8,629
+103
Swisscom Switzerlandw/o exceptionals
+65 (Q1 +53, Q2 +4, Q3 +8)
- all segmentswith increase
Q1:Q2:Q3:
+50+20+9
+40+28+ 0
∑
+83+22
-2
+ 0- 3+8
-3-18-18
+6+5+9
-10-10- 10
(a) Without M&A (CHF +104mm), change exchange rate (CHF -185mm, weakening of Euro against Swiss Franc of 11.9% (9m2014: 1.2157 vs. 9m 2015: 1.0715))
- reduced project business

EBITDA down CHF -273mm,
like-for-like up CHF +72mm YOY
Exceptional items (provision for FeAC
sanction, higher pension cost, gain on sale of real estate
and currency) impacted EBITDA by
CHF -345mm
EBITDA of Swisscom Switzerland w/o
exceptionals up CHF +42mm.
Increase in Q3 also due to lower direct
cost (SAC)
5. EBITDA breakdown25
3,372
in CHF mm
3,099(-8.1%)
+6 +42
-41
+59 +18
Swisscom Switzerlandw/o exceptionals +42
(Q1 +15, Q2 +9, Q3 +18)
Oth
er s
egm
ents
Hea
dqua
rter
sIn
terc
ompa
ny
elim
inat
ion
Fast
web
Dire
ct C
ostReported
EBITDA30.09.2014
ReportedEBITDA30.09.2015Se
rvic
e Re
venu
e Re
tail
Indi
rect
Cos
t
Contribution Marginw/o exceptionals +83
(Q1 +36, Q2 +10, Q3 +37)
-273
(a) Provision for FeAC sanction(BBCS, -186mm), higher pension cost reconciliation IAS19 (-50mm), lower gain on sale of real estate (-51mm), change exchange rate (CHF -58mm, weakening of Euro against Swiss Franc of 11.9%).
Exce
ptio
nals
(a)
-345
Har
dwar
e &
ot
her
reve
nue
-12
Q1:Q2:Q3:
+32+14+13
+13+17+12
∑
-10-39
-224
+21-10- 5
-17+ 6
+ 29
-21-1
-19
-3-11+ 2
-35-54
-256

5. Comparable EBITDA breakdown by segments26
EBITDA of Swisscom Switzerland w/o
exceptionalsup CHF +42mm
Residential Customers with a higher contribution YOY driven by the increase in
Service Revenue Retail and lower SAC
EBITDA of SME down YOY as a result of higher cost
for customer retention and indirect cost
ENT with lower contribution YOY due to
lower volumes and margins in the project business
EBITDA of Fastweb up CHF +42mm YOY, driven by
higher revenues
in CHF mm
Comparable EBITDA30.09.2015
ReportedEBITDA30.09.2014
Resi
dent
ial
Cust
omer
s
Smal
l & M
ediu
mEn
terp
rise
s
Ente
rpri
seCu
stom
ers
Who
lesa
le,
IT,
Net
wor
k &
Inno
vati
on
Oth
er s
egm
ents
, In
terc
ompa
nyel
imin
atin
o
3,372 3,444(+2.2%)
-11 -12-0
+71
-18
(a)
+72
Fast
web
+42
(a) Without Provision for FeAC sanction (BBCS, -186mm), higher Pension cost reconciliation (-50mm), lower gain on sale of real estate (-51mm), change exchange rate (CHF -58mm, weakening of Euro against Swiss Franc of 11.9%).
Swisscom Switzerlandw/o exceptionals
+42
Q1:Q2:Q3:
+20+26+25
+13+17+12
∑
+25+15+32
-9-6+4
-4-8-6
+ 8- 3-5
- 3- 11+ 2
27
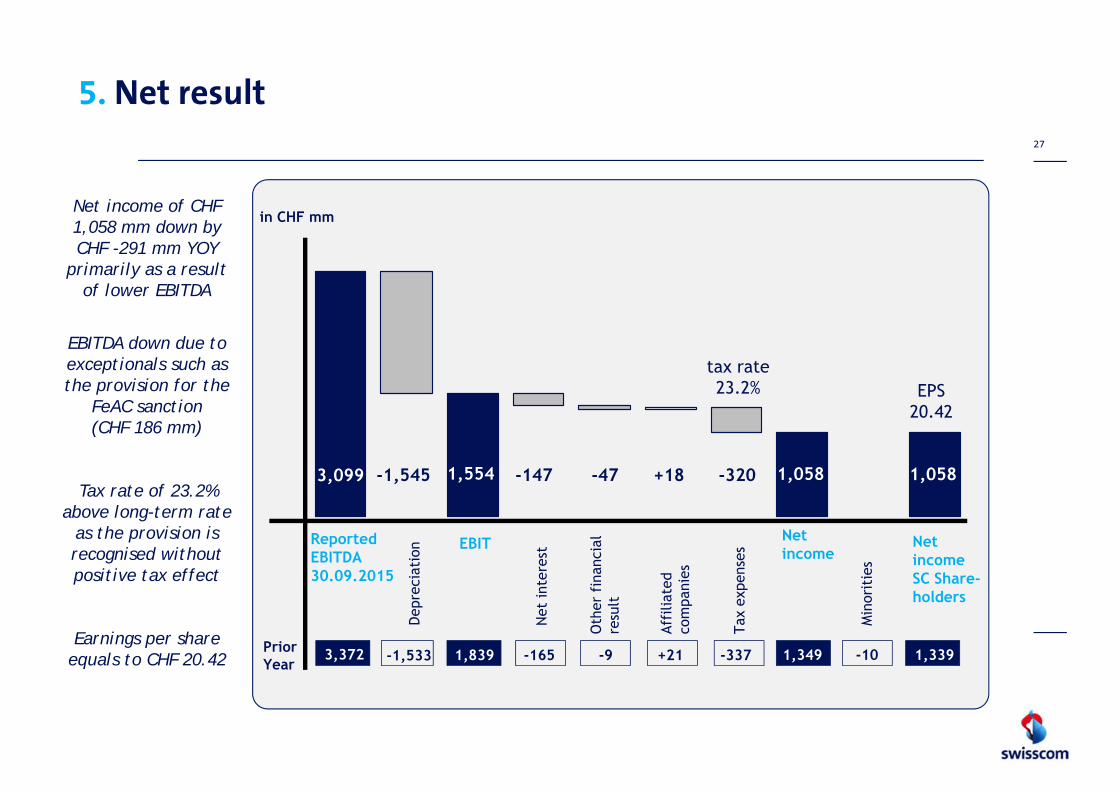
5. Net result
Net income of CHF 1,058 mm down by CHF -291 mm YOY
primarily as a result of lower EBITDA
EBITDA down due to exceptionals such as the provision for the
FeAC sanction(CHF 186 mm)
Tax rate of 23.2% above long-term rate
as the provision is recognised without positive tax effect
Earnings per share equals to CHF 20.42
Net income
ReportedEBITDA30.09.2015
Net
inte
rest
Oth
er f
inan
cial
re
sult
Prior Year
EBIT
Depr
ecia
tion
NetincomeSC Share-holders
Min
orit
ies
Affi
liate
d co
mpa
nies
Tax
expe
nses
1,7553,372 -1,533 -165 -9 -337 -10+211,839 1,349 1,339
in CHF mm
1,0583,099 -1,545 -1471,554 -47 -320 1,058+18
tax rate23.2% EPS
20.42
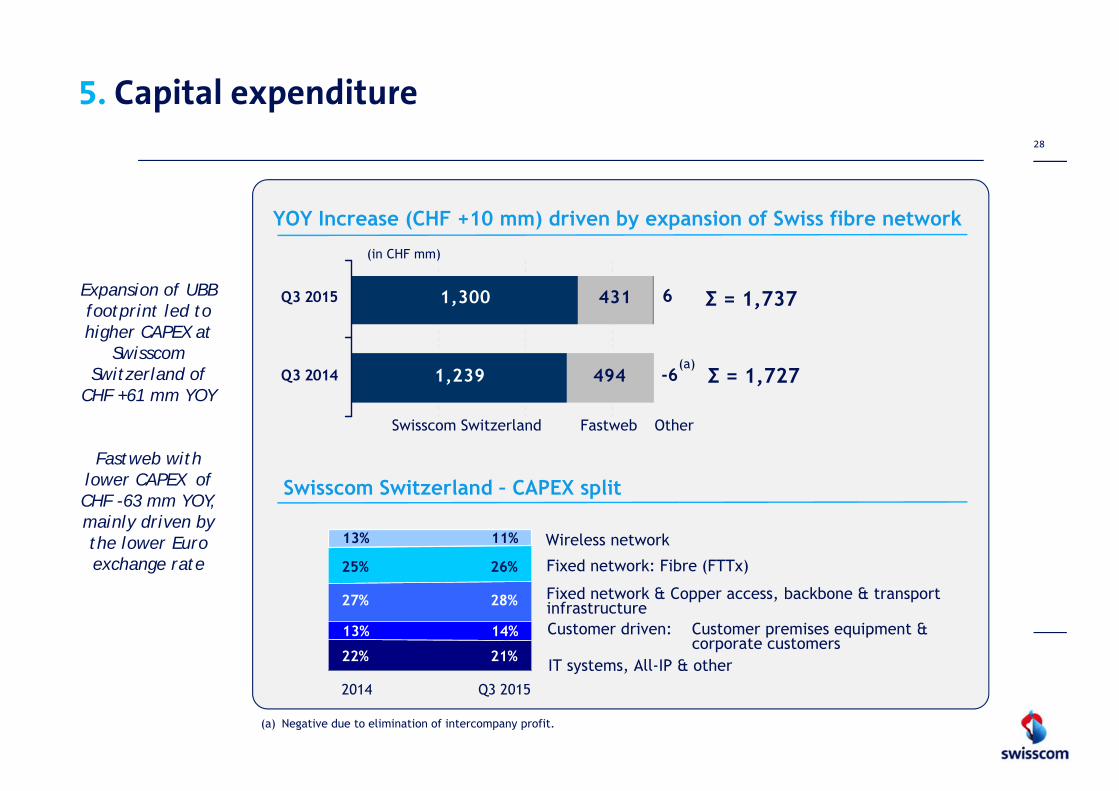
5. Capital expenditure28
1,239
1,300
494
431 6
Q3 2014
Q3 2015
(in CHF mm)
Σ = 1,727
Σ = 1,737
YOY Increase (CHF +10 mm) driven by expansion of Swiss fibre network
Swisscom Switzerland – CAPEX split
Swisscom Switzerland Fastweb Other
Fixed network: Fibre (FTTx)
Wireless network
Customer driven: Customer premises equipment & corporate customers
Q3 2015
13% 11%
2014
Fixed network & Copper access, backbone & transportinfrastructure
IT systems, All-IP & other
25% 26%
27% 28%
13% 14%
22% 21%
Expansion of UBB footprint led to higher CAPEX at
Swisscom Switzerland of
CHF +61 mm YOY
Fastweb with lower CAPEX of CHF -63 mm YOY, mainly driven by the lower Euro exchange rate
-6(a)
(a) Negative due to elimination of intercompany profit.

5. Operating free cash flow29
Operating free cash flow as per 30 Sept
2015 of CHF 1’429mm
(CHF -41mm YOY)
The provision for the FeAC sanction (CHF 186 mm) with no OpFCF impact
EBITDA
Paya
bles
Inve
ntor
y
∆
CAPEX
Rece
ivab
les
Oth
ers
Oth
er N
WC
in CHF mm
30.0
9.20
15
OpFCF
30.0
9.20
14
Roam
ing
Rec.
/Pay
ab.
3,099 -1,737
-37-86
+11 +54+130
-5
3,372 -1,727+63
-102 -48 +3-681,470
-23
-273 -10 -100 +59 +51+198 -41+18+16
Increase in NWC of 178 CHF mm(more tied up capital)
Decrease in NWC of 13 CHF mm(less tied up capital)
1,429

0
500
1000
1500
2015 2016 2017 2018 2019 2020 2021 2022 2023 2024 >2024
Domestic Bonds Eurobonds Swiss private placement Foreign private placement Bank loans
.
5. Refinancing Successful Eurobond issuance
Maturity profile and financing structure after Eurobond settlement
Bond details 1.75%, 2015 - 2025Amount EUR 500 millionTenor 10 yearsSpread 80 bps
Ratings A/A2Issuer Swisscom AGUse of proceeds general corporate purposes
30
Short-term money market borrowings are not included
49%
21%
4%
8%
18%
in C
HF
mm
31
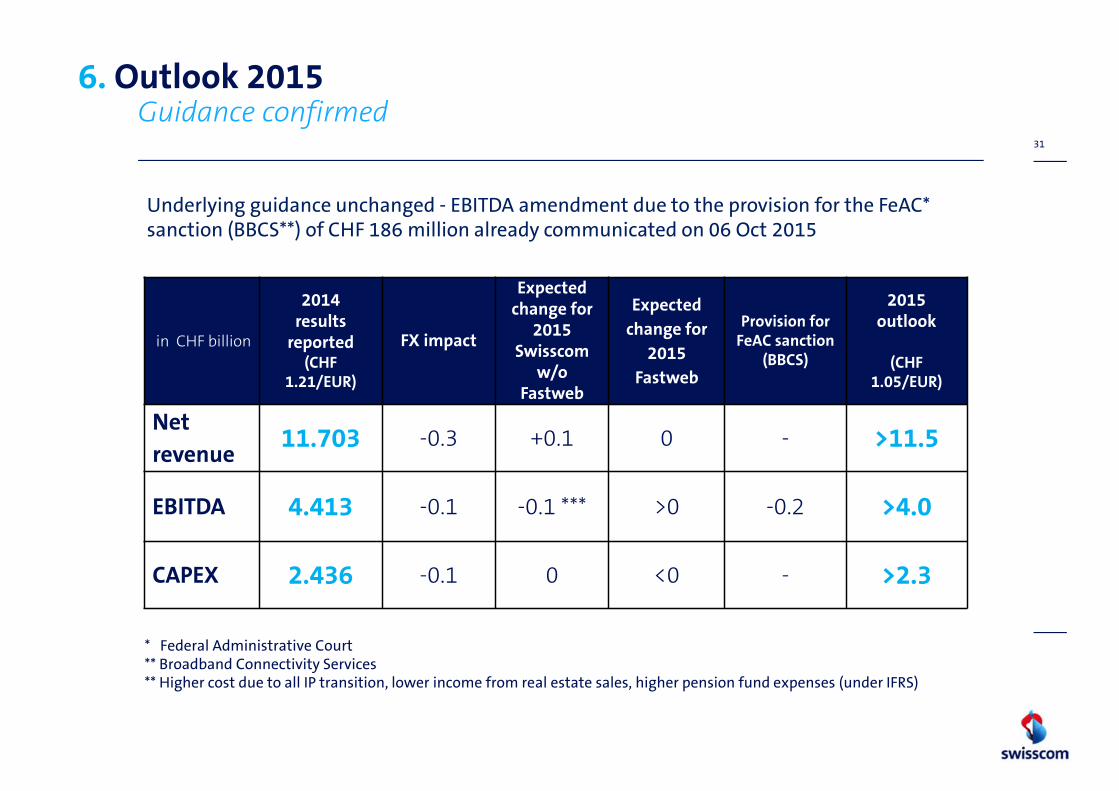
in CHF billion
2014results
reported(CHF
1.21/EUR)
FX impact
Expected change for
2015 Swisscom
w/o Fastweb
Expectedchange for
2015 Fastweb
Provision for FeAC sanction
(BBCS)
2015outlook
(CHF 1.05/EUR)
Net revenue 11.703 -0.3 +0.1 0 - >11.5
EBITDA 4.413 -0.1 -0.1 *** >0 -0.2 >4.0
CAPEX 2.436 -0.1 0 <0 - >2.3
* Federal Administrative Court** Broadband Connectivity Services ** Higher cost due to all IP transition, lower income from real estate sales, higher pension fund expenses (under IFRS)
6. Outlook 2015Guidance confirmed
Underlying guidance unchanged - EBITDA amendment due to the provision for the FeAC* sanction (BBCS**) of CHF 186 million already communicated on 06 Oct 2015
Welcome and introduction Louis Schmid, IR
1. Q3 in a nutshell Urs Schaeppi, CEO2. Quality key in Switzerland3. Strengthening of Swiss position4. Fastweb results
5. Group financials Mario Rossi, CFO6. Guidance 2015
Q&A All
Backup
32
Agenda

Welcome and introduction Louis Schmid, IR
1. Q3 in a nutshell Urs Schaeppi, CEO2. Quality key in Switzerland3. Strengthening of Swiss position4. Fastweb results
5. Group financials Mario Rossi, CFO6. Guidance 2015
Q&A All
Backup
33
Agenda

RGU dynamics34
+40k RGUs in Q3 2015 with 3P and
4P over-compensating 1P
losses
1P losses in 2015 accelerating
Net adds of RGUs in 2015 on a lower
level
Net adds of RGUs by products (in ‘000)
-111 -91
-64
-107 -124 -117 -110
16 14 16 4
-4 -2
-
116 91
75
117 123 108 98
52 52 44 52 44 48 52
-150
-100
-50
-
50
100
150
Q1 14 Q2 14 Q3 14 Q4 14 Q1 15 Q2 15 Q3 15
1P 2P 3P 4P
+73 +66 +71 +66 +39 +40+37

RGU’s35
8,423 (-458) (-5.2%)Single Play
2Play
3Play
301 (-1) 602 (-2) (-0.3%)
741 (+132) 2,300 (+446) (+25%)
165 (-81)
4Play1’164291 (+49)
TVFixed Voice& Access Broadband Mobile
Numberof
products in Bundle Sum Δ
2
1
3
4
1P
Bundles
1,632 (-270) 581 (-137) 6,045 (+30)
12,489 (+182) (+1.5%)Revenue Generating Units 1,275 (+150) 2,659 (-152) 1,937 (+65) 6,618 (+119)
Access Lines/Subs/Products (000)YTD, (Change to 30.09.2014 in brackets)
(+13%) (+3.5%) (+1.8%) (-5.4%)
Swisscom Switzerland
(+196) (+20%)
2)
1) including n-play (Business) Bundles2) o/w additional 27k Mobile Subs and 50k in Business Bundles
1)

ARPU36
2) ARPU excl. Business Networks3) ARPU excl. Mobile Termination
40 (-1)Single Play
2Play
3Play
106 (-3) 53 (-2)
141 (+3) 47 (+1)
14 (-2)
4Play 52 (-1)207 (-2)
TVFixed Voice& Access Broadband Mobile
Numberof
products in Bundle
Weighted average per underlying product
2
1
3
4
1P
Bundles
52 (+0) 36 (-0) 38 (-1)
45 (-0)Total weighted average 45 (-0)
YTD, (Change to 30.09.2014 in brackets)
3)
1,2)
2)1)
1) ARPU Base Fee
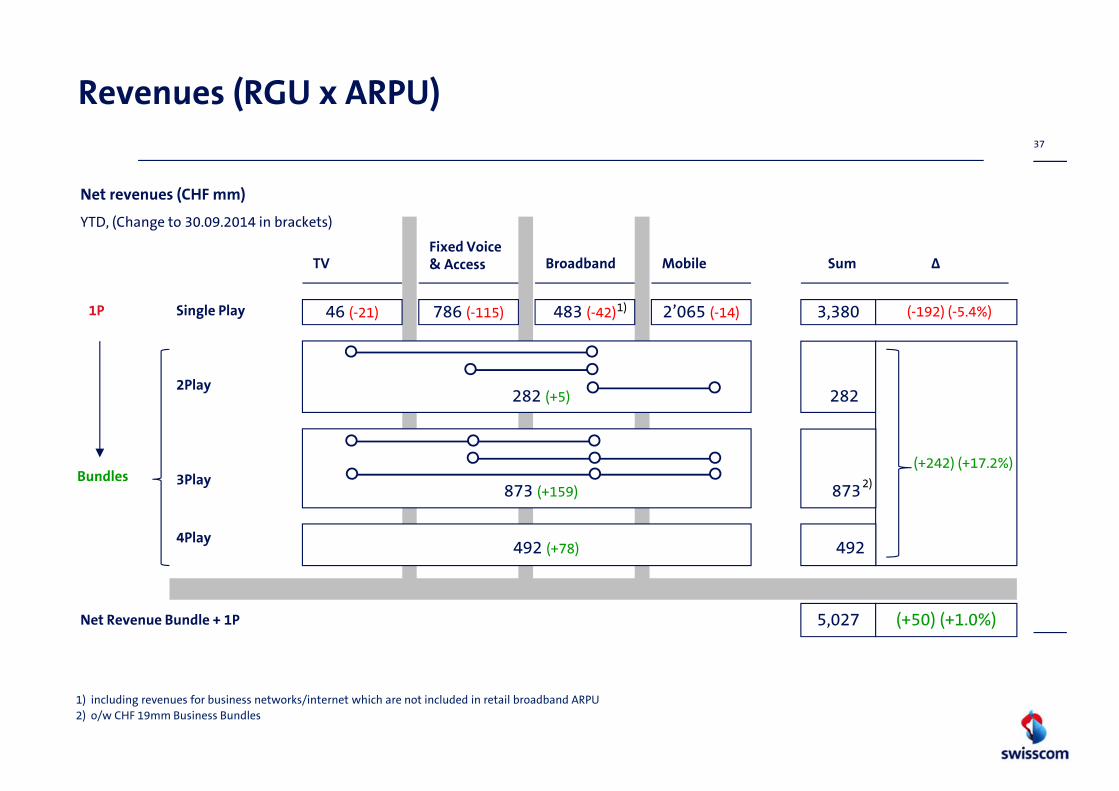
Revenues (RGU x ARPU)37
3,380 (-192) (-5.4%)Single Play
2Play
3Play
282 (+5) 282
873 (+159) 873
(+242) (+17.2%)
46 (-21)
4Play 492492 (+78)
TVFixed Voice& Access Broadband Mobile Sum Δ
1P
Bundles
786 (-115) 483 (-42) 2’065 (-14)
5,027 (+50) (+1.0%)Net Revenue Bundle + 1P
Net revenues (CHF mm)
YTD, (Change to 30.09.2014 in brackets)
1) including revenues for business networks/internet which are not included in retail broadband ARPU
1)
2) o/w CHF 19mm Business Bundles
2)

TV market Switzerland38
421 608 774 939 1'054 1'11117
61 111 164
465570
606652
689 695843
765698 648
306481
1'301 1'276 1'256 1'21138
74107 127
653
616
582557 540 518
2010 2011 2012 2013 2014 2015 Q3
Market volumes (000) digital TV
Satellite/Terrestrial
CATV / Net Integrators
UPC Cablecom Premium TVoption
Swisscom TV paid Abos
2‘275
1‘845
12 %
35 %
17 %
25 %
23 %
27 %
16 %
25 %
1) Migration to digital largely driven by analogue customers who have been transferred technically, but have not subscribed to a digital product yet: these are potential customers for Swisscom
1) 2)
Market share:
Market share:
3 % Sunrise
4‘1614‘324
Market Digital TV *
14 %
Swisscom TV light3 %
3‘917 4‘033
Analogue TV
Market digital + analogue
UPC Cablecom 1)
4‘455 4‘4742)
2) Time series modified
* Estimates for Q3 2015
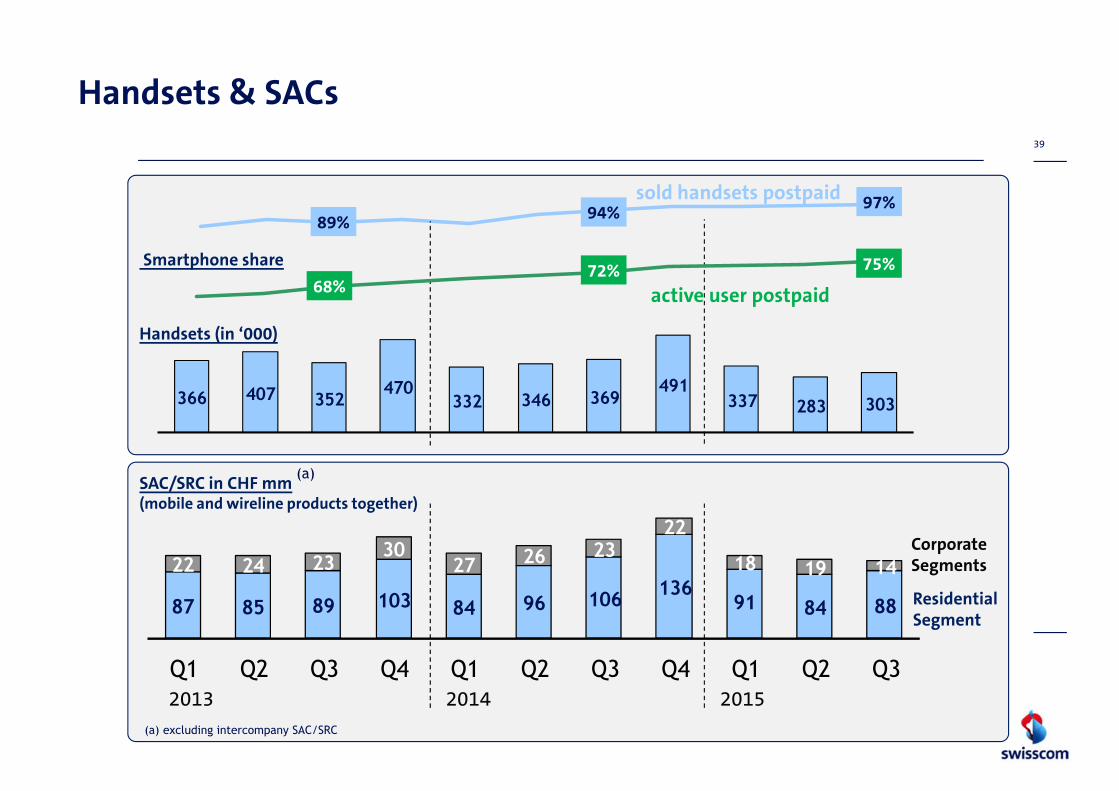
Handsets & SACs39
366 407 352470
332 346 369491
337 283 303
87 85 89 103 84 96 106 13691 84 88
22 24 2330
27 26 2322
18 19 14
Q1 Q2 Q3 Q4 Q1 Q2 Q3 Q4 Q1 Q2 Q3
SAC/SRC in CHF mm(mobile and wireline products together)
Smartphone share
Residential Segment
Corporate Segments
2013 2014
97% 89%
2015
Handsets (in ‘000)
94% sold handsets postpaid
75% 72% active user postpaid68%
(a) excluding intercompany SAC/SRC
(a)
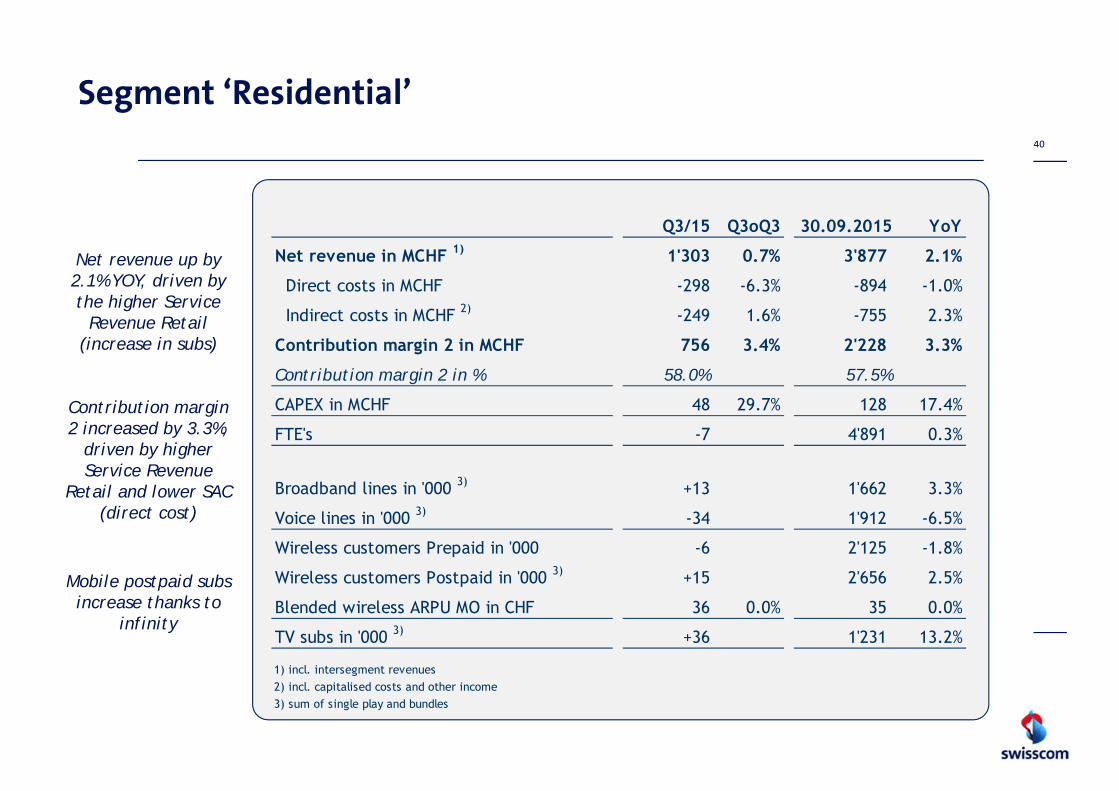
Segment ‘Residential’40
Q3/15 Q3oQ3 30.09.2015 YoY
Net revenue in MCHF 1) 1'303 0.7% 3'877 2.1%
Direct costs in MCHF -298 -6.3% -894 -1.0%
Indirect costs in MCHF 2) -249 1.6% -755 2.3%
Contribution margin 2 in MCHF 756 3.4% 2'228 3.3%
Contribution margin 2 in % 58.0% 57.5%
CAPEX in MCHF 48 29.7% 128 17.4%
FTE's -7 4'891 0.3%
Broadband lines in '000 3) +13 1'662 3.3%
Voice lines in '000 3) -34 1'912 -6.5%
Wireless customers Prepaid in '000 -6 2'125 -1.8%
Wireless customers Postpaid in '000 3) +15 2'656 2.5%
Blended wireless ARPU MO in CHF 36 0.0% 35 0.0%
TV subs in '000 3) +36 1'231 13.2%
1) incl. intersegment revenues2) incl. capitalised costs and other income3) sum of single play and bundles
Net revenue up by 2.1% YOY, driven by the higher Service
Revenue Retail (increase in subs)
Contribution margin 2 increased by 3.3%,
driven by higher Service Revenue
Retail and lower SAC (direct cost)
Mobile postpaid subs increase thanks to
infinity
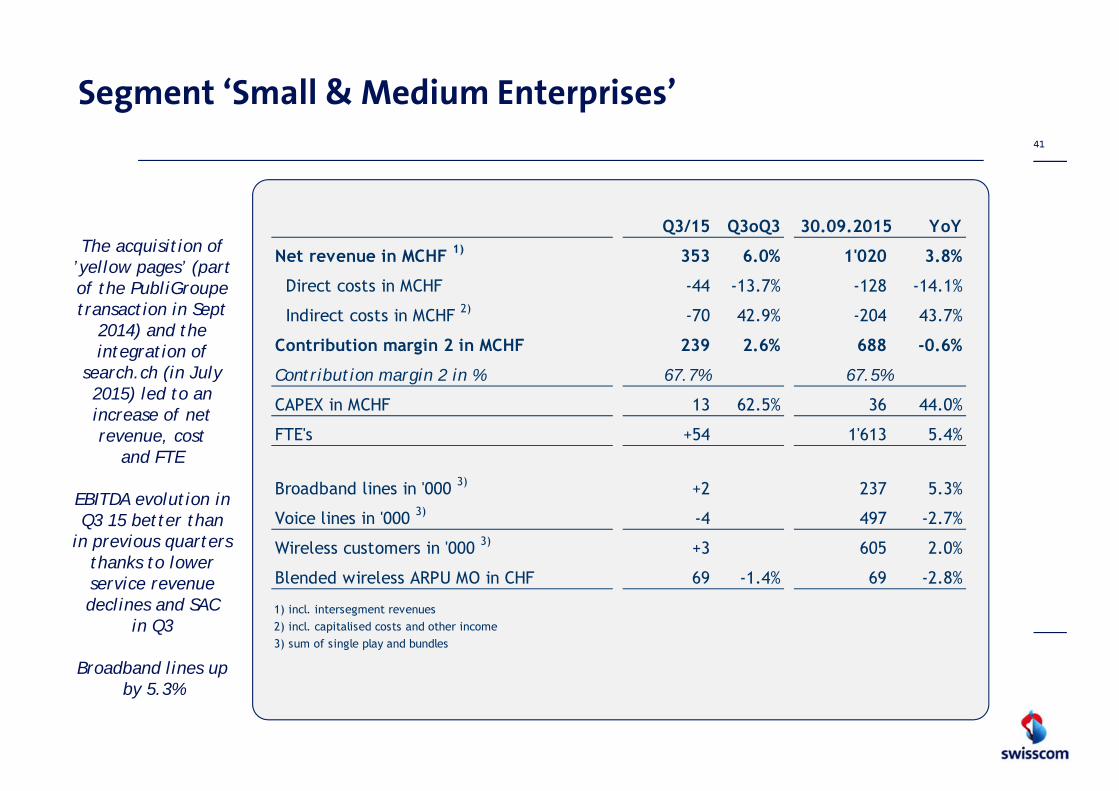
Segment ‘Small & Medium Enterprises’41
Q3/15 Q3oQ3 30.09.2015 YoY
Net revenue in MCHF 1) 353 6.0% 1'020 3.8%
Direct costs in MCHF -44 -13.7% -128 -14.1%
Indirect costs in MCHF 2) -70 42.9% -204 43.7%
Contribution margin 2 in MCHF 239 2.6% 688 -0.6%
Contribution margin 2 in % 67.7% 67.5%
CAPEX in MCHF 13 62.5% 36 44.0%
FTE's +54 1'613 5.4%
Broadband lines in '000 3) +2 237 5.3%
Voice lines in '000 3) -4 497 -2.7%
Wireless customers in '000 3) +3 605 2.0%
Blended wireless ARPU MO in CHF 69 -1.4% 69 -2.8%
1) incl. intersegment revenues2) incl. capitalised costs and other income3) sum of single play and bundles
The acquisition of ’yellow pages’ (part of the PubliGroupe transaction in Sept
2014) and the integration of
search.ch (in July 2015) led to an increase of net revenue, cost
and FTE
EBITDA evolution in Q3 15 better than
in previous quarters thanks to lower service revenue declines and SAC
in Q3
Broadband lines up by 5.3%
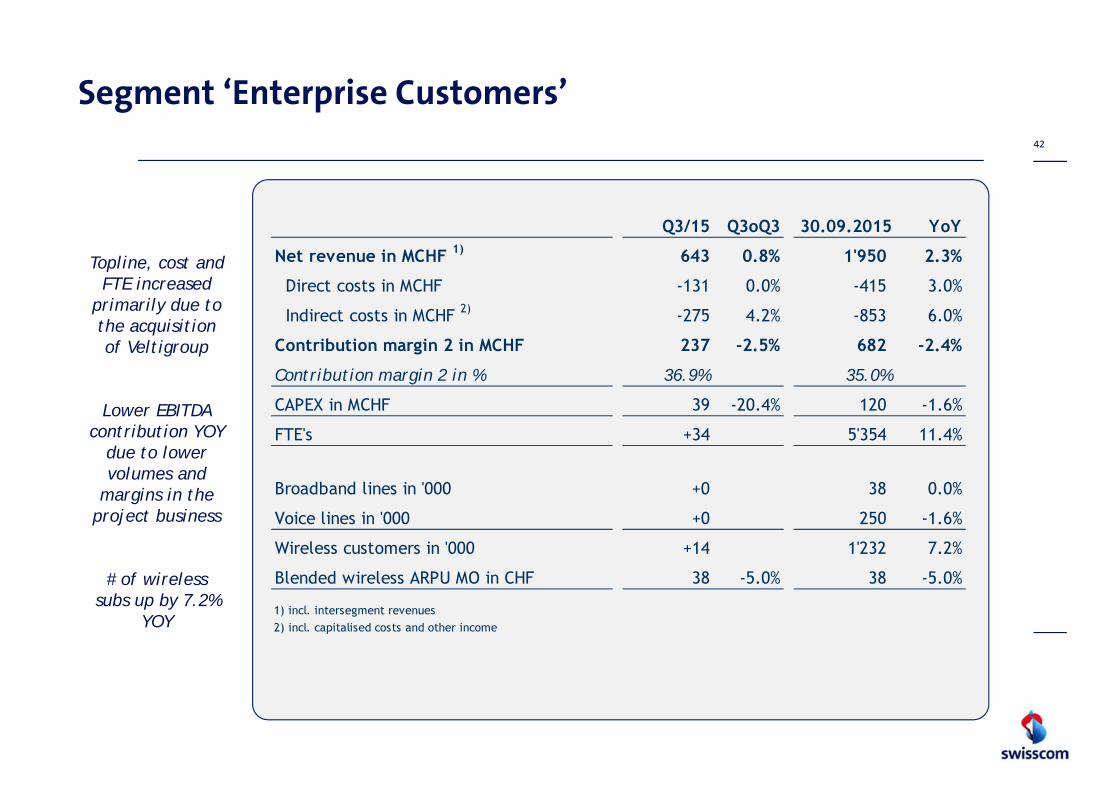
Segment ‘Enterprise Customers’42
Q3/15 Q3oQ3 30.09.2015 YoY
Net revenue in MCHF 1) 643 0.8% 1'950 2.3%
Direct costs in MCHF -131 0.0% -415 3.0%
Indirect costs in MCHF 2) -275 4.2% -853 6.0%
Contribution margin 2 in MCHF 237 -2.5% 682 -2.4%
Contribution margin 2 in % 36.9% 35.0%
CAPEX in MCHF 39 -20.4% 120 -1.6%
FTE's +34 5'354 11.4%
Broadband lines in '000 +0 38 0.0%
Voice lines in '000 +0 250 -1.6%
Wireless customers in '000 +14 1'232 7.2%
Blended wireless ARPU MO in CHF 38 -5.0% 38 -5.0%
1) incl. intersegment revenues2) incl. capitalised costs and other income
Topline, cost and FTE increased
primarily due to the acquisition of Veltigroup
Lower EBITDA contribution YOY
due to lower volumes and
margins in the project business
# of wireless subs up by 7.2%
YOY

Segment ‘Wholesale’43
Revenue from external customers
up 1.2%
Lower mobile termination fees
and prices for ULL products
compensated by higher inbound
roaming revenue
The provision for the FeAC sanction
of CHF 186mm impacting indirect
cost and contribution
margin 2
Q3/15 Q3oQ3 30.09.2015 YoY
Revenue from external customers in MCHF 145 0.7% 433 1.2%
Intersegment revenue in MCHF 105 10.5% 281 4.9%
Net revenue in MCHF 250 4.6% 714 2.6%
Direct costs in MCHF -145 6.6% -405 2.0%
Indirect costs in MCHF 1) -191 n.m. -202 n.m.
Contribution margin 2 in MCHF -86 n.m. 107 -62.5%
Contribution margin 2 w/o FeAC sanction 100 2.0% 293 2.8%
Contribution margin 2 in % -34.4% 15.0%
CAPEX in MCHF - -
FTE's -3 106 -3.6%
Full access lines in '000 -11 139 -31.9%
BB (wholesale) lines in '000 +10 301 24.9%
1) incl. capitalised costs and other income

Segment ‘IT, Network and Innovation’44
Q3/15 Q3oQ3 30.09.2015 YoY
Net revenue in MCHF 32 6.7% 97 4.3%
Direct costs in MCHF - - - -
Personnel expenses in MCHF -200 2.0% -638 4.8%
Rent in MCHF -49 0.0% -147 5.0%
Maintenance in MCHF -47 -6.0% -130 -9.7%
IT expenses in MCHF -55 1.9% -168 6.3%
Other OPEX in MCHF -89 17.1% -254 9.5%
Indirect costs in MCHF -440 3.5% -1'337 4.2%Capitalised costs and other income in MCHF 96 -23.2% 293 -2.3%
Contribution margin 2 in MCHF -312 15.6% -947 6.4%Depreciation, amortisation and impairment in MCHF -279 4.5% -822 4.8%
Segment result in MCHF -591 10.1% -1'769 5.7%
CAPEX in MCHF 358 -4.5% 1'016 3.5%
FTE's +36 5'212 3.2%
Lower gain on sale of real estate leads
to lower CM2
CAPEX of CHF 1’016mm up
3.5% YOY, due to further rollout of
broadband networks

Segment ‘Fastweb’45
Q3/15 Q3oQ3 30.09.2015 YoY
Consumer revenue in MEUR 196 4.8% 585 3.9%
Enterprise revenue in MEUR 193 -4.5% 584 3.0%
Wholesale revenue in MEUR 1) 35 0.0% 117 17.0%
Net revenue in MEUR 1) 424 0.0% 1'286 4.6%OPEX in MEUR 2) -279 -3.8% -881 2.4%
EBITDA in MEUR 145 8.2% 405 9.5%
EBITDA margin in % 34.2% 31.5%
CAPEX in MEUR 124 1.6% 403 -0.7%
OpFCF Proxy in MEUR 21 n.m. 2 -105.6%
FTE's +4 2'381 0.1%
BB customers in '000 +15 2'172 7.7%
In consolidated Swisscom accounts
EBITDA in MCHF 156 -4.3% 434 -3.6%
CAPEX in MCHF 133 -10.1% 431 -12.8%
1) incl. revenues to Swisscom companies
2) incl. capitalised costs and other income
Net revenues increased 4.6% YOY
All segments report an increase in
revenue
EBITDA of EUR 405 million up by 9.5%
YOY
Number of Broadband customers
up by 7.7% YOY reaching
2,17 million customers

Segment ‘Other’46
Q3/15 Q3oQ3 30.09.2015 YoY
External revenue in MCHF 80 -21.6% 257 -14.0%
Net revenue in MCHF 1) 149 -13.4% 449 -7.2%
OPEX in MCHF 2) -125 -11.3% -390 -2.0%
EBITDA in MCHF 24 -22.6% 59 -31.4%
EBITDA margin in % 16.1% 13.1%
CAPEX in MCHF 8 700.0% 20 33.3%
FTE's +3 1'725 -13.5%
1) incl. intersegment revenues2) incl. capitalised costs and other income
Net revenue down by 7.2% YOY due to
lower revenue out of construction
activities and the sale of companies
EBITDA down by 31.4% YOY

4747
Innovative fibre technologies Thanks to a mixture of access technologies, Swisscom can offer its customers multimedia services throughout Switzerland
Fibre-to-the-Home (and business, FTTH)> Since 2008 with 100 Mbps> Since 2013 with 1 Gbps
Fibre-optic Copper
Vectoring (FTTC)> VDSL2 since 2006, vectoring since early 2014<750m
Exchange
> Swisscom is bringing fibre-optic cabling ever closer to its customers throughout Switzerland
> A mixture of innovative fibre-optic technologies provides ultra-fast broadband internet access, even outside major urban centers
Fibre-to-the-Street (FTTS)> Since 2013 with VDSL2> After 2016 with G.fast
approx. 250m
DPU in Manhole
Fibre-to-the-Building (FTTB)> Since 2013 with VDSL2> After 2016 with G.fast
DPU in Basement

Regulatory updateDecision of the Federal Administrative Court on Broadband Internet
48
• The Competition Commission (COMCO) Secretariat started in October 2005 an investigation against Swisscom for alleged improper Broadband Connectivity Service (BBCS) pricing up to December 2007
• In October 2009, COMCO concluded that Swisscom held a market dominant position in the BBCS market and that it had abused this position applying a so-called margin squeeze with its competitors, not allowing them to conduct profitable operation of the broadband Internet business. Based on this the COMCO issued a decree with a fine of CHF 219 million. Swisscom contested this decree with the Federal Administrative Court
• On 6 October 2015 the Federal Administrative Court issued a decree with a fine of CHF 186 million confirming in principle the reasoning of the COMCO but reducing the fine. Swisscom has made a provision for the CHF 186 million
• Swisscom regrets the decree and maintains that the fine is unjustified and has no adequate legal foundation given e.g. that there was no obligation to offer BBCS, the investigation refers to the first few years following the launch of ADSL, initial losses are common with new businesses and the retail business was profitable in the long run
Next steps• The Federal Administrative Court decree will be contested with the Swiss Federal Court.
Swisscom expects the proceeding to take around 2 years till a final sentence is reached

Cautionary statementregarding forward-looking statements
”This communication contains statements that constitute "forward-looking statements". In this communication, suchforward-looking statements include, without limitation, statements relating to our financial condition, results ofoperations and business and certain of our strategic plans and objectives.
Because these forward-looking statements are subject to risks and uncertainties, actual future results may differmaterially from those expressed in or implied by the statements. Many of these risks and uncertainties relate tofactors which are beyond Swisscom’s ability to control or estimate precisely, such as future market conditions,currency fluctuations, the behaviour of other market participants, the actions of governmental regulators and otherrisk factors detailed in Swisscom’s and Fastweb’s past and future filings and reports, including those filed with theU.S. Securities and Exchange Commission and in past and future filings, press releases, reports and other informationposted on Swisscom Group Companies’ websites.
Readers are cautioned not to put undue reliance on forward-looking statements, which speak only of the date of thiscommunication.
Swisscom disclaims any intention or obligation to update and revise any forward-looking statements, whether as aresult of new information, future events or otherwise.”
For further information, please contact:+41 58 221 [email protected]/investor
49