Q3-04 Market Review
12
The Kane Company's Market Review Seacoast Area Third Quarter 2004 210 Commerce Way, Suite 100 Portsmouth, NH 03801 603-430-4000 www.netkane.com COMMERCIAL • INDUSTRIAL • REAL ESTATE THE KANE COMPANY, INC.
-
Upload
bonnie-roberts -
Category
Documents
-
view
149 -
download
0
Transcript of Q3-04 Market Review

The Kane Company's
Market ReviewSeacoast Area
Third Quarter 2004
210 Commerce Way, Suite 100Portsmouth, NH 03801
603-430-4000www.netkane.com
C O M M E R C I A L • I N D U S T R I A L •R E A L E S T A T E
T H E K A N E C O M P A N Y , I N C .

MARKET REVIEW I SEACOAST AREA I FOURTH QUARTER 20042 MARKET REVIEW I SEACOAST AREA I THIRD QUARTER 2004
T H E K A N E C O M PA N Y ’ S
Market ReviewSeacoast Area I Third Quarter 2004
C O M M E R C I A L • I N D U S T R I A L • R E A L E S TAT E
METHODOLOGY AND STATISTICAL GUIDELINES
Kane Market Review Methodology is focused on true end-of quarter, point-in-time reporting of office
and industrial available space, leasing and sales activity. Properties included in statistics: Office and
industrial properties with a minimum of 5,000 rentable square feet (sf).
SEACOAST MARKETS INCLUDED IN STATISTICS:
Dover, Durham, Exeter, Greenland, The Hamptons, Newington, Newfields, Newmarket, Portsmouth
(Downtown, Suburban, and Pease submarkets), Rye, Seabrook, Somersworth, and Stratham.
EXCLUDED FROM STATISTICS:
Government, medical, education, residential, retail and aviation use; under minimum 5,000 sf limit;
condos (unless owned as a block and frequently leased); proposed projects without approvals in place
or unlikely to begin construction within 3 years; buildings needing demolition or total rehabilitation;
buildings outside the market area; “missed” buildings added during the statistical year.
Owner-occupied office buildings, which are generally static with regard to current or historical statisti-
cally significant sales or leasing activity, are excluded from office statistics. Owner-occupied industrial
buildings, on the other hand, frequently experience economically and statistically significant sales and
leasing activity, and are included in industrial statistics.
AVAILABLE SPACE:
The market consists of available space marketed by landlords (direct space) and available space
marketed by tenants who hope to reduce their lease costs (sublease space). The total is the overall
space available. Vacancy rates are reported only on currently vacant (unoccupied) space.
RENTS:
Rents are reported for only marketed spaces which are vacant and unoccupied, i.e. available for
immediate occupancy. All reported office and industrial rents are based upon “asking” rents on space
available as of the closing date of the first quarter 2004. Average rents are weighted based on the
amount of space marketed. Margin of error is +/- 2-3%.
95
95
1
1
1
1A
16
11
101
101
51
51
4
100
88108
125
125
To Portland
Berwick
South Berwick
Somersworth
Rochester
Rollingsford
Dover
EliotKittery
York
New Castle
PortsmouthRye
NorthHampton
Hampton
Newburyport
Hampton Falls
Kensington
Stratham
Greenland
Newington
Spaulding TRPK
DurhamLee
Newmarket
Newfields
ExeterBrentwood
EppingToManchester
To Concord
Kingston
Barrington
SeabrookEast Kingston
ToBoston
210 COMMERCE WAY, SUITE 100 PORTSMOUTH, NH 03801 603-430-4000 WWW.NETKANE.COM 3
SEACOAST ECONOMIC OVERVIEW
With its highly skilled and well-educated workforce, favorable tax climate, top-ranked quality of life,
and immediate proximity to major transportation routes and hubs, New Hampshire’s Seacoast region possesses a flourishing business environment. The area’s highly diversified economy, with its healthy service and retail sectors, traditionally outperforms the rest of the region and the country even during periods of economic slowdown.
Recent indicators evidence southern New Hampshire’s recovery from the recession of the past several years.
New Hampshire continues to post the lowest unemployment rate in New England, with the Seacoast area besting most other regions of the state. While the nation’s September 2004 unemployment rate dropped only three tenths of a percentage point
to 5.4%, New Hampshire’s rate declined more than half a point over the course of the third quarter
to 3.3%. Rockingham County and the City of Portsmouth, its most vibrant commercial submarket,
improved by even larger margins: Rockingham County posted a 4.7% rate, 0.7 percentage points lower
than mid-year, while the City of Portsmouth unemployment shrank by more than a third during the
quarter to 3.2%, down 1.6 points from midyear’s 4.8%.
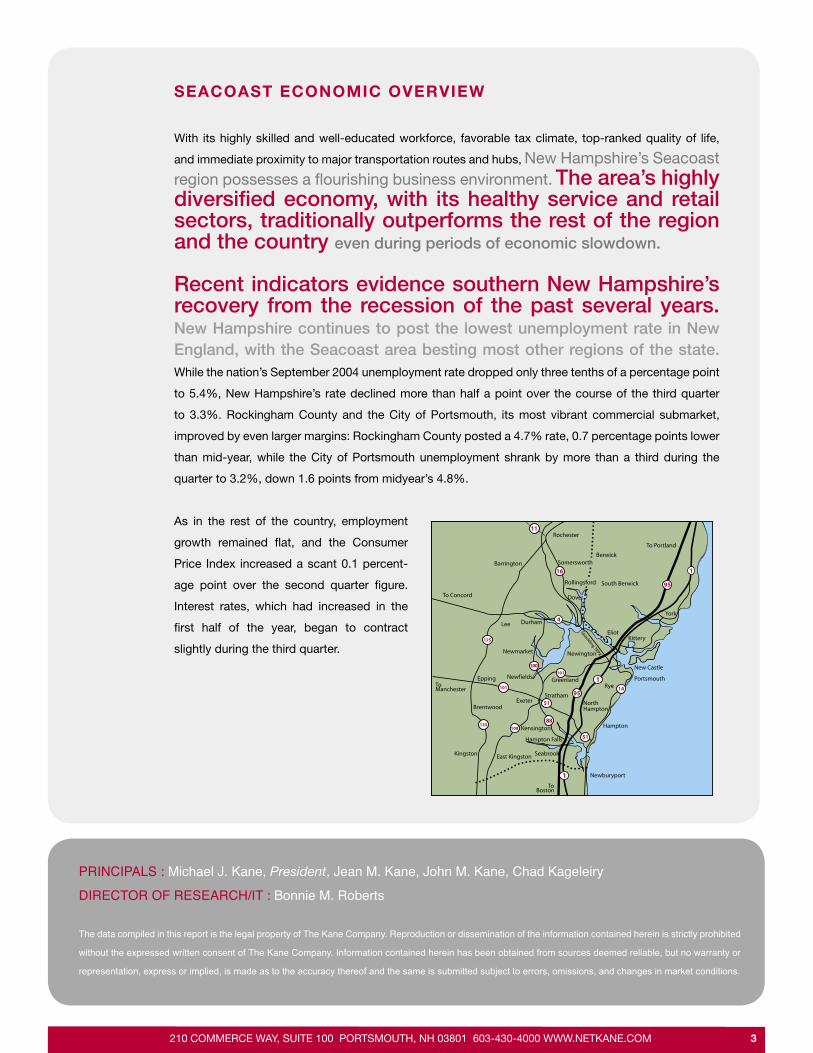
As in the rest of the country, employment
growth remained flat, and the Consumer
Price Index increased a scant 0.1 percent-
age point over the second quarter figure.
Interest rates, which had increased in the
first half of the year, began to contract
slightly during the third quarter.
PRINCIPALS : Michael J. Kane, President, Jean M. Kane, John M. Kane, Chad Kageleiry
DIRECTOR OF RESEARCH/IT : Bonnie M. Roberts
The data compiled in this report is the legal property of The Kane Company. Reproduction or dissemination of the information contained herein is strictly prohibited
without the expressed written consent of The Kane Company. Information contained herein has been obtained from sources deemed reliable, but no warranty or
representation, express or implied, is made as to the accuracy thereof and the same is submitted subject to errors, omissions, and changes in market conditions.
MARKET REVIEW I SEACOAST AREA I FOURTH QUARTER 20044 MARKET REVIEW I SEACOAST AREA I THIRD QUARTER 2004
SEACOAST OFFICE MARKET
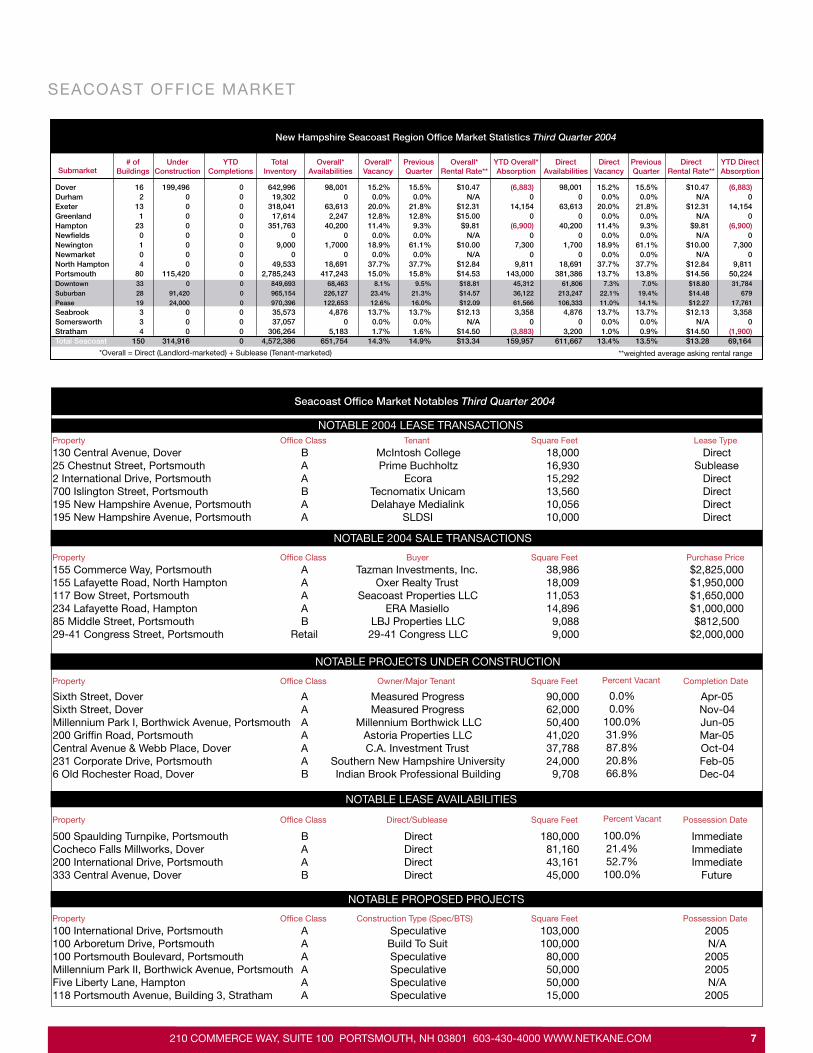
Absorption in the Seacoast remains well into positive territory for the first time in several years and has in-creased steadily each quarter, with 159,957 square feet (sf) posted year-to-date. Overall vacancy in the market dropped 0.6 percentage
points from the previous quarter to 14.3%, and direct vacancy declined a scant 0.1 point to 13.4%.
Vacancy in the Portsmouth area declined to 15.0% from mid-year’s 15.8%, with fluctuations within its
various submarkets as tenants relocated between them.
Having stabilized by the first quarter of 2004, asking rents inched up by only a scant 1.6% in the Portsmouth area and remained steady in most other submarkets, with the overall rate for the region slipping to $13.34 from second quarter’s $13.40. Prices are not expected to rise significantly through the rest
of the year; rather, tenants continue to bargain for increased concessions or gross rents.
Continuing the trend of the past several quarters, most leasing activity was driven by lease expirations,
with many tenants either renewing their leases at more favorable terms or relocating to higher quality
space, in the “flight-to-quality” phenomenon characteristic of real estate market recovery. While third
quarter leasing levels dropped back slightly from second quarter’s brisk pace, little significant new
sublease space was added to the market over the year, and leasing activity was modest but steady,
with the majority occurring in deals for existing sublease space and smaller blocks of direct space.
As a result, the year’s largest lease deals did not overwhelmingly impact absorption. Despite the
year’s largest lease to date (McIntosh College’s expansion into 18,000 sf at 130 Central Avenue),
the Dover submarket experienced a small amount of negative absorption. Portsmouth submarkets posted a whopping 143,000 sf of positive absorption, accounting for nearly 90% of the entire Seacoast region’s activity to date in 2004. Pease Interna-tional Tradeport showed the most activity year-to-date, with three leases of over
10,000 sf contributing to Pease’s 61,566 sf overall absorption. Downtown Portsmouth posted 45,312
sf of positive absorption and the second largest lease of the year, Prime Buchholtz’s relocation and
5,000 sf expansion into 16,930 sf at 25 Chestnut Street. With the suburban Portsmouth Circle Business
Center slated for a retail conversion in 2005, Ecora Software relocated to 15,292 sf at 2 International
Drive in the Pease submarket, while Tecnomatix Unicam moved from Pease to suburban Portsmouth,
where it took 13,560 sf at 700 Islington Street.
New office construction totaling 314,916 sf will add 6.9% to the 4.6 msf (million square feet) of Seacoast office inventory in 2004 and early 2005. While the pipeline is not at pre-recession
levels, these new projects are 65.7% pre-leased, providing additional proof of a steady recovery in the
region’s office markets. Speculative development is on the rebound as well, with proposed class A
office projects totaling another 183,000 sf scheduled to break ground in winter 2004-2005. The recovery
210 COMMERCE WAY, SUITE 100 PORTSMOUTH, NH 03801 603-430-4000 WWW.NETKANE.COM 5
has also boosted confidence in the retail and hospitality sectors, as two new hotels and two office/retail
mixed use projects are planned for the downtown Portsmouth area in late 2004 and 2005.
Investors continue to display unprecedented demand for fully leased, well-located assets. Demand for
properties that meet these requirements far exceeds supply and they continue to sell very quickly at top
market pricing, with cap rates falling below 10%. In the area’s largest sale year-to-date, 155 Commerce
Way, a 38,986 sf Class A office building in suburban Portsmouth’s Commerce Center, recently changed
hands for $2,825,000, or $72.46 psf (per square foot). More than doubling that rate was the sale of 117
Bow Street, 11,053 sf historic class A office space on the waterfront in downtown Portsmouth, which
brought $1,650,000 ($149.28 psf). The largest sale of 2004 will likely be that of downtown Portsmouth’s
only large premium property, the 109,172 sf Harbour Place development directly on Portsmouth’s
waterfront. One of the only downtown sites available with on-site parking, the two-building class
A property went on the market in the third quarter for $21.3 million ($195.10 psf) and is now under
agreement and expected to close in the fourth quarter.
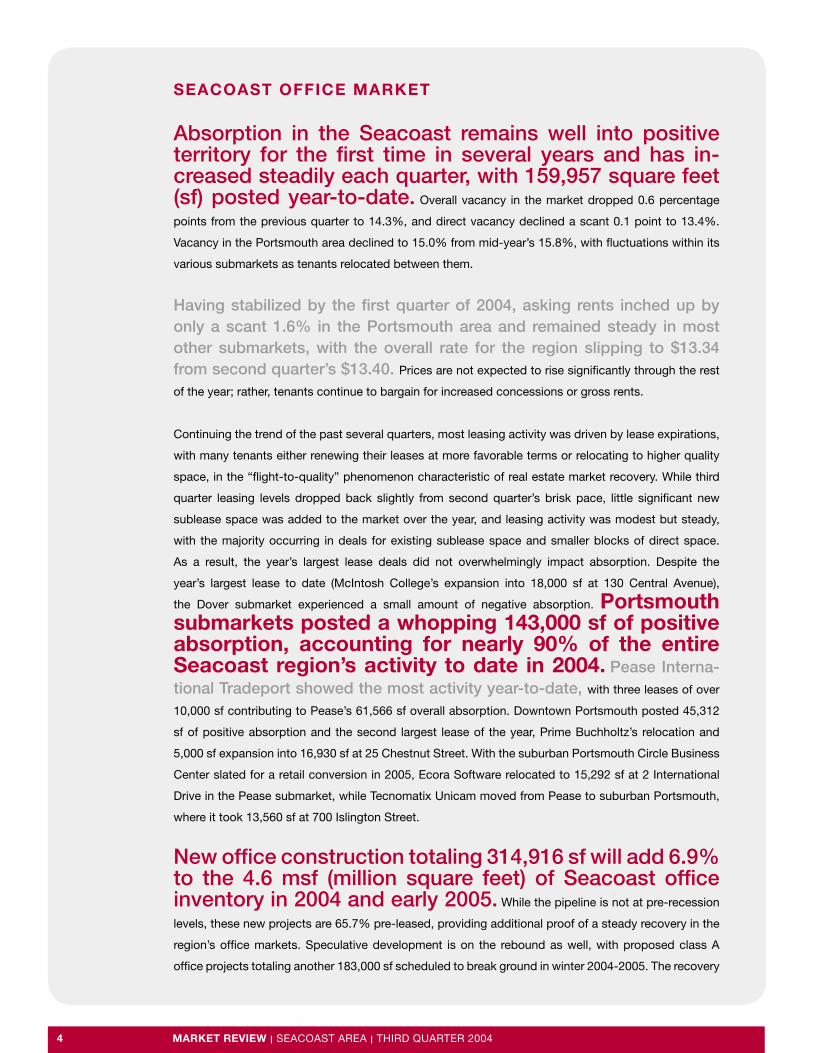
MILLENNIUM PARK I, 155 BORTHWICK AVENUE, PORTSMOUTH PROFESSIONAL OFFICE SPACE. TWO 50,400 SF OFFICE BUILDINGS.
Heated Underground Parking - Next to Portsmouth Regional Hospital
7.7 acres - Ready for Occupancy February 2005
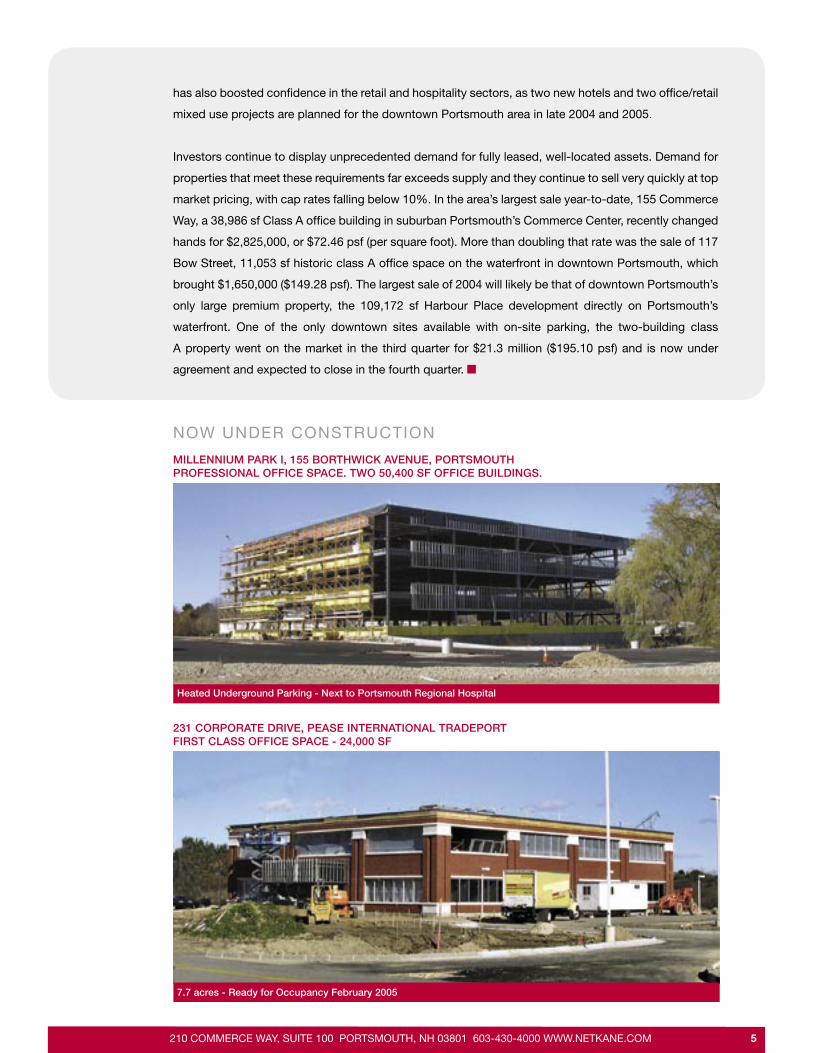
231 CORPORATE DRIVE, PEASE INTERNATIONAL TRADEPORT FIRST CLASS OFFICE SPACE - 24,000 SF
NOW UNDER CONSTRUCTION

MARKET REVIEW I SEACOAST AREA I FOURTH QUARTER 20046 MARKET REVIEW I SEACOAST AREA I THIRD QUARTER 2004
SEACOAST OFFICE MARKET
0% 5% 10% 15% 20% 25% 30% 35% 40%
SEACOAST OFFICE DIRECT VACANCY RATES
DOVER
EXETER
HAMPTON
NORTH HAMPTON
DOWNTOWN PORTSMOUTH
SUBURBAN PORTSMOUTH
PEASE
SEABROOK
Q2 2004
Q3 2004
SEACOAST OFFICE INVENTORY
PeaseInternational
Tradeport26%
Seabrook1%
Stratham1%
Somersworth1%
Dover15%
Exeter7%
Hampton8%
North Hampton
1%
DowntownPortsmouth
22%
Suburban Portsmouth
23%
6,657 12,880 16,320
61,806 213,247 106,333
781,230 739,027 847,743
0
200,000
400,000
600,000
800,000
1,000,000
SUBLEASE SF
DIRECT SF
OCCUPIED SF
DOWNTOWN
SQ
UA
RE
F
OO
TA
GE SUBURBAN PEASE
AVAILABLE OFFICE SPACE IN PORTSMOUTH
DIRECT ASKING RENTS — SEACOAST OFFICE
Q2 2004
Q3 2004
DOVER
EXETER
HAMPTON
NEWINGTON
NORTH HAMPTON
DOWNTOWN PORTSMOUTH
SUBURBAN PORTSMOUTH
PEASE
SEABROOK
$0.00 $5.00 $10.00 $15.00 $20.00
Having stabilized by the first quarter of 2004, asking rents inched up by only
a scant 1.6% in the Portsmouth area and remained steady in most other
submarkets, with the overall rate for the region slipping to $13.34 from second
quarter’s $13.40.
Overall vacancy in the market dropped 0.6 percentage points from the previous
quarter to 14.3%, and direct vacancy declined a scant 0.1 point to 13.4%.
New office construction totaling 314,916 sf will add
6.9% to the 4.6 msf (million square feet) of Seacoast
office inventory in 2004 and early 2005.
Investors continue to display unprecedented demand
for fully leased, well-located assets. Demand for prop-
erties that meet these requirements far exceeds sup-
ply and they continue to sell very quickly at top market
pricing, with cap rates falling below 10%.
210 COMMERCE WAY, SUITE 100 PORTSMOUTH, NH 03801 603-430-4000 WWW.NETKANE.COM 7
SEACOAST OFFICE MARKET
Percent Vacant
Percent Vacant
NOTABLE 2004 LEASE TRANSACTIONS
Seacoast Office Market Notables Third Quarter 2004
Property Office Class Tenant Square Feet Lease Type
130 Central Avenue, Dover B McIntosh College 18,000 Direct25 Chestnut Street, Portsmouth A Prime Buchholtz 16,930 Sublease2 International Drive, Portsmouth A Ecora 15,292 Direct700 Islington Street, Portsmouth B Tecnomatix Unicam 13,560 Direct195 New Hampshire Avenue, Portsmouth A Delahaye Medialink 10,056 Direct195 New Hampshire Avenue, Portsmouth A SLDSI 10,000 Direct
Property Office Class Buyer Square Feet Purchase Price
155 Commerce Way, Portsmouth A Tazman Investments, Inc. 38,986 $2,825,000155 Lafayette Road, North Hampton A Oxer Realty Trust 18,009 $1,950,000117 Bow Street, Portsmouth A Seacoast Properties LLC 11,053 $1,650,000234 Lafayette Road, Hampton A ERA Masiello 14,896 $1,000,00085 Middle Street, Portsmouth B LBJ Properties LLC 9,088 $812,50029-41 Congress Street, Portsmouth Retail 29-41 Congress LLC 9,000 $2,000,000
Property Office Class Owner/Major Tenant Square Feet Completion Date
Sixth Street, Dover A Measured Progress 90,000 0.0% Apr-05Sixth Street, Dover A Measured Progress 62,000 0.0% Nov-04Millennium Park I, Borthwick Avenue, Portsmouth A Millennium Borthwick LLC 50,400 100.0% Jun-05200 Griffin Road, Portsmouth A Astoria Properties LLC 41,020 31.9% Mar-05Central Avenue & Webb Place, Dover A C.A. Investment Trust 37,788 87.8% Oct-04231 Corporate Drive, Portsmouth A Southern New Hampshire University 24,000 20.8% Feb-056 Old Rochester Road, Dover B Indian Brook Professional Building 9,708 66.8% Dec-04
Property Office Class Direct/Sublease Square Feet Possession Date
500 Spaulding Turnpike, Portsmouth B Direct 180,000 100.0% ImmediateCocheco Falls Millworks, Dover A Direct 81,160 21.4% Immediate200 International Drive, Portsmouth A Direct 43,161 52.7% Immediate333 Central Avenue, Dover B Direct 45,000 100.0% Future
Property Office Class Construction Type (Spec/BTS) Square Feet Possession Date
100 International Drive, Portsmouth A Speculative 103,000 2005100 Arboretum Drive, Portsmouth A Build To Suit 100,000 N/A100 Portsmouth Boulevard, Portsmouth A Speculative 80,000 2005Millennium Park II, Borthwick Avenue, Portsmouth A Speculative 50,000 2005Five Liberty Lane, Hampton A Speculative 50,000 N/A118 Portsmouth Avenue, Building 3, Stratham A Speculative 15,000 2005
NOTABLE LEASE AVAILABILITIES
NOTABLE PROPOSED PROJECTS
NOTABLE 2004 SALE TRANSACTIONS
NOTABLE PROJECTS UNDER CONSTRUCTION
*Overall = Direct (Landlord-marketed) + Sublease (Tenant-marketed) **weighted average asking rental range
New Hampshire Seacoast Region Office Market Statistics Third Quarter 2004
# ofBuildings
YTDCompletions
UnderConstruction
TotalInventory
Overall*Availabilities
Overall*Vacancy
PreviousQuarter
Overall*Rental Rate**
YTD Overall*Absorption
DirectAvailabilities
DirectVacancy
PreviousQuarter
DirectRental Rate**
YTD DirectAbsorptionSubmarket
Dover 16 199,496 0 642,996 98,001 15.2% 15.5% $10.47 (6,883) 98,001 15.2% 15.5% $10.47 (6,883)Durham 2 0 0 19,302 0 0.0% 0.0% N/A 0 0 0.0% 0.0% N/A 0Exeter 13 0 0 318,041 63,613 20.0% 21.8% $12.31 14,154 63,613 20.0% 21.8% $12.31 14,154Greenland 1 0 0 17,614 2,247 12.8% 12.8% $15.00 0 0 0.0% 0.0% N/A 0 Hampton 23 0 0 351,763 40,200 11.4% 9.3% $9.81 (6,900) 40,200 11.4% 9.3% $9.81 (6,900)Newfields 0 0 0 0 0 0.0% 0.0% N/A 0 0 0.0% 0.0% N/A 0Newington 1 0 0 9,000 1,7000 18.9% 61.1% $10.00 7,300 1,700 18.9% 61.1% $10.00 7,300 Newmarket 0 0 0 0 0 0.0% 0.0% N/A 0 0 0.0% 0.0% N/A 0North Hampton 4 0 0 49,533 18,691 37.7% 37.7% $12.84 9,811 18,691 37.7% 37.7% $12.84 9,811Portsmouth 80 115,420 0 2,785,243 417,243 15.0% 15.8% $14.53 143,000 381,386 13.7% 13.8% $14.56 50,224Downtown 33 0 0 849,693 68,463 8.1% 9.5% $18.81 45,312 61,806 7.3% 7.0% $18.80 31,784Suburban 28 91,420 0 965,154 226,127 23.4% 21.3% $14.57 36,122 213,247 22.1% 19.4% $14.48 679Pease 19 24,000 0 970,396 122,653 12.6% 16.0% $12.09 61,566 106,333 11.0% 14.1% $12.27 17,761Seabrook 3 0 0 35,573 4,876 13.7% 13.7% $12.13 3,358 4,876 13.7% 13.7% $12.13 3,358Somersworth 3 0 0 37,057 0 0.0% 0.0% N/A 0 0 0.0% 0.0% N/A 0Stratham 4 0 0 306,264 5,183 1.7% 1.6% $14.50 (3,883) 3,200 1.0% 0.9% $14.50 (1,900) Total Seacoast 150 314,916 0 4,572,386 651,754 14.3% 14.9% $13.34 159,957 611,667 13.4% 13.5% $13.28 69,164
MARKET REVIEW I SEACOAST AREA I FOURTH QUARTER 20048 MARKET REVIEW I SEACOAST AREA I THIRD QUARTER 2004
SEACOAST INDUSTRIAL MARKETS
Despite the high technology and manufacturing slowdowns of the past several years, job growth in the
manufacturing sector has grown slowly but steadily over the past year, and the Seacoast’s industrial
markets continue to outperform those in both neighboring Massachusetts and the U.S. as a whole.
Year-to-date overall absorption dipped slightly in the third quarter but remains in positive territory despite the addition to the market of a large chunk of sublease space in Ports-mouth’s Pease submarket, as Flextronics removed the last of their personnel from their 102,400 sf Corporate Drive facility. Overall vacancy
rose slightly to 10.8 percent in the third quarter and direct vacancy increased a half percentage point to
4.5%, both figures that compare very favorably with high industrial vacancy rates posted elsewhere in
New England and the nation. Rents have increased slowly throughout the year and continued their slow
climb throughout the quarter, with overall and direct asking rents averaging $6.32 and $5.28 respec-
tively. With large amounts of the newest and most modern industrial product located at Portsmouth’s
Pease submarket, the highest asking rents were posted there, averaging $7.20 overall and $6.12 for
direct space.
Leasing activity was brisk, with the top five largest leases of the year all posting in the third quarter. While three
of the largest transactions were part of sale-leaseback deals, Stonewall Kitchen subleased 99,360 sf
from Flextronics at 132 Milton Road in Rochester for its new distribution facility, and Off Price Outlets
leased 34,850 sf of warehouse space at 3 Great Falls Avenue in Rochester.
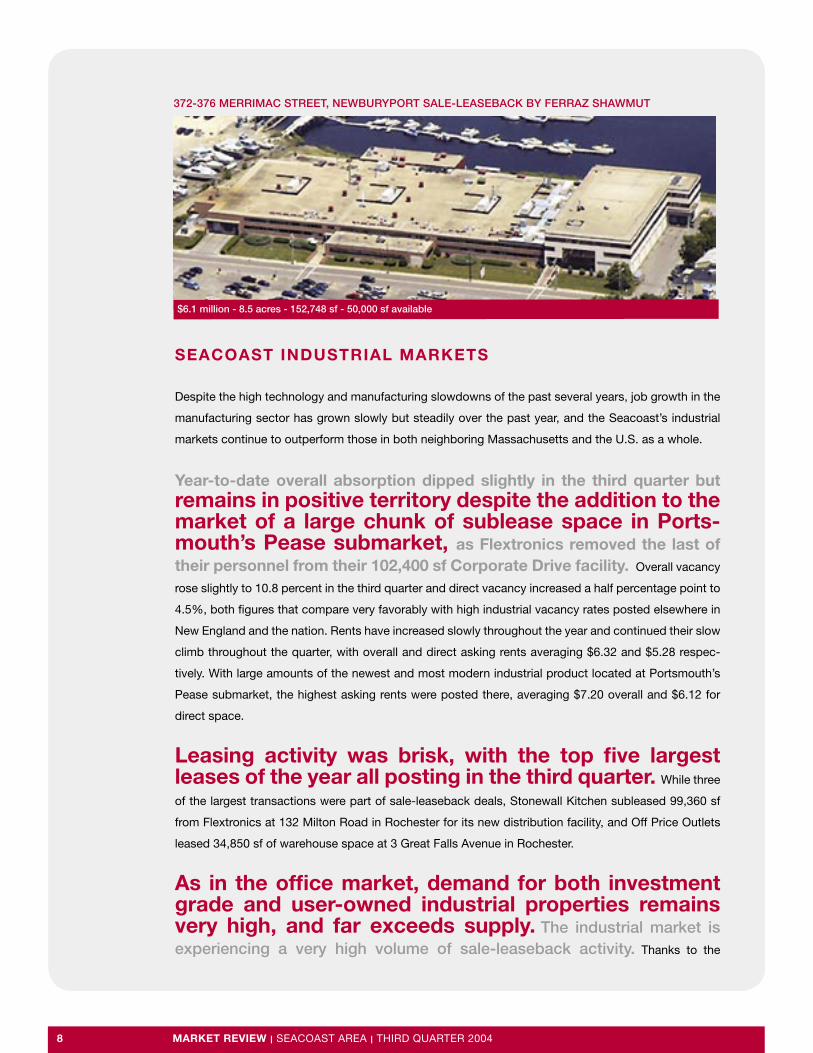
As in the office market, demand for both investment grade and user-owned industrial properties remains very high, and far exceeds supply. The industrial market is experiencing a very high volume of sale-leaseback activity. Thanks to the
$6.1 million - 8.5 acres - 152,748 sf - 50,000 sf available
372-376 MERRIMAC STREET, NEWBURYPORT SALE-LEASEBACK BY FERRAZ SHAWMUT

210 COMMERCE WAY, SUITE 100 PORTSMOUTH, NH 03801 603-430-4000 WWW.NETKANE.COM 9
growing economy and the currently favorable interest rate and capital gains tax climate, owner-users
seeking either space consolidation or to generate cash for expansion or R&D are benefiting greatly
from the current market in which their sale proceeds are maximized and leaseback terms are extremely
competitive. In the largest sale and lease of the year, Hampton’s Foss Manufacturing sold and leased
back their large manufacturing campus (approximately 425,000 sf on 60 acres) for $27.5 million.
Two facilities at 16 and 74 Industrial Park Drive in Dover, a combined 115,627 sf on twenty acres, were
sold for $1.68 million and $1.42 million respectively and leased back by Collins & Aikman. In addition
Ferraz Shawmut sold its 152, 748 sf facility on 8.5 acres for $6.1 million and leased back two thirds of
the building, in a move to consolidate space.
As manufacturers and distributors seek ways to cut costs and increase productivity, many are
upgrading to more efficient facilities or relocating to smaller buildings. Strong asking rents, low interest rates and the desire to buy for less than replacement cost continues to fuel the ongoing recent trend for industrial users to purchase rather than lease. Due to tight supply and a scarcity of buildable industrial land, demand and
competition for owner-user properties remains very strong, and properties tend to turn over very quickly
at premium prices. Decoto LLC (Sea View Technologies) purchased the 64,260 sf warehouse property
at 22 Industrial Drive in Exeter for $2,825,000, and are now offering their present 30,000 sf space at 14
Patterson Lane in Newington for sublease. Rand Whitney/Northeast Container purchased the 198,000
sf manufacturing building at 216 Airport Drive in Rochester, and sold their former 80,000 sf location at
45 Industrial Drive in Dover to Kessler Sunbelt Distribution.
Construction deliveries in 2003 added only 56,000 sf, or less than half a percentage point, to the
13.3 msf of industrial inventory in the Seacoast. To date in 2004, only an additional 19,000 sf was
completed, and with only 10,000 sf remaining under construction and very little in the pipeline or proposed,
vacancy is expected to remain tight in the overall Seacoast market for some time to come.
��������������
�����������������������������
����������
��������
��������
�����������
���������
�����������
�����������
�����������
�������������
��������������������
��
������������������
������������
�����������
��������
DIRECT ASKING RENTS — SEACOAST INDUSTRIAL
Q2 2004
Q3 2004DOVER
EXETER
GREENLAND
HAMPTON
NEWFIELDS
NEWINGTON
NORTH HAMPTON
SUBURBAN PORTSMOUTH
PEASE
SEABROOK
SOMERSWORTH
$0.00 $2.00 $4.00 $6.00 $8.00 $10.00
SEACOAST INDUSTRIAL MARKET

MARKET REVIEW I SEACOAST AREA I FOURTH QUARTER 200410 MARKET REVIEW I SEACOAST AREA I THIRD QUARTER 2004
SEACOAST INDUSTRIAL MARKET
*Overall = Direct (Landlord-marketed) + Sublease (Tenant-marketed) **weighted average asking rental range
New Hampshire Seacoast Region Industrial Market Statistics Third Quarter 2004
# ofBuildings
YTDCompletions
UnderConstruction
TotalInventory
Overall*Availabilities
Overall*Vacancy
PreviousQuarter
Overall*Rental Rate**
YTD Overall*Absorption
DirectAvailabilities
DirectVacancy
PreviousQuarter
DirectRental Rate**
YTD DirectAbsorptionSubmarket
Dover 59 10,000 7,000 2,169,765 86,834 4.0% 2.6% $5.14 72,666 86,834 4.0% 2.6% $5.14 72,666 Durham 2 0 0 730,906 0 0.0% 0.0% N/A 0 0 0.0% 0.0% N/A 0 Exeter 26 0 0 1,156,625 330,410 28.6% 30.0% $6.10 4,600 66,660 5.8% 7.2% $5.52 4,600 Greenland 12 0 0 880,189 38,075 4.3% 4.3% $5.04 (24,075) 38,075 4.3% 4.3% $5.04 (24,075)Hampton 16 0 0 782,552 27,569 3.5% 4.2% $5.20 31,741 25,019 3.2% 4.2% $5.13 34,291 Newfields 3 0 0 374,880 80,000 21.3% 21.3% $3.95 0 80,000 21.3% 21.3% $3.95 0 Newington 8 0 0 298,429 24,749 8.3% 7.0% $6.25 (10,500) 24,749 8.3% 7.0% $6.25 (10,500)Newmarket 7 0 0 375,362 0 0.0% 0.0% N/A 24,000 0 0.0% 0.0% N/A 24,000 North Hampton 7 0 0 115,209 16,200 14.1% 14.1% $7.00 (16,200) 16,200 14.1% 14.1% $7.00 (16,200)Portsmouth 52 0 0 2,409,041 577,337 24.0% 18.6% $7.20 31,980 158,199 6.6% 5.0% $6.12 4,880 Downtown 0 0 0 0 0 0.0% 0.0% N/A 0 0 0.0% 0.0% N/A 0 Suburban 35 0 0 986,239 20,200 2.0% 4.5% $5.41 89,980 20,200 2.0% 3.3% $5.41 68,313 Pease 17 0 0 1,422,802 557,137 39.2% 28.4% $7.26 (58,000) 137,999 9.7% 6.2% $6.23 (63,433)
Seabrook 43 0 12,000 1,882,840 194,882 10.4% 8.5% $6.60 (26,982) 44,882 2.4% 0.5% $5.25 (31,182)
Somersworth 39 0 0 1,835,755 54,240 3.0% 3.0% $4.00 (14,740) 54,240 3.0% 3.0% $4.00 (14,740)
Stratham 4 0 0 292,728 0 0.0% 0.0% N/A 0 0 0.0% 0.0% N/A 0
Total Seacoast 278 10,000 19,000 13,304,281 1,430,296 10.8% 9.4% $6.32 72,490 594,858 4.5% 3.9% $5.28 43,740
Seacoast Industrial Market Notables Third Quarter 2004
NOTABLE LEASE AVAILABILITIES
NOTABLE PROPOSED PROJECTS
NOTABLE 2004 LEASE TRANSACTIONS
NOTABLE 2004 SALE TRANSACTIONS
NOTABLE PROJECTS UNDER CONSTRUCTION
Property Industrial Type Tenant Square Feet Lease Type 380/390 Lafayette Rd, 11 Merrill Dr, Hampton Manufacturing Foss Manufacturing 423,510 Direct132 Milton Road, Rochester Warehouse Stonewall Kitchen 99,360 Sublease16 Industrial Park Drive, Dover Manufacturing Collins & Aikman 60,000 Direct74 Industrial Park Drive, Dover Flex/R&D Collins & Aikman 55,627 Direct3 Great Falls Avenue, Rochester Manufacturing Off Price Outlets 34,850 Direct239 Walton Road, Seabrook Warehouse Spherex 34,580 Direct125 Ocean Road, Greenland Warehouse H.A. Bouffard 34,000 Direct40 Old Dover Road, Newington Warehouse Fireplace Products 27,418 Direct15 Centre Road, Somersworth Manufacturing The Rubber Group 26,500 Direct235 Heritage Avenue, Portsmouth Warehouse S.G. Torrice 19,000 Sublease15 Batchelder Road, Seabrook Warehouse Adhesive Engineering & Supply 11,200 Direct
NOTABLE 2004 SALE TRANSACTIONS Property Industrial Type Buyer Square Feet Purchase Price380/390 Lafayette Rd, 11 Merrill Dr, Hampton Manufacturing Foss NH QRS 16-3 Inc. 423,510 $27,500,000 216 Airport Drive, Rochester Manufacturing 216 Airport Drive LLC 198,200 $3,600,000 45 Industrial Park Drive, Dover Manufacturing 45 Industrial Drive Assoc LLC (KSD) 80,000 $2,060,000 22 Industrial Drive, Exeter Warehouse Decoto LLC (Sea View Technologies) 64,260 $2,825,000 16 Industrial Park Drive, Dover Manufacturing 16 Industrial Park Drive LLC 60,000 $1,680,000 74 Industrial Park Drive, Dover Flex/R&D 74 Industrial Park Drive LLC 55,627 $1,420,000 140 Crosby Road, Dover Manufacturing Mary & Liam Brennan 35,000 $945,000 1 Spring Street, Newmarket Warehouse Town of Newmarket 24,000 $600,000
NOTABLE 2004 CONSTRUCTION COMPLETIONS Property Industrial Type Owner/Major Tenant Square Feet Percent Vacant Completion Date93 Ledge Road, Seabrook Warehouse Robert A Carbone et al 12,000 25.0% Jul-048-12 Crosby Road, Dover Warehouse Precision Mechanical Contractors 7,000 0.0% Jan-04
NOTABLE PROJECTS UNDER CONSTRUCTION Property Industrial Type Owner/Major Tenant Square Feet Percent Vacant Completion Date32 Crosby Road, Dover Warehouse N/A 10,000 100.0% Nov-04
NOTABLE LEASE AVAILABILITIES Property Industrial Type Direct/Sublease Square Feet Percent Vacant Possession Date100 Domain Drive, Exeter Mfg/Ofc Sublease 263,750 100.0% Immediate72 Pease Boulevard, Portsmouth Mfg/Ofc Sublease 206,338 100.0% Immediate100 Ledge Road, Seabrook Warehouse Sublease 150,000 29.9% Immediate162 Corporate Drive, Portsmouth Mfg/Ofc Sublease 102,400 100.0% Immediate164 Corporate Drive, Portsmouth Mfg/Ofc Sublease 102,400 100.0% Immediate166 Corporate Drive, Portsmouth Mfg/Ofc Sublease 102,400 100.0% Immediate100 Main Street, Somersworth Manufacturing Direct 100,400 57.6% Immediate85 Industrial Park Drive, Dover Warehouse Direct 90,000 33.3% Immediate16 Swamscott Street, Newfields Manufacturing Direct 80,000 69.6% Immediate
210 COMMERCE WAY, SUITE 100 PORTSMOUTH, NH 03801 603-430-4000 WWW.NETKANE.COM 11
G L O S S A R Y
ASKING RENTAL RATES: NNN ASKING RATES PER SQUARE FOOT FOR DIRECT SPACE, WEIGHTED BY THE AMOUNT OF SQUARE FOOTAGE AVAILABLE.
AVAILABLE SQUARE FEET: EXISTING RENTABLE SQUARE FEET AVAILABLE FOR IMMEDIATE OCCUPANCY.
CAP RATE: THE PERCENTAGE USED TO DETERMINE THE VALUE OF INCOME PROPERTY THROUGH CAPITALIZATION.
CONSTRUCTION COMPLETIONS: BUILDINGS THAT HAVE RECEIVED THEIR CERTIFICATE OF OCCUPANCY. TENANCY MAY NOT YET HAVE TAKEN PLACE.
DIRECT AVAILABLE SPACE: SPACE AVAILABLE THROUGH THE BUILDING LANDLORD.
DIRECT VACANCY RATE: SPACE, AVAILABLE THROUGH THE LANDLORD, DIVIDED BY THE INVENTORY. SPACE IN PROPERTIES UNDER CONSTRUCTION OR UNDER RENOVATION NOT INCLUDED.
INVENTORY: INCLUDES ALL EXISTING COMPETITIVE BUILDINGS THAT SATISFY THE RENTABLE SQUARE FOOTAGE CUT-OFF SIZE OR LARGER. GOVERNMENT, MEDICAL AND OWNER-OCCUPIED OFFICE BUILDINGS ARE NOT INCLUDED.
LEASING ACTIVITY: THE SUM OF ALL COMPLETED TRANSACTIONS IN A GIVEN PERIOD OF TIME, INCLUDING SUBLET SPACE AND PRE-LEASING BUT EXCLUDING RENEWALS.
MODIFIED GROSS: RENT INCLUDING ALL OPERATING EXPENSES EXCEPT UTILITIES AND JANITORIAL.
NET ABSORPTION: THE CHANGE IN OCCUPIED SPACE FOR A GIVEN PERIOD OF TIME, EXCLUD-ING PRE-LEASING ACTIVITY AND RENEWALS.
OVERALL VACANCY RATE: SPACE, AVAILABLE BOTH DIRECTLY AND THROUGH SUBLEASE, DIVIDED BY THE INVENTORY. SPACE IN PROPERTIES UNDER CONSTRUCTION OR UNDER RENOVATION NOT INCLUDED.
PRE-LEASING ACTIVITY: THE SUM OF ALL COMPLETED LEASE TRANSACTIONS IN UNDER CONSTRUCTION, UNDER RENOVATION AND PROPOSED PROJECTS.
PROPOSED: PROJECTS WHICH ARE IN THE PLANNING STAGES AND MAY, OR MAY NOT, HAVE BEEN APPROVED. CONSTRUCTION HAS NOT YET BEGUN.
SALES ACTIVITY: EXISTING BUILDING SALE TRANSACTIONS EXECUTED DURING A PERIOD OF TIME.
SUBLEASE SPACE: SPACE AVAILABLE THROUGH THE LESSEE TO THIRD PARTY FOR THE REMAINDER OF THE LESSEE’S TERM.
TOTAL SQUARE FEET (SF): GROSS BUILDING SQUARE FOOTAGE MINUS BALCONIES, STAIRWELL AND COMMON AREAS.
TRIPLE NET (NNN): A LEASE IN WHICH THE TENANT PAYS, IN ADDITION TO RENT, CERTAIN COSTS ASSOCIATED WITH A LEASED PROPERTY, WHICH MAY INCLUDE PROPERTY TAXES, INSURANCE PREMIUMS, REPAIRS, UTILITIES, AND MAINTENANCE.
UNDER CONSTRUCTION: PROJECTS WHICH ARE BEYOND SITE PREPARATION. A CERTIFICATE OF OCCUPANCY HAS NOT BEEN ISSUED. UNDER CONSTRUCTION PROJECTS DO NOT INCLUDE PROJECTS UNDER RENOVATION.
VACANCY RATE: AVAILABLE SQUARE FEET DIVIDED BY THE TOTAL SQUARE FEET.
M A J O R M A R K E T D E F I N I T I O N S

210 Commerce Way, Suite 100Portsmouth, NH 03801
603-430-4000www.netkane.com
C O M M E R C I A L • I N D U S T R I A L •R E A L E S T A T E
T H E K A N E C O M P A N Y , I N C .
The Kane Company's
Market ReviewSeacoast Area
Third Quarter 2004