Q2 / Second quarter report 2017 - GlobeNewswire Support...
47
Q2 / Second quarter report 2017 June 30, 2017 March 31, 2017 Change % 2017 2016 Change % FINANCIAL Petroleum and natural gas sales 61,280 76,089 (19) 137,369 84,652 62 Funds flow From operations (1) 24,941 36,382 (31) 61,322 18,034 240 Per share - diluted 0.20 0.29 (31) 0.48 0.14 239 Earnings Income (loss) before tax 36,030 10,874 231 46,903 (74,455) 163 Per share - diluted 0.29 0.09 232 0.37 (0.59) 163 Income (loss) after tax 24,855 7,694 223 32,548 (56,657) 157 Per share - diluted 0.20 0.06 224 0.26 (0.45) 157 Capital expenditures Exploration, development, land, and facility 22,116 41,658 (47) 63,773 23,355 173 Acquisitions (dispositions) and other - net (108,977) (675) 16,045 (109,652) (412) 26,515 Net capital expenditures (86,861) 40,983 (312) (45,879) 22,943 (300) Total assets 1,133,387 1,230,978 (8) 1,133,387 1,237,887 (8) Net debt (1) 466,875 583,777 (20) 466,875 561,585 (17) Shareholders' equity 398,421 372,525 7 398,421 398,975 - Total shares outstanding (thousands) - As at end of period (2) 126,133 126,106 - 126,133 126,064 - OPERATING Production Natural gas (MMcf/d) 84 93 (10) 88 90 (2) Oil (Bbl/d) 5,221 6,305 (17) 5,760 4,090 41 Condensate (Boe/d) 1,474 2,059 (28) 1,765 1,590 11 Natural gas liquids (Boe/d) 1,043 1,207 (14) 1,125 860 31 Total production (Boe/d @ 6:1) 21,669 25,133 (14) 23,391 21,543 9 Liquids Composition (percentage) 36 38 (6) 37 30 22 Average prices after financial instruments Natural gas ($/Mcf) 3.04 3.63 (16) 3.35 2.10 60 Crude Oil ($/Bbl) 62.08 62.69 (1) 62.41 44.07 42 Condensate ($/Boe) 61.86 63.25 (2) 62.67 49.64 26 Natural gas liquids ($/Boe) 28.57 32.95 (13) 30.91 19.42 59 Average realized price ($/Boe) 32.28 35.97 (10) 34.25 24.05 42 Drilling activity (gross) Gas 4 4 - 8 3 167 Oil - 6 (100) 6 3 100 Total wells 4 10 (60) 14 6 133 Three Months Ended Six Months Ended June 30 (1) Funds flow from operations and net debt are non-GAAP terms. Please refer to the advisory on Non-GAAP measures below. (2) Excluding shares held in trust for the benefit of Trilogy’s officers and employees under the Company’s Share Incentive Plan. Includes Common Shares and Non-voting Shares. Refer to the notes to the interim consolidated financial statements for additional information.
Transcript of Q2 / Second quarter report 2017 - GlobeNewswire Support...

Q2 / Second quarter report 2017
June 30, 2017
March 31, 2017 Change % 2017 2016 Change %
FINANCIAL Petroleum and natural gas sales 61,280 76,089 (19) 137,369 84,652 62 Funds flow
From operations(1) 24,941 36,382 (31) 61,322 18,034 240 Per share - diluted 0.20 0.29 (31) 0.48 0.14 239
Earnings Income (loss) before tax 36,030 10,874 231 46,903 (74,455) 163 Per share - diluted 0.29 0.09 232 0.37 (0.59) 163 Income (loss) after tax 24,855 7,694 223 32,548 (56,657) 157 Per share - diluted 0.20 0.06 224 0.26 (0.45) 157
Capital expendituresExploration, development, land,and facility 22,116 41,658 (47) 63,773 23,355 173
Acquisitions (dispositions) andother - net (108,977) (675) 16,045 (109,652) (412) 26,515
Net capital expenditures (86,861) 40,983 (312) (45,879) 22,943 (300) Total assets 1,133,387 1,230,978 (8) 1,133,387 1,237,887 (8) Net debt(1) 466,875 583,777 (20) 466,875 561,585 (17) Shareholders' equity 398,421 372,525 7 398,421 398,975 - Total shares outstanding (thousands)
- As at end of period (2) 126,133 126,106 - 126,133 126,064 - OPERATING Production
Natural gas (MMcf/d) 84 93 (10) 88 90 (2) Oil (Bbl/d) 5,221 6,305 (17) 5,760 4,090 41 Condensate (Boe/d) 1,474 2,059 (28) 1,765 1,590 11 Natural gas liquids (Boe/d) 1,043 1,207 (14) 1,125 860 31 Total production (Boe/d @ 6:1) 21,669 25,133 (14) 23,391 21,543 9 Liquids Composition (percentage) 36 38 (6) 37 30 22
Average prices after financialinstruments
Natural gas ($/Mcf) 3.04 3.63 (16) 3.35 2.10 60 Crude Oil ($/Bbl) 62.08 62.69 (1) 62.41 44.07 42 Condensate ($/Boe) 61.86 63.25 (2) 62.67 49.64 26 Natural gas liquids ($/Boe) 28.57 32.95 (13) 30.91 19.42 59 Average realized price ($/Boe) 32.28 35.97 (10) 34.25 24.05 42
Drilling activity (gross)Gas 4 4 - 8 3 167 Oil - 6 (100) 6 3 100 Total wells 4 10 (60) 14 6 133
Three Months Ended Six Months Ended June 30
(1) Funds flow from operations and net debt are non-GAAP terms. Please refer to the advisory on Non-GAAP measures below. (2) Excluding shares held in trust for the benefit of Trilogy’s officers and employees under the Company’s Share Incentive Plan. Includes Common Shares and Non-voting Shares. Refer to the notes to the interim consolidated financial statements for additional information.

MANAGEMENT’S DISCUSSION AND ANALYSIS
This Management’s Discussion and Analysis (“MD&A”) provides the details of the financial condition and results of operations of Trilogy Energy Corp. (“Trilogy” or the “Company”) for the six months ended June 30, 2017, and should be read in conjunction with the Company’s interim consolidated financial statements and related notes for the same six months ended, (the “Interim Financial Statements”) and its December 31, 2016 annual consolidated financial statements (“Annual Financial Statements”) and related MD&A. The Interim Financial Statements have been prepared in Canadian dollars in accordance with International Financial Reporting Standards (“IFRS”).
Readers are cautioned of the advisories on forward-looking statements, estimates, non-GAAP measures, numerical references and Oil and Gas advisories which can be found at the end of this MD&A. This MD&A is dated and was prepared using available information as of August 2, 2017.
Financial and Operating Highlights
• Reported sales volumes for the second quarter of 2017 decreased 14 percent to 21,669 Boe/d (36 percent liquids) as compared to 25,133 Boe/d (38 percent liquids) for the first quarter of 2017. The decrease was attributed to dispositions of assets at the end of May, scheduled and non-scheduled plant and pipeline outages, new well production declines and for wet surface conditions which precluded access and production from a number of sites. Year-over-year, for the six months ended June 30, reported sales volumes increased by 9 percent on new well production at Trilogy’s Montney oil play and resumed production on less economic plays in conjunction with recovering commodity prices in the latter part of 2016. Liquids composition increased year-over-year by 7 percent to 37 percent of total reported sales volumes. Production for July is estimated to be approximately 25,000 Boe/d and production volumes are expected to average approximately 25,000 Boe/d for the third quarter of 2017;
• Average realized pricing, after hedges, decreased by 10 percent to $32.28/Boe ($31.08/Boe before hedges) in thesecond quarter of 2017 from $35.97/Boe ($33.64/Boe before hedges) in the previous quarter. Year over year, for thesix months ended June 30, average realized pricing, after hedges, increased 42 percent (50 percent before hedges)over 2016;
• Funds flow from operations (1) decreased 31 percent to $24.9 million for the second quarter of 2017 as compared to$36.4 million for the previous quarter. Year over year, for the six months ended June 30, funds flow from operationsincreased by 240 percent in 2017 to $61.3 million from $18.0 million in 2016;
• Trilogy drilled 3.0 net wells in the second quarter for a total year-to-date of 12.0 net wells drilled. Capital expenditures,prior to acquisitions and dispositions, totaled $22.1 million for the second quarter compared to $41.6 million for thefirst quarter;
• Trilogy completed the sale in the second quarter of non-core oil and gas properties for proceeds of approximately$110 million. The proceeds were applied against Trilogy’s Revolving Credit Facility. Net debt (1) decreased, on thedisposition, to $466.9 million as at June 30, 2017 from $588.6 million as at December 31, 2016. Capacity under theCompany’s Revolving Credit Facility is approximately $111 million as at the end of the second quarter;
• Subsequent to the quarter, Trilogy has announced that it has entered into an agreement to merge with ParamountResources Ltd. (“Paramount”). Under the merger, Paramount would acquire all of the common shares and non-votingshares of Trilogy not already owned by Paramount in exchange for common shares of Paramount on the basis of one Paramount share for every 3.75 Trilogy shares. The merger is to be effected by way of an arrangement under theBusiness Corporations Act (Alberta) and is subject to shareholder and court approvals, including minority shareholder approval by the shareholders of each of Trilogy and Paramount, and the fulfilment of other conditions that are typical for transactions of this nature. The special meetings of shareholders are expected to be held in September 2017. If all
2 Trilogy Energy Corp.

MANAGEMENT’S DISCUSSION AND ANALYSIS Q2 - 2017
approvals are received and other closing conditions satisfied, the merger is expected to be completed that month. The senior unsecured notes of Trilogy will remain outstanding following completion of the merger as the merger will not trigger any change of control payments. Following the merger, the outstanding Trilogy options will entitle the option holders to acquire Paramount shares rather than Trilogy shares at an adjusted exercise price, based on the exchange ratio for the merger and in accordance with the options’ original vesting schedules.
(1) Refer to Non-GAAP measures in the MD&A
Business Overview and Strategy Trilogy is a petroleum and natural gas-focused Canadian energy corporation that actively develops, produces and sells natural gas, crude oil and natural gas liquids. Trilogy’s geographically concentrated assets are primarily high working interest properties that provide abundant low risk infill drilling opportunities and good access to infrastructure and processing facilities, many of which are operated and controlled by Trilogy. The Company continues to focus its exploitation efforts on play types with better economics, including those that contain oil and natural gas liquids and which utilize horizontal drilling and multi-stage fracture completion techniques. The success of Trilogy’s operations is dependent upon several factors, including but not limited to, the price of energy commodity products, the effectiveness of the Company’s approach to managing commodity price volatility, capital spending allocations, Trilogy’s ability to maintain desired levels of production, control over its infrastructure, its efficiency in developing and operating properties and its ability to manage costs.
Business Environment and Economic Conditions World oil over-supply concerns surfacing in the latter half of 2014 through to the date hereof continue to weigh on the realized oil and liquids prices received in Canada. In the United States (“U.S.”), crude oil stocks reached record inventories and domestic oil production has remained strong throughout this period. These factors, combined with continued strong supply from both Organization of the Petroleum Exporting Countries (“OPEC”) and Non OPEC producers continued to reinforce over-supply concerns. Financial instability in Europe and China further contributed to a reduction in the demand and related price for oil and liquids. Beginning in the second quarter of 2016, world oil prices continued to strengthen beyond the low pricing experienced in the first quarter of 2016 as market forces attempted to balance. OPEC and Russian production cuts announced in the fourth quarter of 2016 contributed significantly to an increase in the price for oil; however, significant uncertainty and price volatility exists today on concerns of how long such supply reductions will be in place and on the impact of North American oil production coming on stream as prices strengthen. Similarly, gas prices continued to weaken in the latter part of 2014 through to the first quarter of 2016, as moderate temperatures experienced throughout most of North America, combined with strong supply from industry during this period, failed to significantly draw on gas storage levels. Natural gas pricing began to strengthen in the middle of 2016. However, these gains may be offset by moderate consumption, strong supply levels and concerns that natural gas demand will be tempered due to the potential action by the U.S. to reverse initiatives to curtail coal fired heating and power generation and to increase domestic oil and gas exploration and development. In Canada, a number of additional challenges face the industry including competitiveness concerns on the implementation of a provincial carbon tax and uncertainty regarding the approval and ultimate construction of a number of proposed pipelines to export producer’s oil and gas to new markets. In Alberta, a Provincial government royalty review that began in 2015 deterred investment in Alberta until the review was completed. Industry was generally pleased with the results and recommendations from the review in 2016. The government enacted its New Royalty Framework, implemented programs intended to replace expiring strategic incentive programs, provided royalty incentives to encourage production in certain parts of Alberta and enhanced recovery initiatives (including the Emerging Resources Program and the Enhanced Hydrocarbon Recovery Program). The decrease and volatility in commodity prices and the uncertainties created over of the past three years continue to have a direct and profound impact on a large number of oil and gas producers in Canada. The significant market volatility in the price for oil, natural gas and natural gas liquids continues to reinforce the diversity and uncertainty in the market as
3 Trilogy Energy Corp.

MANAGEMENT’S DISCUSSION AND ANALYSIS Q2 - 2017
to the timing and extent of a sustained recovery in oil, natural gas and natural gas liquids (“NGL”) prices. Producers have had to respond to the depressed commodity price environment in an effort to preserve shareholder value and to continue their existence as a going concern. Financing initiatives, decreases in distribution levels, asset rationalization programs, capital allocation decisions, labour reductions and other cost reduction strategies have been crucial measures that industry has had to adopt in an effort to mitigate the low commodity price environment and successfully compete as an industry in Canada. In response to the decrease and fluctuations in commodity prices, Trilogy has adopted several meaningful measures aimed at sustaining its financial health and preserving shareholder value, including:
• discontinuing its monthly dividend for periods subsequent to November 2014;
• reducing capital expenditure levels throughout 2015, 2016 and 2017 to approximate funds flow from operations and targeting only those projects that are strategic and/or meet Trilogy’s return on investment requirements;
• continuously evaluating its asset base, identifying and implementing several operational efficiencies;
• shutting in production volumes deemed uneconomic at depressed commodity price levels;
• continuously negotiating with third party contractors and service providers to reduce Trilogy’s cost of goods and services;
• implementing reductions to salary and other benefits for its officers, directors and employees;
• disposing of certain assets in 2015 for proceeds of approximately $160.5 million, and more recently in 2017, the disposition of assets for approximately $110 million.
• exploring further opportunities to dispose of non-core assets within the Company’s portfolio; and
• extending the maturity date and negotiating the relaxation of certain financial covenants in its Revolving Credit Facility.
• The proposed merger with Paramount Resources Ltd.
As commodity prices regain strength, Trilogy expects to continue profitably exploiting its current land base, focusing on plays that meet its internal investment return criteria and growing production over the long-term. Trilogy is confident in the success of its business model, asset base, and its ability to generate long-term shareholder value.
Outlook Information Trilogy maintains its plan to execute a 2017 capital spending budget that is within anticipated 2017 funds flow from operations based on Trilogy’s 2017 actual and forecast production and pricing for the remainder of the year. The level of capital spending in the second half of the year will depend on commodity prices and will primarily impact the Duvernay projects later in 2017. The Grande Prairie and Kaybob non-core asset sales are not expected to have a significant impact on annual production or funds flow from operations. Given the foregoing, Trilogy is reaffirming its 2017 annual guidance as follows:
• Average production: 24,000 Boe/d (~35% oil and NGLs)
• Average operating costs: $8.50/Boe
• Capital expenditures: $100 - $130 Million
4 Trilogy Energy Corp.

MANAGEMENT’S DISCUSSION AND ANALYSIS Q2 - 2017
Operating Results Summary The following table summarizes the key commodity price benchmarks for the following periods:
Q2 2017 Q1 2017 Q2 2016 YTD 2017 YTD 2016Crude OilWest Texas Intermediate monthly average (U.S.$/Bbl) 48.27 51.91 45.59 50.09 39.52Canadian Light Sweet monthly average (Cdn$/Bbl) 59.72 64.83 55.01 62.27 48.11Natural GasNYMEX (Henry Hub close) monthly average (U.S.$/MMBtu) 3.14 3.06 2.24 3.10 2.12AECO monthly average (Cdn$/GJ) 2.79 2.69 1.42 2.74 1.62
1.30 1.32 1.29 1.30 1.29Canada - U.S. dollar closing exchange rate (Cdn$/U.S.$1)
Funds Flow from Operations
(In thousand dollars except as otherwise indicated)
June30, 2017
March31, 2017
June30, 2016
June30, 2017
June30, 2016
Operating income(1) 35,048 44,152 16,698 79,199 32,386 Environmental remediation expense (1,000) (1,000) - (2,000) - Other income (2) 138 53 43 190 258 Realized financial instrument gains (3) 2,877 5,409 4,438 8,286 8,915 Actual decommissioning and restoration cost (862) (1,609) (544) (2,470) (1,307)Operating netback(1) 36,201 47,005 20,635 83,205 40,252 Interest and financing charges(4) (7,723) (8,148) (7,825) (15,871) (15,390)General and administrative expenses (2,000) (2,475) (3,088) (4,475) (6,828)Transaction costs (1,537) - - (1,537) - Funds flow from operations(1) 24,941 36,382 9,722 61,322 18,034 Non-cash items:Depletion and depreciation (35,522) (41,725) (35,186) (77,246) (70,765)Unrealized financial instrument gain (loss)(3) 5,420 9,786 (5,954) 15,206 (10,417)Share based compensation (998) (915) (5,902) (1,913) (7,890)Exploration expenditure(5) (445) (358) (134) (803) (906)Amortization of financing fees (351) (366) (297) (717) (982)Impairment reversal 19,756 7,659 (6) 27,415 (20)Gain on disposal of assets 23,604 82 577 23,686 521 Accretion on decommissioning and restoration liability(6) (362) 324 (426) (38) (920)
Deferred income tax (expense) recovery (11,175) (3,180) 8,557 (14,355) 17,798 Unrealized foreign exchange gain (loss) (13) 5 (63) (8) (1,109)Comprehensive (loss) income 24,855 7,694 (29,112) 32,548 (56,657)
Three Months Ended Six Months Ended
(1) Refer to the advisory on Non-GAAP measures at the end of this MD&A (2) Includes realized foreign exchange gains (losses) and other income (3) See Risk Management section in this MD&A (4) Excludes amortization of financing fees (5) Includes costs associated with impairments on exploratory wells, geological and geophysical and expired mineral lease costs (6) Equals the accretion in excess, or below, of actual amounts paid on decommissioning and restoration activities in the period
5 Trilogy Energy Corp.

MANAGEMENT’S DISCUSSION AND ANALYSIS Q2 - 2017
The following table reconciles cash flow from operating activities to funds flow from operations:
(In thousand dollars except as otherwise indicated)
June30, 2017
March31, 2017
June30, 2016
June30, 2017
June30, 2016
Cash flow from operating activities 14,152 46,847 (8,684) 60,998 4,762 Changes in non-cash working capital 10,789 (10,465) 18,406 324 13,272 Funds flow from operations(1) 24,941 36,382 9,722 61,322 18,034 Interest and financing charges 8,074 8,514 8,122 16,588 16,373 Amortization of finance fees therein (351) (366) (297) (717) (982)General and administrative expenses 2,000 2,475 3,088 4,475 6,828 Transaction Costs 1,537 - - 1,537 - Operating netback(1) 36,201 47,005 20,635 83,205 40,252
Three Months Ended Six Months Ended
(1) Refer to the advisory on Non-GAAP measures at the end of this MD&A
Funds Flow from Operations per Boe
Per Unit of Sales VolumeJune
30, 2017March
31, 2017June
30, 2016June
30, 2017June
30, 2016(Dollar per Boe)
Sales 31.08 33.64 21.18 32.45 21.59 Transportation cost (1.99) (1.58) (2.12) (1.77) (3.49)Royalties (2.22) (2.86) (1.68) (2.56) (1.59)Operating cost (9.09) (9.68) (8.34) (9.41) (8.25)Operating income(1) 17.77 19.52 9.04 18.71 8.26 Environmental remediation expense (0.51) (0.44) - (0.47) - Other income (2) 0.07 0.02 0.02 0.04 0.07 Realized financial instruments gain (loss) (3) 1.46 2.39 2.40 1.96 2.27 Actual decommissioning and restoration cost (0.44) (0.71) (0.29) (0.58) (0.33)Operating netback(1) 18.36 20.78 11.17 19.65 10.27 Interest and financing charge(4) (3.92) (3.60) (4.24) (3.75) (3.93)General and administrative expense (1.01) (1.09) (1.67) (1.06) (1.74)Transaction costs (0.78) - - (0.36) - Funds flow from operations(1) 12.65 16.08 5.26 14.48 4.60
Three Months Ended Six Months Ended
(1) Refer to the advisory on Non-GAAP measures at the end of this MD&A (2) Includes realized foreign exchange gains (losses) and other income (3) See Risk Management section in this MD&A (4) Excludes amortization of financing fees
6 Trilogy Energy Corp.

MANAGEMENT’S DISCUSSION AND ANALYSIS Q2 - 2017
Operating Income Items Second Quarter 2017 vs. First Quarter 2017(In thousand dollars except as otherwise indicated) Value %Average sales volumes:
Natural gas (Mcf/d) 83,581 93,365 (9,784) (10)Oil (Bbl/d) 5,221 6,305 (1,084) (17)Condensate (Boe/d) 1,474 2,059 (585) (28)Natural gas liquids (Boe/d) 1,043 1,207 (164) (14)Total (Boe/d) 21,669 25,133 (3,464) (14)Liquids Composition (percentage) 36 38 (2) -
Average realized prices before financial instruments and transportation:
Natural gas ($/Mcf) 2.98 3.09 (0.11) (4)Oil ($/Bbl) 58.13 61.36 (3.23) (5)Condensate ($/Boe) 61.86 63.25 (1.38) (2)Natural gas liquids ($/Boe) 28.57 32.95 (4.37) (13)Average realized price ($/Boe) 31.08 33.64 (2.56) (8)
Average realized prices after financial instruments (1)
and before transportation:Natural gas ($/Mcf) 3.04 3.63 (0.58) (16)Oil ($/Bbl) 62.08 62.69 (0.61) (1)Condensate ($/Boe) 61.86 63.25 (1.38) (2)Natural gas liquids ($/Boe) 28.57 32.95 (4.37) (13)Average realized price ($/Boe) 32.28 35.97 (3.69) (10)
Operating income(1)
Natural gas 22,647 25,968 (3,321) (13)Oil 27,621 34,819 (7,198) (21)Condensate 8,299 11,722 (3,423) (29)Natural gas liquids 2,713 3,580 (867) (24)Total petroleum and natural gas sales before financial instruments
61,280 76,089 (14,809) (19)
Royalties (4,383) (6,465) (2,082) (32)Operating costs (17,918) (21,905) (3,987) (18)Transportation costs (3,931) (3,567) 364 10 Operating income(1) 35,048 44,152 (9,104) (21)
Increase (Decrease)
Q2 2017 Q1 2017
(1) Includes only realized financial instrument gains and losses on oil and gas commodity hedges (2) Refer to the advisories on non-GAAP measures at the end of this MD&A.
Comparison of Second Quarter 2017 over First Quarter 2017 Petroleum and Natural Gas Sales before Financial Instruments and Transportation – Oil sales decreased by $7.2 million due to lower sales volumes ($5.4 million) and lower realized prices ($1.8 million). Condensate sales decreased by $3.4 million on reduced realized prices ($0.3 million) and lower sales volumes ($3.1 million). NGL sales decreased by $0.9 million due to lower sales volumes ($0.4 million) and reduced realized prices ($0.5 million). Natural gas sales decreased by $3.3 million due to lower sales volumes ($2.4 million) and lower realized prices ($0.9 million). Asset dispositions in Trilogy’s Grande Prairie and Kaybob areas at the end of May, 2017, scheduled and non-scheduled plant and pipeline outages, wet access conditions at a limited number of wells in the quarter and natural production declines on new well production primarily at Trilogy’s Montney oil play, contributed to the lower production. Royalties – Royalties, on a total dollar basis and percentage of sales revenue, were lower over the prior quarter primarily on the decrease in production, liquids composition and commodity pricing.
7 Trilogy Energy Corp.
MANAGEMENT’S DISCUSSION AND ANALYSIS Q2 - 2017
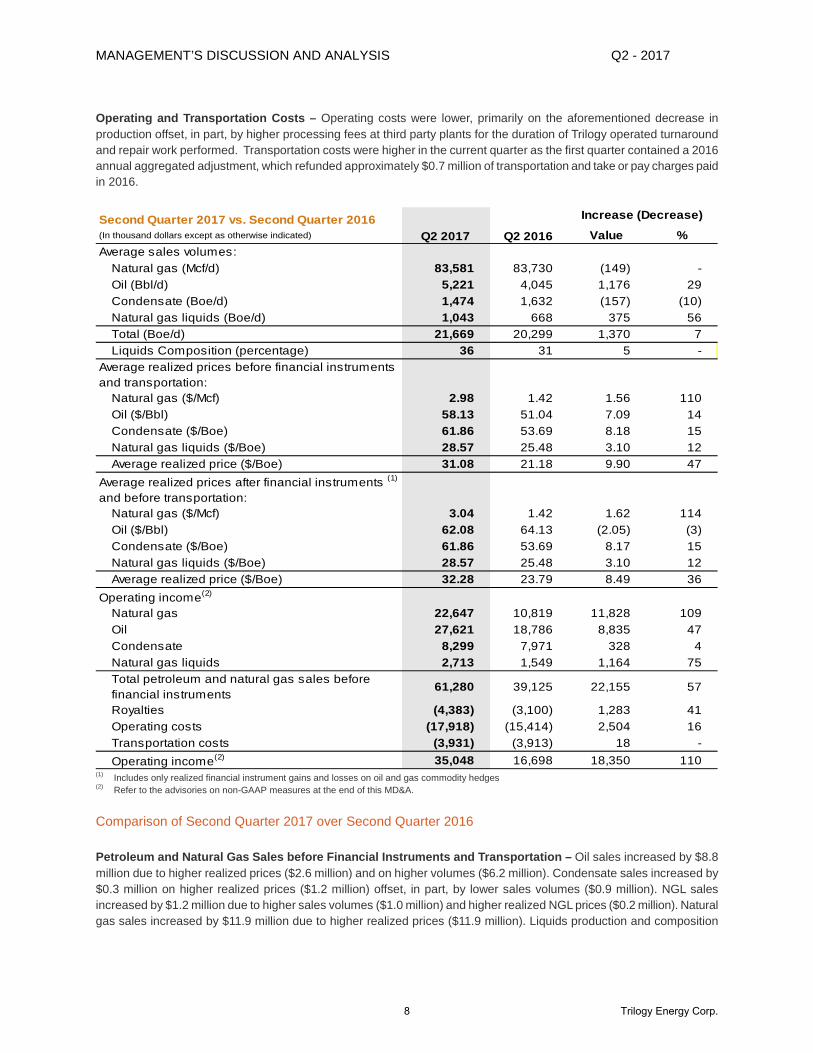
Operating and Transportation Costs – Operating costs were lower, primarily on the aforementioned decrease in production offset, in part, by higher processing fees at third party plants for the duration of Trilogy operated turnaround and repair work performed. Transportation costs were higher in the current quarter as the first quarter contained a 2016 annual aggregated adjustment, which refunded approximately $0.7 million of transportation and take or pay charges paid in 2016.
Second Quarter 2017 vs. Second Quarter 2016(In thousand dollars except as otherwise indicated) Value %Average sales volumes:
Natural gas (Mcf/d) 83,581 83,730 (149) - Oil (Bbl/d) 5,221 4,045 1,176 29 Condensate (Boe/d) 1,474 1,632 (157) (10)Natural gas liquids (Boe/d) 1,043 668 375 56 Total (Boe/d) 21,669 20,299 1,370 7 Liquids Composition (percentage) 36 31 5 -
Average realized prices before financial instruments and transportation:
Natural gas ($/Mcf) 2.98 1.42 1.56 110 Oil ($/Bbl) 58.13 51.04 7.09 14 Condensate ($/Boe) 61.86 53.69 8.18 15 Natural gas liquids ($/Boe) 28.57 25.48 3.10 12 Average realized price ($/Boe) 31.08 21.18 9.90 47
Average realized prices after financial instruments (1)
and before transportation:Natural gas ($/Mcf) 3.04 1.42 1.62 114 Oil ($/Bbl) 62.08 64.13 (2.05) (3)Condensate ($/Boe) 61.86 53.69 8.17 15 Natural gas liquids ($/Boe) 28.57 25.48 3.10 12 Average realized price ($/Boe) 32.28 23.79 8.49 36
Operating income(2)
Natural gas 22,647 10,819 11,828 109 Oil 27,621 18,786 8,835 47 Condensate 8,299 7,971 328 4 Natural gas liquids 2,713 1,549 1,164 75 Total petroleum and natural gas sales before financial instruments
61,280 39,125 22,155 57
Royalties (4,383) (3,100) 1,283 41 Operating costs (17,918) (15,414) 2,504 16 Transportation costs (3,931) (3,913) 18 - Operating income(2) 35,048 16,698 18,350 110
Increase (Decrease)
Q2 2016Q2 2017
(1) Includes only realized financial instrument gains and losses on oil and gas commodity hedges (2) Refer to the advisories on non-GAAP measures at the end of this MD&A.
Comparison of Second Quarter 2017 over Second Quarter 2016 Petroleum and Natural Gas Sales before Financial Instruments and Transportation – Oil sales increased by $8.8 million due to higher realized prices ($2.6 million) and on higher volumes ($6.2 million). Condensate sales increased by $0.3 million on higher realized prices ($1.2 million) offset, in part, by lower sales volumes ($0.9 million). NGL sales increased by $1.2 million due to higher sales volumes ($1.0 million) and higher realized NGL prices ($0.2 million). Natural gas sales increased by $11.9 million due to higher realized prices ($11.9 million). Liquids production and composition
8 Trilogy Energy Corp.

MANAGEMENT’S DISCUSSION AND ANALYSIS Q2 - 2017
increased in the current quarter on relatively higher capital spending through the 2016/2017 winter drilling season that brought new well production primarily at Trilogy’s Montney oil play.
Royalties – Royalties and the related effective rate increased in 2017 on higher commodity prices, production and liquids composition offset, in part, by relatively higher new well royalty incentives received.
Operating and Transportation Costs – Operating costs were higher in the second quarter of 2017 as compared to the second quarter of 2016 on the increased production. Increased well and facility workover activity in 2017 in conjunction with the higher commodity price environment also contributed to the increase in operating costs. Operating expenditures were reduced through much of 2016 on the shut-in of uneconomic properties having higher relative operating costs in the low commodity price environment.
Year-to-date 2017 vs Year-to-date 2016(In thousand dollars except as otherwise indicated) Value %Average sales volumes:
Natural gas (Mcf/d) 88,446 90,014 (1,568) (2)Oil (Bbl/d) 5,760 4,090 1,670 41 Condensate (Boe/d) 1,765 1,590 175 11 Natural gas liquids (Boe/d) 1,125 860 265 31 Total (Boe/d) 23,391 21,543 1,848 9 Liquids Composition (percentage) 37 30 7 -
Average realized prices before financial instruments and before transportation:
Natural gas ($/Mcf) 3.04 2.10 0.93 44 Oil ($/Bbl) 59.89 44.07 15.82 36 Condensate ($/Boe) 62.67 49.64 13.03 26 Natural gas liquids ($/Boe) 30.91 19.42 11.48 59 Average realized price ($/Boe) 32.45 21.59 10.86 50
Average realized prices after financial instruments (1)
and before transportation:Natural gas ($/Mcf) 3.35 2.10 1.25 59 Oil ($/Bbl) 62.41 57.01 5.40 9 Condensate ($/Boe) 62.67 49.64 13.03 26 Natural gas liquids ($/Boe) 30.91 19.42 11.48 59 Average realized price ($/Boe) 34.25 24.05 10.20 42
Operating income(2)
Natural gas 48,616 34,443 14,173 41 Oil 62,440 32,804 29,636 90 Condensate 20,021 14,363 5,658 39 Natural gas liquids 6,292 3,042 3,250 107 Total petroleum and natural gas sales before financial instruments
137,369 84,652 52,717 62
Royalties (10,848) (6,222) 4,626 74 Operating costs (39,824) (32,345) 7,479 23 Transportation costs (7,498) (13,699) (6,201) (45)Operating income(2) 79,199 32,386 46,813 145
YTD 2017 YTD 2016
Increase (Decrease)
(1) Includes only realized financial instrument gains and losses on oil and gas commodity hedges (2) Refer to the advisories on non-GAAP measures at the end of this MD&A.
Comparison of Year-to-date 2017 over Year-to-date 2016 Petroleum and Natural Gas Sales before Financial Instruments and Transportation – Oil sales increased by $29.6 million due to higher realized prices ($11.8 million) and on higher volumes ($17.8 million) . Condensate sales increased by
9 Trilogy Energy Corp.

MANAGEMENT’S DISCUSSION AND ANALYSIS Q2 - 2017
$5.7 million on higher realized prices ($3.8 million) and higher sales volumes ($1.9 million). NGL sales increased by $3.2 million due to higher sales volumes ($1.5 million) and by higher realized NGL prices ($1.7 million). Natural gas sales increased by $14.2 million due to higher realized prices ($15.3 million) offset by lower volumes ($1.1 million). New well production at Trilogy’s Montney oil play and resumed production from shut-in wells in conjunction with recovering commodity prices in the latter part of 2016 contributed primarily to the increased production and liquids composition. The increase was offset, in part, by property dispositions at the end of May 2017.
Royalties – Royalties increased on the higher production, pricing and liquids composition while new well and other royalty incentives assisted to suppress Trilogy’s effective royalty rate.
Operating and Transportation Costs – Operating costs were higher in 2017 on the additional production, increased workover and facility maintenance projects and on resumed production from shut-in wells that have higher associated operating costs, given the increased commodity price environment in 2017. Transportation costs were higher in 2016, as the Company utilized short-term, firm service (more expensive) contracts which were replaced, in the second quarter of 2016, with long-term, firm service (less expensive) contracts. Finally, transportation expenses were further reduced in 2017 on the receipt of an annual aggregated adjustment which refunded approximately $0.7 million of transportation and take or pay charges paid in 2016.
Capital Expenditures
(In thousand dollars except where stated otherwise)
June30, 2017
March31, 2017
June30, 2016
June30, 2017
June30, 2016
Land - - 173 - 188 Geological and geophysical (2) 3 6 1 10 Drilling, completions, and tie-ins 16,766 35,353 (175) 52,118 19,745 Production equipment and facilities 5,352 6,302 1,086 11,654 3,412
22,116 41,658 1,090 63,773 23,355
Disposition proceeds, net of acquisitions (109,005) (675) (498) (109,680) (436)
Corporate assets 28 - 14 28 24 Net capital expenditures (86,861) 40,983 606 (45,879) 22,943
Three Months Ended Six Months Ended
Trilogy sold non-core assets in the Grande Prairie and Kaybob areas in the second quarter (end of May 2017) for proceeds of approximately $110 million (before customary adjustments). The proceeds were used to repay amounts borrowed under Trilogy’s Revolving Credit Facility.
Wells Drilled
(Number of wells)
Gross(1) Net(2) Gross(1) Net(2) Gross(1) Net(2) Gross(1) Net(2) Gross(1) Net(2)
Natural gas 4.0 3.0 4.0 3.0 - - 8.0 6.0 3.0 2.5 Oil - - 6.0 6.0 - - 6.0 6.0 3.0 3.0 Total 4.0 3.0 10.0 9.0 - - 14.0 12.0 6.0 5.5
Six Months EndedJune 30, 2017 March 31, 2017 June 30, 2017 June 30, 2016
Three Months EndedJune 30, 2016
(1) “Gross” wells means the number of wells in which Trilogy has a working interest or a royalty interest. (2) “Net” wells means the aggregate number of wells obtained by multiplying each gross well by Trilogy’s percentage of working interest.
10 Trilogy Energy Corp.

MANAGEMENT’S DISCUSSION AND ANALYSIS Q2 - 2017
Depletion and Depreciation Expense
(In thousand dollars except as otherwise indicated)
June30, 2017
March31, 2017
June30, 2016
June30, 2017
June30, 2016
Reported amount 35,522 41,725 35,186 77,247 70,765 Expense per sales volume ($/Boe) 18.01 18.45 19.05 18.25 18.05
Six Months EndedThree Months Ended
The change in depletion and depreciation expense over the above periods was primarily a function of production levels in the respective periods relative to the Company’s estimated oil and gas reserves on a proved developed producing basis. The decrease over the prior quarter can be attributed primarily to reduced second quarter production.
Exploration and Evaluation Expenditures
(In thousand dollars except as otherwise indicated)
June30, 2017
March31, 2017
June30, 2016
June30, 2017
June30, 2016
Expired mineral leases 447 355 128 802 897 Geological and geophysical (2) 3 6 1 9 Exploration and evaluationexpenses
445 358 134 803 906
Expense per sales volume ($/Boe) 0.23 0.16 0.07 0.19 0.23
Six Months EndedThree Months Ended
Exploration and evaluation expenditures consist of the costs of expired leases, impairments on exploratory wells and geological and geophysical costs. Exploratory wells, by their nature, have increased risks and uncertainties that could translate into cost over-runs and reduced production and reserve additions. Impairments are a reflection of these challenges and represent costs incurred in excess of the benefit Trilogy expects to obtain from a well, particularly in a lower commodity price environment. Early-stage exploration activities and their associated costs progress Trilogy’s knowledge base in the play, with an ultimate goal of extracting, developing and producing oil and gas reserves at attractive returns.
Impairments (Reversals) on Property, Plant, and Equipment
(In thousand dollars except as otherwise indicated)
June30, 2017
March31, 2017
June30, 2016
June30, 2017
June30, 2016
Property, plant, and equipment charge 4,144 - - 4,144 - Property, plant, and equipment(reversal)
(23,900) (7,659) - (31,559) -
Total expense (reversal) (19,756) (7,659) - (27,415) - Expense (Reversal) per sales volume (10.02) (3.39) - (6.48) -
Six Months EndedThree Months Ended
The disposition of properties in the second quarter of 2017 and the associated fair market value of these assets within the Grande Prairie and Kaybob West Cash Generating Units (“CGU”) gave rise to the recording of impairment reversals in the first and second quarters of 2017. Post dispositions, the Company assessed its remaining non-core assets in the Grande Prairie CGU and an impairment was recorded for $4.1 million in conjunction with a reduction in the forward price for oil and gas in this CGU. Refer to note 8 of the Interim Financial Statements for additional disclosures on impairment losses and reversals.
11 Trilogy Energy Corp.

MANAGEMENT’S DISCUSSION AND ANALYSIS Q2 - 2017
Environmental Remediation
(In thousand dollars except as otherwise indicated)
June30, 2017
March31, 2017
June30, 2016
June30, 2017
June30, 2016
Environmental remediation expense 1,000 1,000 - 2,000 -
Three Months Ended Six Months Ended
During the fourth quarter of 2016, Trilogy discovered a leak in one of its emulsion pipelines within its Kaybob Montney Oil Development. Trilogy immediately isolated and purged the pipeline, containing the source of the leak, and redirected production. There were no injuries due to this incident. Response personnel and equipment were immediately deployed and Trilogy has worked closely with the Alberta Energy Regulator. As at the date hereof, a significant portion of the remediation work has been completed. The remediation expense recorded, in the above periods, includes the work and associated costs incurred to date, in addition to an estimate for the future remediation costs anticipated. The additional expense recorded in 2017 represents the actual and future expected costs associated with this project in excess of the original provision of $6.0 million as estimated at December 31, 2016. For further information, refer to Trilogy’s website (http://www.trilogyenergy.com/kaybob-emulsion-release.html) for updates on the remediation process.
General and Administrative Expenses
(In thousand dollars except as otherwise indicated)
June30, 2017
March31, 2017
June30, 2016
June30, 2017
June30, 2016
Salaries and other benefits 5,949 6,141 5,503 12,090 11,739 Office and communications 359 407 1,013 766 2,126 Corporate and other 652 499 534 1,151 1,047 Overhead recoveries and reclassifications to operating costs
(4,960) (4,572) (3,962) (9,532) (8,085)
Reported amount 2,000 2,475 3,088 4,475 6,828 Expense per sales volume ($/Boe) 1.01 1.09 1.67 1.06 1.74
Six Months EndedThree Months Ended
General and administrative expenses were reduced in 2017 over 2016 on increased overhead recoveries in conjunction with a relatively larger capital expenditure program. Further decreases in 2017 arose on the amendment, renewal and on receipt of rent incentives for the Company’s head office lease, beginning in the fourth quarter of 2016.
Transaction Costs
(In thousand dollars except as otherwise indicated)
June30, 2017
March31, 2017
June30, 2016
June30, 2017
June30, 2016
Transaction costs 1,537 - - 1,537 - Expense (Reversal) per sales volume ($/Boe)
0.78 - - 0.36 -
Three Months Ended Six Months Ended
All related costs, fees and commissions to agents, advisers, brokers and dealers incurred in the quarter in connection with Trilogy’s proposed merger with Paramount were recognised in the statement of comprehensive income and loss.
12 Trilogy Energy Corp.

MANAGEMENT’S DISCUSSION AND ANALYSIS Q2 - 2017
Share Based Compensation
(In thousand dollars except as otherwise indicated)
June30, 2017
March31, 2017
June30, 2016
June30, 2017
June30, 2016
Share Incentive Plan - - 26 - 116 Share Option Plan 998 915 5,876 1,913 7,774 Reported Amount 998 915 5,902 1,913 7,890 Expense per sales volume ($/Boe) 0.51 0.40 3.20 0.45 2.01
Three Months Ended Six Months Ended
Share based compensation expense was consistent quarter over quarter. Year over year, share based compensation decreased significantly on relatively lower average option grant date fair values to which the amortization is based upon. In addition, in 2016, approximately $5.0 million of accelerated amortization of share option grant date fair value was recognized in conjunction with the surrender and cancellation of approximately 5.5 million stock option awards in the second quarter of 2016.
Interest, Financing, and Accretion Charges
(In thousand dollars except as otherwise indicated)
June30, 2017
March31, 2017
June30, 2016
June30, 2017
June30, 2016
Interest and other finance costs(1) 8,074 8,514 8,121 16,588 16,373 Expense per sales volume ($/Boe) 4.09 3.76 4.40 3.92 4.18
2,227 2,509 1,224 1,285
Six Months Ended Six Months Ended
Accretion on decommissioningand restoration liability
971
(1) Includes the amortization of financing fees
Accretion charges represent the increase in the Company’s decommissioning and restoration liability associated with the passage of time. Accretion on Trilogy’s decommissioning and restoration liability for the six months ended June 30, 2017 was consistent over the same period in 2016. Interest expense in the second quarter of 2017 was lower relative to the first quarter of 2017 primarily on asset disposition proceeds applied to Trilogy’s Revolving Credit Facility. Year over year, higher average debt levels and increased lender margins on the Revolving Credit Facility in 2017 contributed to the higher interest expense. For additional information on Trilogy’s long-term debt, refer below under the “Long-term Debt” section of this MD&A and to note 13 of the Interim Financial Statements.
Risk Management
Financial Risks Trilogy’s main financial risks include, but are not limited to, credit risk, liquidity risk, commodity price risk, interest rate risk and foreign exchange risk, and are discussed in detail in the notes to Trilogy’s 2016 Annual Financial Statements, the advisories and other sections of this MD&A, as well as the Company’s Annual Information Form. The financial instruments outstanding on the applicable balance sheet dates are recognized at fair value on Trilogy’s balance sheet. The change in the fair value of outstanding financial instruments, which are classified as financial assets and liabilities at fair value through profit or loss, are presented as an unrealized gain (loss) on financial instruments in the Consolidated Statement of Comprehensive Income (Loss). Gains or losses arising from monthly settlement with counterparties are presented as a realized gain (loss) on financial instruments.
13 Trilogy Energy Corp.

MANAGEMENT’S DISCUSSION AND ANALYSIS Q2 - 2017
(In thousand dollars except as otherwise indicated)
June30, 2017
March31, 2017
June30, 2016
June30, 2017
June30, 2016
Realized gain on financial instruments 2,877 5,409 4,439 8,286 8,915
Unrealized gain (loss) on financial instruments
5,420 9,786 (5,954) 15,206 (10,417)
Total gain (loss) on financial instruments
8,297 15,195 (1,515) 23,492 (1,502)
Realized gain on financial instruments ($/Boe)
2.40 1.46 1.96
Three Months Ended
2.27 2.39
Six Months Ended
Trilogy may enter into oil, gas, power, interest, and foreign exchange contracts to manage its exposure to fluctuations in the price of oil, gas, electricity, interest, and foreign exchange rates. Trilogy also enters into drilling and other service contracts to secure access to these services and to manage exposure to pricing fluctuations thereon. Refer to note 21, and 22 of the Interim Financial Statements for more information on realized and unrealized financial instruments gains and losses. The fair value accounting of financial instruments causes significant fluctuations in the unrealized gain (loss) on financial instruments due to the volatility of energy commodity prices, interest and foreign exchange rates during the period. The fair value of financial instruments as at the balance sheet date will change in the future as a result of changes in these economic benchmarks upon which the fair value is primarily based, and therefore, the amount actually realized from financial instruments will vary from such fair value. The following is a summary of the derivative contracts in place as at the date of this report: Crude Oil Term Volume (Bbl/d)2017 - WTI Collar 500 2017 - WTI Collar 500 2017- Sale 1,000 2017- Sale 2,000
Average NYMEX Price/Bbl$38.00 - $57.50 USD
$71.17 CAD$54.46 USD
$42.00 - $52.90 USD
Natural Gas Term VolumeMay - December 2017 - Sale 30,000 (MMBTU/d) 3.39 USD
Average Price
In the second quarter of 2017, Trilogy realized $0.5 million in premium and termination settlement receipts on a foreign exchange derivative contract.
Operational and Other Risks Trilogy is subject to various risks and uncertainties including those relating to its operations, environment, and other risks as discussed in the Advisories and other sections of this MD&A, as well as the Company’s Annual Information Form.
14 Trilogy Energy Corp.
MANAGEMENT’S DISCUSSION AND ANALYSIS Q2 - 2017
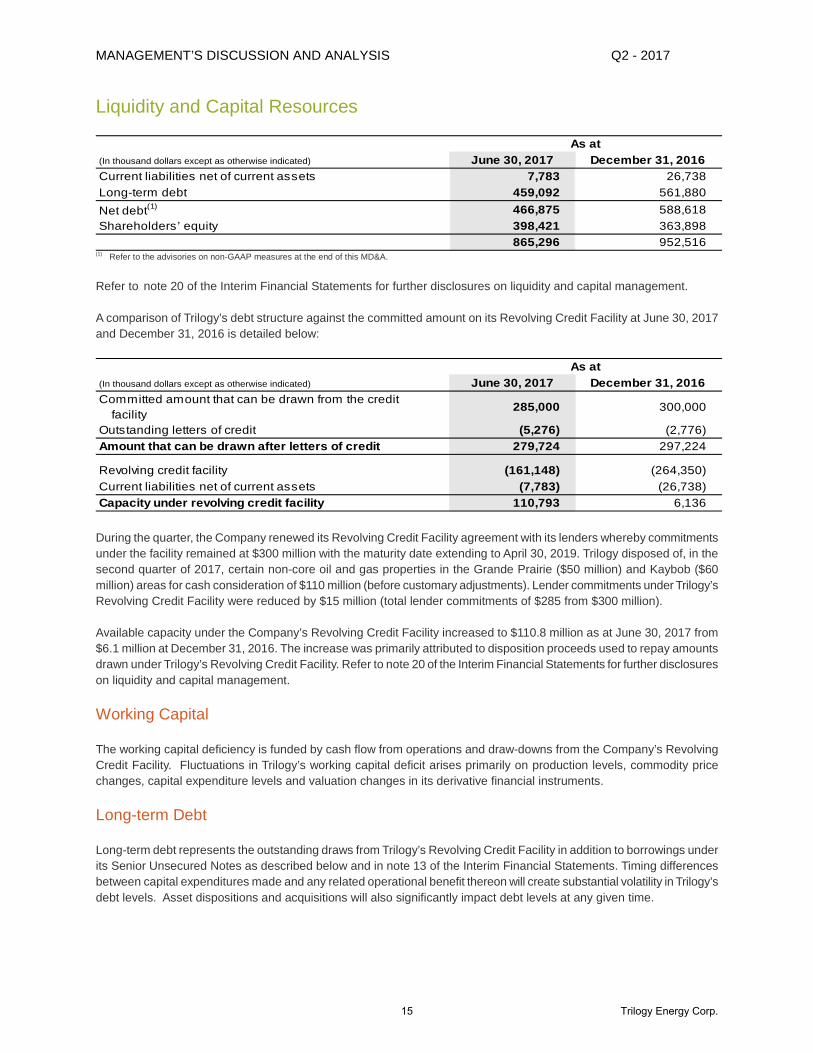
Liquidity and Capital Resources
(In thousand dollars except as otherwise indicated) June 30, 2017 December 31, 2016Current liabilities net of current assets 7,783 26,738 Long-term debt 459,092 561,880 Net debt(1) 466,875 588,618 Shareholders’ equity 398,421 363,898
865,296 952,516
As at
(1) Refer to the advisories on non-GAAP measures at the end of this MD&A.
Refer to note 20 of the Interim Financial Statements for further disclosures on liquidity and capital management. A comparison of Trilogy’s debt structure against the committed amount on its Revolving Credit Facility at June 30, 2017 and December 31, 2016 is detailed below:
(In thousand dollars except as otherwise indicated) June 30, 2017 December 31, 2016Committed amount that can be drawn from the credit facility
285,000 300,000
Outstanding letters of credit (5,276) (2,776)Amount that can be drawn after letters of credit 279,724 297,224
Revolving credit facility (161,148) (264,350)Current liabilities net of current assets (7,783) (26,738)Capacity under revolving credit facility 110,793 6,136
As at
During the quarter, the Company renewed its Revolving Credit Facility agreement with its lenders whereby commitments under the facility remained at $300 million with the maturity date extending to April 30, 2019. Trilogy disposed of, in the second quarter of 2017, certain non-core oil and gas properties in the Grande Prairie ($50 million) and Kaybob ($60 million) areas for cash consideration of $110 million (before customary adjustments). Lender commitments under Trilogy’s Revolving Credit Facility were reduced by $15 million (total lender commitments of $285 from $300 million). Available capacity under the Company’s Revolving Credit Facility increased to $110.8 million as at June 30, 2017 from $6.1 million at December 31, 2016. The increase was primarily attributed to disposition proceeds used to repay amounts drawn under Trilogy’s Revolving Credit Facility. Refer to note 20 of the Interim Financial Statements for further disclosures on liquidity and capital management.
Working Capital The working capital deficiency is funded by cash flow from operations and draw-downs from the Company’s Revolving Credit Facility. Fluctuations in Trilogy’s working capital deficit arises primarily on production levels, commodity price changes, capital expenditure levels and valuation changes in its derivative financial instruments.
Long-term Debt Long-term debt represents the outstanding draws from Trilogy’s Revolving Credit Facility in addition to borrowings under its Senior Unsecured Notes as described below and in note 13 of the Interim Financial Statements. Timing differences between capital expenditures made and any related operational benefit thereon will create substantial volatility in Trilogy’s debt levels. Asset dispositions and acquisitions will also significantly impact debt levels at any given time.
15 Trilogy Energy Corp.

MANAGEMENT’S DISCUSSION AND ANALYSIS Q2 - 2017
(In thousand dollars except as otherwise indicated) June 30, 2017 December 31, 2016Revolving credit facility 161,902 265,302
Less prepaid interest and unamortized financing costs (754) (952)Carrying value 161,148 264,350
Senior unsecured notes 300,000 300,000 Less unamortized financing costs (2,056) (2,470)Carrying value 297,944 297,530
Total carrying value of long term debt 459,092 561,880
As at
Revolving Credit Facility Trilogy has a revolving senior secured credit facility with a syndicate of Canadian banks. Borrowing under the facility bears interest at the lenders’ prime rate, bankers’ acceptance rate or London Interbank Offered Rate, plus an applicable margin. Amounts borrowed in excess of $250 million attract a further premium over the applicable margin. Trilogy’s total commitments of $285 million, as of June 30, 2017, consist of a working capital and revolving tranche of $35 million and $250 million, respectively. Amounts drawn on the working capital and revolving tranches facility are due upon their maturity on April 30, 2019. The Company’s quarterly financial covenants are as follows: A covenant ratio of “Senior Debt” to “Adjusted EBITDA” for the preceding twelve month period for all fiscal quarters ended of not greater than:
• 3.75 at June 2017, September 2017, and December 2017; and
• 3.25 at March 31, 2018 and thereafter. The covenant ratio of “Consolidated Debt” to “Adjusted EBITDA” for the preceding twelve month period for all fiscal quarters ended will be not greater than:
• 6.75 at June 30, 2017;
• 5.75 at September 30, 2017;
• 5.00 at December 31, 2017;
• 4.75 at March 31, 2018;
• 4.50 at June 30, 2018;
• 4.25 at September 30, 2018; and
• 4.00 at December 31, 2018 and thereafter.
The Revolving Credit Facility is subject to semi-annual borrowing base reviews. The size of the committed credit facility is based primarily on the value of Trilogy’s producing petroleum and natural gas assets as determined by the lenders. Dispositions and acquisitions of assets may also decrease or increase the borrowing base respectively. In the event that the lending syndicate reduces the borrowing base below the amount drawn at the time of the redetermination, Trilogy has 60 days to eliminate any shortfall by providing additional security or guarantees satisfactory to the lenders or by repaying amounts in excess of the redetermined borrowing base. Advances drawn on the credit facility are secured by a fixed and floating debenture charge over the assets of the Company.
As at June 30, 2017, the Company is in compliance with all debt covenants. Trilogy’s Senior Debt and Consolidated Debt to Adjusted EBITDA financial ratios for the preceding twelve month period was 1.24 and 3.50, respectively. The effective interest rate on Trilogy’s Revolving Credit Facility for the six month period (excluding other financing costs) was 3.99 percent. (June 30, 2016 – 3.22 percent). The Company has letters of credit totalling $5.3 million as at June 30, 2017 (December 31, 2016: $2.8 million) which reduce the amount available for draw. Refer to note 20 of the Interim Financial Statements for further disclosures on liquidity and capital management.
16 Trilogy Energy Corp.

MANAGEMENT’S DISCUSSION AND ANALYSIS Q2 - 2017
Senior Unsecured Notes In December 2012 the Company issued $300 million principal amount of 7.25 percent Senior Unsecured Notes due December 13, 2019 (the “Notes”). Proceeds from the issuance were used to reduce existing indebtedness under Trilogy’s Revolving Credit Facility. Transaction costs of $5.8 million were capitalized and will be amortized into income over the life of the debt using the effective interest rate method. Interest is payable semi-annually in arrears on June 13 and December 13 of each year. The Notes rank pari passu with all of Trilogy’s senior indebtedness and are subordinated to all secured indebtedness, which includes Trilogy’s Revolving Credit Facility indebtedness. The Company may redeem the Notes at a current price of 102.417 percent, decreasing down to 100 percent after December 13, 2018, plus applicable interest, subject to certain conditions. To the extent the Company experiences a change of control, each holder of the Notes will have the right to require the Company to repurchase, at 101 percent, all or part of such holder’s Notes. The notes were initially recognized at fair value net of transaction costs and are subsequently measured at amortized cost using an effective interest rate of 7.53 percent. (June 30, 2016 – 7.53 percent). Refer to the subsequent event note 24 in the Interim Financial Statemetns for further details related to change in control payments. The Note indenture contains covenants that, among other things, limit the ability of the Company to: • incur additional indebtedness;
• make restricted payments, including certain investments and the payment of dividends;
• grant certain liens;
• enter into certain transactions with affiliates; and
• effect asset sales, mergers and consolidations. As at June 30, 2017, the Company is in compliance with all debt covenants. Shares, Options and Rights The following provides a continuity of outstanding share capital:
Shares as at December 31, 2015 105,187,719 20,835,862 126,023,581 $ 1,103,784 Issued - Share Option Plan 36,580 - 36,580 233 Vesting of Share Incentive Plan awards
40,834 - 40,834 1,098
Shares as at December 31, 2016 105,265,133 20,835,862 126,100,995 1,105,115 Issued - Share Option Plan 13,760 - 13,760 80 Vesting of Share Incentive Plan awards
18,557 - 18,557 499
Shares as at June 30, 2017 105,297,450 20,835,862 126,133,312 $ 1,105,694
Amount (2)CommonShares(1)
Non-Voting Shares
Total
(1) Net of Common Shares held in trust for the benefit of employees and officers under Trilogy’s Share Incentive Plan. (2) In thousand dollars.
Outstanding share options issued under Trilogy’s share option plan were 6,175,040 as at June 30, 2017 and as at the date hereof 5,166,720, of which 2,398,360 and 1,398,780 share options were exercisable, respectively. Refer to note 15 of the Interim Financial Statements for additional disclosures.
17 Trilogy Energy Corp.

MANAGEMENT’S DISCUSSION AND ANALYSIS Q2 - 2017
Decommissioning and Restoration Liability At June 30, 2017, Trilogy recorded reduced decommissioning and restoration liabilities for future abandonment and reclamation of Trilogy’s properties of $222.2 million when compared $233.0 million at December 31, 2016 as a result of the Company’s second quarter non-core oil and gas property dispositions. The estimated decommissioning and restoration liability includes assumptions in respect of actual costs to abandon wells or reclaim the property, the time frame in which such costs will be incurred as well as annual inflation factors in order to calculate the undiscounted total future liability. The future liability as at June 30, 2017 and December 31, 2016 was discounted at an average risk-free interest rate of 2.25 percent. Actual spending under Trilogy’s abandonment and reclamation program for the three and six months ended June 30, 2017 was $0.9 million and $2.5 million, respectively. Refer to note 14 of the Internal Financial Statements for additional disclosures on decommissioning and restoration liabilities. Environmental stewardship is a core value at Trilogy and abandonment and reclamation activities continue to be made in a prudent, responsible manner with the oversight of the Environment, Health, and Safety Committee of the Board. Ongoing abandonment expenditures for all of Trilogy’s assets are funded entirely out of Trilogy’s operating income (refer to the Non GAAP Measures).
Income Taxes The Company recorded a future income tax expense year to date of $14.4 million ($17.8 million future income tax recovery for the same period in 2016). The Company’s statutory tax rate of 27 percent was increased to an effective annual tax rate of 31 percent as a result of the goodwill disposal of $4.4 million and share based compensation expense of $1.9 million in Trilogy’s Consolidated Interim Statement of Comprehensive Income (Loss) which is not deductible for tax purposes. Refer to note 11 of the Interim Financial Statements for additional income tax disclosures.
Net Deferred Income Tax Asset/(Liability)(In thousand dollars except as otherwise indicated)
Property, Plant, & Equipment
Risk Management
Decommissioning Liabilities
Losses & Other
Total
At December 31, 2015 (75,563) (4,917) 61,838 48,045 29,404 Recovery (expense) (13,956) 6,905 1,075 37,082 31,107
At December 31, 2016 (89,519) 1,988 62,913 85,127 60,511 Recovery (expense) (8,078) (4,106) (2,910) 738 (14,355)At June 30, 2017 (97,597) (2,117) 60,003 85,867 46,156 Trilogy’s management estimates that it will not incur current income taxes in the foreseeable future given its significant tax pool balances and expectations of, among other things, future capital expenditure levels and funds flow from operations.
Related Party Transactions Trilogy had certain transactions with Paramount Resources (“Paramount”), a wholly-owned subsidiary of Paramount Resources Ltd. which owns approximately 15.2 percent of the equity in the Company. The amount of expenses billed and accrued in respect of services provided by Paramount to the Company under a services agreement was $0.2 million for the six months ended June 30, 2017 (June 30, 2016 - $0.2 million).
18 Trilogy Energy Corp.

MANAGEMENT’S DISCUSSION AND ANALYSIS Q2 - 2017
Quarterly Financial Information (In thousand dollars except per share amounts) Q2 2017 Q1 2017 Q4 2016 Q3 2016Revenue after financial instruments, royalties, foreign exchange, and other income
65,319 84,877 51,936 46,531
Income (loss) before tax 36,030 10,874 (24,593) (25,461)Net income (loss) 24,855 7,694 (18,116) (18,629)Income (loss) per Share (in full amounts):
Basic 0.20 0.06 (0.14) (0.15) Diluted 0.20 0.06 (0.14) (0.15)
Q2 2016 Q1 2016 Q4 2015 Q3 2015Revenue after financial instruments, royalties, foreign exchange, and other income
34,489 41,590 62,487 74,874
Loss before tax (37,669) (36,785) (17,646) (95,826)Net loss (29,112) (27,544) (19,248) (70,929)Loss per Share (in full amounts):
Basic (0.23) (0.22) (0.15) (0.56) Diluted (0.23) (0.22) (0.15) (0.56)
The fluctuations in Trilogy’s revenue and net earnings from quarter to quarter are primarily caused by variations in production volumes, realized oil and natural gas prices and the related impact on royalties, realized and unrealized gains/losses on financial instruments. Gains (losses) on dispositions, impairments or reversals and other charges to deferred tax assets, exploratory and evaluation assets, property, plant, and equipment, goodwill and expiry of mineral land leases can also create significant volatility in Trilogy’s net earnings. Please refer to the Results of Operations and other sections of this MD&A for detailed financial and operational variances between reporting periods and to Trilogy’s previously issued annual MD&A for changes in prior periods. Critical Accounting Estimates The historical information in this MD&A is based primarily on the Company’s consolidated financial statements, which have been prepared in Canadian Dollars in accordance with IFRS. The application of IFRS requires management to make estimates, judgments and assumptions that affect the reported amounts of assets and liabilities and the disclosure of contingent assets and liabilities, if any, at the date of the financial statements, and the reported amounts of revenues and expenses during the reporting period. Trilogy bases its estimates on historical experience and various other assumptions that are believed to be reasonable under the circumstances. Actual results could differ materially from these estimates under different assumptions or conditions. The following are the estimates and judgments applied by management that most significantly affect the Company’s financial statements:
Reserves Estimation The capitalized costs of oil and gas properties are amortized to expense on a unit-of-production basis at a rate calculated by reference to proved developed producing reserves determined in accordance with National Instrument 51-101 and the Canadian Oil and Gas Evaluation Handbook. Commercial reserves are determined using best estimates of oil and gas in place, recovery factors, future development and extraction costs and future oil and gas prices. Total proved reserves are those reserves that have a high degree of certainty (at least 90% confidence at the aggregate corporate level) of being recoverable under existing economic and political conditions, with existing technology. Total probable reserves are based on geological and/or engineering data similar to that used in estimates of total proved reserves, but technical, contractual, or regulatory uncertainties preclude such reserves from being classified as total proved. Aggregate corporate total proved plus probable reserves are attributed to known accumulations and it is equally likely that the actual remaining quantities to be recovered will be greater or less than the reserves estimated.
19 Trilogy Energy Corp.

MANAGEMENT’S DISCUSSION AND ANALYSIS Q2 - 2017
Exploration and Evaluation Expenditures Exploration and evaluation costs are initially capitalized with the intent to establish commercially viable reserves. Exploration and evaluation assets include undeveloped land and costs related to exploratory wells. Exploration costs related to geophysical and geological activities are immediately charged to income as incurred. The Company is required to make estimates and judgments about future events and circumstances regarding the economic viability of extracting the underlying resources. The costs are subject to technical, commercial and management review to confirm the continued intent to develop and extract the underlying resources. Changes to project economics, resource quantities, expected production techniques, unsuccessful drilling, expired mineral leases, production costs and required capital expenditures are important factors when making this determination. If an exploration and evaluation project is determined to be unsuccessful, all associated costs in excess of the expected future benefit are charged to net income. If commercial reserves are established, the relevant costs are transferred from exploration and evaluation to development and production assets which are classified as property, plant, and equipment. Assets are reviewed for impairment prior to any such transfer. Refer to note 9 of the Interim Financial Statements for further details.
Impairment and Impairment Reversal of Non-financial Assets Impairment is evaluated at the cash-generating unit (“CGU”) level. The determination of CGU’s requires judgment in defining the smallest identifiable group of assets that generate cash inflows that are largely independent of the cash inflows from other assets or groups of assets. CGU’s have been determined based on similar geological structure, shared infrastructure, geographical proximity, commodity type and similar exposures to market risks. The recoverable amounts of Trilogy’s cash-generating units and individual assets have been determined based on fair values less costs of disposal. This calculation requires the use of estimates and assumptions. Oil and gas prices and other assumptions will change in the future, which may impact Trilogy’s recoverable amount calculated and may therefore require a material adjustment to the carrying value of property, plant and equipment and goodwill. Trilogy monitors internal and external indicators of impairment and impairment reversals relating to its exploration and evaluation assets, property, plant and equipment and goodwill. Refer to note 10 of the Annual Financial Statements for further details about methods and assumptions used in estimating net recoverable amounts.
Decommissioning and Restoration Costs Decommissioning and restoration costs will be incurred by Trilogy at the end of the operating lives of Trilogy’s oil and gas properties. The ultimate decommissioning and restoration costs are uncertain and cost estimates can vary in response to many factors including assumptions of inflation, present value discount rates on future liabilities, changes to relevant legal requirements and the emergence of new restoration techniques or experience at other production sites. The expected timing and amount of expenditures can also change, for example, in response to changes in reserves or changes in laws and regulations or their interpretation. Refer to note 14 of the Interim Financial Statements for further details.
Share-based Payments Trilogy measures the cost of equity-settled transactions with employees by reference to the fair value of the equity instruments at the date they are granted. Estimating fair value requires the determination of the most appropriate valuation model for a grant of equity instruments, which is dependent on the terms and conditions of the grant. This also requires the determination of the most appropriate inputs to the valuation model including the expected life of the option, risk free interest rates, volatility and dividend yield and making assumptions about them. Refer to note 15 of the Interim Financial Statements for further details.
Deferred Income Tax Assets Trilogy recognizes a benefit related to deferred income tax assets. Assessing the recoverability of deferred income tax assets requires Trilogy to make significant estimates related to expectations of future taxable income based on forecasted cash flows from operations. Trilogy also makes interpretations and judgements on uncertain tax positions of applicable tax laws. Such judgements include determining the likelihood of Trilogy’s tax positions being successfully challenged by tax authorities based on information from relevant tax interpretations and tax laws. To the extent such interpretations are challenged by the tax authorities or future cash flows and taxable income differ significantly from estimates, the ability of Trilogy to realize its deferred tax assets recorded at the balance sheet date may be compromised. Refer to note 11 of the Interim Financial Statements for further details.
20 Trilogy Energy Corp.
MANAGEMENT’S DISCUSSION AND ANALYSIS Q2 - 2017
Financial Instruments The estimated fair values of financial assets and liabilities, by their very nature, are subject to measurement uncertainty due to their exposure to credit, liquidity and market risks. Furthermore, the Company may use derivative instruments to manage oil and gas commodity price, foreign currency, power, and interest rate exposures. The fair values of these derivatives are determined using valuation models which require assumptions concerning the amount and timing of future cash flows and discount rates. Management’s assumptions rely on external observable market data including quoted commodity prices and volatility, interest rate yield curves and foreign exchange rates. The resulting fair value estimates may not be indicative of the amounts realized or settled in current market transactions and as such are subject to measurement uncertainty. Refer to note 20, 21, and 22 of the Interim Financial Statements for further details. 9B New Accounting Pronouncements There were no new accounting standards that were effective January 1, 2017. Future accounting pronouncements that impact on the Company are summarized in note 5 of the 2016 Annual Consolidated Financial Statements. The Company continues to assess and evaluate the impact of the standards on the consolidated financial statements.
Internal Control over Financial Reporting As at December 31, 2016, the Company’s Chief Executive Officer (“CEO”) and Chief Financial Officer (“CFO”) evaluated and concluded that the design and operation of the Company’s Internal Controls over Financial Reporting (“ICFR”) were effective. There were no changes that occurred during the period covered by this MD&A that has materially affected, or is reasonably likely to materially affect, the Company’s ICFR.
Advisories
Certain statements included in this document (including this MD&A and the Operations Update) constitute forward-looking statements under applicable securities legislation. Forward-looking statements or information typically contain statements with words such as "anticipate", "believe", "expect", "plan", "intend", "estimate", "propose", “budget”, “goal”, “objective”, “possible”, “probable”, “projected”, “scheduled”, or state that certain actions, events or results “may”, “could”, “should”, “would”, “might” or “will” be taken, occur or be achieved, or similar words suggesting future outcomes or statements regarding an outlook. Forward-looking statements or information in this document include but are not limited to statements regarding:
• the proposed merger with Paramount and the timing and expected results thereof;
• business strategy and objectives for 2017 and beyond;
• forecast 2017 annual production levels, the relative content of natural gas liquids therein, and the expected impact of the second quarter asset dispositions in May 2017;
• planned 2017 capital expenditures and Trilogy’s intention to execute its capital budget within annual funds flow from operations;
• operating, finding and development, decommissioning, asset retirement, restoration and other costs and the anticipated results of Trilogy’s cost cutting measures;
• the capacity under and potential liabilities relating to long-term transportation, fractionation and other
marketing, midstream and forward contracts; • anticipated funds flow from operations and other
measures of profit, • expectations regarding future commodity prices for
crude oil, natural gas, NGLs and related products and the potential impact to Trilogy of commodity price fluctuations;
• estimated reserves, the discounted present value of future net revenue therefrom and the Company’s plans to develop same including the capital required, the timing thereof and the price forecasts used in calculating the foregoing;
• the ability to profitably exploit Trilogy’s assets, grow production and generate long-term shareholder value;
• the anticipated impact of government royalty regimes and incentive programs affecting Trilogy
21 Trilogy Energy Corp.

MANAGEMENT’S DISCUSSION AND ANALYSIS Q2 - 2017
including, without limitation, the Alberta Government’s Modernized Royalty Framework, Emerging Resources Program and Enhanced Hydrocarbon Recovery Program;
• future expenditures and future allowances relating to environmental matters and abandonment and reclamation obligations and Trilogy’s ability to comply with and fund same;
• the term of and borrowing capacity under Trilogy’s credit facility and projections regarding the liquidity of Trilogy to enable it to pursue its growth objectives in the future;
• pro-forma debt levels and reduction of net debt;
• projected results of hedging contracts and other financial instruments;
• income taxation of Trilogy; estimates of tax assets, tax pools and Trilogy’s future taxability and deferred tax assets;
• Management’s current estimate of the financial impact of the recent Kaybob North Montney pipeline release and a third party prior year reallocation; and
• other expectations, beliefs, plans, goals, objectives, assumptions, information and statements about possible future events, conditions, and results of operations or performance.
Statements regarding “reserves” are forward-looking statements, as they involve the implied assessment, based on certain estimates and assumptions, that the reserves described exist in the quantities predicted or estimated, and can be profitably produced in the future. Such forward-looking statements or information are based on a number of assumptions which may prove to be incorrect. In addition to other assumptions identified in this document, assumptions have been made regarding, among other things:
• the likelihood that all necessary shareholder and
other approvals will be obtained and conditions satisfied in order for the proposed merger with Paramount to proceed as proposed;
• future crude oil, natural gas, condensate, NGLs and other commodity pricing and supply;
• funds flow from operations and cash flow consistent with expectations;
• current reserves estimates; • credit facility availability and access to sources of
funding for Trilogy’s planned operations and expenditures;
• the ability of Trilogy to service and repay its debt when due;
• current production forecasts and the relative mix of crude oil, natural gas and NGLs therein;
• geology applicable to Trilogy’s land holdings; • the extent and development potential of Trilogy’s
assets (including, without limitation, Trilogy’s Kaybob area Montney oil and gas assets, the Duvernay Shale play and Gething assets, among others);
• the ability of Trilogy and its industry partners to obtain drilling and operational results, improvements and efficiencies consistent with expectations (including in respect of anticipated production volumes, reserves additions and NGL yields);
• well economics; • decline rates; • foreign currency, exchange and interest rates; • royalty rates, taxes and capital, operating, general
& administrative and other costs and expenses; • assumptions regarding royalties and expenses and
the applicability and continuity of royalty regimes and government incentive programs to Trilogy’s operations;
• general business, economic, industry and market conditions;
• projected capital investment levels and the successful and timely implementation of capital projects;
• anticipated timelines and budgets being met in respect of drilling programs and other operations;
• the ability of Trilogy to obtain equipment, services, supplies and personnel in a timely manner and at an acceptable cost to carry out its evaluations and activities;
• the ability of Trilogy to secure adequate product processing, transportation, fractionation and storage capacity on acceptable terms or at all and assumptions regarding the timing and costs of run-times, outages and turnarounds;
• the ability of Trilogy to market its oil, natural gas, condensate, other NGLs and other products successfully to current and new customers;
• expectation that counterparties will fulfill their obligations under operating, processing, marketing and midstream agreements;
• the timely receipt of required regulatory approvals; • the continuation of assumed tax regimes, estimates
and projections in respect of the application of tax laws and estimates of deferred tax amounts, tax assets and tax pools;
22 Trilogy Energy Corp.
MANAGEMENT’S DISCUSSION AND ANALYSIS Q2 - 2017
• the extent of Trilogy’s liabilities; and • assumptions used in calculating the provisions
made for the cost of the Kaybob North Montney
pipeline release and the third party prior year production reallocations.
Although Trilogy believes that the expectations reflected in such forward-looking statements or information are reasonable, undue reliance should not be placed on forward-looking statements because Trilogy can give no assurance that such expectations will prove to be correct. Forward-looking statements or information are based on current expectations, estimates and projections that involve a number of risks and uncertainties which could cause actual results to differ materially from those anticipated by Trilogy and described in the forward-looking statements or information. These risks and uncertainties include but are not limited to: • the risk that the proposed merger with Paramount
will not proceed as proposed or within the expected timing thereof as a result of not obtaining the requisite shareholder or other approvals or due to other conditions not being satisfied;
• fluctuations in crude oil, natural gas, condensate and other natural gas liquids and commodity prices;
• the ability to generate sufficient funds flow from operations and obtain financing on acceptable terms to fund planned exploration, development, construction and operational activities and to meet current and future obligations;
• the possibility that Trilogy will not commercially develop its Duvernay shale assets in the near future or at all;
• uncertainties as to the availability and cost of financing;
• Trilogy's ability to satisfy maintenance covenants within its credit and debt arrangements;
• the risk and effect of a downgrade in Trilogy’s credit rating;
• fluctuations in foreign currency, exchange rates and interest rates;
• the risks of the oil and gas industry, such as operational risks in exploring for, developing and producing crude oil, natural gas, condensate and other natural gas liquids, and market demand;
• risks and uncertainties involving the geology of oil and gas;
• the uncertainty of reserves estimates and reserves life;
• the uncertainty of estimates and projections relating to future production and NGL yields as well as costs and expenses;
• the ability of Trilogy to add production and reserves through development and exploration activities and acquisitions;
• Trilogy's ability to secure adequate product processing, transmission, transportation, fractionation and storage capacity on acceptable terms and on a timely basis or at all;
• potential disruptions or unexpected technical difficulties in designing, developing, or operating
new, expanded, or existing pipelines or facilities (including third party operated pipelines and facilities);
• risks inherent in Trilogy's marketing operations, including credit and other financing risks and the risk that Trilogy may not be able to enter into arrangements for the sale of its sales volumes;
• volatile business, economic and market conditions; • general risks related to strategic and capital
allocation decisions, including potential delays or changes in plans with respect to exploration or development projects or capital expenditures and Trilogy's ability to react to same;
• availability of equipment, goods, services and personnel in a timely manner and at an acceptable cost;
• health, safety, security and environmental risks; • the timing and cost of future abandonment and
reclamation obligations and potential liabilities for environmental damage and contamination;
• risks and costs associated with environmental, regulatory and compliance, including those potentially associated with hydraulic fracturing, greenhouse gases and “climate change” and the cost to Trilogy in order to comply with same;
• weather conditions; • the possibility that government policies, regulations
or laws may change, including risks related to the imposition of moratoriums;
• the possibility that regulatory approvals may be delayed or withheld;
• risks associated with Trilogy’s ability to enter into and maintain leases and licenses;
• uncertainty with regard to royalty payments and the applicability of and changes to royalty regimes and incentive programs including, without limitation, applicable royalty incentive regimes and the Modernized Royalty Framework, the Emerging Resources Program and the Enhanced Hydrocarbon Recovery Program, among others;
• imprecision in estimates of product sales, commodity prices, capital expenditures, tax pools, tax deductions available to Trilogy, changes to and
23 Trilogy Energy Corp.
MANAGEMENT’S DISCUSSION AND ANALYSIS Q2 - 2017
the interpretation of tax legislation and regulations; • uncertainty regarding results of objections to
Trilogy's exploration and development plans by third party industry participants, aboriginal and local populations and other stakeholders;
• risks associated with existing and potential lawsuits, regulatory actions, audits and assessments;
• changes in land values paid by industry; • risks associated with Trilogy's mitigation strategies
including insurance and hedging activities; • risks related to the actions and financial
circumstances of Trilogy agents and contractors, counterparties and joint venture partners, including renegotiation of contracts;
• risks relating to cybersecurity, vandalism, and terrorism;
• the ability of management to execute its business plan;
• the risk that the assumptions used by Management to estimate the provision for the costs resulting from the recent Kaybob North Montney pipeline release and the third party prior year production reallocation prove to be incorrect; and
• other risks and uncertainties described elsewhere in this document and in Trilogy's other filings with Canadian securities authorities, including its Annual Information Form.
The foregoing lists are not exhaustive. Additional information on these and other factors which could affect the Company’s operations or financial results are included in the Company’s most recent Annual Information Form and in other documents on file with the Canadian Securities regulatory authorities. The forward-looking statements or information contained in this document are made as of the date hereof and Trilogy undertakes no obligation to update publicly or revise any forward-looking statements or information, whether as a result of new information, future events or otherwise, unless so required by applicable securities laws.
Non-GAAP Measures Certain measures used in this document, including “adjusted EBITDA”, “consolidated debt”, “finding and development costs”, “funds flow from operations”, “operating income”, “net debt”, “operating netback”, “recycle ratio” and “senior debt" collectively the “Non GAAP measures” do not have any standardized meaning as prescribed by IFRS and previous GAAP and, therefore, are considered Non-GAAP measures. Non-GAAP measures are commonly used in the oil and gas industry and by Trilogy to provide Shareholders and potential investors with additional information regarding the Company’s liquidity and its ability to generate funds to finance its operations. However, given their lack of standardized meaning, such measurements are unlikely to be comparable to similar measures presented by other issuers. “Adjusted EBITDA” refers to “Funds flow from operations” plus cash interest, tax expenses, certain other items (accrued cash remuneration costs for its employees – deducted from EBITDA when paid) that do not appear individually in the line items of the Company’s financial statements, in addition to pro-forma adjustments for properties acquired or disposed of in the period and the exclusion of revenues or losses of an extraordinary and non-recurring nature. “Consolidated debt” generally includes all long-term debt plus any issued and undrawn letters of credit, less any cash held. “Finding and development costs” refers to all capital expenditures and costs of acquisitions, excluding expenditures where the related assets were disposed of by the end of the year, and including changes in future development capital on a total proved or total proved plus probable basis. “Finding and development costs
per Barrel of oil equivalent” (“F&D $/Boe”) is calculated by dividing finding and development costs by the current year’s reserve extensions, discoveries and revisions on a total proved or total proved plus probable reserve basis. Management uses finding and development costs as a measure to assess the performance of the Company’s resources required to locate and extract new hydrocarbon reservoirs. “Funds flow from operations” refers to the cash flow from operating activities before net changes in operating working capital as shown in the consolidated statements of cash flows. Management utilizes funds flow from operations as a key measure to assess the ability of the Company to finance dividends, operating activities, capital expenditures and debt repayments. “Operating income” is equal to petroleum and natural gas sales before financial instruments and bad debt expenses minus royalties, operating charges, and
24 Trilogy Energy Corp.

MANAGEMENT’S DISCUSSION AND ANALYSIS Q2 - 2017
transportation costs. Management uses this metric to measure the discrete operating results of its oil and gas properties. “Operating netback” refers to operating income plus realized financial instrument gains and losses and other income minus actual decommissioning, restoration, and remediation costs incurred. Operating netback provides management with a more fulsome metric on its oil and gas properties considering strategic decisions (for example, hedging programs) and associated full life cycle charges. “Net debt” is calculated as current liabilities minus current assets therein plus long-term debt. Management
utilizes net debt as a key measure to assess the liquidity of the Company. “Recycle ratio” is equal to “Operating netback” on a production barrel of oil equivalent for the year divided by “F&D $/Boe” (computed on a total proved or total proved plus probable reserve basis as applicable). Management uses this metric to measure the profitability of the Company in turning a barrel of reserves into a barrel of production. “Senior debt” is generally defined as “Consolidated debt” but excluding any indebtedness under the Senior Unsecured Notes.
Investors are cautioned that the Non-GAAP measures should not be considered in isolation or construed as alternatives to their most directly comparable measure calculated in accordance with IFRS, as set forth above, or other measures of financial performance calculated in accordance with IFRS.
Numerical References All references in this document and Trilogy’s functional currency are in Canadian Dollars unless otherwise indicated. The columns on some tables in this document may not add due to rounding.
Oil and Gas Advisory This document contains disclosure expressed as "Boe", "MBoe", "Boe/d", “Mcf”, “Mcf/d”, "MMcf", “MMcf/d", “Bcf”, “Bbl”, and “Bbl/d”. All oil and natural gas equivalency volumes have been derived using the ratio of six thousand cubic feet of natural gas to one barrel of oil (6:1). Equivalency measures may be misleading, particularly if used in isolation. A conversion ratio of six thousand cubic feet of natural gas to one barrel of oil is based on an energy equivalency conversion method primarily applicable at the burner tip and does not represent a value equivalency at the well head. For Q2 2017, the ratio between Trilogy’s average realized oil price and the average realized natural gas price was approximately 20:1 (“Value Ratio”). The Value Ratio is obtained using the Q2 2017 average realized oil price of $58.13 (CAD$/Bbl) and the Q2 2017 average realized natural gas price of $2.98 (CAD$/Mcf). This Value Ratio is significantly different from the energy equivalency ratio of 6:1 and using a 6:1 ratio would be misleading as an indication of value.
Additional Information Trilogy's common shares are listed on the Toronto Stock Exchange under the symbol "TET". Additional information about Trilogy, including Trilogy’s Annual Information Form, is available at www.sedar.com or at Trilogy’s website www.trilogyenergy.com.
25 Trilogy Energy Corp.

Consolidated Interim Balance Sheet (unaudited) (in thousand Canadian dollars)
June 30,2017
ASSETS Current assets
Trade and other receivables 20, 21 33,700 37,534 Derivative financial instruments 20, 21, 22 7,842 - Prepaids 4,310 1,649
45,852 39,183 Non-current assets
Property, plant and equipment 6, 7, 8, 9 924,734 997,471 Exploration and evaluation assets 7, 9 42,512 49,046 Deferred tax asset 11 46,156 60,511 Goodwill 10 74,133 78,503
Total assets $ 1,133,387 $ 1,224,714
EQUITY AND LIABILITIESCurrent liabilities
Trade and other payables 12, 20, 21 $ 52,562 $ 57,425 Interest payable 13 1,073 1,132 Derivative financial instruments 20, 21, 22 - 7,364
53,635 65,921 Non-current liabilities
Long-term debt 13, 20, 21 459,092 561,880 Decommissioning and restoration liability 14 222,239 233,015
Total liabilities 734,966 860,816 Shareholders’ equity
Shareholders’ capital 15, 16 1,105,694 1,105,115 Contributed surplus 16 69,420 68,024 Accumulated deficit (776,693) (809,241)
398,421 363,898 Total shareholders’ equity and liabilities $ 1,133,387 $ 1,224,714
December 31,2016
Note
See accompanying notes to the consolidated interim financial statements Subsequent events (note 24)
26 Trilogy Energy Corp.

Consolidated Interim Statement of Comprehensive Income (loss) (unaudited) (in thousand Canadian dollars except per share amounts)
NoteRevenue and other
Petroleum and natural gas sales 23 $ 61,280 $ 39,125 $ 137,369 $ 84,652 Royalties (4,383) (3,100) (10,848) (6,222)Revenue 56,897 36,025 126,521 78,430 Gain (loss) on derivative financial instruments 21, 22 8,297 (1,515) 23,492 (1,502)Other income (expense) 125 (21) 182 (851)
65,319 34,489 150,195 76,077
ExpensesOperating and production 17,918 15,414 39,824 32,345 Transportation 3,931 3,913 7,498 13,699 Depletion and depreciation 6 35,522 35,186 77,246 70,765 Environmental remediation 12 1,000 - 2,000 - Impairment reversal 8 (19,756) - (27,415) - Exploration and evaluation 9 445 134 803 906 Gain on disposal of assets 7 (23,604) (571) (23,686) (501)General and administrative 2,000 3,088 4,475 6,828 Transaction costs 24 1,537 - 1,537 - Share-based compensation 15 998 5,902 1,913 7,890 Accretion on decommissioning and restoration liability 14 1,224 971 2,509 2,227
Interest and other finance costs 13 8,074 8,121 16,588 16,373 29,289 72,158 103,292 150,532
Income (loss) before income tax 36,030 (37,669) 46,903 (74,455)
Income tax expense (recovery)Deferred 11 11,175 (8,557) 14,355 (17,798)
Comprehensive Income (loss) $ 24,855 $ (29,112) $ 32,548 $ (56,657)
Income (loss) per share 17- Basic $ 0.20 (0.23) $ 0.26 (0.45)- Diluted $ 0.20 (0.23) $ 0.26 (0.45)
Six Months Ended June 30,2017 2016
Three months ended June 30,20162017
See accompanying notes to the consolidated interim financial statements
27 Trilogy Energy Corp.

Consolidated Interim Statement of Changes in Equity (unaudited) (In thousand Canadian dollars except share information)
ShareCapital
Balance at January 1, 2016 126,023,581 $ 1,103,784 $ 59,798 $ (715,840) $ 447,742
Net loss for the period - - - (56,657) (56,657)Share Incentive Plan purchases, net of grants vested (note 15, 16) 39,924 1,073 (1,073) - -
Share-based compensation (note 15) 7,890 7,890
Balance at June 30, 2016 126,063,505 1,104,857 66,615 (772,497) 398,975
Net loss for the period - - - (36,744) (36,744)Share options exercised (note 15, 16) 36,580 233 (49) - 184 Share Incentive Plan purchases, net of grants vested (note 15, 16) 910 25 (25) - -
Share-based compensation (note 15) - - 1,483 - 1,483
Balance at December 31, 2016 126,100,995 1,105,115 68,024 (809,241) 363,898
Net income for the period - - - 32,548 32,548 Share options exercised (note 15, 16) 13,760 80 (18) - 62 Share Incentive Plan purchases, net of grants vested (note 15, 16) 18,557 499 (499) - -
Share-based compensation (note 15) - - 1,913 - 1,913
Balance at June 30, 2017 126,133,312 $ 1,105,694 $ 69,420 $ (776,693) $ 398,421
OutstandingCommon andNon-VotingShares (1)
Contributed Surplus
Accumulated Deficit
Shareholders’Equity
(1) Net of Common Shares held in trust for the benefit of employees under Trilogy’s Share Incentive Plan (refer to notes 15 and 16 for additional disclosures). See accompanying notes to the consolidated interim financial statements
28 Trilogy Energy Corp.

Consolidated Interim Statement of Cash Flows (unaudited) (in thousand Canadian dollars except as otherwise indicated)
Note
Operating activitiesNet income (loss) before income tax $ 36,030 $ (37,669) $ 46,903 $ (74,454)Adjustments for non-cash and other items:
Unrealized (gains) losses on derivative financial instruments 22 (5,420) 5,954 (15,206) 10,417
Unrealized foreign exchange (gains) losses 13 63 8 1,109 Depletion and depreciation 6 35,522 35,186 77,246 70,765 Exploration and evaluation 9 445 134 803 906 Impairment reversal 8 (19,756) - (27,415) - Loss (gain) on disposal of assets (23,604) (571) (23,686) (501)Amortization of finance fees 13 351 297 717 982 Share based compensation 15 998 5,902 1,913 7,890 Accretion on decommissioning and restoration liability 14 1,224 971 2,509 2,227
Decommissioning and restoration costs in period 14 (862) (544) (2,470) (1,307)
Change in non-cash working capital 18 (10,789) (18,407) (324) (13,272)Cash flow from (used in) operating activities 14,152 (8,684) 60,998 4,762
Investing activitiesExploration and evaluation expenditures 9 - (237) 81 (6,439)Property, plant and equipment expenditures 6 (22,144) (867) (63,882) (16,939)Proceeds from disposition of property, plant and equipment 6 109,005 498 109,680 436
Change in non-cash working capital 18 (8,356) (11,821) (3,426) (12,420)Cash flow from (used in) investing activities 78,505 (12,427) 42,453 (35,362)
Financing activities(Repayments) Draws on revolving credit facility 13 (92,701) 21,111 (103,513) 30,600 Shares issued 15, 16 44 - 62 -
Cash flow from (used in) financing activities (92,657) 21,111 (103,451) 30,600
Change in cash - - - - Cash balance, beginning of year - - - - Cash balance, end of year - - - -
Cash interest paid 13 $ 13,848 $ 13,971 $ 16,035 $ 16,120
2017 2016Three months ended June 30, Six months Ended June 30,
2017 2016
See accompanying notes to the consolidated interim financial statements
29 Trilogy Energy Corp.

Notes to the Consolidated Interim Financial Statements (unaudited) June 30, 2017 (in thousand Canadian dollars except as otherwise indicated)
1. General Trilogy Energy Corp. (“Trilogy” or the “Company”) is a petroleum and natural gas-focused Canadian energy corporation that actively acquires, develops, produces and sells natural gas, crude oil and natural gas liquids. Trilogy’s registered office is located at 1400, 332 – 6th Avenue SW, Calgary, Alberta and its petroleum and natural gas extractive operations are situated primarily in the Province of Alberta. References are made to (“Shares”), consisting of common shares (“Common Shares”) and non-voting shares (“Non-Voting Shares”).
2. Basis of Preparation The Company prepares its financial statements in accordance with International Financial Reporting Standards (“IFRS”) as issued by the International Accounting Standards Board. These condensed consolidated financial statements (“Interim Financial Statements”) have been prepared in accordance with IFRS applicable to the preparation of Interim Financial Statements, IAS 34 – Interim financial reporting (“IAS 34”). The policies applied in these Interim Financial Statements are based on IFRS issued and outstanding as of August 2, 2017, the date the Interim Financial Statements were approved for release by Trilogy’s Audit Committee on behalf of Trilogy’s Board of Directors. The Interim Financial Statements have been prepared on a historical cost basis, except for certain financial instruments that have been measured at fair value (note 21). All values are rounded to the nearest thousand except where otherwise indicated. The Interim Financial Statements include the accounts of the Company and its wholly-owned subsidiaries as the Company obtains all of the economic benefits of the operations of its operating subsidiaries. All intercompany transactions, balances and unrealized gains and losses from intercompany transactions are eliminated on consolidation. Subsidiaries include those entities (including special purpose entities), which Trilogy controls by having the power to govern the financial and operating policies. The existence and effect of potential voting rights that are currently exercisable or convertible are considered when assessing control over another entity. Subsidiaries are fully consolidated from the date on which control is obtained and are de-consolidated from the date that control ceases.
3. Significant Accounting Judgments, Estimates and Assumptions
The Company makes estimates and assumptions concerning the future that may, by definition, differ from actual results. The estimates and judgments applied by management that most significantly affect the Company’s financial statements include: reserve estimation, exploration and evaluation expenditures, impairment of non-financial assets, decommissioning and restoration costs, share-based payments, deferred income taxes, and financial instruments. These estimates and judgments have a significant risk of causing a material adjustment to the carrying amounts of assets and liabilities within reporting periods. Additional information on these estimates and judgements are disclosed in note 3 of the 2016 Annual Consolidated Financial Statements.
4. Summary of Significant Accounting Policies The Interim Financial Statements of the Company follow the same accounting policies and basis of presentation as described in note 4 of the 2016 Annual Consolidated Financial Statements.
5. New Accounting Pronouncements There were no new accounting standards that were effective January 1, 2017. Future accounting pronouncements that impact on the Company are summarized in note 5 of the 2016 Annual Consolidated Financial Statements. The Company continues to assess and evaluate the impact of the standards on the consolidated financial statements.
30 Trilogy Energy Corp.

Notes to the Consolidated Interim Financial Statements (unaudited) June 30, 2017 (in thousand Canadian dollars except as otherwise indicated)
6. Property, Plant and Equipment Oil and GasProperties
CorporateAssets Total
Cost:Balance at December 31, 2015 3,216,831 14,860 3,231,691 Additions to property, plant, and equipment 50,897 150 51,047 Additions/revisions to future estimated decommissioning and restoration costs (note 14) 2,185 - 2,185
Transfers from intangible exploration and evaluation assets (note 9) 35,307 - 35,307
Acquisitions 109 - 109 Disposals (313) - (313)Balance at December 31, 2016 3,305,016 15,010 3,320,026 Additions to property, plant, and equipment 63,854 28 63,882 Additions/revisions to future estimated decommissioning and restoration costs (note 14) 1,847 - 1,847
Transfers between exploration & evaluation assets and property, plant, and equipment (note 9) 1,943 - 1,943
Disposals (199,212) (308) (199,520)Balance as at June 30, 2017 3,173,448 14,730 3,188,178
Oil and GasProperties
CorporateAssets Total
Accumulated depletion, depreciation and impairment losses:Balance at December 31, 2015 2,170,400 10,951 2,181,351 Depletion and depreciation charge 140,837 833 141,670 Impairment charge (note 8) 22,114 - 22,114 Impairment reversal (note 8) (22,324) - (22,324)Disposals (256) - (256)Balance at December 31, 2016 2,310,771 11,784 2,322,555 Depletion and depreciation charge 76,985 261 77,246 Impairment reversal (note 8) (27,415) - (27,415)Disposals (108,934) (8) (108,942)Balance as at June 30, 2017 2,251,407 12,037 2,263,444 Net carrying valueAt December 31, 2016 994,245 3,226 997,471 At June 30, 2017 922,041 2,693 924,734 The cost of property, plant and equipment includes amounts in respect of the provision for decommissioning and restoration obligations of $183.7 million as at June 30, 2017 (December 31, 2016: $193.6). Property, plant and equipment with a carrying value of $38.6 million as at June 30, 2017 (December 31, 2016: $32.6 million) include development assets under construction that are not being depreciated. No borrowing costs were capitalized to property, plant and equipment in respect of the referenced periods. As at June 30, 2017, there were both indicators of impairment and impairment reversals.
31 Trilogy Energy Corp.

Notes to the Consolidated Interim Financial Statements (unaudited) June 30, 2017 (in thousand Canadian dollars except as otherwise indicated)
7. Gain on Disposal of Assets During the three months ended June 30, 2017, the Company disposed certain non-core assets and related liabilities for cash proceeds of $109 million (net of customary adjustments) resulting in a gain on disposal of $23.6 million. The assets consist of a portion of the Company’s interests within the Grande Prairie and Kaybob West Cash Generating Units (“CGU”).
2017 2016 2017 2016Proceeds of Disposition 109,005 498 109,680 436
Property, plant, & equipment 198,145 93 199,520 101 Accumulated depletion & depreciation (108,090) (166) (108,942) (166) Net carrying value 90,055 (73) 90,579 (65)Exploration and evaluation assets 3,551 - 3,708 - Goodwill 4,370 - 4,370 - Decommissioning and restoration liability (12,575) - (12,663) -
Book value of net assets disposed 85,401 (73) 85,994 (65)Gain on disposal of assets 23,604 571 23,686 501
Three months-ended June 30
Six months-ended June 30
8. Impairment Loss & Reversals
2017 2016 2017 2016Impairment reversal (23,900) - (31,559) - Impairment loss 4,144 - 4,144 -
(19,756) - (27,415) -
Three months-ended June 30
Six months-ended June 30
The Company recorded a reversal, for the three and six months-ended, of previously recognized impairment in both the Grande Prairie and Kaybob West CGUs, net of depletion and depreciation that would otherwise have been recorded, of $23.9 and $31.6 million, respectively. The reversal was a function of the purchase price that would be received to sell an asset or paid to transfer a liability in an orderly transaction between market participants at the measurement date. The following table summarizes Trilogy’s carrying and impairment reversal amounts for certain assets within its Grande Prairie and Kaybob West CGUs as at June 30, 2017:
Cash Generating Unit Recoverable
Amount Carrying Amount
after Reversal Impairment
Reversal Grande Prairie 50,000 30,989 (7,659)Kaybob West 60,000 59,590 (23,900)
110,000 90,579 (31,559) Also in response to continued declines in commodity prices and resulting updates to the Company’s strategic plans for non-core areas, at June 30, 2017, the Company assessed and concluded that the carrying value of its Grande Prairie CGU exceeded their fair value less costs of disposal resulting in an impairment of $4.1 million. The Company determined the recoverable amounts for its CGU’s using the fair value less costs of disposal method based on internally generated cash flow projections, extending approximately over the next 40 years. In determining fair value less costs of disposal, the Company considered recent transactions within the industry, external views of commodity prices, and externally evaluated reserve volumes. The calculation of the recoverable amount is sensitive to the assumptions regarding production volumes, discount rates, operating costs and commodity prices. The inputs used in the valuation methodology are considered fair value Level 3 inputs (refer to note 21) as certain key
32 Trilogy Energy Corp.

Notes to the Consolidated Interim Financial Statements (unaudited) June 30, 2017 (in thousand Canadian dollars except as otherwise indicated)
assumptions are not based on observable market data but, rather, management’s best estimate. In computing the recoverable amount, future cash flows were adjusted for risks specific to the CGU and discounted using an after-tax discount rate of approximately 10 percent (2016: 10 percent). The discount rate is considered to approximate the rate of return that a market participant would require for assets of similar characteristics and risk. Undeveloped land valuation estimates of exploration and evaluation assets were also included in the recoverable amount. Selected key price forecasts and exchange rates used in the estimation of the value of commercial reserves as at June 30, 2017 and December 31, 2016 were as follows: June 30, 2017
Residual 2017 2018 2019 2020 2021
AECO Gas Cdn$/MMBtu 3.00 2.85 3.05 3.35 3.65 Edmonton Light Sweet Crude Cdn$/Bbl 66.50 69.40 72.30 77.80 83.40 Edmonton Condensate Cdn$/Bbl 69.50 72.50 75.40 81.00 86.60 West Texas Intermediate Crude U.S.$/Bbl 52.50 56.10 59.80 66.30 73.10 Foreign Exchange (U.S/Cdn) 0.75 0.78 0.80 0.83 0.85
December 31, 20162017 2018 2019 2020 2021
AECO Gas Cdn$/MMBtu 3.40 3.15 3.30 3.60 3.90 Edmonton Light Sweet Crude Cdn$/Bbl 69.80 72.70 75.50 81.10 86.60 Edmonton Condensate Cdn$/Bbl 72.80 75.80 78.60 84.30 89.80 West Texas Intermediate Crude U.S.$/Bbl 55.00 58.70 62.40 69.00 75.80 Foreign Exchange (U.S/Cdn) 0.75 0.78 0.80 0.83 0.85
9. Exploration and Evaluation Assets
Undeveloped Land
Exploratory Wells
Total Exploration and EvaluationExpenditures
CostBalance at December 31, 2015 62,695 - 62,695
Additions 623 22,697 23,320 Expensed (1,134) - (1,134)Transfers to property, plant and equipment (note 6) (14,114) (21,193) (35,307)Dispositions (528) - (528)
Balance at December 31, 2016 47,542 1,504 49,046 Additions - (81) (81)Expensed (802) - (802)Transfers between exploration & evaluation assets and property, plant, and equipment (note 6) (520) (1,423) (1,943)
Dispositions (3,708) - (3,708)Balance at June 30, 2017 42,512 - 42,512 The following table reflects exploration and evaluation expenditures that were charged to income:
2017 2016 2017 2016Expired mineral leases 447 128 802 897 Geological and geophysical costs (2) 6 1 9
445 134 803 906
Three months-ended June 30
Six months-ended June 30
33 Trilogy Energy Corp.

Notes to the Consolidated Interim Financial Statements (unaudited) June 30, 2017 (in thousand Canadian dollars except as otherwise indicated)
Exploration and evaluation expenditures also include costs associated with geological and geophysical costs which are immediately expensed to the consolidated statement of comprehensive income.
10. Goodwill
June 30, 2017 December 31, 2016Cost 78,503 78,503 Dispositions (4,370) -
74,133 78,503
As at
11. Income Tax The movement in deferred income tax assets and (liabilities) is as follows:
Net Deferred Income Tax Asset/(Liability)
Property, Plant, & Equipment
Risk Management
Decommissioning Liabilities
Losses & Other Total
At December 31, 2015 (75,563) (4,917) 61,838 48,045 29,404 Recovery (expense) (13,956) 6,905 1,075 37,082 31,107 At December 31, 2016 (89,519) 1,988 62,913 85,127 60,511 Recovery (expense) (8,078) (4,106) (2,910) 738 (14,355)At June 30, 2017 (97,597) (2,117) 60,003 85,867 46,156 As at June 30, 2017, Trilogy recognized a deferred tax asset of $46.2 million. A $14.4 million deferred income tax expense was recorded to the consolidated statement of comprehensive income (loss) for the six month period ended June 30, 2017 (Twelve months-ended December 31, 2016 – $31.1 million deferred income tax recovery). The amount and timing of reversals of temporary differences will be dependent upon, among other things, the Company’s future operating results, and acquisitions and dispositions of assets and liabilities. Legislative changes in tax rates or successful challenges by tax authorities of Trilogy’s interpretation of tax legislation could materially affect the Company’s estimate of current and deferred income taxes. Trilogy has tax losses of $378.9 million that are available for carry forward against future taxable income of the entities in which the losses arose. Of this amount, a deferred tax asset has been recognized for $310.5 million, representing the Company’s probable estimate of future taxable income that could be applied to the total losses.
12. Environmental Remediation
In October 2016, Trilogy discovered a leak in one of its emulsion pipelines within its Kaybob Montney Oil Development, approximately fifteen kilometers from the Town of Fox Creek, Alberta. The Company recorded a $6.0 million environmental remediation expense during the fourth quarter of 2016; which was the estimated cost of remediation at that time. In 2017, Trilogy increased this estimate by a further $2.0 million, for a total of $8.0 million. The Company has spent approximately $7.3 million since the release was identified in October of 2016. Trilogy expects the remaining remediation costs to be approximately $0.7 million, which costs will be incurred primarily throughout the remainder of 2017 and into 2018. The provision for the remediation contains significant estimates and judgements about the scope, timing, and related costs of the work that will be required. The assumptions and estimates used in the provision are based on current data and could change in the future as further information becomes available to the Company.
34 Trilogy Energy Corp.
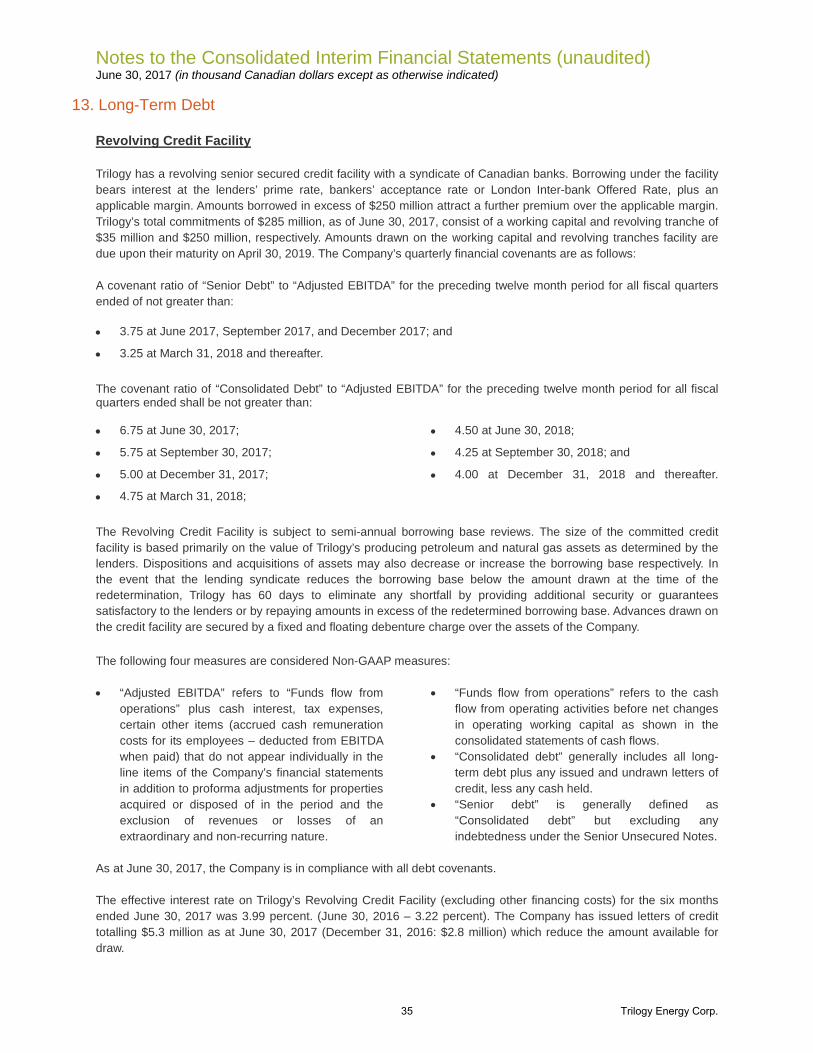
Notes to the Consolidated Interim Financial Statements (unaudited) June 30, 2017 (in thousand Canadian dollars except as otherwise indicated)
13. Long-Term Debt
Revolving Credit Facility
Trilogy has a revolving senior secured credit facility with a syndicate of Canadian banks. Borrowing under the facility bears interest at the lenders’ prime rate, bankers’ acceptance rate or London Inter-bank Offered Rate, plus an applicable margin. Amounts borrowed in excess of $250 million attract a further premium over the applicable margin. Trilogy’s total commitments of $285 million, as of June 30, 2017, consist of a working capital and revolving tranche of $35 million and $250 million, respectively. Amounts drawn on the working capital and revolving tranches facility are due upon their maturity on April 30, 2019. The Company’s quarterly financial covenants are as follows: A covenant ratio of “Senior Debt” to “Adjusted EBITDA” for the preceding twelve month period for all fiscal quarters ended of not greater than:
• 3.75 at June 2017, September 2017, and December 2017; and
• 3.25 at March 31, 2018 and thereafter.
The covenant ratio of “Consolidated Debt” to “Adjusted EBITDA” for the preceding twelve month period for all fiscal quarters ended shall be not greater than: • 6.75 at June 30, 2017;
• 5.75 at September 30, 2017;
• 5.00 at December 31, 2017;
• 4.75 at March 31, 2018;
• 4.50 at June 30, 2018;
• 4.25 at September 30, 2018; and
• 4.00 at December 31, 2018 and thereafter.
The Revolving Credit Facility is subject to semi-annual borrowing base reviews. The size of the committed credit facility is based primarily on the value of Trilogy’s producing petroleum and natural gas assets as determined by the lenders. Dispositions and acquisitions of assets may also decrease or increase the borrowing base respectively. In the event that the lending syndicate reduces the borrowing base below the amount drawn at the time of the redetermination, Trilogy has 60 days to eliminate any shortfall by providing additional security or guarantees satisfactory to the lenders or by repaying amounts in excess of the redetermined borrowing base. Advances drawn on the credit facility are secured by a fixed and floating debenture charge over the assets of the Company. The following four measures are considered Non-GAAP measures: • “Adjusted EBITDA” refers to “Funds flow from
operations” plus cash interest, tax expenses, certain other items (accrued cash remuneration costs for its employees – deducted from EBITDA when paid) that do not appear individually in the line items of the Company’s financial statements in addition to proforma adjustments for properties acquired or disposed of in the period and the exclusion of revenues or losses of an extraordinary and non-recurring nature.
• “Funds flow from operations” refers to the cash flow from operating activities before net changes in operating working capital as shown in the consolidated statements of cash flows.
• “Consolidated debt” generally includes all long-term debt plus any issued and undrawn letters of credit, less any cash held.
• “Senior debt” is generally defined as “Consolidated debt” but excluding any indebtedness under the Senior Unsecured Notes.
As at June 30, 2017, the Company is in compliance with all debt covenants. The effective interest rate on Trilogy’s Revolving Credit Facility (excluding other financing costs) for the six months ended June 30, 2017 was 3.99 percent. (June 30, 2016 – 3.22 percent). The Company has issued letters of credit totalling $5.3 million as at June 30, 2017 (December 31, 2016: $2.8 million) which reduce the amount available for draw.
35 Trilogy Energy Corp.
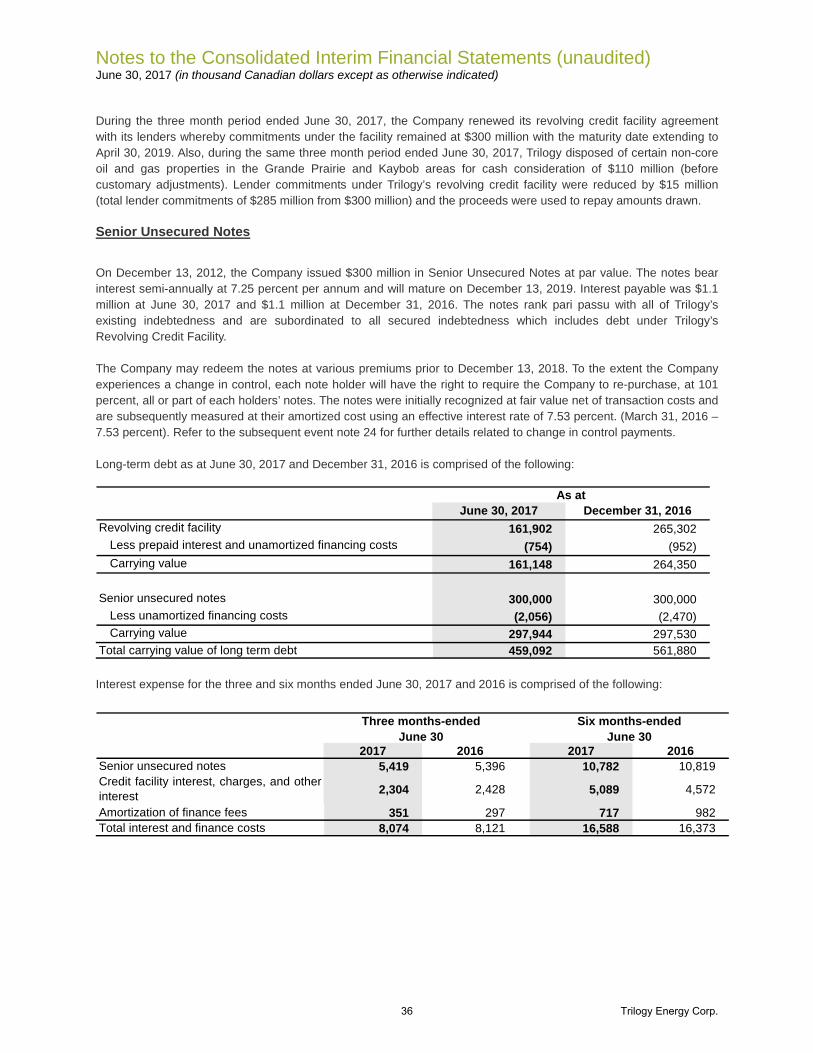
Notes to the Consolidated Interim Financial Statements (unaudited) June 30, 2017 (in thousand Canadian dollars except as otherwise indicated)
During the three month period ended June 30, 2017, the Company renewed its revolving credit facility agreement with its lenders whereby commitments under the facility remained at $300 million with the maturity date extending to April 30, 2019. Also, during the same three month period ended June 30, 2017, Trilogy disposed of certain non-core oil and gas properties in the Grande Prairie and Kaybob areas for cash consideration of $110 million (before customary adjustments). Lender commitments under Trilogy’s revolving credit facility were reduced by $15 million (total lender commitments of $285 million from $300 million) and the proceeds were used to repay amounts drawn. Senior Unsecured Notes
On December 13, 2012, the Company issued $300 million in Senior Unsecured Notes at par value. The notes bear interest semi-annually at 7.25 percent per annum and will mature on December 13, 2019. Interest payable was $1.1 million at June 30, 2017 and $1.1 million at December 31, 2016. The notes rank pari passu with all of Trilogy’s existing indebtedness and are subordinated to all secured indebtedness which includes debt under Trilogy’s Revolving Credit Facility. The Company may redeem the notes at various premiums prior to December 13, 2018. To the extent the Company experiences a change in control, each note holder will have the right to require the Company to re-purchase, at 101 percent, all or part of each holders’ notes. The notes were initially recognized at fair value net of transaction costs and are subsequently measured at their amortized cost using an effective interest rate of 7.53 percent. (March 31, 2016 – 7.53 percent). Refer to the subsequent event note 24 for further details related to change in control payments. Long-term debt as at June 30, 2017 and December 31, 2016 is comprised of the following:
June 30, 2017 December 31, 2016Revolving credit facility 161,902 265,302
Less prepaid interest and unamortized financing costs (754) (952)Carrying value 161,148 264,350
Senior unsecured notes 300,000 300,000 Less unamortized financing costs (2,056) (2,470)Carrying value 297,944 297,530
Total carrying value of long term debt 459,092 561,880
As at
Interest expense for the three and six months ended June 30, 2017 and 2016 is comprised of the following:
2017 2016 2017 2016Senior unsecured notes 5,419 5,396 10,782 10,819 Credit facility interest, charges, and otherinterest 2,304 2,428 5,089 4,572
Amortization of finance fees 351 297 717 982 Total interest and finance costs 8,074 8,121 16,588 16,373
Six months-ended June 30
Three months-ended June 30
36 Trilogy Energy Corp.

Notes to the Consolidated Interim Financial Statements (unaudited) June 30, 2017 (in thousand Canadian dollars except as otherwise indicated)
14. Decommissioning and Restoration Liability
Six Months Ended Twelve Months EndedJune 30, 2017 December 31, 2016
Balance - January 1, 233,015 229,033 Incurred 1,829 4,274 Disposed (12,663) (29)Settled (2,470) (2,746)Accretion 2,509 4,572 Revision to estimates 19 (2,089)Balance – end of period 222,239 233,015 Settlement of the Company’s decommissioning and restoration obligation is expected to be paid over the next 40 years and will be funded from the general resources of the Company. The estimated future cash outflows as at June 30, 2017 have been discounted using an average risk free rate of 2.25 percent and inflation rate of 2.0 percent. (December 31, 2016 - 2.25 and 2.0 percent, respectively). The Company has estimated the undiscounted and uninflated value of the decommissioning and restoration obligation to be $227.6 million as at June 30, 2017 (December 31, 2016: $241.1 million).
15. Share-Based Payment Plans The share-based payment expense recognized for employee services received for the three and six months ended June 30, 2017 and 2016 are as follows:
2017 2016 2017 2016Share Incentive Plan - 26 - 116 Share Option Plan 998 5,876 1,913 7,774
998 5,902 1,913 7,890
Six months-ended June 30
Three months-ended June 30
The Company has a Share Incentive Plan (“SIP”) for employees and officers that, if and to the extent approved by the Compensation Committee, annually awards rights to receive Common Shares. Common Shares are purchased in the open market and held by an independent trustee until completion of the vesting period. The fair value of the Common Shares awarded is recognized in share-based compensation over the vesting period, with a corresponding charge to equity. The Common Shares, while held in trust, are recorded as a reduction of Share Capital. The following table provides a continuity of the SIP Common Shares held in trust at the beginning and end of the following periods:
Six Months Ended Twelve Months EndedJune 30, 2017 December 31, 2016
Beginning 25,297 66,131 Vested (18,557) (40,834)Ending 6,740 25,297
The cost to the Company of the Common Shares held in trust was $0.2 million as at June 30, 2017 (December 31, 2016 - $0.7 million) and was recorded as a reduction to Common Shares outstanding and Shareholder Capital. Conversely, the vesting of Share Incentive Plan awards increases Common Shares outstanding and Shareholder Capital. The Company also has a long-term incentive plan that, if and to the extent approved by the Compensation Committee, awards share options to eligible directors, officers and employees (the “Share Option Plan”). Under this
37 Trilogy Energy Corp.

Notes to the Consolidated Interim Financial Statements (unaudited) June 30, 2017 (in thousand Canadian dollars except as otherwise indicated)
plan, holders of vested share options are able to subscribe for the equivalent number of Common Shares at the exercise price within the contractual period prescribed in the governing option agreement. The exercise price of the options is equal to the average trading price over the five trading days prior to the grant. The contractual life of each option granted ranged from 2 to 5 years. The following table provides a continuity of the share options outstanding at the beginning and end of the following periods:
WeightedAverage
Exercise Price No. of Options
WeightedAverage
Exercise Price No. of OptionsOutstanding at January 1 $ 7.23 6,297,690 $ 18.10 10,344,960
Granted - - 6.80 1,645,000 Exercised 4.49 (13,760) 5.02 (36,580)Cancelled 11.61 (108,440) 27.00 (5,629,690)Expired 7.38 (450) 26.89 (26,000)
Outstanding at period end $ 7.16 6,175,040 $ 7.23 6,297,690 Exercisable at period end $ 7.33 2,398,360 $ 7.46 2,445,370
December 31, 2016June 30, 2017Six Months Ended Twelve Months Ended
During the second quarter of 2016, the Company cancelled approximately 5.5 million stock options which required the acceleration of any unamortized option grant fair value ($5.0 million) to be charged to share based compensation.
The range of exercise prices of the outstanding options and exercisable options as at June 30, 2017 were as follows:
Exercise Price Range
Weighted Average Contractual
Life Remaining
Number of Options
Weighted Average
Exercise Price
Number of Options
Weighted Average
Exercise Price$4.49 to $7.37 3.8 3,484,880 $5.56 727,200 $4.49$7.38 to $7.67 0.2 1,036,160 $7.39 1,012,160 $7.38$10.39 2.8 1,654,000 $10.39 659,000 $10.39Total 2.9 6,175,040 $7.16 2,398,360 $7.33
Exercisable OptionsOutstanding Options
The average market share price at the date of exercise for share options exercised in 2017 was $5.50 (2016: $7.15).
38 Trilogy Energy Corp.

Notes to the Consolidated Interim Financial Statements (unaudited) June 30, 2017 (in thousand Canadian dollars except as otherwise indicated)
16. Issued Capital Trilogy is authorized to issue an unlimited number of Common Shares and an unlimited number of Non-Voting Shares all without par value. The Non-Voting Shares are the same as the Common Shares except they do not carry any voting rights. The following provides a continuity of outstanding share capital:
Shares as at December 31, 2015 105,187,719 20,835,862 126,023,581 $ 1,103,784 Issued - Share Option Plan 36,580 - 36,580 233 Vesting of Share Incentive Plan awards 40,834 - 40,834 1,098
Shares as at December 31, 2016 105,265,133 20,835,862 126,100,995 - 1,105,115 Issued - Share Option Plan 13,760 - 13,760 80 Vesting of Share Incentive Plan awards 18,557 - 18,557 499
Shares as at June 30, 2017 105,297,450 20,835,862 126,133,312 $ 1,105,694
Amount (2)CommonShares(1)
Non-Voting Shares
Total
(1) Net of Common Shares held in trust for the benefit of employees and officers under Trilogy’s Share Incentive Plan
17. Earnings (Loss) per Share The following table reflects the earnings/loss and share data used in the basic and diluted earnings per share calculations:
2017 2016 2017 2016Net earnings (loss) used in thecalculation of total basic and dilutedearnings per share
24,855 (29,112) 32,548 (56,657)
Weighted average number of shares forthe purposes of basic earnings per share 126,125,676 126,063,505 126,123,913 126,063,505
Effect of dilution 187,342 NIL 360,025 NIL Weighted average number of shares 126,313,018 126,063,505 126,123,913 126,063,505
Earnings (loss) per share – Basic 0.20 (0.23) 0.26 (0.45)Earnings (loss) per share – Diluted 0.20 (0.23) 0.26 (0.45)
Three months-ended June 30
Six months-ended June 30
39 Trilogy Energy Corp.

Notes to the Consolidated Interim Financial Statements (unaudited) June 30, 2017 (in thousand Canadian dollars except as otherwise indicated)
18. Reconciliation of Changes in Non-Cash Working Capital
2017 2016 2017 2016Decrease (increase) in trade, other receivables and prepaids (119) (1,479) 1,172 (1,157)
Decrease in trade, other payables and interest payable (19,026) (28,749) (4,922) (24,535)
(19,145) (30,228) (3,750) (25,692)Changes in non-cash operating working capital (10,789) (18,407) (324) (13,272)
Changes in non-cash investing working capital (8,356) (11,821) (3,426) (12,420)
Three months-ended June 30
Six months-ended June 30
19. Related Party Transactions
Trilogy had the following transactions with Paramount Resources Ltd. (“Paramount”), which owns approximately 15.2 percent of the equity in the Company:
• Pursuant to a services agreement, a Paramount subsidiary provides commodity marketing services to the Company. The agreement may be terminated by either party with at least six months written notice. The amount of expenses billed and accrued under this agreement was $0.2 million for the six months ended June 30, 2017 (Six months ended June 30, 2016 - $0.2 million). Costs associated with this agreement are included as part of the general and administrative expenses in the Company’s consolidated statement of comprehensive loss.
• The Company and Paramount also transact with each other in the normal course of any joint operations.
The amounts due from (to) Paramount as at the balance sheet dates are as follows: As at June 30, 2017
Presented in the Balance Sheet as Normal Business Services Agreement Trade and other receivables 92 - Trade and other payables (361) (60)
As at December 31, 2016
Presented in the Balance Sheet as Normal Business Services Agreement Trade and other receivables 314 - Trade and other payables (135) (60)
The receivables and payables are unsecured in nature and bear no interest. No provisions were held against receivables or payables from Paramount through 2017 and 2016.
20. Financial Risk Management and Objectives Trilogy’s principal financial instruments, other than financial derivatives, are its accounts receivable, accounts payable, accrued liabilities and its outstanding draw-downs from its Revolving Credit Facility and senior note debt, which arise directly from its business. The credit facility is the main source of Trilogy’s finances after cash flow from
40 Trilogy Energy Corp.
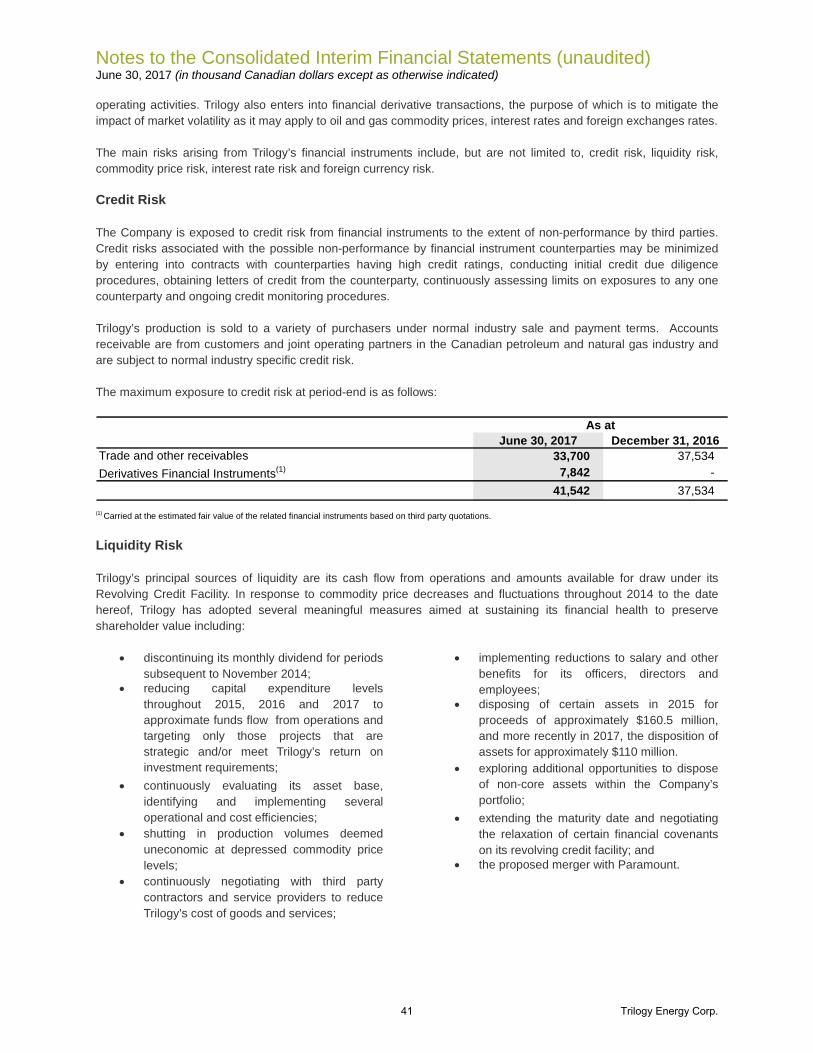
Notes to the Consolidated Interim Financial Statements (unaudited) June 30, 2017 (in thousand Canadian dollars except as otherwise indicated)
operating activities. Trilogy also enters into financial derivative transactions, the purpose of which is to mitigate the impact of market volatility as it may apply to oil and gas commodity prices, interest rates and foreign exchanges rates. The main risks arising from Trilogy’s financial instruments include, but are not limited to, credit risk, liquidity risk, commodity price risk, interest rate risk and foreign currency risk. Credit Risk The Company is exposed to credit risk from financial instruments to the extent of non-performance by third parties. Credit risks associated with the possible non-performance by financial instrument counterparties may be minimized by entering into contracts with counterparties having high credit ratings, conducting initial credit due diligence procedures, obtaining letters of credit from the counterparty, continuously assessing limits on exposures to any one counterparty and ongoing credit monitoring procedures. Trilogy’s production is sold to a variety of purchasers under normal industry sale and payment terms. Accounts receivable are from customers and joint operating partners in the Canadian petroleum and natural gas industry and are subject to normal industry specific credit risk. The maximum exposure to credit risk at period-end is as follows:
June 30, 2017 December 31, 2016Trade and other receivables 33,700 37,534 Derivatives Financial Instruments(1) 7,842 -
41,542 37,534
As at
(1) Carried at the estimated fair value of the related financial instruments based on third party quotations.
Liquidity Risk Trilogy’s principal sources of liquidity are its cash flow from operations and amounts available for draw under its Revolving Credit Facility. In response to commodity price decreases and fluctuations throughout 2014 to the date hereof, Trilogy has adopted several meaningful measures aimed at sustaining its financial health to preserve shareholder value including:
• discontinuing its monthly dividend for periods subsequent to November 2014;
• reducing capital expenditure levels throughout 2015, 2016 and 2017 to approximate funds flow from operations and targeting only those projects that are strategic and/or meet Trilogy’s return on investment requirements;
• continuously evaluating its asset base, identifying and implementing several operational and cost efficiencies;
• shutting in production volumes deemed uneconomic at depressed commodity price levels;
• continuously negotiating with third party contractors and service providers to reduce Trilogy’s cost of goods and services;
• implementing reductions to salary and other benefits for its officers, directors and employees;
• disposing of certain assets in 2015 for proceeds of approximately $160.5 million, and more recently in 2017, the disposition of assets for approximately $110 million.
• exploring additional opportunities to dispose of non-core assets within the Company’s portfolio;
• extending the maturity date and negotiating the relaxation of certain financial covenants on its revolving credit facility; and
• the proposed merger with Paramount.
41 Trilogy Energy Corp.

Notes to the Consolidated Interim Financial Statements (unaudited) June 30, 2017 (in thousand Canadian dollars except as otherwise indicated)
A contractual maturity analysis for Trilogy’s financial liabilities as at June 30, 2017 is as follows:
Within 1 Year 1 to 2 years 3 years TotalAccounts payable and accrued liabilities 52,562 - - 52,562 Long-term debt and estimated interest(1) 27,109 182,898 310,875 520,882 Total 79,671 182,898 310,875 573,444
(1) Estimated interest related to the Revolving Credit Facility for future periods was calculated using the weighted average interest rate for the year to date June 30,
2017 applied to the principal balance outstanding as at that date with principal repayment assumed on April 30, 2018. Estimated interest related to the unsecured
senior notes for future periods was calculated using the coupon interest rate of 7.25 percent applied to the principal balance with principal repayment assumed on
December 13, 2019. A contractual maturity analysis for Trilogy’s financial liabilities as at December 31, 2016 is as follows:
Within 1 Year 1 to 2 years 3 years Total
Accounts payable and accrued liabilities 57,425 - - 57,425 Derivative financial instruments 7,364 - - 7,364 Long-term debt and estimated interest(1) 32,562 289,704 321,750 644,016 Total 97,351 289,704 321,750 708,805
(1) Estimated interest related to the Revolving Credit Facility for future periods was calculated using the weighted average interest rate for the year ended
December 31, 2016 applied to the principal balance outstanding as at that date with principal repayment assumed on April 30, 2017. Estimated interest related to
the unsecured senior notes for future periods was calculated using the coupon interest rate of 7.25 percent applied to the principal balance with principal
repayment assumed on December 13, 2019.
Capital Management The Company’s capital structure currently consists of borrowings under its senior notes, Revolving Credit Facility, letters of credit (issued as financial security to third parties) and shareholders’ equity. The objectives in managing the capital structure are to: • utilize an appropriate amount of leverage to maximize return on shareholder equity; and • provide Trilogy with borrowing capacity and financial flexibility for its operating and capital requirements.
Management and the Board of Directors review and assess the Company’s capital structure policy at each regularly scheduled board meeting and at other meetings called for that purpose. The financial strategy may be adjusted based on the current outlook of the underlying business, the capital required to fund the reserves program and the state of the debt and equity capital markets. In order to maintain or adjust the capital structure, the Company may, among other things, issue new shares; issue new debt securities; amend, revise, renew or extend the terms of the existing credit facility; enter into agreements establishing new credit facilities; adjust capital spending, and/or; dispose of assets. The Company filed, on August 25, 2016, a Canadian base shelf prospectus under which it may raise up to $300 million of securities within twenty five months from the filing date.
42 Trilogy Energy Corp.

Notes to the Consolidated Interim Financial Statements (unaudited) June 30, 2017 (in thousand Canadian dollars except as otherwise indicated)
A comparison of Trilogy’s debt structure against the committed amount on its Revolving Credit Facility at June 30, 2017 and December 31, 2016 is detailed below:
June 30, 2017 December 31, 2016Committed amount that can be drawn from the credit facility (Note 13) 285,000 300,000
Outstanding letters of credit (5,276) (2,776)Amount that can be drawn after letters of credit 279,724 297,224
Revolving credit facility (161,148) (264,350)Current liabilities net of current assets (7,783) (26,738)Capacity under revolving credit facility 110,793 6,136
As at
Trilogy’s net debt, calculated as its long-term debt plus any net working capital surplus or deficiency, is as follows:
June 30, 2017 December 31, 2016Revolving credit facility (Note 13) (161,148) (264,350)Senior notes (Note 13) (297,944) (297,530)Working capital deficiency (7,783) (26,738)Net debt(1) (466,875) (588,618)
As at
(1) Net debt is a Non-GAAP measure During the three month period ended June 30, 2017, the Company renewed its revolving credit facility agreement with its lenders whereby commitments under the facility remained at $300 million with the maturity date extending to April 30, 2019. Also, during the same three month period ended June 30, 2017, Trilogy disposed of certain non-core oil and gas properties in the Grande Prairie and Kaybob areas for cash consideration of $110 million (before customary adjustments). Lender commitments under Trilogy’s revolving credit facility were reduced by $15 million (total lender commitments of $285 million from $300 million) and the proceeds were used to repay amounts drawn.
21. Financial Instruments Set out below are the carrying amounts, by category, of Trilogy’s financial assets and liabilities as reflected in the financial statements.
June 30, 2017 December 31, 2016Financial assets
Receivables(1) 33,700 37,534 Financial instruments fair valued through profit and loss(2) 7,842 -
Financial liabilitiesOther liabilities - non-trading liabilities(1) (3) (52,562) (57,425)Interest payable on Senior Unsecured Notes (1,073) (1,132)Financial instruments fair valued through profit and loss(2) - (7,364)Other liabilities - long-term debt(4) (459,092) (561,880)
As at
(1) Carried at cost which approximates the fair value of the assets and liabilities due to the short-term nature of the accounts. (2) Carried at the estimated fair value of the related financial instruments based on third party quotations. (3) Consists of accounts payable and accrued liabilities. (4) The Company’s Revolving Credit Facility debt carries interest based on specified benchmark interest rates plus a spread for the Company’s own credit risk. The
fair value of the Revolving Credit Facility debt approximates its carrying amount due to the fact that interest is adjusted periodically based on changes in the
relevant benchmark interest rates and there have been no significant changes in the Company’s own credit risk. The fair value of the Senior Unsecured Notes is
43 Trilogy Energy Corp.

Notes to the Consolidated Interim Financial Statements (unaudited) June 30, 2017 (in thousand Canadian dollars except as otherwise indicated)
estimated, based on independent broker quotes, to be 101 percent of face value or $303 million (December 31, 2016 – 101 percent of face value or $303 million) -
level 3 type – unobservable data inputs.
The three levels of the fair value hierarchy are: Level 1 – Unadjusted quoted prices in active markets for identical assets or liabilities; Level 2 – Input other than quoted prices that are observable for the asset or liability either directly or indirectly; and Level 3 – inputs that are not based on observable data. The following provides a classification summary of Trilogy’s financial instruments within the fair value hierarchy as at: As at June 30, 2017
Level 1 Level 2 Level 3 TotalNatrual gas derivative contract - 1,712 - 1,712 Crude oil derivative contracts - 6,130 - 6,130
- 7,842 - 7,842
As at December 31, 2016Level 1 Level 2 Level 3 Total
Foreign exchange derivative contract - - (59) (59)Natrual gas derivative contract - (1,158) - (1,158)Crude oil derivative contracts - (6,147) - (6,147)
- (7,305) (59) (7,364)
Derivative financial assets (liabilities) – fair value
Derivative financial assets (liabilities) – fair value
At June 30, 2017 the Company had the following outstanding derivative contracts: Crude Oil Term Volume (Bbl/d)2017 - WTI Collar 500 2017 - WTI Collar 500 2017- Sale 1,000 2017- Sale 2,000
Average NYMEX Price/Bbl$38.00 - $57.50 USD
$71.17 CAD$54.46 USD
$42.00 - $52.90 USD
Natural Gas Term VolumeMay - December 2017 - Sale 30,000 (MMBTU/d) 3.39 USD
Average Price
In the second quarter of 2017, Trilogy realized $0.5 million in premium and termination settlement receipts on a foreign exchange derivative contract. The Company classified these financial instruments as fair valued through profit and loss and therefore has recognized the fair value of these financial instruments on its balance sheet. The estimated fair values of these financial instruments are based on quoted prices or, in their absence, third-party market indicators and forecasts. The changes in the fair value associated with the above financial contracts are recorded as an unrealized gain or loss on financial instruments in the consolidated statement of comprehensive income. Gains or losses arising from monthly settlements with counterparties are recognized as a realized gain or loss in the Consolidated Statement of Comprehensive Income (Loss).
44 Trilogy Energy Corp.
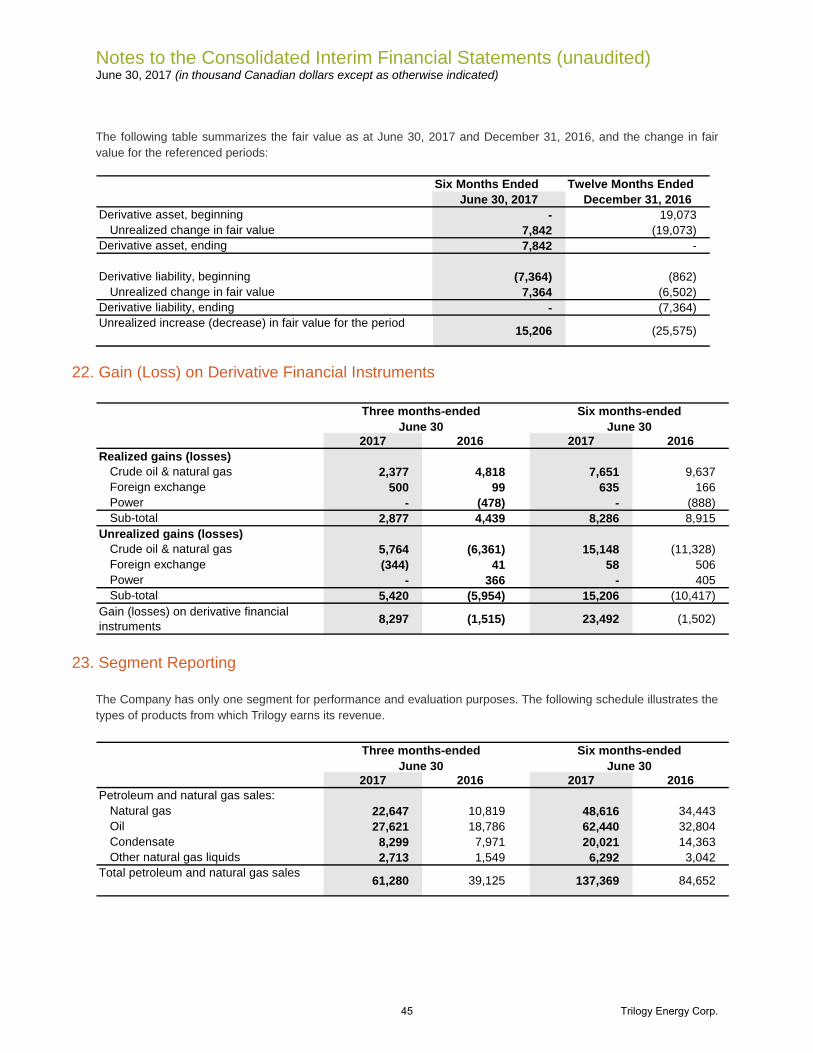
Notes to the Consolidated Interim Financial Statements (unaudited) June 30, 2017 (in thousand Canadian dollars except as otherwise indicated)
The following table summarizes the fair value as at June 30, 2017 and December 31, 2016, and the change in fair value for the referenced periods:
Six Months Ended Twelve Months EndedJune 30, 2017 December 31, 2016
Derivative asset, beginning - 19,073 Unrealized change in fair value 7,842 (19,073)
Derivative asset, ending 7,842 -
Derivative liability, beginning (7,364) (862)Unrealized change in fair value 7,364 (6,502)
Derivative liability, ending - (7,364)Unrealized increase (decrease) in fair value for the period 15,206 (25,575)
22. Gain (Loss) on Derivative Financial Instruments
2017 2016 2017 2016Realized gains (losses)
Crude oil & natural gas 2,377 4,818 7,651 9,637 Foreign exchange 500 99 635 166 Power - (478) - (888)Sub-total 2,877 4,439 8,286 8,915
Unrealized gains (losses)Crude oil & natural gas 5,764 (6,361) 15,148 (11,328)Foreign exchange (344) 41 58 506 Power - 366 - 405 Sub-total 5,420 (5,954) 15,206 (10,417)
Gain (losses) on derivative financial instruments 8,297 (1,515) 23,492 (1,502)
Six months-ended June 30
Three months-ended June 30
23. Segment Reporting
The Company has only one segment for performance and evaluation purposes. The following schedule illustrates the types of products from which Trilogy earns its revenue.
2017 2016 2017 2016Petroleum and natural gas sales:
Natural gas 22,647 10,819 48,616 34,443 Oil 27,621 18,786 62,440 32,804 Condensate 8,299 7,971 20,021 14,363 Other natural gas liquids 2,713 1,549 6,292 3,042
Total petroleum and natural gas sales 61,280 39,125 137,369 84,652
Three months-ended June 30
Six months-ended June 30
45 Trilogy Energy Corp.

Notes to the Consolidated Interim Financial Statements (unaudited) June 30, 2017 (in thousand Canadian dollars except as otherwise indicated)
24. Subsequent Events Subsequent to the quarter, Trilogy has announced that it has entered into an agreement to merge with Paramount. Under the merger, Paramount would acquire all of the common shares and non-voting shares of Trilogy not already owned by Paramount in exchange for common shares of Paramount on the basis of one Paramount share for every 3.75 Trilogy shares. The merger is to be effected by way of an arrangement under the Business Corporations Act (Alberta) and is subject to shareholder and court approvals, including minority shareholder approval by the shareholders of each of Trilogy and Paramount, and the fulfilment of other conditions that are typical for transactions of this nature. The special meetings of shareholders are expected to be held in September 2017. If all approvals are received and other closing conditions satisfied, the merger is expected to be completed that month.
The senior unsecured notes of Trilogy will remain outstanding following completion of the merger as the merger will not trigger any change of control payments. Following the merger, the outstanding Trilogy options will entitle the option holders to acquire Paramount shares rather than Trilogy shares at an adjusted exercise price, based on the exchange ratio for the merger and in accordance with the options’ original vesting schedules.
46 Trilogy Energy Corp.

Corporate Information Officers J.H.T. Riddell Chief Executive Officer
J.B. Williams President and Chief Operating Officer
M.G. Kohut Chief Financial Officer
G.L. Yester General Counsel & Corporate Secretary
Directors C.H. Riddell Chairman of the Board Calgary, Alberta
J.H.T. Riddell Chief Executive Officer Calgary, Alberta
R.K. MacLeod (1)(2)(3)(6) (7) Independent Businessman and Corporate Director Calgary, Alberta
W.A. Gobert (1)(2)(4)(5) Independent Businessman Calgary, Alberta
R.M. MacDonald (2)(3)(4)(5) Independent Businessman and Corporate Director Calgary, Alberta
E.M. Shier (4)(6) General Counsel, Corporate Secretary & Manager, Land Paramount Resources Ltd. Calgary, Alberta
D.F. Textor (1) Portfolio Manager DFT Energy LP Locust Valley, New York
Committees of the Board of Directors (1) Compensation Committee (2) Audit Committee (3) Reserves Committee (4) Corporate Governance Committee (5) Nominating Subcommittee (6) Environmental, Health & Safety Committee (7) Lead Director
Head office 1400, 332 6th Avenue SW Calgary, Alberta, Canada T2P 0B2
Telephone: (403) 290-2900 Facsimile: (403) 263-8915 www.trilogyenergy.com
Auditors PricewaterhouseCoopers LLP Calgary, Alberta
Bankers Bank of Montreal Calgary, Alberta
The Bank of Nova Scotia Calgary, Alberta
Royal Bank of Canada Calgary, Alberta
Canadian Imperial Bank of Commerce Calgary, Alberta
HSBC Bank Canada Calgary, Alberta
Alberta Treasury Branches Calgary, Alberta
The Toronto-Dominion Bank Calgary, Alberta
Registrar and Transfer Agent Computershare Trust Company of Canada Calgary, Alberta / Toronto, Ontario
Stock Exchange Listing The Toronto Stock Exchange – “TET”
47 Trilogy Energy Corp.