Q2 & H1 2015 Financial Results Presentation Dynamics and Breakdown Q2 2015 Revenue: $1,806m (Q1...
22
Q2 & H1 2015 Financial Results Presentation 23 July 2015
-
Upload
dangkhuong -
Category
Documents
-
view
215 -
download
2
Transcript of Q2 & H1 2015 Financial Results Presentation Dynamics and Breakdown Q2 2015 Revenue: $1,806m (Q1...
Q2 & H1 2015 Financial Results Presentation 23 July 2015
Table of Contents
3 Q2 & H1 2015 Results Overview
7 Divisional Performance and Market Outlook
11 Financial Position
16 Appendices
Q2 & H1 2015 Results Overview
Page 4
Summary
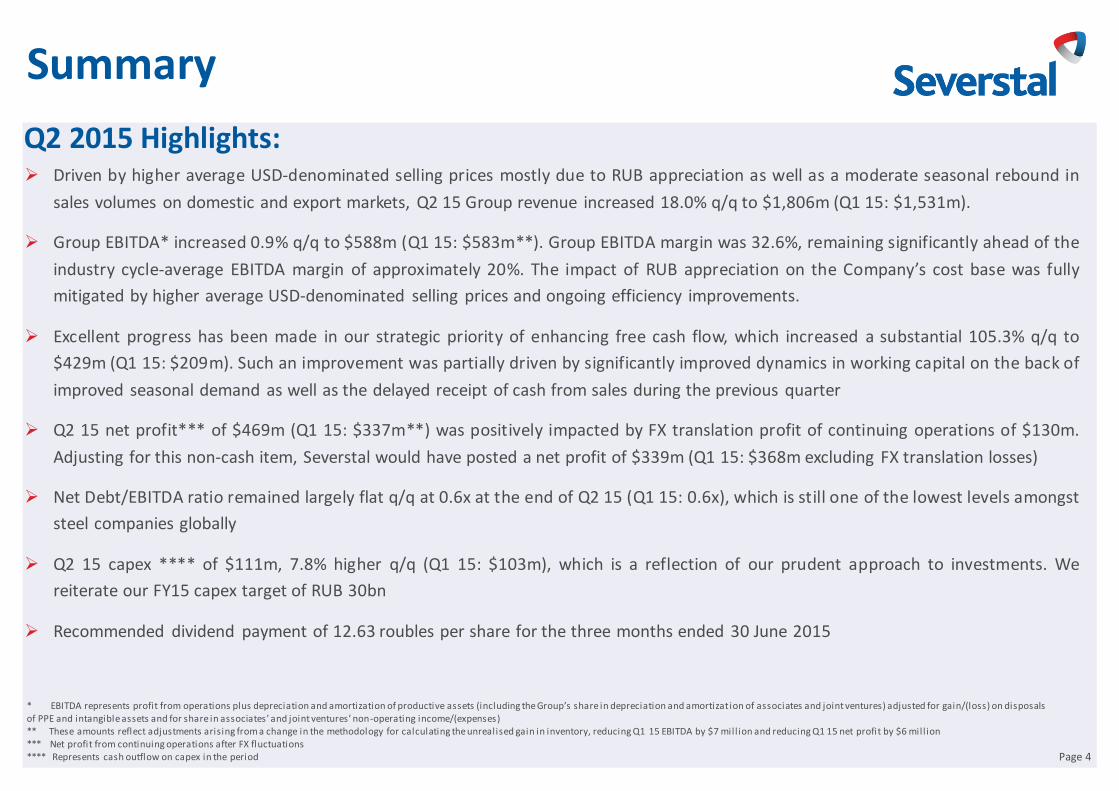
Driven by higher average USD-denominated selling prices mostly due to RUB appreciation as well as a moderate seasonal rebound in
sales volumes on domestic and export markets, Q2 15 Group revenue increased 18.0% q/q to $1,806m (Q1 15: $1,531m).
Group EBITDA* increased 0.9% q/q to $588m (Q1 15: $583m**). Group EBITDA margin was 32.6%, remaining significantly ahead of the
industry cycle-average EBITDA margin of approximately 20%. The impact of RUB appreciation on the Company’s cost base was fully
mitigated by higher average USD-denominated selling prices and ongoing efficiency improvements.
Excellent progress has been made in our strategic priority of enhancing free cash flow, which increased a substantial 105.3% q/q to
$429m (Q1 15: $209m). Such an improvement was partially driven by significantly improved dynamics in working capital on the back of
improved seasonal demand as well as the delayed receipt of cash from sales during the previous quarter
Q2 15 net profit*** of $469m (Q1 15: $337m**) was positively impacted by FX translation profit of continuing operations of $130m.
Adjusting for this non-cash item, Severstal would have posted a net profit of $339m (Q1 15: $368m excluding FX translation losses)
Net Debt/EBITDA ratio remained largely flat q/q at 0.6x at the end of Q2 15 (Q1 15: 0.6x), which is still one of the lowest levels amongst
steel companies globally
Q2 15 capex **** of $111m, 7.8% higher q/q (Q1 15: $103m), which is a reflection of our prudent approach to investments. We
reiterate our FY15 capex target of RUB 30bn
Recommended dividend payment of 12.63 roubles per share for the three months ended 30 June 2015
Q2 2015 Highlights:
* EBITDA represents profit from operations plus depreciation and amortization of productive assets (including the Group’s share in depreciation and amortizat ion of associates and joint ventures) adjusted for gain/(loss) on disposals of PPE and intangible assets and for share in associates’ and joint ventures’ non-operating income/(expenses) ** These amounts reflect adjustments arising from a change in the methodology for calculating the unrealised gain in inventory, reducing Q1 15 EBITDA by $7 mill ion and reducing Q1 15 net profit by $6 mill ion *** Net profit from continuing operations after FX fluctuations **** Represents cash outflow on capex in the period
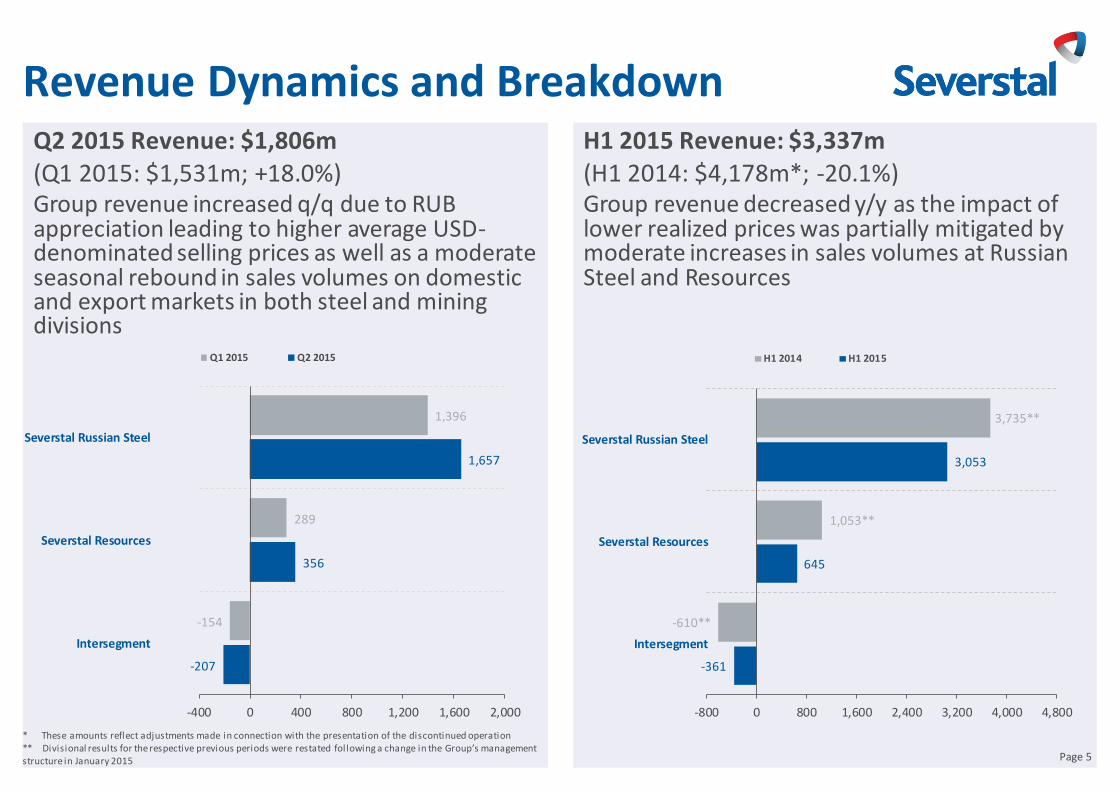
Revenue Dynamics and Breakdown Q2 2015 Revenue: $1,806m (Q1 2015: $1,531m; +18.0%) Group revenue increased q/q due to RUB appreciation leading to higher average USD-denominated selling prices as well as a moderate seasonal rebound in sales volumes on domestic and export markets in both steel and mining divisions
Page 5
H1 2015 Revenue: $3,337m (H1 2014: $4,178m*; -20.1%) Group revenue decreased y/y as the impact of lower realized prices was partially mitigated by moderate increases in sales volumes at Russian Steel and Resources
* These amounts reflect adjustments made in connection with the presentation of the discontinued operation ** Divisional results for the respective previous periods were restated following a change in the Group’s management structure in January 2015
-207
356
1,657
-154
289
1,396
-400 0 400 800 1,200 1,600 2,000
Intersegment
Severstal Resources
Severstal Russian Steel
Q1 2015 Q2 2015
-361
645
3,053
-610**
1,053**
3,735**
-800 0 800 1,600 2,400 3,200 4,000 4,800
Intersegment
Severstal Resources
Severstal Russian Steel
H1 2014 H1 2015
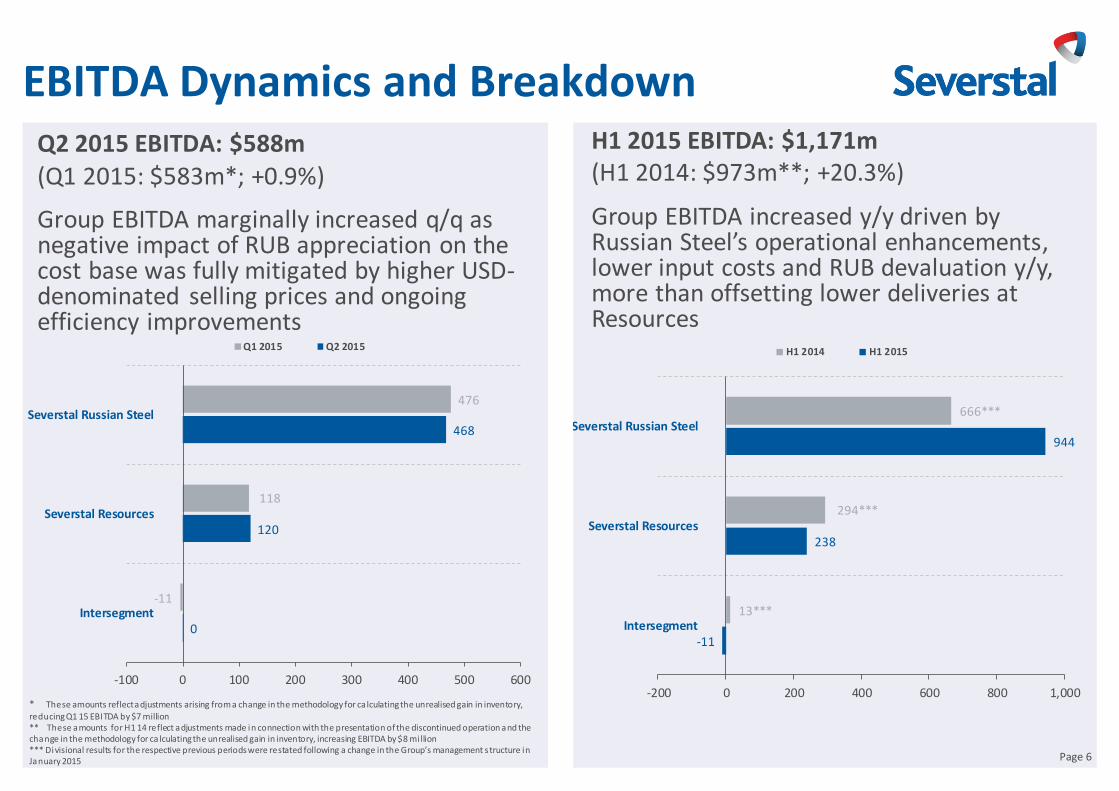
EBITDA Dynamics and Breakdown Q2 2015 EBITDA: $588m (Q1 2015: $583m*; +0.9%)
Group EBITDA marginally increased q/q as negative impact of RUB appreciation on the cost base was fully mitigated by higher USD-denominated selling prices and ongoing efficiency improvements
H1 2015 EBITDA: $1,171m (H1 2014: $973m**; +20.3%)
Group EBITDA increased y/y driven by Russian Steel’s operational enhancements, lower input costs and RUB devaluation y/y, more than offsetting lower deliveries at Resources
Page 6
* These amounts reflect adjustments arising from a change in the methodology for ca lculating the unrealised gain in inventory, reducing Q1 15 EBITDA by $7 million ** These amounts for H1 14 reflect adjustments made in connection with the presentation of the discontinued operation and the change in the methodology for ca lculating the unrealised gain in inventory, increasing EBITDA by $8 mi llion *** Divisional results for the respective previous periods were restated following a change in the Group’s management s tructure in January 2015
0
120
468
-11
118
476
-100 0 100 200 300 400 500 600
Intersegment
Severstal Resources
Severstal Russian Steel
Q1 2015 Q2 2015
-11
238
944
13***
294***
666***
-200 0 200 400 600 800 1,000
Intersegment
Severstal Resources
Severstal Russian Steel
H1 2014 H1 2015
Divisional Performance and Market Outlook
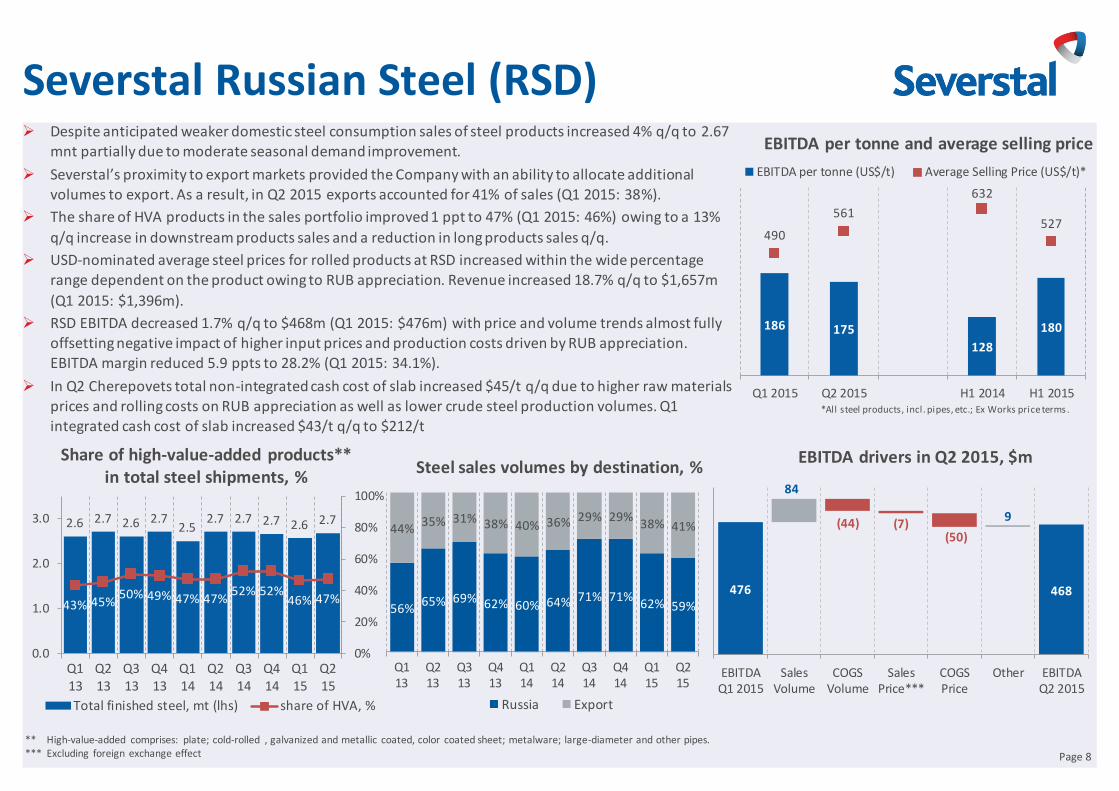
Severstal Russian Steel (RSD) Despite anticipated weaker domestic steel consumption sales of steel products increased 4% q/q to 2.67
mnt partially due to moderate seasonal demand improvement.
Severstal’s proximity to export markets provided the Company with an ability to allocate additional volumes to export. As a result, in Q2 2015 exports accounted for 41% of sales (Q1 2015: 38%).
The share of HVA products in the sales portfolio improved 1 ppt to 47% (Q1 2015: 46%) owing to a 13%
q/q increase in downstream products sales and a reduction in long products sales q/q.
USD-nominated average steel prices for rolled products at RSD increased within the wide percentage
range dependent on the product owing to RUB appreciation. Revenue increased 18.7% q/q to $1,657m
(Q1 2015: $1,396m).
RSD EBITDA decreased 1.7% q/q to $468m (Q1 2015: $476m) with price and volume trends almost fully
offsetting negative impact of higher input prices and production costs driven by RUB appreciation. EBITDA margin reduced 5.9 ppts to 28.2% (Q1 2015: 34.1%).
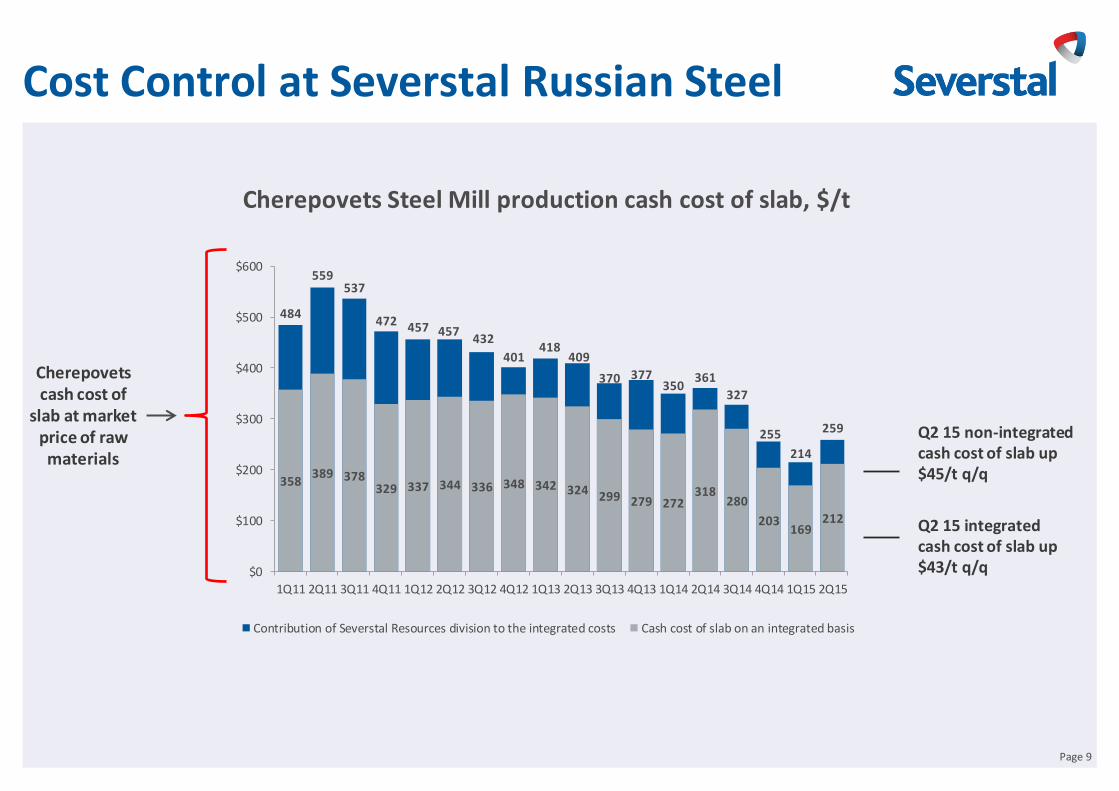
In Q2 Cherepovets total non-integrated cash cost of slab increased $45/t q/q due to higher raw materials
prices and rolling costs on RUB appreciation as well as lower crude steel production volumes. Q1 integrated cash cost of slab increased $43/t q/q to $212/t
Share of high-value-added products** in total steel shipments, %
EBITDA per tonne and average selling price
*All steel products, incl. pipes, etc.; Ex Works price terms.
Steel sales volumes by destination, %
** High-value-added comprises: plate; cold-rolled , galvanized and metallic coated, color coated sheet; metalware; large-diameter and other pipes. *** Excluding foreign exchange effect
EBITDA drivers in Q2 2015, $m
Page 8
186 175
128
180
490
561
632
527
Q1 2015 Q2 2015 H1 2014 H1 2015
EBITDA per tonne (US$/t) Average Selling Price (US$/t)*
2.6 2.7 2.6 2.7 2.5
2.7 2.7 2.7 2.6 2.7
43% 45% 50% 49% 47% 47%
52% 52% 46% 47%
0%
20%
40%
60%
80%
100%
0.0
1.0
2.0
3.0
Q113
Q213
Q313
Q413
Q114
Q214
Q314
Q414
Q115
Q215
Total finished steel, mt (lhs) share of HVA, %
56% 65% 69% 62% 60% 64% 71% 71%
62% 59%
44% 35% 31% 38% 40% 36% 29% 29%
38% 41%
Q113
Q213
Q313
Q413
Q114
Q214
Q314
Q414
Q115
Q215
Russia Export
476 468
84
(44) (7) (50)
9
EBITDAQ1 2015
SalesVolume
COGSVolume
SalesPrice***
COGSPrice
Other EBITDAQ2 2015
Cost Control at Severstal Russian Steel
Page 9
Cherepovets Steel Mill production cash cost of slab, $/t
Q2 15 non-integrated cash cost of slab up $45/t q/q
Cherepovets cash cost of
slab at market price of raw materials
Q2 15 integrated cash cost of slab up $43/t q/q
484
559 537
472 457 457 432
401 418
409
370 377 350
361
327
255
214
259
358 389 378
329 337 344 336 348 342 324 299 279 272 318
280
203 169
212
$0
$100
$200
$300
$400
$500
$600
1Q11 2Q11 3Q11 4Q11 1Q12 2Q12 3Q12 4Q12 1Q13 2Q13 3Q13 4Q13 1Q14 2Q14 3Q14 4Q14 1Q15 2Q15
Contribution of Severstal Resources division to the integrated costs Cash cost of slab on an integrated basis
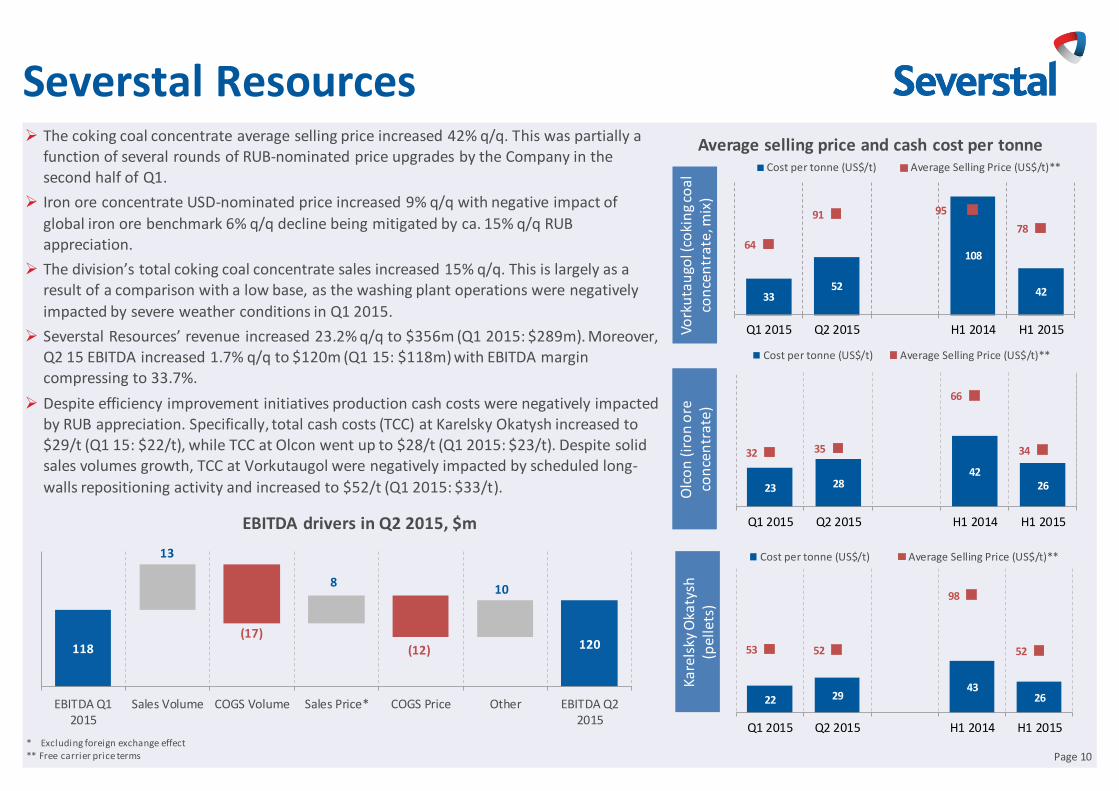
Severstal Resources The coking coal concentrate average selling price increased 42% q/q. This was partially a
function of several rounds of RUB-nominated price upgrades by the Company in the second half of Q1.
Iron ore concentrate USD-nominated price increased 9% q/q with negative impact of
global iron ore benchmark 6% q/q decline being mitigated by ca. 15% q/q RUB appreciation.
The division’s total coking coal concentrate sales increased 15% q/q. This is largely as a result of a comparison with a low base, as the washing plant operations were negatively
impacted by severe weather conditions in Q1 2015.
Severstal Resources’ revenue increased 23.2% q/q to $356m (Q1 2015: $289m). Moreover, Q2 15 EBITDA increased 1.7% q/q to $120m (Q1 15: $118m) with EBITDA margin compressing to 33.7%.
Despite efficiency improvement initiatives production cash costs were negatively impacted by RUB appreciation. Specifically, total cash costs (TCC) at Karelsky Okatysh increased to $29/t (Q1 15: $22/t), while TCC at Olcon went up to $28/t (Q1 2015: $23/t). Despite solid sales volumes growth, TCC at Vorkutaugol were negatively impacted by scheduled long-
walls repositioning activity and increased to $52/t (Q1 2015: $33/t).
Page 10
Average selling price and cash cost per tonne
Vork
uta
ugo
l (co
kin
g co
al
con
cen
trat
e, m
ix)
Ka
rels
ky O
katy
sh
(pel
lets
)
* Excluding foreign exchange effect ** Free carrier price terms
EBITDA drivers in Q2 2015, $m
Olc
on
(ir
on
ore
co
nce
ntr
ate)
118 120
13
(17)
8
(12)
10
EBITDA Q12015
Sales Volume COGS Volume Sales Price* COGS Price Other EBITDA Q22015
33 52
108
42
64
91 95
78
Q1 2015 Q2 2015 H1 2014 H1 2015
Cost per tonne (US$/t) Average Selling Price (US$/t)**
22 29 43
26
53 52
98
52
Q1 2015 Q2 2015 H1 2014 H1 2015
Cost per tonne (US$/t) Average Selling Price (US$/t)**
23 28 42
26
32 35
66
34
Q1 2015 Q2 2015 H1 2014 H1 2015
Cost per tonne (US$/t) Average Selling Price (US$/t)**
Financial Position
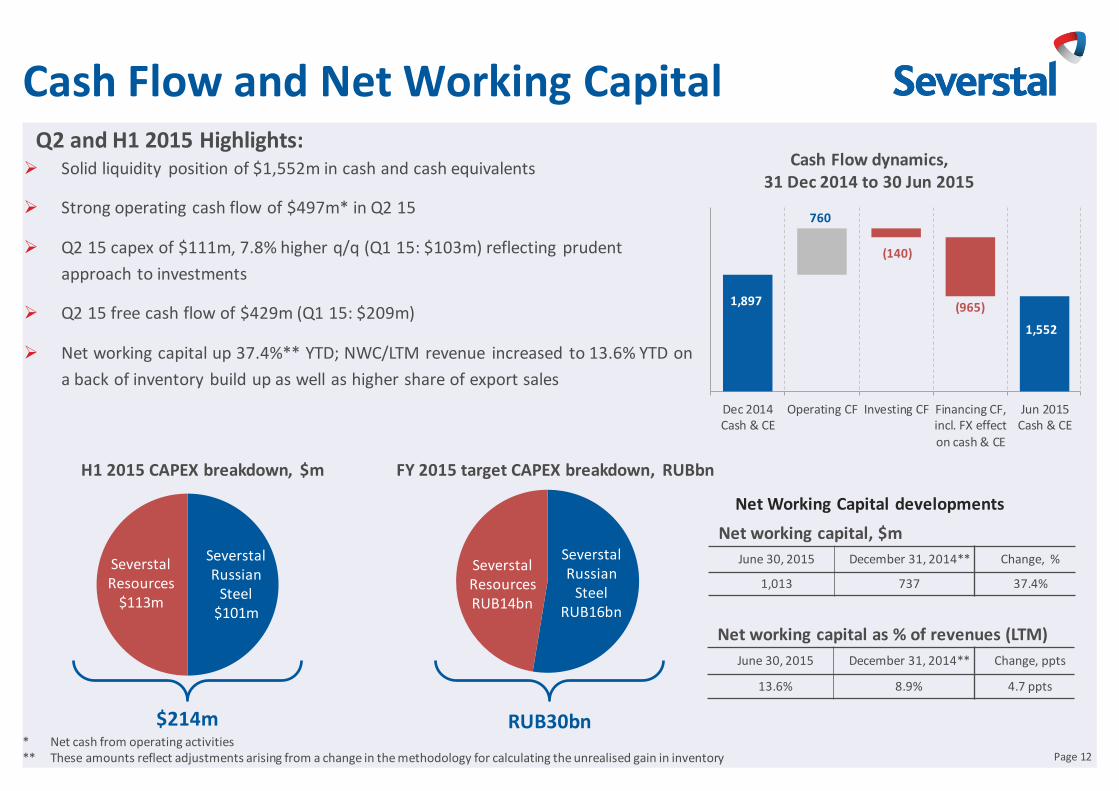
Cash Flow and Net Working Capital
Solid liquidity position of $1,552m in cash and cash equivalents
Strong operating cash flow of $497m* in Q2 15
Q2 15 capex of $111m, 7.8% higher q/q (Q1 15: $103m) reflecting prudent
approach to investments
Q2 15 free cash flow of $429m (Q1 15: $209m)
Net working capital up 37.4%** YTD; NWC/LTM revenue increased to 13.6% YTD on
a back of inventory build up as well as higher share of export sales
Net working capital, $m
June 30, 2015 December 31, 2014** Change, %
1,013 737 37.4%
Page 12
Net working capital as % of revenues (LTM)
June 30, 2015 December 31, 2014** Change, ppts
13.6% 8.9% 4.7 ppts
Net Working Capital developments
Q2 and H1 2015 Highlights:
H1 2015 CAPEX breakdown, $m FY 2015 target CAPEX breakdown, RUBbn
$214m RUB30bn
Cash Flow dynamics, 31 Dec 2014 to 30 Jun 2015
Severstal Russian
Steel $101m
Severstal Resources
$113m
Severstal Russian
Steel RUB16bn
Severstal Resources RUB14bn
* Net cash from operating activities ** These amounts reflect adjustments arising from a change in the methodology for calculating the unrealised gain in inventory
1,897
1,552
760
(140)
(965)
Dec 2014Cash & CE
Operating CF Investing CF Financing CF,incl. FX effecton cash & CE
Jun 2015Cash & CE
1,552 456
1 4 1
684
Liquidity 3Q 2015 4Q 2015 1Q 2016 2Q 2016
Cash Short-term Debt to be Repaid Unused Committed Credit Lines
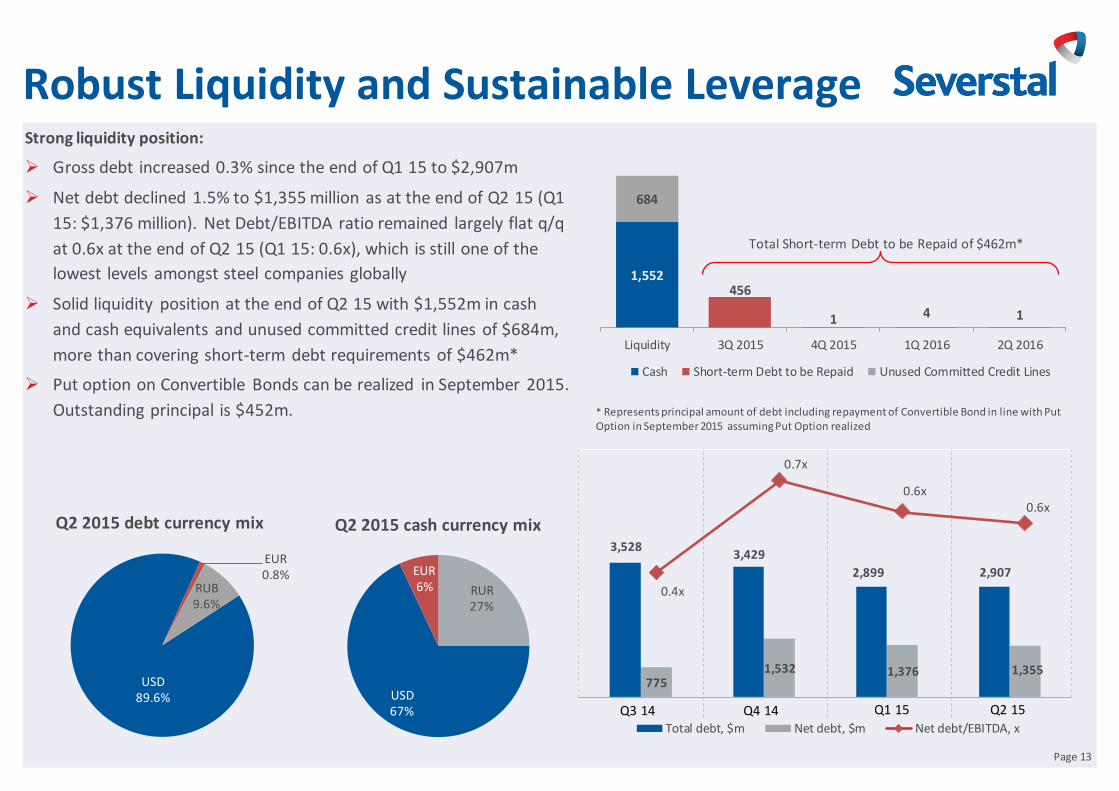
Robust Liquidity and Sustainable Leverage Strong liquidity position:
Gross debt increased 0.3% since the end of Q1 15 to $2,907m
Net debt declined 1.5% to $1,355 million as at the end of Q2 15 (Q1
15: $1,376 million). Net Debt/EBITDA ratio remained largely flat q/q
at 0.6x at the end of Q2 15 (Q1 15: 0.6x), which is still one of the
lowest levels amongst steel companies globally
Solid liquidity position at the end of Q2 15 with $1,552m in cash
and cash equivalents and unused committed credit lines of $684m,
more than covering short-term debt requirements of $462m*
Put option on Convertible Bonds can be realized in September 2015.
Outstanding principal is $452m.
* Represents principal amount of debt including repayment of Convertible Bond in line with Put Option in September 2015 assuming Put Option realized
Page 13
Total Short-term Debt to be Repaid of $462m*
Q2 2015 debt currency mix Q2 2015 cash currency mix
USD 89.6%
EUR 0.8%
RUB 9.6%
RUR 27%
USD 67%
EUR 6%
3,528
775
3,429
1,532
2,899
1,376
2,907
1,355
0.4x
0.7x
0.6x 0.6x
Total debt, $m Net debt, $m Net debt/EBITDA, x
Q3 14 Q4 14 Q1 15 Q2 15
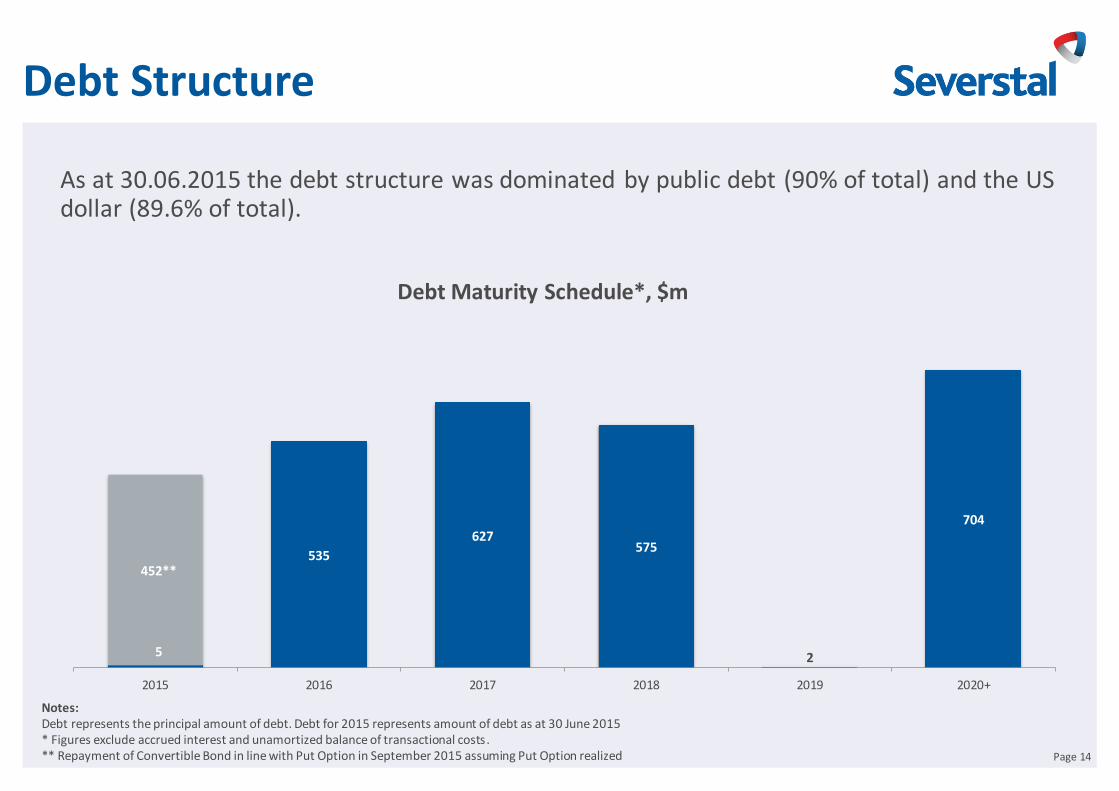
Debt Structure
As at 30.06.2015 the debt structure was dominated by public debt (90% of total) and the US dollar (89.6% of total).
Page 14
Debt Maturity Schedule*, $m
Notes: Debt represents the principal amount of debt. Debt for 2015 represents amount of debt as at 30 June 2015 * Figures exclude accrued interest and unamortized balance of transactional costs. ** Repayment of Convertible Bond in line with Put Option in September 2015 assuming Put Option realized
5
535
627 575
2
704
452**
2015 2016 2017 2018 2019 2020+
Market Outlook Global: Global steel capacity utilisation stays at subdued levels of 72% comparing vs. 78% a year
ago.
Weakening of Chinese economy with steel demand falling 5.1% YTD and subsequent
growth of steel products export from China puts pressure on steel and steel-related
commodity prices.
The spread between steel and raw material prices has been eroded to the minimal levels.
Russia:
Though visibility of the steel demand remains low, Russian production costs remain highly
competitive.
In this environment despite the risks, we believe Severstal stays in good shape and well-
positioned for the future.
Source: Worldsteel, Severstal estimates
Page 15
Appendices
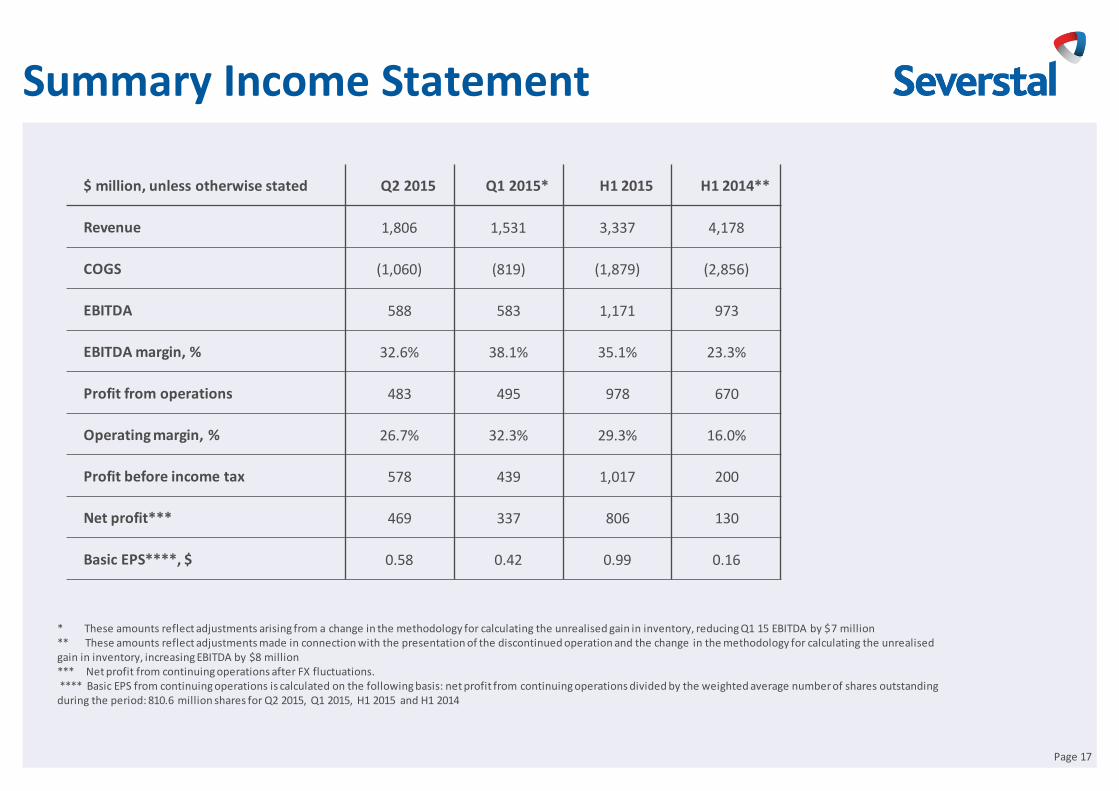
Summary Income Statement
$ million, unless otherwise stated Q2 2015 Q1 2015* H1 2015 H1 2014**
Revenue 1,806 1,531 3,337 4,178
COGS (1,060) (819) (1,879) (2,856)
EBITDA 588 583 1,171 973
EBITDA margin, % 32.6% 38.1% 35.1% 23.3%
Profit from operations 483 495 978 670
Operating margin, % 26.7% 32.3% 29.3% 16.0%
Profit before income tax 578 439 1,017 200
Net profit*** 469 337 806 130
Basic EPS****, $ 0.58 0.42 0.99 0.16
Page 17
* These amounts reflect adjustments arising from a change in the methodology for calculating the unrealised gain in inventory, reducing Q1 15 EBITDA by $7 million ** These amounts reflect adjustments made in connection with the presentation of the discontinued operation and the change in the methodology for calculating the unrealised gain in inventory, increasing EBITDA by $8 million *** Net profit from continuing operations after FX fluctuations. **** Basic EPS from continuing operations is calculated on the following basis: net profit from continuing operations divided by the weighted average number of shares outstanding during the period: 810.6 million shares for Q2 2015, Q1 2015, H1 2015 and H1 2014
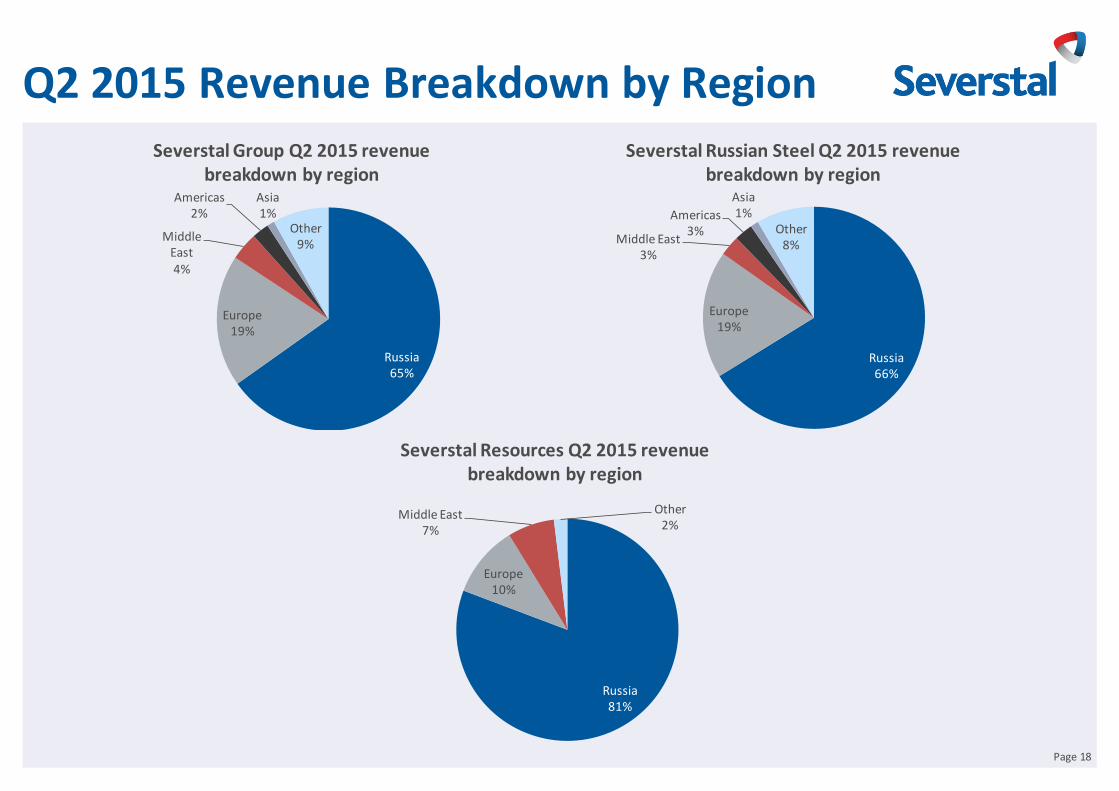
Q2 2015 Revenue Breakdown by Region
Page 18
Severstal Resources Q2 2015 revenue breakdown by region
Severstal Russian Steel Q2 2015 revenue breakdown by region
Severstal Group Q2 2015 revenue breakdown by region
Russia 65%
Europe 19%
Middle East 4%
Americas 2%
Asia 1%
Other 9%
Russia 66%
Europe 19%
Middle East 3%
Americas 3%
Asia 1%
Other 8%
Russia 81%
Europe 10%
Middle East 7%
Other 2%
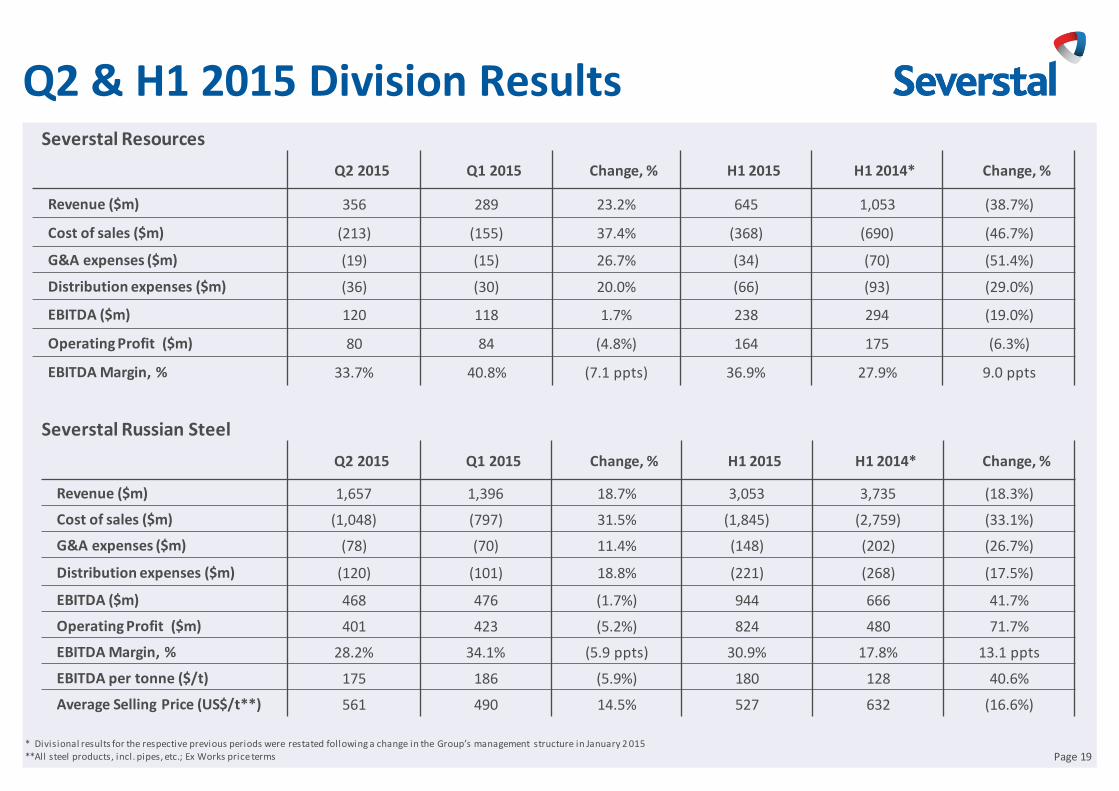
Q2 & H1 2015 Division Results
Q2 2015 Q1 2015 Change, % H1 2015 H1 2014* Change, %
Revenue ($m) 1,657 1,396 18.7% 3,053 3,735 (18.3%)
Cost of sales ($m) (1,048) (797) 31.5% (1,845) (2,759) (33.1%)
G&A expenses ($m) (78) (70) 11.4% (148) (202) (26.7%)
Distribution expenses ($m) (120) (101) 18.8% (221) (268) (17.5%)
EBITDA ($m) 468 476 (1.7%) 944 666 41.7%
Operating Profit ($m) 401 423 (5.2%) 824 480 71.7%
EBITDA Margin, % 28.2% 34.1% (5.9 ppts) 30.9% 17.8% 13.1 ppts
EBITDA per tonne ($/t) 175 186 (5.9%) 180 128 40.6%
Average Selling Price (US$/t**) 561 490 14.5% 527 632 (16.6%)
Severstal Russian Steel
Severstal Resources
* Divisional results for the respective previous periods were restated following a change in the Group’s management structure in January 2 015 **All steel products, incl. pipes, etc.; Ex Works price terms Page 19
Q2 2015 Q1 2015 Change, % H1 2015 H1 2014* Change, %
Revenue ($m) 356 289 23.2% 645 1,053 (38.7%)
Cost of sales ($m) (213) (155) 37.4% (368) (690) (46.7%)
G&A expenses ($m) (19) (15) 26.7% (34) (70) (51.4%)
Distribution expenses ($m) (36) (30) 20.0% (66) (93) (29.0%)
EBITDA ($m) 120 118 1.7% 238 294 (19.0%)
Operating Profit ($m) 80 84 (4.8%) 164 175 (6.3%)
EBITDA Margin, % 33.7% 40.8% (7.1 ppts) 36.9% 27.9% 9.0 ppts
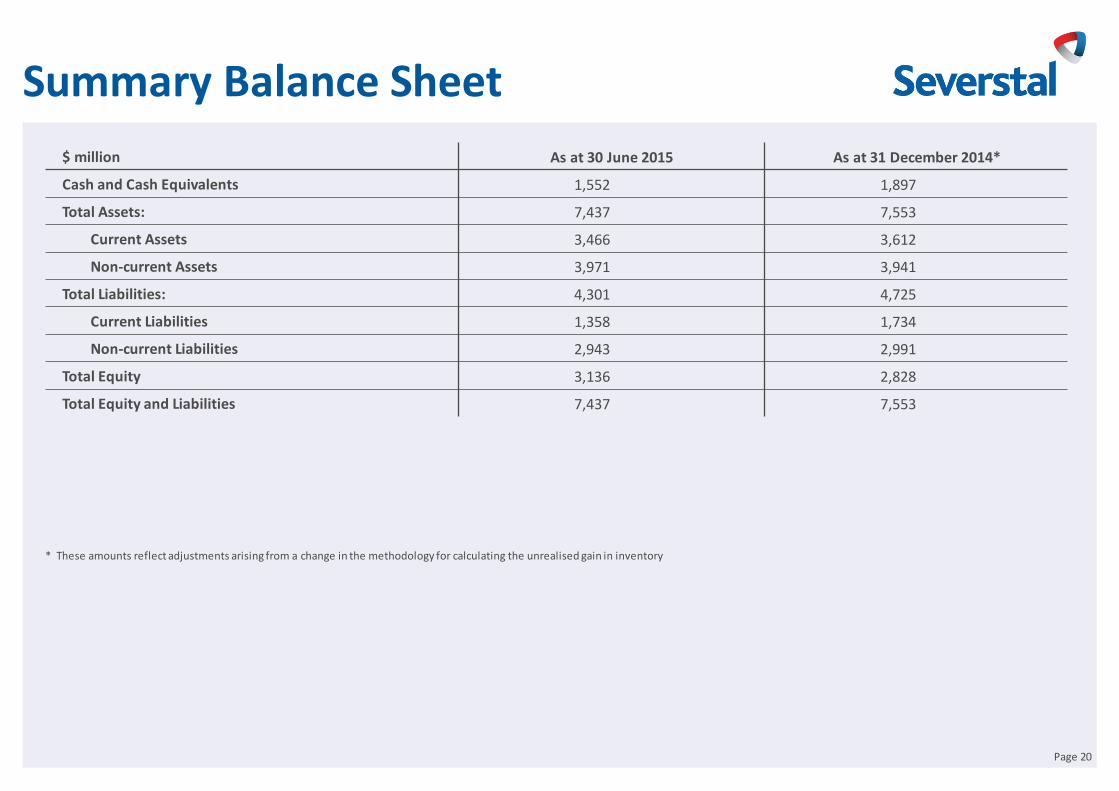
Summary Balance Sheet
$ million As at 30 June 2015 As at 31 December 2014*
Cash and Cash Equivalents 1,552 1,897
Total Assets: 7,437 7,553
Current Assets 3,466 3,612
Non-current Assets 3,971 3,941
Total Liabilities: 4,301 4,725
Current Liabilities 1,358 1,734
Non-current Liabilities 2,943 2,991
Total Equity 3,136 2,828
Total Equity and Liabilities 7,437 7,553
Page 20
* These amounts reflect adjustments arising from a change in the methodology for calculating the unrealised gain in inventory
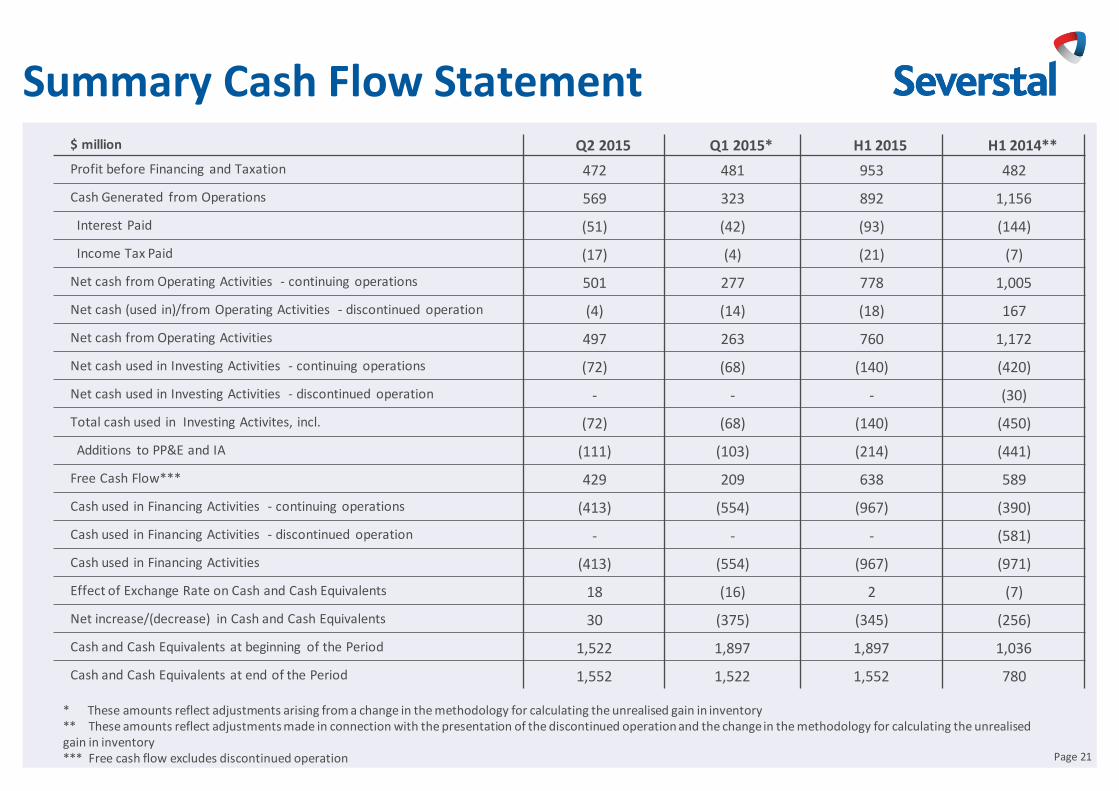
Summary Cash Flow Statement $ million Q2 2015 Q1 2015* H1 2015 H1 2014**
Profit before Financing and Taxation 472 481 953 482
Cash Generated from Operations 569 323 892 1,156
Interest Paid (51) (42) (93) (144)
Income Tax Paid (17) (4) (21) (7)
Net cash from Operating Activities - continuing operations 501 277 778 1,005
Net cash (used in)/from Operating Activities - discontinued operation (4) (14) (18) 167
Net cash from Operating Activities 497 263 760 1,172
Net cash used in Investing Activities - continuing operations (72) (68) (140) (420)
Net cash used in Investing Activities - discontinued operation - - - (30)
Total cash used in Investing Activites, incl. (72) (68) (140) (450)
Additions to PP&E and IA (111) (103) (214) (441)
Free Cash Flow*** 429 209 638 589
Cash used in Financing Activities - continuing operations (413) (554) (967) (390)
Cash used in Financing Activities - discontinued operation - - - (581)
Cash used in Financing Activities (413) (554) (967) (971)
Effect of Exchange Rate on Cash and Cash Equivalents 18 (16) 2 (7)
Net increase/(decrease) in Cash and Cash Equivalents 30 (375) (345) (256)
Cash and Cash Equivalents at beginning of the Period 1,522 1,897 1,897 1,036
Cash and Cash Equivalents at end of the Period 1,552 1,522 1,552 780
Page 21
* These amounts reflect adjustments arising from a change in the methodology for calculating the unrealised gain in inventory ** These amounts reflect adjustments made in connection with the presentation of the discontinued operation and the change in the methodology for calculating the unrealised gain in inventory *** Free cash flow excludes discontinued operation
Disclaimer
These materials are confidential and have been prepared by PAO Severstal (Severstal) solely for your
information and may not be reproduced, retransmitted or further distributed to any other person or
published, in whole or in part, for any other purpose.
These materials may contain projections and other forward-looking statements regarding future
events or the future financial performance of Severstal. You can identify forward-looking statements
by terms such as “expect,” “believe,” “estimate,” “intend,” “will,” “could,” “may” or “might”, or other
similar expressions. Severstal cautions you that these statements are only predictions and that actual
events or results may differ materially. Severstal will not update these statements to reflect events
and circumstances occurring after the date hereof. Factors that could cause the actual results to differ
materially from those contained in projections or forward-looking statements of Severstal may
include, among others, general economic and competitive environment conditions in the markets in
which Severstal operates, market change in the steel and mining industries, as well as many other risks
affecting Severstal and its operations.
These materials do not constitute or form part of any advertisement of securities, any offer or
invitation to sell or issue or any solicitation of any offer to purchase or subscribe for, any securities of
Severstal in any jurisdiction, nor shall they or any part of them nor the fact of their presentation,
communication or distribution form the basis of, or be relied on in connection with, any contract or
investment decision.
No representation or warranty, express or implied, is given by Severstal, its affiliates or any of their
respective advisers, officers, employees or agents, as to the accuracy of the information or opinions or
for any loss howsoever arising, directly or indirectly, from any use of these materials or their contents.
Page 22


![· 2014-08-25 · p-x2 q-x2 = P2 q2 ∴q2 p-x2 =P2 q-x2 ∴pq2-x2q2=p2q-p2x2∴x2 p2-q2 =pqp-q [QUESCODE:42846] [ 0/1 Mark] Q.3 An alloy is to contain copper and zinc in the ratio](https://static.fdocuments.us/doc/165x107/5e7e0a2bc812e833651e5668/2014-08-25-p-x2-q-x2-p2-q2-aq2-p-x2-p2-q-x2-apq2-x2q2p2q-p2x2ax2-p2-q2.jpg)