
Q2 2021 An independent report by BVA BDRC, August 2021
136
Q2 2021 An independent report by BVA BDRC, August 2021
Transcript of Q2 2021 An independent report by BVA BDRC, August 2021

Q2 2021
An independent report by BVA BDRC, August 2021
Over 170,000 SME interviews have been
conducted since the survey started in Q2 2011,
across 40 waves of interviewing. Major changes
were made to the questionnaire for Q1 2018.
The report and supporting data is made available
to all interested parties as a basis for decision
making and strategy setting. It is used by
Government, the Bank of England, the banks, trade
bodies and academics.
The SME Finance Monitor Q2 2021
2
This survey was commissioned to provide a robust and respected independent source of information on the demand
for, and availability of, finance for SMEs in the UK.
Find out more at www.sme-finance-monitor.co.uk
The core study covers:
•Borrowing events in the past 12 months
•The appetite for new/renewed facilities
•The outcome of applications made
•Reasons for not borrowing
•Future plans, including demand for future finance
•Awareness of support and finance initiatives

3
A brief timeline to remind us of what has happened in the first half of 2021 – from national lockdowns to “Freedom Day” (nearly)
April Non-essential retail re-
opens, including
hairdressers. 10% of adults
now double vaccinated
May More indoor and
outdoor gatherings allowed,
restaurants re-open, travel
“traffic light” system set up
June “Freedom Day”
delayed, Delta strain now
dominant, 62% of adults
double vaccinated
Jan England enters 3rd
national lockdown. 17% of
adults had their first vaccine
jab by month end
Feb Hotel quarantine for red
list countries, Government
announces roadmap for
lifting lockdown
March Schools re-open,
outdoor gatherings allowed
for 6 people/2 h/holds. CBIL
& BBL applications close
Oct 3 tier system and new
JSS scheme announced.
National lockdown
announced for Nov 5th
Nov National lockdown,
furlough/ BBL/ CBILs
extended again, vaccine
success announced
Dec Kent variant discovered
and Tier 4 created, Christmas
plans revised/cancelled.
Transition period ended
Q420
Q121
Q221

Q2 2020 was a real shock to the SME system. Broadly speaking, sentiment in Q3 was a bit better, with little change in
Q4, and Hospitality and Transport consistently the most likely to report issues.
This pack updates the story with data to Q2 2021 and is designed primarily to explore:
• Data from the Covid related questions run from Q2 2020
• How SMEs have responded so far to Covid 19 and it’s impact on their business, comparing annual results over time to
those for 2020 and the first half of 2021.
• Additional analysis to build understanding of how different parts of the economy have been impacted with analysis by
sector and region
• A focus on repayment of debt and concerns around this, from the new questions added this year
The presentation today will introduce you to some key themes from the SME Finance Monitor.
Much more detail can be found in the full chart pack which will be circulated after this session.
Are we in the recovery phase yet?
4

Setting the scene: How SMEs are currently feeling
5

42% 41%
32%
24%
60%
52%54%
56%
32%
69%
Plan to grow Good business mood Income stable or increased Future offers oportunities Happy that have enough
funding
Q4 20 Q2 21
Across a range of five key metrics, SME sentiment improved between Q4 2020 and Q2 2021
6
Sentiment summary: Q4 2020 to Q2 2021
All SMEs: Total score of plan to grow/ good business mood/ Income to be stable or increased/ future offers opportunities / not worried about
having enough funding for next months
The combined percentage score has increased from 196 to 258 between Q4
2020 and Q2 2021, an increase of +32%.

192% 205%234% 224%
251%273%
311%281%
0 1-9 10-49 50-249
Q4 20 Q2 21
On a combined basis, larger SMEs with 10-49 employees remained were more likely to see a positive future impact.
7
Positive future impact summary score
All SMEs: Total score of plan to grow/ good business mood/ Income to be stable or increased/ future offers opportunities / not worried about
having enough funding for next months
Q420
Q221

218%200% 195%
236%
126% 132%
222% 211%186%
288%258% 266%
244%226% 214%
277% 283%251%
Agr Mfg Constr Wle/Ret Hot/Rest Trans Prop/BSv Health Other Com
Q4 20 Q2 21
By sector: Those in the Hospitality and Transport sectors remained less likely than their peers to be feeling positive, but have closed some of the gap as their scores increased. With little change in sentiment, those in Wholesale/Retail have moved from above to below average
8
Positive future impact summary score
All SMEs: Total score of plan to grow/ good business mood/ Income to be stable or increased/ future offers opportunities / not worried about
having enough funding for next months
Q420
Q221

225%202%
239%
191%213% 199%
219%191% 183%
281% 268%286%
254% 268% 275% 261% 259% 245%
Export only Import only Fully intl Domestic only Starts 2-5 yrs 6-9 yrs 10-15 yrs 15yrs+
Q4 20 Q2 21
The mood of fully international SMEs has not improved as fast as their peers, but they remained above average. Those trading for 6-9 yrs also reported a smaller improvement
9
Positive future impact summary score
All SMEs: Total score of plan to grow/ good business mood/ Income to be stable or increased/ future offers opportunities / not worried about
having enough funding for next months
Q420
Q221

61% 59%67%
58% 60%
16% 17% 16%9% 9%
All 0 1-9 10-49 50-249
Borrowing more Concerned repay
As mood and conditions improve, use of finance was also higher: In Q2 2021, 61% of finance users said they were using more finance now than pre-pandemic (with 36% borrowing for the first time). A minority of finance users were concerned about their general ability to repay funds
10
Concerns about using finance: All those using external finance Q2 2021
All SMEs using external finance Q2 2021
45%Use finance: 41% 57% 65% 35%

Today’s presentation
11
The trading context
External funding: attitudes to and use of, alongside alternatives
Demand for finance: need, applications and impact of Covid
The future: growth, barriers and future appetite for finance
The immediate impact of Covid 19

Today’s presentation
12
The trading context
External funding: attitudes to and use of, alongside alternatives
Demand for finance: need, applications and impact of Covid
The future: growth, barriers and future appetite for finance
The immediate impact of Covid 19

There has been an improvement in the ‘mood’ of businesses, with half now in a good mood, up from a quarter in Q2 2020 and increasing by size of SME
13
Mood about the business from Q2 2020
CV1 Base : All SMEs Q2 2021 4252 865/1403/1318/664
49%
32% 33% 34%23%
27%
27% 26% 26%
23%
17%
27% 27% 27%
32%
8%13% 14% 12%
22%
Q2 20 Q3 20 Q4 20 Q1 21 Q2 21
24%26%
34%
42%38%
47%
52%
58%
39%41%
55%57%
37%
43%
56%
62%
51%
59%
75%
70%
0 emps 1-9 emps 10-49 emps 50-249 emps
Q2 20 Q3 20 Q4 20 Q1 21 Q2 21
Mood 7-10
Mood 7-8
Mood 5-6
Mood 0-4
Mood 9-10
Mood 7-10 25% 40% 41% 39% 54%

37%
27%
19%
27%
12%16%
33%
28%
19%
57%
46%43%
45%
16%
23%
50%
37%33%
69%
58%61%
52%
46%
38%
54%56% 56%
Agric Mfg Constr Whle/Retail Hotel/Rest Trans Prop/Bus Serv Health Other Comm
Q2 20 Q4 20 Q2 21
Those in Agriculture remained more likely to be in a good mood. Amongst those struggling, Hospitality saw more of an improvement in mood than Transport
14
Sector summary: Mood 7-10
CV1 Base : All SMEs Q2 2021 259/404/733/474/310/443/878/299/450
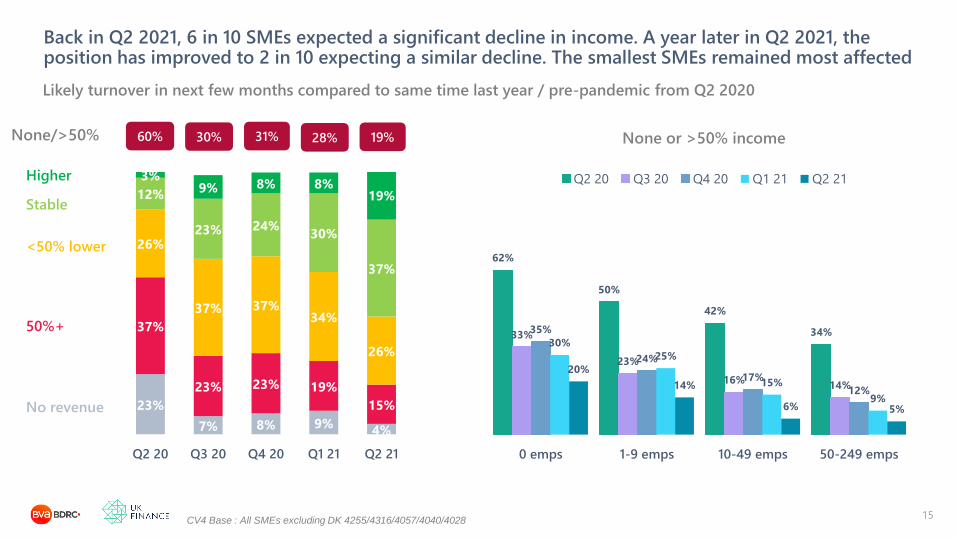
Back in Q2 2021, 6 in 10 SMEs expected a significant decline in income. A year later in Q2 2021, the position has improved to 2 in 10 expecting a similar decline. The smallest SMEs remained most affected
15
Likely turnover in next few months compared to same time last year / pre-pandemic from Q2 2020
CV4 Base : All SMEs excluding DK 4255/4316/4057/4040/4028
23%
7% 8% 9%4%
37%
23% 23% 19%
15%
26%
37% 37%34%
26%
12%
23% 24%30%
37%
3%9% 8% 8%
19%
Q2 20 Q3 20 Q4 20 Q1 21 Q2 21
No revenue
<50% lower
50%+
Higher
Stable
None/>50% 60% 30% 31%
62%
50%
42%
34%33%
23%
16%14%
35%
24%
17%
12%
30%
25%
15%
9%
20%
14%
6% 5%
0 emps 1-9 emps 10-49 emps 50-249 emps
Q2 20 Q3 20 Q4 20 Q1 21 Q2 21
None or >50% income28% 19%
42%
62%65%
43%
78%
65%
54%
63%65%
18%
32%
24%
29%
57%54%
21%
30%
44%
5%
14% 15%13%
23%25%
19%17%
23%
Agric Mfg Constr Whle/Retail Hotel/Rest Trans Prop/Bus Serv Health Other Comm
Q2 20 Q4 20 Q2 21
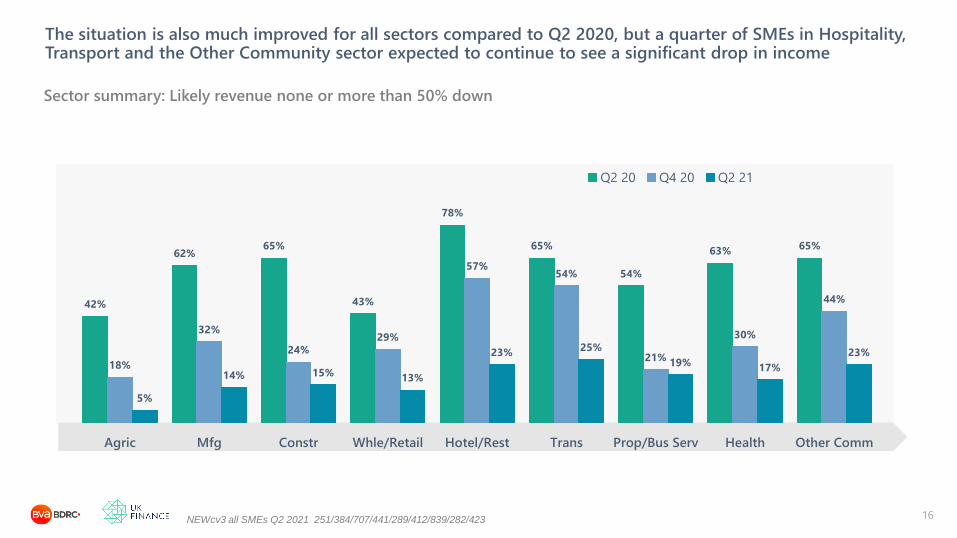
The situation is also much improved for all sectors compared to Q2 2020, but a quarter of SMEs in Hospitality, Transport and the Other Community sector expected to continue to see a significant drop in income
16
Sector summary: Likely revenue none or more than 50% down
NEWcv3 all SMEs Q2 2021 251/384/707/441/289/412/839/282/423

There has been a steady increase in the proportion expecting the future to offer opportunities rather than threats, both overall and across all size bands
17
Does the future offer opportunities or threats – from Q3 2020
CV7 Base : All SMEs Q2 2021 4252 865/1403/1318/664
32%25% 21% 17%
49%
50%49%
50%
11%14%
17%18%
8% 10% 14% 14%
Q3 20 Q4 20 Q1 21 Q2 21
19% 19% 17% 17%24% 25% 26% 23%
30% 31% 34%26%
32% 33% 33%26%
0 emps 1-9 emps 10-49 emps 50-249 emps
Q3 20 Q4 20 Q1 21 Q2 21
Offers opportunities 7+Offers opp. 7+ 19% 24%
7-8
5-6
Only offers threats 1-4
Offers opportunities 9-10
31% 32%
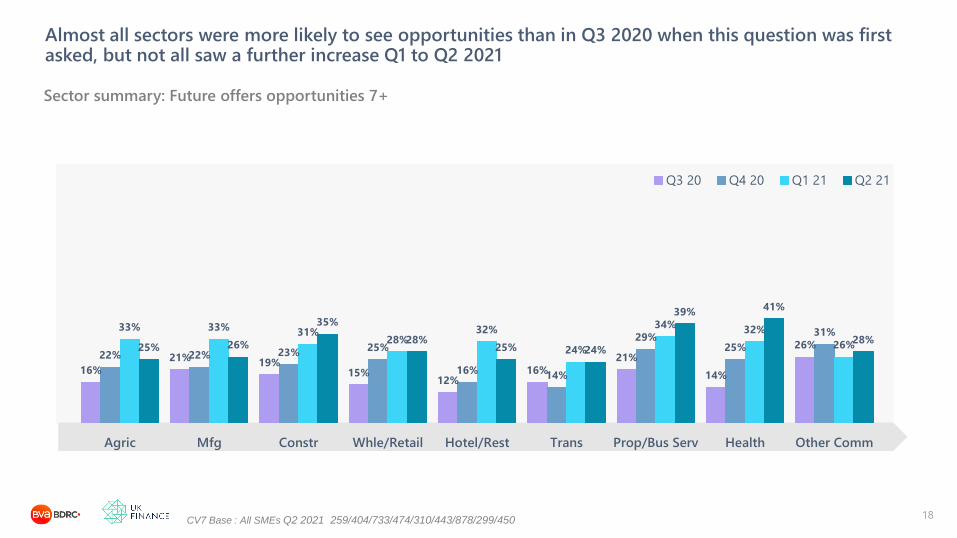
SMEs that have seen a steady
increase in future opportunities
include those in Health (now 41%),
Property/Business Services (39%)
and Construction (now 35%)
16%
21%19%
15%12%
16%
21%
14%
26%22% 22% 23%
25%
16%14%
29%25%
31%33% 33%
31%28%
32%
24%
34%32%
26%25% 26%
35%
28%25% 24%
39%41%
28%
Agric Mfg Constr Whle/Retail Hotel/Rest Trans Prop/Bus Serv Health Other Comm
Q3 20 Q4 20 Q1 21 Q2 21
Almost all sectors were more likely to see opportunities than in Q3 2020 when this question was first asked, but not all saw a further increase Q1 to Q2 2021
18
Sector summary: Future offers opportunities 7+
CV7 Base : All SMEs Q2 2021 259/404/733/474/310/443/878/299/450

61%
5%
59%
16%
12%
58%
14%
6%
Staff on furlough
Made staff redundant
May have to make staff
redundant (New Q3)
Q2 20 Q4 20 Q2 21
Compared to Q4 2020, fewer employers thought they would be making redundancies in the future. Those with 50-249 employees remained the most likely to be contemplating redundancies
19
How business has been impacted – All employers from Q2 2020
QCv3a – all employers Q2 2021 3385
All sectors reported an improving picture compared to Q4 2020, but a quarter of SMEs in Hospitality,
Transport and the Other Community sector either have or may have to, make redundancies
Larger SMEs were more likely to
have staff on furlough – 53% of
those with 1-9 emps compared
to 80% with 10-49 emps and
82% with 50-249 emps.
Larger SMEs were also more likely to have made, or be
contemplating, redundancies (36%) and this was unchanged
from Q3 2020.
Overall, 17% of employers either had or were contemplating
making redundancies, back in line with Q3 2020.

18%15%
29%
35%
23%20%
37%41%
22%18%
35% 35%
17%15%
26%
36%
All 1-9 emps 10-49 emps 50-249 emps
Q3 20 Q4 20 Q1 21 Q2 21
The proportion of employers that had made, or might have to make, redundancies, was back in line with Q3 2020. It remained most common amongst the larger employers
20
Made or may make employees redundant from Q3 2020
Cv3a all SMEs Q2 2021 3385 1403/1318/664
All sectors reported an improving picture compared to Q4 2020, but a quarter of SMEs
in Hospitality, Transport and the Other Community sector either have or may have to,
make redundancies

9%
18%16% 16%
26%24%
17%13%
19%
10%
26%
19%
24%
35%
30%
21%
10%
28%
10%
25%
18%20%
27%
22% 22%18%
27%
7%
20%
13%
19%
25%23%
14%
8%
25%
Agric Mfg Constr Whle/Retail Hotel/Rest Trans Prop/Bus Serv Health Other Comm
Q3 20 Q4 20
All sectors reported an improving picture compared to Q4 2020, but a quarter of SMEs in Hospitality, Transport and the Other Community sector either had or may have to, make redundancies
21
Made or may make employees redundant from Q3 2020
Cv3a all SMEs Q2 2021 3385

68% 67% 62%54%52% 52% 45% 38%
46% 43%30% 23%
0 emps 1-9 emps 10-49 emps 50-249 emps
Q2 20 Q4 20 Q2 21
“Impact of the pandemic” remained the top barrier in Q2 2021, declining somewhat by size of SME
22
Main barriers (8-10) to running business in next 12 months –Q2 2021:
Q93 Barriers to running business as would want in next 12 months
Base : All SMEs Q2 2021 4250 865/1403/1318/664
45%
21%
21%
18%
10%
10%
9%
8%
6%
Impact of pandemic
The current economic climate
Legislation,regulation, red tape
Political uncertainty/future govt policy
Cash flow / late payment
Recruiting and retaining staff
Changes in value of sterling
Access to external finance
Availablity of relevant advice
In Q2 when this question was first asked,
68% of SMEs cited the pandemic as a main
barrier. The decline over time to 45% in Q2
2021 was seen across all size bands, with the
largest SMEs less likely to see it as a barrier
In Q2, concern remained highest amongst
those in Hospitality and Transport, where 6
in 10 were concerned compared to a quarter
of those in Agriculture

There has been an improvement over time, but SMEs in the Hospitality and Transport sectors continued to report the highest levels of concern, notably compared to those in Agriculture
23
6 in 10 SMEs in the Hospitality and Transport sectors rate the effect of the pandemic as
a major barrier to their business, with relatively little change over time, compared to 23%
in Agriculture. Levels of concern in Wholesale/retail; and Business Services appears to
have plateaued in recent quarters
Sector summary: % “Impact of pandemic” 8-10 barrier over time
Q93 Base : All SMEs Q2 2021 259/404/733/474/310/443/878/299/450
57%
68%
74%
64%
87%
70%
60%
68%71%
35%
45%42%
45%
72% 70%
46%
54%
64%
23%
39%35%
42%
60%64%
44% 43% 45%
Agric Mfg Constr Whle/Retail Hotel/Rest Trans Prop/Bus Serv Health Other Comm
Q2 20 Q4 20 Q2 21

The immediate impact of Covid 19- Key findings
24
Whilst the impact of the pandemic remained the key barrier to running the business, it was mentioned by 45%
of SMEs compared to 68% in Q2 2020. Around 1 in 5 thought their turnover would be reduced by 50% or
more for the coming months, but again this was a further improvement on the 6 in 10 expecting such a
reduction in Q2 of 2020. Overall, 17% of employers either had or were contemplating making redundancies,
back in line with Q3 2020 and lower than the 23% planning such action in Q4 2020.
Over half of SMEs were in a positive mood about their business, twice the level seen in Q2 of 2020. 1 in 3 felt the
future offered more opportunities than threats, up from 1 in 5 in Q3 2020
Q2 2020 was a shock to the SME system. Sentiment in Q3 was somewhat better, with little change in Q4.
Moving into 2021, sentiment and expectations have improved and whilst those in Hospitality and Transport
remained the worst affected on many metrics, their position has improved

Today’s presentation
25
The trading context
External funding: attitudes to and use of, alongside alternatives
Demand for finance: need, applications and impact of Covid
The future: growth, barriers and future appetite for finance
The immediate impact of Covid 19

37% 40% 42% 39% 40% 42% 39% 37% 34% 34% 25% 16% 13% 15%
2012 2013 2014 2015 2016 2017 2018 2019 Q1 20 Q2 20 Q3 20 Q4 20 Q1 21 Q2 21
After declining in the second half of 2020, the proportion reporting growth stabilised at around 1 in 6, with little to choose between size bands and all at lower levels than seen pre-pandemic
26
Annual time series: % reporting growth in previous 12 months
Q81 all SMEs excl Starts and DK Q2 2021 3910 724/1246/1286/654
18%
22%
18%
14%
50-249 emps
10-49 emps
1-9 emps
0 emps
All SMEs
54%
48%
42%
35%
In Q2 2021,very few in the Hospitality sector have reported any growth (5%), with a continued decline for
those in Wholesale/Retail (now 15%) and a more stable position since Q4 2020 elsewhere. A fifth of those in
Agriculture and Property/Business Services reported growth

37%35% 34%
41% 40%
35%37%
47%
36%
23%
39%
26%
44%
34% 35% 34%
41%
36%33%
13% 12%
21%
3%
10%
21%18%
16%
21%
13% 14% 15%
5%8%
20%
15%19%
Agric Mfg Constr Whle/Retail Hotel/Rest Trans Prop/Bus Serv Health Other Comm
2019 Q2 20 Q4 20 Q2 21
Very few in the Hospitality sector reported any growth, with a continued decline for those in Wholesale/Retail and a more stable position since Q4 2020 elsewhere
27
Sector summary: Grown – over time
cv3 all SMEs excl Starts and DK Q2 2021 252/374/675/424/274/424/808/265/414

After the sharp increase to Q4 2020 in SMEs reporting a decline in growth, the picture into 2021 was stable, but at the higher levels seen in Q4 2020
28
Annual time series: Performance in previous 12 months
Q81 all SMEs excl Starts and DK Q2 2021 3910
Grown
Stayed same
Declined
As the effect of the pandemic continues to be felt, more SMEs are reporting an impact on their growth in
the previous 12 months. 15% had grown, in line with the lowest levels seen since Q4 2020 on the Monitor
and over half, 60%, had declined, one of the highest levels seen to date
21% 19% 14% 12% 10% 11%17% 19% 21% 22%
46%
61% 64% 60%
42% 41%44% 51% 50% 47%
44% 44% 45% 44%
29%
23%23%
25%
37% 40% 42%39% 40% 42% 39% 37% 34% 34%
25%16% 13% 15%
2012 2013 2014 2015 2016 2017 2018 2019 Q1 20 Q2 20 Q3 20 Q4 20 Q1 21 Q2 21

The proportion reporting a decline in Q2 2021 was in line with Q4 2020, with larger SMEs in particular less likely to be reporting a decline than in Q1 2021, albeit still well above pre-pandemic levels
29
Annual time series: % reporting decline in previous 12 months
Q81 all SMEs excl Starts and DK Q2 2021 3910 724/1246/1286/654
The proportion reporting a decline increased to 64% in Q1 2021 and across all size bands except
the largest SMEs. The overall figure was slightly lower in Q2 2021 as fewer larger SMEs in particular
reported a decline (although still well above pre-pandemic levels) In Q2 2021, 84% in the
Hospitality sector and 73% in Transport reported a decline.
42%
48%
59%
61%
All SMEs
50-249 emps 13%
10-49 emps 14%
1-9 emps 19%
0 emps 22%
21% 19% 14% 12% 10% 11% 17% 19% 21% 22% 46% 61% 64% 60%
2012 2013 2014 2015 2016 2017 2018 2019 Q1 20 Q2 20 Q3 20 Q4 20 Q1 21 Q2 21

14%
20%18% 18%
20% 19% 20%
8%
21%20%18% 18%
15%
34%
24%27%
10%
29%
37%
62% 62%
56%
86%
74%
52%
63% 62%
41%
58%
49%
59%
84%
73%
57%
62%
67%
Agric Mfg Constr Whle/Retail Hotel/Rest Trans Prop/Bus Serv Health Other Comm
2019 Q2 20 Q4 20 Q2 21
SMEs in Hospitality and Transport remained the most likely to report a decline with little change since Q4, as Construction reported a slightly improving picture
30
Sector summary: Declined – over time
Q81 all SMEs excl Starts and DK Q2 2021 252/374/675/424/274/424/808/265/414
In Q2 2021, 8 in 10 Hospitality SMEs and 7 in 10 in Transport reported that they had declined in size. As
on other metrics, those in Agriculture remained less affected, but 4 in 10 now report a decline and the
proportion in Property/Business Services has increased to almost 6 in 10.

70% 77% 80% 80% 82% 78% 82% 79% 69% 60%
2013 2014 2015 2016 2017 2018 2019 2020 Q1 21 Q2 21
30%
28%
34%
40%
51%
39%
36%
47%
53%
42%
52%
49%
60%
69%
66%
64%
61%
71%
77%
75%
All
0 emps
1-9 emps
10-49 emps
50-249 emps
2018
2019
2020
H1 21
60% of SMEs reported a profit, the lowest level seen to date but with signs of improvement in Q2 2021 for the larger SMEs. Two thirds of SMEs said improving profit margins was a key priority
31
Annual time series: % making a profit (excl DK)
Q115/84 All SMEs Q2 2021 4252 865/1403/1318/664
The proportion of SMEs making a profit has reduced in 2021,
as the impact of the pandemic is felt in year-end results. The
median profit made was £10,000 in Q2 and has been £10-
12k since Q1 2020 compared to £8-9k in 2019.
75%80%
66%
57%
50-249
10-49
1-9
0
All SMEs
81%
80%
72%
67%
Improving profit margin a key priority: over time
In H1 2021, 64% of SMEs said improving profit margins was
a key priority for them and this proportion has increased
over time (from 30% in 2018) overall, and for all sizes of SME

81% 81%85%
76% 74%
80%84% 86%
78%77%81% 80% 78%
72%77%
83%80%
73%71%66%
70%
63%
44%
53%
70%
61% 62%
Agric Mfg Constr Whle/Retail Hotel/Rest Trans Prop/Bus Serv Health Other Comm
2019 2020 H1 21
SMEs in Hospitality and Transport were much less likely to report having made a profit than their peers, as the impact of the pandemic starts to be reflected in annual profit figures
32
Sector summary: Made a profit – over time
Q115 all SMEs excl DK H1 2021 419/639/1130/717/450/680/1412/444/667
In H1 2021, those in Hospitality were the least likely to repot having made a profit. Improving profit
margins was a priority for the majority of SMEs in each sector, ranging from 57% in Health to 70% in
Hospitality (v 61% in Transport)

55% 54% 54% 55% 57% 56%60%
52% 54% 56%
13%16% 17%
14% 16% 15% 16% 16%19% 17%
38% 37% 37% 36% 34% 33% 35%
42%
45%
43%
12% 11% 10% 11%15% 15% 17%
2013 2014 2015 2016 2017 2018 2019 2020 Q1 21 Q2 21
In 2021 to date, levels of innovation were maintained at the higher level seen in 2020, levels of planning were back in line and there has been a further slight increase in the use of mentors
33
Annual time series: Business management
Q84 Base : All SMEs Q2 2021 4252 865/1403/1318/664
International
Plan
Innovate
Mentors
Innovation 2012 2019 2020 Q1 21 Q2 21
New product 17% 15% 17% 22% 20%
Impr. process 35% 30% 38% 40% 39%
Any
innovation
All 0
emps
1-9
emps
10-49
emps
50-249
emps
2012 40% 36% 49% 60% 70%
2019 35% 31% 43% 51% 50%
2020 42% 39% 50% 60% 63%
H1 2021 44% 42% 49% 62% 62%
All sectors were more likely to have been innovative in H1 2021 than in 2019, notably those in
Hospitality (51% from 43% in 2019). Those in Construction remained the least likely to have
innovated (33% from 25% in 2019) along with Transport (36% from 30%) with other sectors 39-50%.

30%
40%
25%
45%
43%
30%
36%
34%
41%
41%
44%
31%
48%
50%
38%
46%
47%
47%
39%
48%
33%
49%
51%
36%
49%
44%
50%
Agric
Mfg
Constr
Whle/Retail
Hotel/Rest
Trans
Prop/Bus Serv
Health
Other Comm
2019
2020
H1 21
All sectors saw an increase in innovation 2019-20 with those gains maintained in H1 2021. For most sectors, levels of planning increased slightly but remained below 2019 levels
34
Innovation
Q84 all SMEs H1 2021 518/804/1455/943/599/887/1803/613/891
58%
60%
55%
69%
71%
61%
57%
65%
56%
55%
55%
43%
63%
63%
53%
54%
49%
50%
60%
56%
46%
62%
63%
52%
59%
57%
51%
Agric
Mfg
Constr
Whle/Retail
Hotel/Rest
Trans
Prop/Bus Serv
Health
Other Comm
Planning

22% 21% 17%
28%23% 25% 23% 19%
53% 55%
48%
50%51% 51% 51%
50%
25% 25%
35%
22% 26% 24% 26%31%
2018 2019 Q1 20 Q2 20 Q3 20 Q4 20 Q1 21 Q2 21
9% 8% 7%14% 10% 11% 11% 7%
37% 36%31%
38%36% 36% 36%
31%
55% 55%62%
48%54% 53% 53%
62%
2018 2019 Q1 20 Q2 20 Q3 20 Q4 20 Q1 21 Q2 21
Trust in main bank fell in Q2 2020 but by Q2 2021 was back in line with the start of the pandemic. Trust in the banking industry remained at lower levels, but also somewhat better than Q2 2020
35
Level of trust by size over time
Q24b Base : All SMEs Q2 2021 4250
High level of trust 8-10
Medium level of trust 5-7
Low level of trust 1-4
Trust in main bank Trust in banking industry
A low level of trust in main bank was seen
more often amongst SMEs with 0 or 1-9
employees (7-8%), or those in
Wholesale/Retail (10%)
A low level of trust in banking was seen more
often amongst SMEs with 0 employees (20%),
Transport (23%) and also Wholesale/Retail
and Property/Business Services (both 21%)

19% 20% 17%11% 6%
50% 51%50%
48%51%
31% 30% 33%41% 43%
All 0 Emp 1-9 emp 10-49
emp
50-249
emp
7% 7% 8% 6% 2%
31% 30% 32%26% 31%
62% 62% 60%68% 67%
All 0 Emp 1-9 emp 10-49
emp
50-249
emp
Levels of trust in main bank were slightly higher amongst larger SMEs, with trust in the banking industry increasing more clearly by size of SME
36
Level of trust by size Q2 2021
Q24b Base : All SMEs Q2 2021 4252 865/1403/1318/664
High level of trust 8-10
Medium level of trust 5-7
Low level of trust 1-4
Trust in main bank Trust in banking industry

8% 7% 8% 10% 8% 8% 7% 5% 4%
32% 36% 33% 28% 29% 28% 30% 33%29%
60% 57% 59% 62% 63% 64% 62% 61% 67%
Agric Mfg Constr Whle/Retail Hotel/Rest Trans Prop/Bus Serv Health Other Comm
High
Medium
Low
There was little difference by sector in levels of trust in their main bank
37
Sector summary: Level of trust in main bank Q2 2021
Q24b Base : All SMEs Q2 2021 259/404/733/474/310/443/878/299/450

18% 15% 17% 21% 16%23% 21%
13% 15%
51%50% 49% 46% 51%
45% 53%56% 53%
31% 35% 34% 33% 33% 32%26% 31% 32%
Agric Mfg Constr Whle/Retail Hotel/Rest Trans Prop/Bus Serv Health Other Comm
High
Medium
Low
Trust in the banking industry was lower than for main bank across all sectors, again with relatively little to choose between them
38
Sector summary: Level of trust in banking industry Q2 2021
Q24c Base : All SMEs Q2 2021 259/404/733/474/310/443/878/299/450

62% of SMEs had a high level of trust in their main bank in Q2 2021, an improvement from 48% in Q2 2020 and
back to levels seen in Q1 2020. Trust in the banking industry more generally remained lower than for the main
bank at 31%, but again this was higher than in Q2 2020 when 22% had a high level of trust
The trading context - Key findings
39
Reported growth in the last 12 months remained low in Q2 2021 at 15%, but little changed from Q4 2020. 6 in
10 SMEs reported a decline, again little changed since Q4 2020 but much higher than seen pre-pandemic.
Fewer SMEs reported making a profit (60% in Q2 2021) but improving profit margins has become more of a
priority (63% of all SMEs). Those in Hospitality or Transport remained more likely to report a decline and less
likely to have made a profit
As SMEs seek to cope with the “new normal”, levels of innovation remained higher than previously seen: 43%
had been innovative, with 20% introducing a new product or service and 39% improving a business process.
Those who had been innovative were slightly more likely to have made a profit and to have grown than those
who had not

Today’s presentation
40
The trading context
External funding: attitudes to and use of, alongside alternatives
Demand for finance: need, applications and impact of Covid
The future: growth, barriers and future appetite for finance
The immediate impact of Covid 19

Attitudes to finance
41
80%73%
55%52% 51%
42% 41%37%
29%
85%80%
68%
57%51%
43%37%
41%
33%
86%82%
68%63%
57%
46%
36%43%
37%
Plan what can
afford
Accept slower
growth
Future
uncertain so
cautious
Cost of credit
discourage
Never think to
use more
finance
Prepared to
take risks to
succeed
Difficult for us
to get finance
Ambition to be
significantly
bigger
Happy to use
finance to grow
2019 2020 H1 21
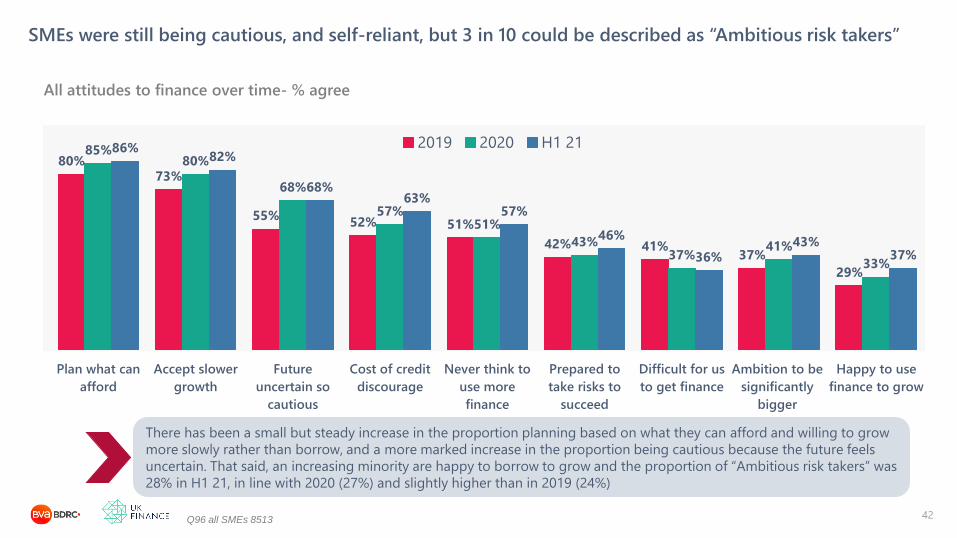
SMEs were still being cautious, and self-reliant, but 3 in 10 could be described as “Ambitious risk takers”
42
All attitudes to finance over time- % agree
Q96 all SMEs 8513
There has been a small but steady increase in the proportion planning based on what they can afford and willing to grow
more slowly rather than borrow, and a more marked increase in the proportion being cautious because the future feels
uncertain. That said, an increasing minority are happy to borrow to grow and the proportion of “Ambitious risk takers” was
28% in H1 21, in line with 2020 (27%) and slightly higher than in 2019 (24%)

Smaller SMEs have become more likely to meet the definition of an Ambitious risk taker, the largest SMEs somewhat less likely
43
In challenging trading conditions, more smaller SMEs have met the definition of an Ambitious
risk taker – an SMEs that wants to be significantly bigger and is prepared to take risks to be
successful. Those in Wholesale/Retail (33%) and Manufacturing (31%) were the most likely to
meet the definition of an Ambitious risk taker, both higher than in 2019.
Ambitious risk takers, over time
Q96 Base : All SMEs H1 2021 8513 1715/2813/2721/1264
24%21%
29%35%
42%
27% 25%
33%36% 38%
28% 26%
34%37% 36%
All SMEs 0 emps 1-9 emps 10-49 emps 50-249 emps
2019 2020 H1 21
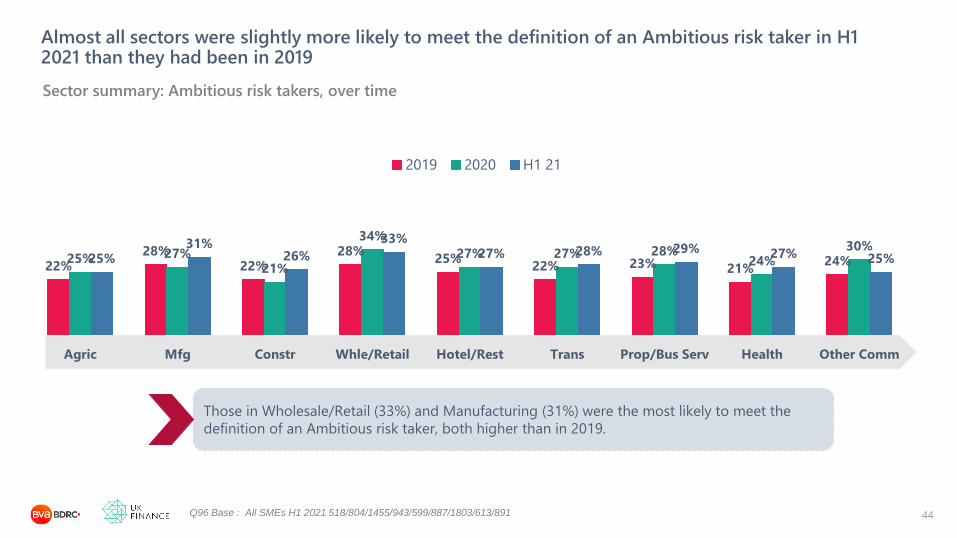
Almost all sectors were slightly more likely to meet the definition of an Ambitious risk taker in H1 2021 than they had been in 2019
44
Those in Wholesale/Retail (33%) and Manufacturing (31%) were the most likely to meet the
definition of an Ambitious risk taker, both higher than in 2019.
Sector summary: Ambitious risk takers, over time
Q96 Base : All SMEs H1 2021 518/804/1455/943/599/887/1803/613/891
22%28%
22%28%
25%22% 23% 21%
24%25% 27%21%
34%
27% 27% 28%24%
30%25%
31%26%
33%27% 28% 29% 27% 25%
Agric Mfg Constr Whle/Retail Hotel/Rest Trans Prop/Bus Serv Health Other Comm
2019 2020 H1 21

42% 45% 43% 34% 32% 29% 29% 31% 34% 37% 38% 36%
H2 2014 2015 2016 2017 2018 2019 Q1 20 Q2 20 Q3 20 Q4 20 Q1 21 Q2 21
The proportion happy to borrow to grow increased during 2020 for all but the largest SMEs and has been broadly stable in 2021
45
Annual time series: Happy to borrow to grow
Q96 Base All SMEs Q2 2021 4252 865/1403/1318/664
50-249 emps
10-49 emps
1-9 emps
0 emps
All SMEs
44%
55%
44%
33%
57%
56%
49%
39%
The proportion of SMEs happy to borrow to grow improved during 2020 and has remained stable in
2021 and across all size bands. In H1 21, 49% of those in Transport were happy to borrow to grow,
compared to 29% in Health.

All sectors were at least slightly happier to borrow to grow in H1 2021 than in 2019, notably those in Transport
46
Half of those in Transport are happy to borrow to grow, with around 4 in 10 in most other
sectors, with the exception of Health (29%), Other Community (33%) and Property/Business
Services (34%)
Sector summary: Happy to borrow to grow, over time
Q96 Base : All SMEs H1 2021 518/804/1455/943/599/887/1803/613/891
34% 35%
27%
36%32% 30%
26% 27% 28%
39%
32%28%
42%38%
34%31%
27%33%
43%39% 37% 39% 40%
49%
34%29%
33%
Agric Mfg Constr Whle/Retail Hotel/Rest Trans Prop/Bus Serv Health Other Comm
2019 2020 H1 21

16% 17% 21% 20% 28% 18% 16% 22%
39% 40%46% 47%
43%53% 53% 44%
24% 23% 16% 16% 11% 16% 17% 16%
21% 20%18% 16% 18%
17% 21% 21%
2015 2016 2017 2018 2019 2020 Q1 21 Q2 21
Appetite for finance increased slightly 2019-2020 as more SMEs who were not using finance said they were happy to borrow to grow. This was maintained into 2021 as more SMEs using finance said they were also happy to borrow to grow
Annual time series– use of, and appetite for, external finance
Base : All SMEs Q2 2021 4250
Previous analysis has shown that using finance is a good predictor of applying for more. The previous increase
in use of finance in 2019 saw more SMEs in the “using finance but not willing to borrow to grow” group (28%).
When use of finance increased again from the second half of 2020, this resulted in an increase in both those
also willing to borrow to grow to 21% and those not willing to 22%.
47
Using external finance and
happy to use to grow
Using external finance but
not happy to use to grow
Not using external finance
but happy to use to grow
Not using external finance and
not happy to use to grow

Use of external finance
48

44% 41% 37% 37% 37% 38% 36% 45% 32% 30% 40% 44% 42% 45%
2012 2013 2014 2015 2016 2017 2018 2019 Q1 20 Q2 20 Q3 20 Q4 20 Q1 21 Q2 21
Overall use of finance was 45% in Q2 2021, boosted by increased use of bank loans and grants. Use was higher than in Q4 2020 for all SMEs except those with 50-249 employees
49
Annual time series: Currently using any external finance
Q15 all SMEs Q2 2021 4252 865/1403/1318/664
50-249 emps
10-49 emps
1-9 emps
0 emps
All SMEs
After a period of overall stability, use of external finance increased in 2019 to 45% but then dropped to 30-32% in the first
half of 2020 and across all sizes. Since then, increased use of loans and grants in particular has seen the overall proportion
increase to 45%, and across all but the largest size band
35%
65%
57%
37%
74%
70%
58%
38%

The struggling sectors, Hospitality and Transport, remained the most likely to be using finance overall, with no clear pattern by sector
50
There is no clear pattern by sector over time – In Q2 2021 a few sectors were less likely to be
using finance than in 2019, most were broadly in line and some were ahead
Sector summary: Use of external finance over time
Q15 Base : All SMEs Q2 2021 259/404/733/474/310/443/878/299/450
56%
44%48%
52%48% 46%
37%
56%
42%41%
28% 28%
41%
47%
36%
27%22%
25%
51%
43%39%
43%
60%57%
40% 38%42%
52%48%
43%
55% 55%
47%42%
32%
42%
Agric Mfg Constr Whle/Retail Hotel/Rest Trans Prop/Bus Serv Health Other Comm
2019 Q2 20 Q4 20 Q2 21

44%41%
37% 37% 37% 38%36%
45%
32%30%
40%44%
42%45%
36%32%
29% 30% 30% 31% 32%
39%
26% 25%
32% 31% 32% 31%
18% 18% 17% 17% 16%18%
12%16%
14% 13%
21%
26% 25%27%
2012 2013 2014 2015 2016 2017 2018 2019 Q1 20 Q2 20 Q3 20 Q4 20 Q1 21 Q2 21
As use of any external finance increased from Q3 2020, use of core finance was stable with more use being made of “other” forms of finance, typically a grant
51
Time series: Core and other financial products
Q15/ Base : All respondents Q2 2021 4250
Use of core finance dropped from 39% for 2019 as a whole to 25% in Q2 2020, but recovered
somewhat due to higher use of loans. Use of ‘other’ forms of finance was boosted by more use being
made of grants (from 4% in Q2 2020 to 16% in Q2 2021)
Use any external finance now OtherCore products

2012 2013 2014 2015 2016 2017 2018 2019 Q1 20 Q2 20 Q3 20 Q4 20 Q1 21 Q2 21
There has been a marked increase in use of loans/commercial mortgages since Q1 2020. Use of ‘other’ forms of finance was boosted by an increase in grants (from 4% to 16%)
52
Annual time series: Main forms of finance used
Q15 all SMEs Q2 2021 4250
Leasing/HP
Credit cards
Bank loan/Mtge
Overdraft
The proportion of SMEs using 2 or more forms of finance
fell from 17% in 2019 to 11% in Q2 2020, but recovered by
Q4 to 19% and 18% in Q2 21. Amongst those using any
finance, the proportion using 2 or more forms was 41% in
Q2 21, only slightly higher than the 38% reported in Q2 20
9%
9%
18%
9%
6%
18%
10%
22%
Use of finance 2019 Q2 20 Q4 20 Q2 21
No finance 55% 70% 56% 55%
1 product 28% 19% 25% 26%
2 or more products 17% 11% 19% 18%
44% 41% 37% 37% 37% 38% 36% 45% 32% 30% 40% 44% 42% 45%
34%40%
43%47% 47% 47% 48%
42%
51%
41% 39%
32%37% 38%
2012 2013 2014 2015 2016 2017 2018 2019 Q1 20 Q2 20 Q3 20 Q4 20 Q1 21 Q2 21
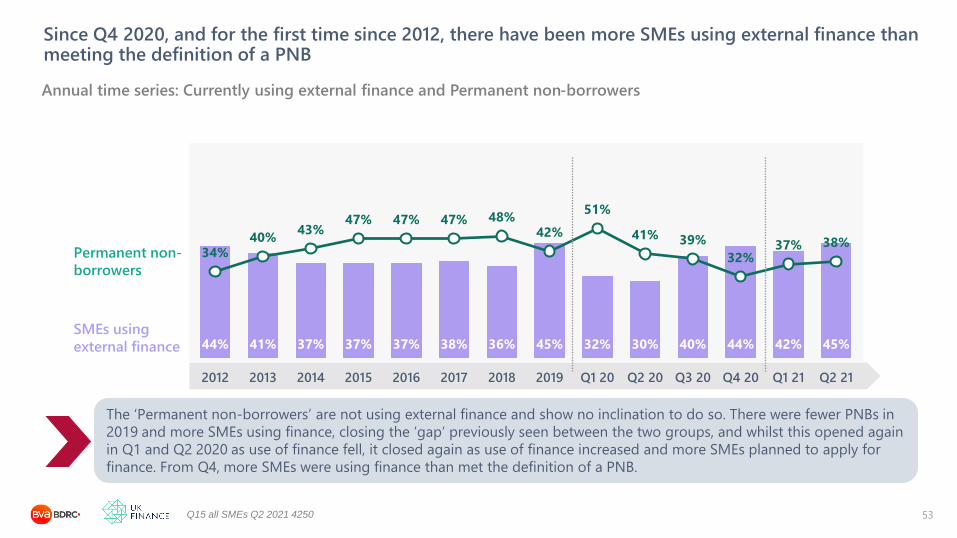
Since Q4 2020, and for the first time since 2012, there have been more SMEs using external finance than meeting the definition of a PNB
53
Annual time series: Currently using external finance and Permanent non-borrowers
Q15 all SMEs Q2 2021 4250
The ‘Permanent non-borrowers’ are not using external finance and show no inclination to do so. There were fewer PNBs in
2019 and more SMEs using finance, closing the ‘gap’ previously seen between the two groups, and whilst this opened again
in Q1 and Q2 2020 as use of finance fell, it closed again as use of finance increased and more SMEs planned to apply for
finance. From Q4, more SMEs were using finance than met the definition of a PNB.
Permanent non-
borrowers
SMEs using
external finance

55% 49% 49% 46% 49% 42% 50% 49% 57%
28%33% 36% 38% 37%
44%38%
32% 30%
2013 2014 2015 2016 2017 2018 2019 2020 Q2 21
35% 32% 32% 33% 34% 34% 43% 32% 41%
44% 48% 51% 50% 51% 50%44% 44% 41%
2013 2014 2015 2016 2017 2018 2019 2020 Q2 21
67%61% 60% 59%
64%54%
60% 58%65%
22% 26% 29% 30% 27%36%
31% 28% 24%
2013 2014 2015 2016 2017 2018 2019 2020 Q2 21
73%63% 61% 64%
73% 77% 77%
58%
35%17%
26% 28% 26% 22% 19% 19%
32%
51%
2013 2014 2015 2016 2017 2018 2019 2020 Q2 21
The relationship between PNBs and users of finance varied by size of SME. The largest SMEs have become more likely to meet the definition of a PNB
54
Annual time series: Currently using external finance and Permanent non-borrowers
Q15 all SMEs Q2 2021 4252 865/1403/1318/664
Permanent non-
borrowers
SMEs using
external finance0 emps 1-9 emps
10-49 emps 50-249 emps

All sectors, except Health and Property/Business Services, were more likely to be using finance in Q2 2021 than to meet the definition of a PNB
55
While those in Health are now much more likely to be a PNB than to use finance, the
opposite is true for those in Hospitality or Wholesale/Retail
Sector summary: Use finance and PNBs Q2 2021
Q84
Base : All SMEs Q2 2021 259/404/733/474/310/443/878/299/450
52% 48% 43% 55% 55% 47% 42% 32% 42%
35%39% 37%
30%25%
32%
45%
55%
34%
Agric Mfg Constr Whle/Retail Hotel/Rest Trans Prop/Bus Serv Health Other Comm
Use finance PNB
Alternative sources of funding
56
45%32% 30%
40% 44% 42% 45%
16%
19% 21%
18%17% 17%
17%
8%
10% 11%
15% 13% 14%14%
2019 Q1 20 Q2 20 Q3 20 Q4 20 Q1 21 Q2 21
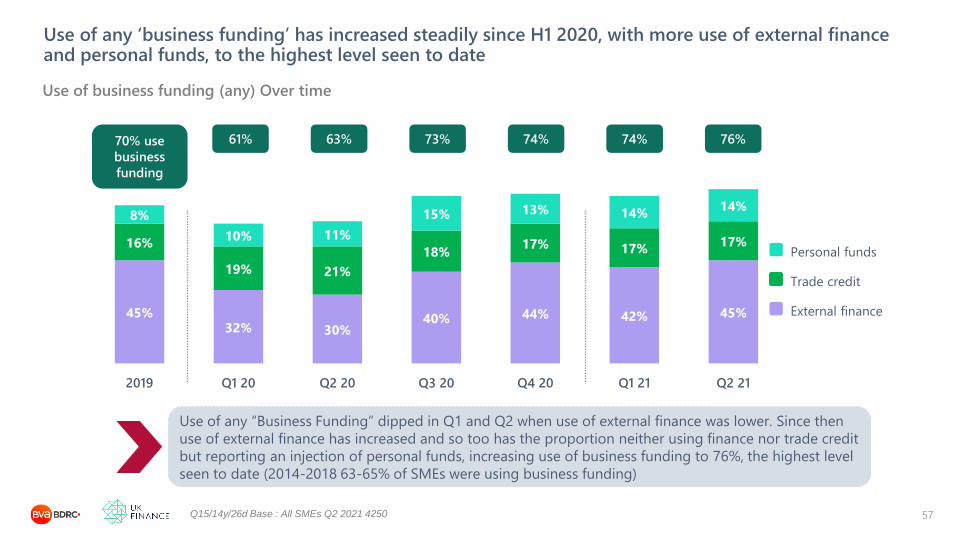
Use of any ‘business funding’ has increased steadily since H1 2020, with more use of external finance and personal funds, to the highest level seen to date
57
Use of business funding (any) Over time
Q15/14y/26d Base : All SMEs Q2 2021 4250
Personal funds
Trade credit
External finance
70% use
business
funding
Use of any “Business Funding” dipped in Q1 and Q2 when use of external finance was lower. Since then
use of external finance has increased and so too has the proportion neither using finance nor trade credit
but reporting an injection of personal funds, increasing use of business funding to 76%, the highest level
seen to date (2014-2018 63-65% of SMEs were using business funding)
61% 63% 73% 74% 74% 76%

45%
17%
14%
All SMEs
For the smallest SMEs, personal funds were as important as trade credit within their business funding mix, with larger SMEs more likely to be using trade credit
58
Use of business funding (any) Q2 2021
Q15/14y/26d Base : All SMEs Q2 2021 4252 865/1403/1318/664
Personal funds
Trade credit
External finance
76% use business
funding
41%
57%65%
35%
16%
20%
26%
27%
16%
7%
2%
0 Emp 1-9 emp 10-49 emp 50-249 emp
73% 84% 91% 64%
Business funding 0 emps 1-9 10-49 50-249
2019 67% 77% 84% 91%
2020 64% 78% 86% 87%
H1 2021 72% 82% 89% 69%
52% 48% 43%55% 55%
47% 42%32%
42%
11% 23%24%
24%13%
12% 17%
10%
13%
14%7% 11%
7%16%
17% 14%
23%
14%
Agric Mfg Constr Whle/Retail Hotel/Rest Trans Prop/Bus Serv Health Other Comm
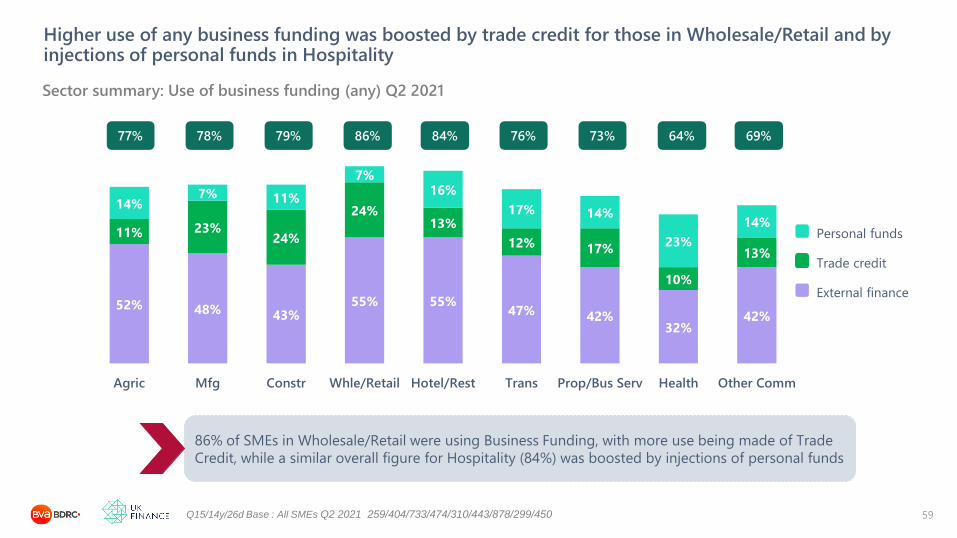
Higher use of any business funding was boosted by trade credit for those in Wholesale/Retail and by injections of personal funds in Hospitality
59
Sector summary: Use of business funding (any) Q2 2021
Q15/14y/26d Base : All SMEs Q2 2021 259/404/733/474/310/443/878/299/450
Personal funds
Trade credit
External finance
86% of SMEs in Wholesale/Retail were using Business Funding, with more use being made of Trade
Credit, while a similar overall figure for Hospitality (84%) was boosted by injections of personal funds
77% 78% 79% 86% 84% 76% 73% 64% 69%

4 in 10 SMEs had injected personal funds, back to levels seen in 2012-13, but with more SMEs having felt that they had to inject the funds (28%) rather than choosing to (12%)
60
Time series: Injections of personal funds in previous 12 months
Q15d2 Base : All respondents Q2 2021 4250
Any injection
of funds
Felt had to
inject funds
Chose to
inject funds17% 19%
14%
14%17% 16% 16%
13% 12%11% 15%
13%11% 12%
25%20%
15%
13%11%
13% 13%11% 12%
18%
23%25% 27% 28%
43%
38%
29%27% 28% 29% 29%
24% 24%
29%
38% 38% 38%40%
2012 2013 2014 2015 2016 2017 2018 2019 Q1 20 Q2 20 Q3 20 Q4 20 Q1 21 Q2 21
Injections of personal funds Q2 2021:
• By size , 43% with 0 employees and 33% with 1-9 employees (both up from a quarter in Q2 2020), decreasing
by size to 6% with 50-249 employees
• By sector more likely in Hospitality and Transport (both 47%) or Health (45%), compared 33-42% elsewhere

31% 33% 33% 35% 34% 37% 36% 36% 37% 36% 36% 39%
2014 2015 2016 2017 2018 2019 Q1 20 Q2 20 Q3 20 Q4 20 Q1 20 Q2 20
Use of any trade credit has increased very slightly, with a marked increase in use for those with 10-49 employees, but larger SMEs have become less likely to be using it.
61
Annual time series: Using trade credit
Q14 Base : All SMEs Q2 2021 4252 865/1403/1318/664
50-249 emps 58%
10-49 emps 58%
1-9 emps 45%
0 emps 26%
All SMEs
56%
81%
55%
33%
Using trade credit Q2 2021
• By size , from 3 in 10 of the 0 employee SMEs to 8 in 10 with 10-49 employees
• By sector it was used much more by those in Wholesale/Retail (61%), Construction (52%) and Manufacturing
(50%), compared to 15% in Health

16% 17% 20% 24% 22% 25% 23% 23% 23% 28% 29% 33% 35% 31%
10% 10%14%
17%14%
18%15% 16% 16%
19%22% 24% 26%
23%
32% 33%38%
41% 41%44% 42% 44% 42%
53%47%
56%60%
56%
66% 66% 68% 70% 72% 73% 75% 76%
67%
84%79%
83% 84% 86%
77%80% 82% 81% 82%
90% 91% 94% 89% 88% 88%93% 91% 95%
2012 2013 2014 2015 2016 2017 2018 2019 Q1 20 Q2 20 Q3 20 Q4 20 Q1 21 Q2 21
The proportion with £10,000 or more in credit balances increased to 35% at the start of 2021, but was slightly lower in Q2 as fewer of the smaller SMEs held such sums
62
Annual time series: £10k or more of credit balances held over time
Q117 Base : All SMEs excl DK Q2 2021 1812 429/664/473/246
50-249 emps
10-49 emps
1-9 emps
0 emps
All SMEs
Holding £10k+ of credit balances Q2 2021:
• By size, from 23% 0 employee SMEs to 95% with 50-249 employees
• By sector those in Wholesale/Retail were twice as likely to hold such sums (40%) as those in Health (20%)

36% 33% 33% 34%
47% 47%42% 45%
40%35%
26% 24%
40% 37% 35% 37%
20% 23%
46% 50% 52%61%
37% 33% 34%
15%26%
Agric Mfg Constr Whle/Retail Hotel/Rest Trans Prop/Bus Serv Health Other Comm
Personal funds £10k+ CB Trade credit
Between 6 and 8 in 10 in each sector used one or more of these additional forms of funding, with trade credit much more prevalent in certain sectors than others
63
Sector summary: Alternative funding Q2 2021
all SMEs Q2 2021 259/404/733/474/310/443/878/299/450
Use of any of these alternative forms of funding varied from 59% in Health to 81% in Wholesale/Retail with large
variations in the use of trade credit in particular.
71% 71% 74% 81% 71% 74% 70% 59% 62%
35%29%
51%
63%52%
All 0 emps 1-9 emps 10-49 emps 50-249 emps
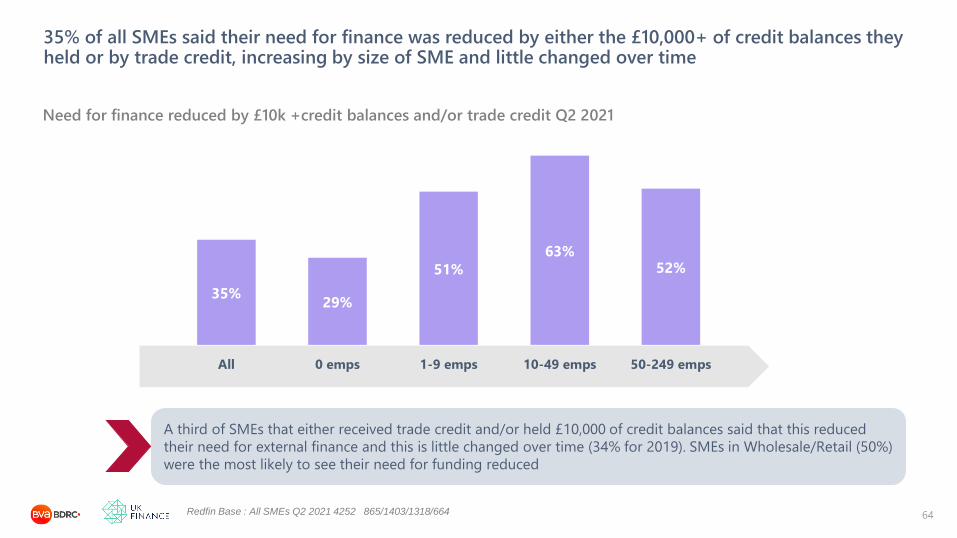
35% of all SMEs said their need for finance was reduced by either the £10,000+ of credit balances they held or by trade credit, increasing by size of SME and little changed over time
64
Need for finance reduced by £10k +credit balances and/or trade credit Q2 2021
Redfin Base : All SMEs Q2 2021 4252 865/1403/1318/664
A third of SMEs that either received trade credit and/or held £10,000 of credit balances said that this reduced
their need for external finance and this is little changed over time (34% for 2019). SMEs in Wholesale/Retail (50%)
were the most likely to see their need for funding reduced

34%
41% 42% 40%
51%
40%
30%27%
24% 24%
32%37%
43%38%
46%
34%
26%29%
20%25%
34% 36%39% 40%
50%
31%34% 33%
14%
20%
All Agric Mfg Constr W/Ret H/Rest Trans Prop/BS Health Other Com
2019 2020 H1 21
SMEs in Wholesale/Retail remained the most likely to say their need for finance was reduced by either the £10,000+ of credit balances or trade credit
65
The equivalent of a third of SMEs said their need for finance was reduced, little changed.
over time. Those in Hospitality have become somewhat less likely to say their need for
finance has been reduced, as have those in Health
Sector summary: Need for finance reduced by £10k +credit balances and/or trade credit over time
Q84 Base : All SMEs H1 2021 518/804/1455/943/599/887/1803/613/891

External funding -Key findings
66
Attitudinally SMEs remained somewhat self-reliant about finance, with two thirds feeling the future was
uncertain and hence caution was required. That said, the proportion happy to borrow to grow increased to
37% in H1 2021, somewhat higher than the 3 in 10 seen immediately prior to the pandemic. 1 in 5 SMEs were
both using finance and happy to borrow to grow, back to levels seen in 2015-16, while just over 1 in 4 met the
definition of an “Ambitious risk taker”, slightly higher than in 2019
Injections of personal funds into the business had also increased again, to 40% of SMEs, with the highest
proportion to date, 28%, feeling that they had to inject funds. A fairly stable third of SMEs had access to £10k
or more of credit balances and around 4 in 10 had access to trade credit (including 8 in 10 of those with 10-49
employees, who were also more likely to say that trade credit/credit balances reduced their need for external
finance)
45% of SMEs were using finance, back to levels seen in 2019, due to increased use of loans and grants in
particular. As a result there were more SMEs using finance than meeting the definition of a PNB (38% in Q2
2021), which was not typically the case pre-pandemic. There has been a decline in use of external finance
amongst the largest SMEs and they were less likely to be using any “business funding” than their peers, but
remained the most likely to hold £10,000 or more of credit balances

Today’s presentation
67
The trading context
External funding: attitudes to and use of, alongside alternatives
Demand for finance: need, applications and impact of Covid
The future: growth, barriers and future appetite for finance
The immediate impact of Covid 19

Need for finance increased during 2020 and again in the first half of 2021, for all but the largest SMEs
68
Had a need for external funding (whether applied or not) – over time
Q25 all SMEs Q2 2021 4252 865/1403/1318/664
From a very low base in 2019, need for finance increase markedly during 2020 and again in Q1
and Q2 of 2021, with little to choose between size of SME with the exception of the largest SMEs.
All sectors saw an increased need for finance in 2020 and there have been further increases in
2021, albeit not a consistent pattern across all sectors
3%2%
6%5%
3%
9%8%
10% 10%8%
15%14%
16%18%
9%
15%14%
18%
15%
7%
All 0 emps 1-9 emps 10-49 emps 50-249 emps
2019 2020 Q1 21 Q2 21

6%
2%3%
5%6%
2%3%
1%
5%
9%7%
6%8%
12%13%
9%7%
10%9%
17%
12% 12%
21%
25%
12%13%
17%15%
17%15% 15%
18%
13% 13%
10%
18%
Agric Mfg Constr W/Ret H/Rest Trans Prop/BS Health Other Com
2019 2020 Q1 21 Q2 21
All sectors have seen an increased need for funding since 2019, with further increases in 2021 although not to a consistent pattern across all sectors
69
Although still a minority of SMEs, all sectors saw an increased need for finance in 2020.
There have been further increases in 2021, albeit not a consistent pattern across all
sectors
Sector summary: Had a need for external funding (whether applied or not) – over time
Q24 Base : All SMEs Q2 2021 259/404/733/474/310/443/878/299/450

In H1 2021, there continued to be a focus on funding for cash flow and a greater role for the main bank, with limited evidence of self funding as 8 in 10 of those with a need made an application for funding
70
Behaviour in the 12 months prior to interview
Base varies, those who took no action excluded after each stage * from Q2 2020 this includes “Coping with impact of Covid 19”
Q2-4 20: 10%
81%*
24%
55%
38%
81%
67%
80%
65%
12%
Reported a funding need
To fund Cash flow
To fund Bus Devlpt
Spoke to bank/advisor
Spoke to main bank
Considered applying
To main bank
Applied
To main bank
Self funded element
2019: 3%
49%
58%
43%
18%
63%
37%
57%
29%
29%
2018: 4%
42%
58%
41%
21%
67%
48%
63%
40%
13%
Q1-2 21: 15%
85%*
19%
49%
28%
86%
70%
83%
66%
8%

78% 77%
Q39/57 Base : All Type 1a/b applications with a response 1232/1620/1652/1552/3033/3251/2935
Analysis by application period showed an increasing success rate for applications made during 2020 and 2021 to date
71
Global success rate: all applications reported from Q1 2018 to date, occurring in the 18 mth application periods shown
16% 18% 21%26%
14% 12% 12%
6% 5%5%
4%
2%1% 1%
1% 1%1%
2%
1%1% 1%
7% 6%6%
4%
3%3% 2%
70% 70% 67% 65%
80% 84% 85%
Q1 17-Q2 18 Q3 17-Q4 18 Q1 18-Q2 19 Q3 18-Q4 19 Q1 19-Q2 20 Q3 19-Q4 20 Q1 20-Q2 21
74% 71% 84%
Offered but declined
No facility
Offered what wanted and took it
Have facility after issues
Different product from provider
2790 applications reported as made in 2020 had a success rate of 89% For the 145
reported for 2021 to date the success rate was 78%
88% 88%
89%
Q39/57 Base : All Type 1a/b applications with a response 178/1961/116/35/21CARE RE SMALL BASE
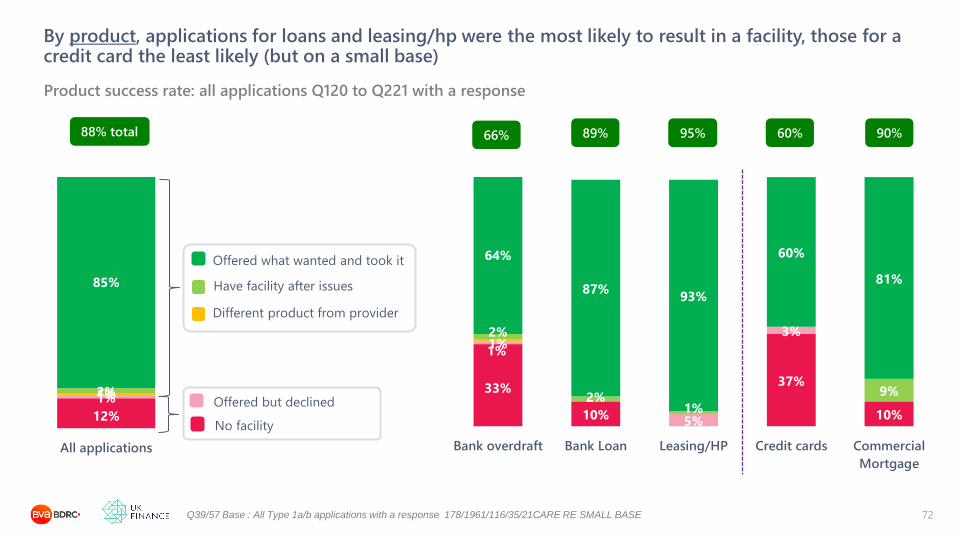
By product, applications for loans and leasing/hp were the most likely to result in a facility, those for a credit card the least likely (but on a small base)
72
Product success rate: all applications Q120 to Q221 with a response
33%
10%
37%
10%
1%
5%
3%
1%
2%
2%1%
9%
64%
87%93%
60%
81%
Bank overdraft Bank Loan Leasing/HP Credit cards Commercial
Mortgage
95% 60% 90%88% total
12%
1%1%2%
85%
All applications
Offered but declined
No facility
Offered what wanted and took it
Have facility after issues
Different product from provider
66%

77%
65%
99%
76%
61%
95%
73%
80%
88%
66%
89%
95%
Bank overdraft
Bank Loan
Leasing HP
Q117-Q218 Q118-Q219 Q119-Q220 Q1 20-Q221
Success rates for bank loans have increased markedly for more recent applications, those for leasing were broadly stable and those for overdrafts were now lower than for bank loans
73
Success rates for key products
Q39/57 Base : All Type 1a/b applications with a response Q120-Q221 178/1961/116
Around two thirds of applications for bank overdrafts were successful. Success rates for loans initially dipped
but recent applications have been much more likely to be successful (no doubt affected by the Government
backed lending schemes), moving them ahead of bank overdrafts and boosting the overall success rates.

80% 84% 83% 83% 85% 83% 84% 80% 77% 76% 78%
3%2% 2% 2% 1% 1% 1%
2% 3% 4% 3%
17% 13% 15% 14% 13% 15% 14% 18% 19% 20% 19%
2015 2016 2017 2018 2019 Q1 20 Q2 20 Q3 20 Q4 20 Q1 21 Q2 21
The increase in past borrowing events in 2020 has been maintained into 2021, albeit most SMEs met the definition of a Happy non-seeker.
74Pastfin Base : All SMEs Q2 2021 4250
Annual time series: Borrowing profile past
Looking back over the past 12 months, most SMEs have been “Happy non-seekers” of finance, as they
have in previous years, but that proportion has declined back to 2015 levels, as the proportion reporting
a borrowing event increased.
Had any event Would be seekers Happy non-seekers

SMEs with 1-9 or 10-49 employees were more likely to report a past borrowing event
75Pastfin Base : All SMEs Q2 2021 4250 865/1403/1318/664
Borrowing profile past by size of SME Q2 2021
Had any event Would be seekers Happy non-seekers
78% 79% 73% 74%88%
3% 3%3% 1%
19% 18% 24% 25%12%
All 0 emps 1-9 emps 10-49 emps 50-249 emps

17% 16% 14% 16% 15% 20% 23% 24% 22%
2017 2018 2019 Q1 20 Q2 20 Q3 20 Q4 20 Q1 20 Q2 20
By Q4 2020, almost a quarter of SMEs reported having had any appetite for finance in the previous 12 months and this was maintained into 2021, but with declining appetite for the largest SMEs.
76
Annual time series: Any appetite for finance in past 12 months (Borrowing event or Would-be seeker)
Q14 Base : All SMEs Q2 2021 4252 865/1403/1318/664
50-249 emps 26%
10-49 emps 25%
1-9 emps 22%
0 emps 16%
All SMEs
12%
26%27%
21%

75% 76% 76% 76% 77% 73% 79% 83% 82%
3% 4% 2% 2% 2% 4%3%
6% 3%22% 20% 22% 22% 21% 23% 17%
11% 15%
Agric Mfg Constr W/Ret H/Rest Trans Prop/BS Health Other Com
Past appetite for finance varied little by sector, with the exception of lower appetite amongst the Property/Business Services, Health and Other Community sectors
77Pastfin
Base : All SMEs Q2 2021 259/404/733/474/310/443/878/299/450
Borrowing profile past by sector Q2 2021
In all sectors the majority of SMEs met the definition of a ‘Happy non-seeker’ and there were
limited number of ‘Would-be seekers’ who felt something had stopped them from applying
Had any event Would be seekers Happy non-seekers

Pandemic related funding
78

In Q2 2021, almost half of SMEs were aware of either Pay as you Grow and/or the Recovery Loan Scheme
79AW1 All SMEs Q2 2021 4252 865/1403/1318/664
Awareness of new schemes – Q2 2021
33%
32%
45%
Pay as you grow
Recovery Loan
scheme
Aware of either
Q2 Initial awareness of the new schemes was high
compared to other initiatives previously tested and
increased with size:
Aware of
either
0
emps
1-9
emps
10-49
emps
50-249
emps
Q2 2021 44% 47% 49% 55%
In Q2 2021:
• Awareness by sector ranged from 55% in the
Hospitality sector to 37% in Construction
• It was slightly higher for those using any finance
(50% v 41% not using)
• 58% of those with a government backed facility
themselves were aware (46% of PAYG and 37%
of the Recovery Loan)

As the availability of some Government backed schemes ended, the proportion of SMEs that had applied for pandemic related funding was stable in H1 2021
80BB1 All SMEs Q2 2021 4252 865/1403/1318/664
Specific approaches re funding for pandemic impact lending – over time
11%
3%
12%
74%
18%
2%
6%
74%
21%
2%
4%
74%
18%
2%
4%
76%
18%
1%
3%
78%
Approached main bank about
finance
Approached another finance
provider
Not approached but considering
No plans to approach
Q2 20
Q3 20
Q4 20
Q1 21
Q2 21
Most SMEs approached their main bank for funding.
The proportion making any approach increased from
14% in Q2 to 23% in Q4 2020 and was 19% in Q2 2021:
Any
approach
0
emps
1-9
emps
10-49
emps
50-249
emps
Q2 2020* 12% 21% 27% 21%
Q4 2020 20% 31% 30% 15%
Q2 2021 16% 29% 35% 15%
In H2 2020, 13% of those who had not reported a
borrowing event earlier went on to say they had
approached a provider for Covid related funding, and
the proportion was similar in H1 2021 (12%). This
would boost the proportion of all SMEs with any
borrowing event to 29% in both periods.

17% 17% 17%
25% 25%28%
19% 17% 16%17% 18% 19%
28%
40%
29%24%
13%
20%
13%18% 18%
28%
35%31%
16%13%
16%19%
24%19% 21%
27% 26%
20%
9% 11%
Agric Mfg Constr Whle/Retail Hotel/Rest Trans Prop/Bus Serv Health Other Comm
Q3 20 Q4 20 Q1 21 Q2 21
SMEs in the Hospitality and Transport sectors were the most likely to have approached a lender for pandemic related finance
81
Sector summary: Pandemic impact lending– Any approach from Q3 2020 to Q2 2021
BB1 all SMEs Q2 2021 259/404/733/474/310/443/878/299/450
SMEs in the Hospitality and Transport remained more likely to have made an
approach for Covid related funding, with increased mention of applications in Q2
2021 from those in Manufacturing
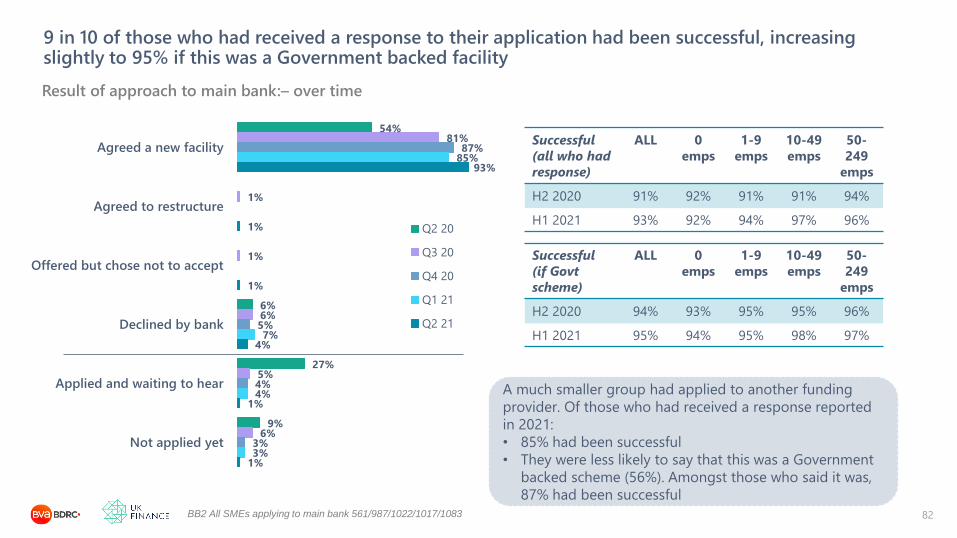
9 in 10 of those who had received a response to their application had been successful, increasing slightly to 95% if this was a Government backed facility
82BB2 All SMEs applying to main bank 561/987/1022/1017/1083
Result of approach to main bank:– over time
54%
6%
27%
9%
81%
1%
1%
6%
5%
6%
87%
5%
4%
3%
85%
7%
4%
3%
93%
1%
1%
4%
1%
1%
Agreed a new facility
Agreed to restructure
Offered but chose not to accept
Declined by bank
Applied and waiting to hear
Not applied yet
Q2 20
Q3 20
Q4 20
Q1 21
Q2 21
A much smaller group had applied to another funding
provider. Of those who had received a response reported
in 2021:
• 85% had been successful
• They were less likely to say that this was a Government
backed scheme (56%). Amongst those who said it was,
87% had been successful
Successful
(all who had
response)
ALL 0
emps
1-9
emps
10-49
emps
50-
249
emps
H2 2020 91% 92% 91% 91% 94%
H1 2021 93% 92% 94% 97% 96%
Successful
(if Govt
scheme)
ALL 0
emps
1-9
emps
10-49
emps
50-
249
emps
H2 2020 94% 93% 95% 95% 96%
H1 2021 95% 94% 95% 98% 97%

45% of successful applicants said that most or all of the funds they received had been spent
83BB2b All SMEs applying to main bank and getting facility 428/890/928/1035
How much of facility has been spent– all who were successful at main bank over time
Around 4 in 10 SMEs have spent all or most of
the funding they received and this remained
more likely to be the case for smaller SMEs:
23%
18%
17%
7%
13%
19%
4%
20%
15%
15%
12%
13%
24%
2%
22%
21%
14%
10%
11%
21%
31%
14%
20%
7%
7%
22%
All of it has been spent
Most of it
Half of it
A quarter of it
Very little
None of it has been spent
Not received yet
Q3 20
Q4 20
Q1 21
Q2 21
All/most
spent
0
emps
1-9
emps
10-49
emps
50-249
emps
Q3 2020 46% 35% 25% 21%
Q4 2020 35% 36% 23% 28%
Q1 2021 51% 32% 30% 36%
Q2 2021 48% 40% 39% 32%
Whilst those in Hospitality have struggled
more with the pandemic, 35% had spent all or
most of the funding obtained, compared to
60% in Agriculture sector and 53% in Transport

40% 42%38%
44%
30%
41%
25% 24%
52%60%
47% 49%43%
35%
53%
33%
46% 49%
Agric Mfg Constr Whle/Retail Hotel/Rest Trans Prop/Bus Serv Health Other Comm
H2 20 H1 21
In H1 2021, SMEs with funding in Agriculture and Transport were more likely than other sectors to have spent all or most of the funding received
84
Sector summary: Spent all or most of funding received from main bank H2 2020 and H1 2021
BB2b all SMEs asked question H1 21 109/186/361/210/200/245/367/84/201
Whilst those in Hospitality have struggled more with the pandemic, and were
somewhat more likely to have sought funding, they were less likely than their peers to
have spent all or most of the funding obtained

The impact of the pandemic on external funding
85

21%
Q14b All SMEs Q2 2021 4250 865/1403/1318/664
A fifth of SMEs were using more finance than pre-pandemic , with 1 in 10 now borrowing where they weren’t before
86
Change in use of external finance – all SMEs Q2 2021
66%71%
53%40%
57%
2%1%
2%
2%
11%10%
13%
22%
14%
3% 2%
4% 7%
14%
7% 5%
12% 18%
14%11% 10% 17% 11%
All 0 emps 1-9 emp 10-49 emps 50-249 emps
17% 33%
Using less finance
No funding/Grants/DK
Taken on extra finance
Same facilities used more
Same amount of finance
1 in 5 of all SMEs are making more use of finance than they were pre-
pandemic (6 in 10 of those using any external finance) including 1 in
10 using finance for the first time: such SMEs are typically smaller,
younger, more likely to be in a poor mood about their business and 3
in 10 are worried about how they will repay their borrowing.
36% 28%
Started borrowing
12% of all SMEs are borrowing more than
£25,000, increasing by size of SME from
7% to 43% of those with 10-49 emps. This
is twice the level reported in H1 2020 (6%)
19%
Q14b All SMEs Q2 2021 259/404/733/474/310/443/878/299/450
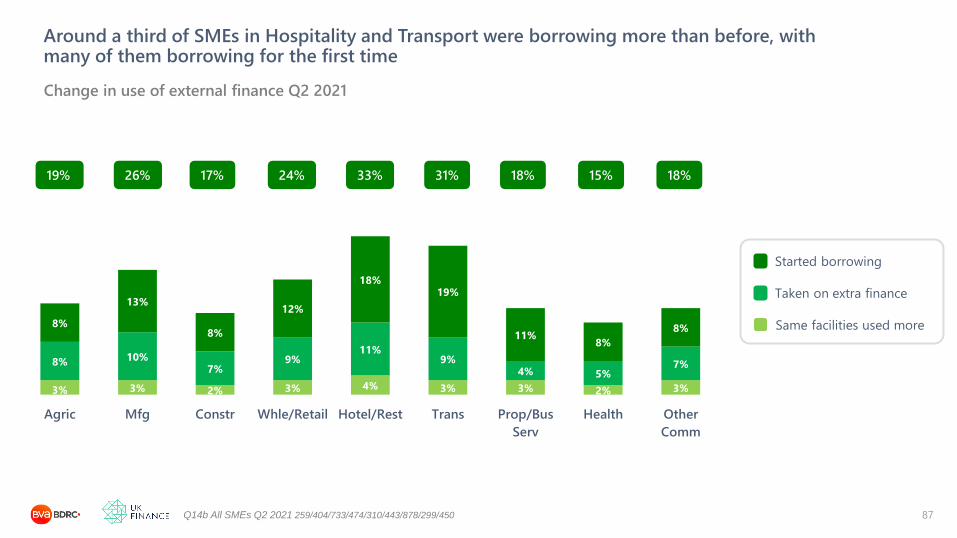
Around a third of SMEs in Hospitality and Transport were borrowing more than before, with many of them borrowing for the first time
87
Change in use of external finance Q2 2021
3% 3% 2% 3% 4% 3% 3% 2% 3%
8% 10%7%
9%11%
9%4% 5%
7%
8%
13%
8%
12%
18%19%
11%8%
8%
Agric Mfg Constr Whle/Retail Hotel/Rest Trans Prop/Bus
Serv
Health Other
Comm
26% 17%
Taken on extra finance
Same facilities used more
24% 33%
Started borrowing
31% 18% 15% 18%

Those using any form of finance were twice as likely to have spoken to their bank about pandemic funding, increasing to 7 in 10 of those who were borrowing where they weren’t before. In almost all instances this approach was for a Government backed scheme and was successful
88BB1 All SMEs using finance Q2 2021 2041 485/522/248/690
Specific approaches re funding for pandemic impact lending – by use of finance Q2 2021
78%
52%
29% 32%
70%
83%
3%
4%
4%6%
5%19%
44%
68% 62%
30%
13%
All All using finance New borrowers Extra borrowing More use of facilities Similar to before
Any approach
Considered
No plans to approach
Almost all approaches were to the main bank and in 99% of cases this was for Government backed
borrowing. 96% of applications were successful (including for first time borrowers)
18%13%
25%31%
40%
19%10%
29%
49% 46%
28%19%
43%
60% 62%
28%17%
48%
63%72%
All 0 emps 1-9 emps 10-49 emps 50-249 emps
Q1 20 Q2 20 Q4 20 Q2 21
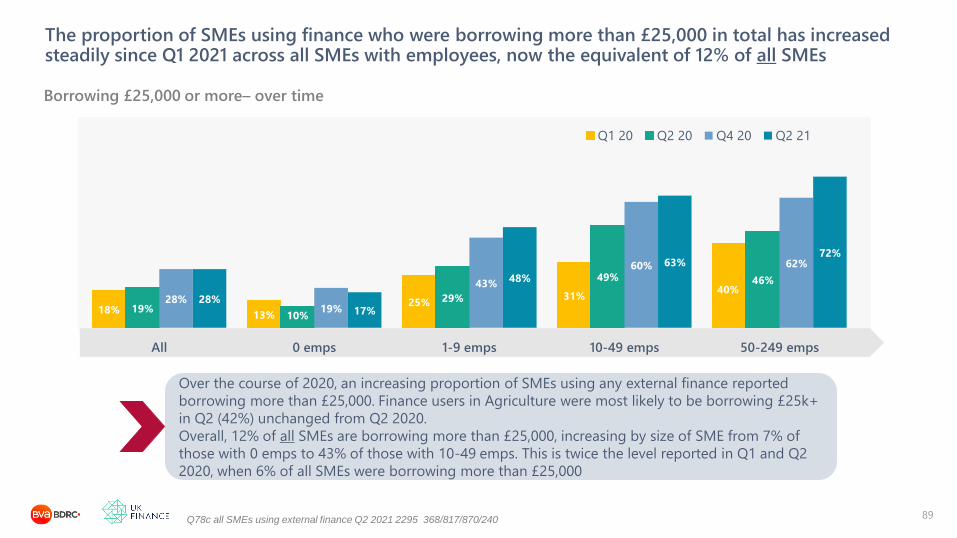
The proportion of SMEs using finance who were borrowing more than £25,000 in total has increased steadily since Q1 2021 across all SMEs with employees, now the equivalent of 12% of all SMEs
89
Borrowing £25,000 or more– over time
Q78c all SMEs using external finance Q2 2021 2295 368/817/870/240
Over the course of 2020, an increasing proportion of SMEs using any external finance reported
borrowing more than £25,000. Finance users in Agriculture were most likely to be borrowing £25k+
in Q2 (42%) unchanged from Q2 2020.
Overall, 12% of all SMEs are borrowing more than £25,000, increasing by size of SME from 7% of
those with 0 emps to 43% of those with 10-49 emps. This is twice the level reported in Q1 and Q2
2020, when 6% of all SMEs were borrowing more than £25,000

26%17% 10%
27%
27%18% 18%
28%
13%
45%
18% 17% 20%
34%23%
15% 10% 12%
43%
24%29%
36%
49%
28% 27%16% 16%
42%
28%19%
37% 35% 37%27%
10%20%
Agric Mfg Constr Whle/Retail Hotel/Rest Trans Prop/Bus Serv Health Other Comm
Q1 20 Q2 20 Q4 20 Q2 21
There was no consistent pattern by sector in the proportion of SMEs using finance who were borrowing more than £25,000 in total
90
Borrowing £25,000 or more– over time
Q78c all SMEs using external finance Q2 2021 161/218/415/259/179/254/429/128/252
As with use of external finance, there is no consistent pattern by sector – Construction and
Hospitality have seen a reduction in the proportion borrowing more than £25,000 between Q4 2020
and Q2 2021, while there has been a steady increase for those in Transport

14% 14% 15% 8%4%
29% 30% 30% 27%19%
24% 24% 25%16% 10%16% 17% 16% 9% 9%
All 0 emps 1-9 emps 10-49 emps 50-249 emps
Q1 20 Q2 20 Q4 20 Q2 21
The proportion of SMEs using finance who were concerned about their ability to repay doubled between Q1 and Q2 2020, but has declined again since, to the equivalent of 7% of all SMEs
91
Concerned about ability to repay finance over next 12 months – over time
Q78c all SMEs using external finance Q2 2021 2295 368/817/870/240
After a sharp increase in concern between Q1 and Q2 2020, levels of concern about ability to repay
have declined and in Q2 2021 were only slightly higher than they were in Q1 2020. In Q2, 28% in
Manufacturing using finance were concerned about their ability to repay, compared to 8% in
Construction, 9% in the Other Community sector and15-25% of other sectors.
This is the equivalent of 7% of all SMEs being concerned about their ability to repay, down from
10% in Q4 2020 but still higher than the 4% who were concerned in Q1 2020

21%
8% 8%20%
25%
11% 9% 14%
27%25% 26%
39%
22%
44%
29%25% 22% 24%
15% 16% 18% 15%
40%
27%
10%
25% 25%22%28%
8%19%
25% 22%15% 16%
9%
Agric Mfg Constr Whle/Retail Hotel/Rest Trans Prop/Bus Serv Health Other Comm
Q1 20 Q2 20 Q4 20 Q2 21
Compared to Q1 2020, users of finance in Manufacturing were more concerned about their ability to repay, as were those in Transport
92
Sector summary: Concerned about ability to repay finance over next 12 months – over time
Q78c all SMEs using external finance Q2 2021 161/218/415/259/179/254/429/128/252
Users of finance showed no clear pattern by sector in being concerned about their ability to repay. Taking Q1
2020 as a benchmark for Q2 2021, those in Manufacturing were more concerned than before (and the most
concerned sector), as were those in Transport and to a lesser extent Property/Business Services. By contrast,
those in the Other Community sector were now much less concerned than before.

When first asked in Q4 2020, 3 in 10 SMEs were worried about whether they had enough funding in place for their business. In Q2 2021 the proportion was lower at 2 in 10
93
Those already using external finance were more concerned about whether they had enough funding in place (27%) than
those who are not currently using external funding (19%). Levels of concern for both groups declined by size of SME.
Concern was highest in the Hospitality and Transport sectors plus the Other Community sector, and notably for those
who were already using external finance. 30% of those borrowing for the first time or who had taken on extra
borrowing were also concerned
Agree that worried will have enough funding in place to fund the business in next 6 months
Q96 Base : All SMEs Q2 2021 4252 865/1403/1318/664
30% 30% 30%
22%
14%
28% 29%27%
19%
8%
22%24%
20%
13%
8%
All SMEs 0 emps 1-9 emps 10-49 emps 50-249 emps
Q4 20 Q1 21 Q2 21

Those already using finance remained more likely to be worried that they had enough funding than those not currently using finance, but at lower levels than in Q4 (when 38% were concerned)
94
Those already using external finance were more concerned about whether they had enough funding in place (27%) than
those who are not currently using external funding (19%) with levels of concern declining by size of SME.
Finance users in the Transport, Hospitality and the Other Community sectors remained more concerned about whether
they had enough funding, but at lower levels than in Q4 2020. Amongst SMEs in Hospitality or Construction there was
no difference in levels of concern by whether they were using finance or not.
Agree that worried will have enough funding in place to fund the business in next 6 months: Q2 2021
Q96 Base : All SMEs Q2 2021 4252 865/1403/1318/664
22% 24% 20% 13% 8%
27%29%
23%
14%10%
19% 20%17%
11%
7%
All SMEs 0 emps 1-9 emps 10-49 emps 50-249 emps
Worried Use finance No finance

A third of SMEs in the Transport sector currently using finance were worried about whether they have enough funding in place (but down from half in Q4 2020)
95
Finance users in the Transport, Hospitality and the Other Community sectors remained more
concerned about whether they had enough funding, but at lower levels than in Q4 when half of
them were concerned. There was no difference in levels of concern amongst SMEs in Hospitality or
Construction by whether they were using finance or not.
Agree that worried will have enough funding in place to fund the business going forward – Q2 2021
Q96 Base : All SMEs Q2 2021 259/404/733/474/310/443/878/299/450
16% 24% 23% 24% 29% 25% 21% 18% 23%
19%
28%24%
27%30%
33%
24%27%
31%
12%
20% 22% 21%
27%
18% 19%
14%16%
Agric Mfg Constr Whle/Retail Hotel/Rest Trans Prop/Bus Serv Health Other Comm
Worried Use finance No finance

Across all lending, 1 in 10 SMEs expressed concern about being able to meet repayments. Half had already spoken, or planned to speak, to their lender
96AW1 All SMEs Q2 2021 4252 2268/1982/674
Concern about repayments – All SME equivalent Q2 2021
7%
3%
7%
3%
5%
2%
General concern
Covid fac from main bank
All 0-9 emps 10-249 empsThe equivalent of 1 in 10 of all SMEs expressing any concern
about repayments, with little difference by size, but twice as
high amongst those who reported making a loss
Any
concern
All 0-9
emps
10-249
emps
Made a
loss
Q2 2021 9% 9% 8% 19%
In Q2 2021:
• 19% of those concerned had already spoken to their
lender and a further 26% planned to. 55% had no plans
to and this was more likely to be the case for larger
SMEs (68% v 55% with 0-9 emps)
• On a small base, a third who spoke to their lender have
agreed a repayment plan and a further third are in the
process of discussing options.
• 6 in 10 of those who have agreed a plan were satisfied
with the outcome (score 7-10)

1 in 5 SMEs using finance were concerned about repaying it, increasing to almost 1 in 3 new borrowers and 1 in 4 who have taken on extra facilities
97All SMEs using finance Q2 2021 2041 485/522/248/690
Concern about repayments– by use of finance Q2 2021
9%
22%30% 26%
14% 12%
All All using finance New borrowers Extra borrowing More use of facilities Similar to before
Amongst those using finance, 22% were concerned either about repaying traditional facilities or any new
Covid related lending they had taken on, increasing to 30% of those borrowing for the first time.

12%16%
5%10%
17%14%
7% 5% 5%
Agric Mfg Constr Whle/Retail Hotel/Rest Trans Prop/Bus Serv Health Other Comm
SMEs in Hospitality, Manufacturing and Transport were the most concerned about meeting the repayments on their current borrowing
98
Sector summary: Concerned about meeting repayments (any) Q2 2021
NEW all SMEs Q2 Q78c/Qbb2bb/Qbb3bb
Those in Hospitality and Transport have struggled more with the pandemic, and those in
Transport were more likely than many of their peers to have spent all or most of the
funding obtained. These two sectors, along with Manufacturing were also more likely to
express concern about their repayments

19% had made an approach to a lender for pandemic related funding, typically to the main bank (18%) where
93% of applications had been successful (95% if they were borrowing via a Government backed scheme). 4 in
10 had spent all or most of the funds they had received from their main bank, with smaller SMEs more likely to
have done so.
Demand for finance- Key findings
99
15% of SMEs in Q2 reported a need for funding in the previous 12 months (up from 3% in 2019), which almost
all acted on. Compared to 2019, the need remained much more related to cash flow (85% v 49% in 2019) than
business development (19% v 58% in 2019) and there was more consideration of, and then applications to, the
main bank (66% v 29% in 2019). 19% of SMEs reported any borrowing event, still at the higher level seen since
Q3 2020
88% of all applications made from Q1 2021 to date were successful, up from 71% in the 18 months to Q4
2019. Success rates for bank loans increased from 61% Q118-Q219 to 89% Q120-Q221, moving them ahead of
bank overdrafts where success rates were somewhat lower than previously (66% in the current period v 76%
Q118-Q219).
21% of all SMEs were borrowing more than pre-pandemic, including 11% who were new borrowers. 12% of all
SMEs were borrowing more than £25,000, up from 6% in the first half of 2020 and 9% were concerned about
their ability to repay any of the borrowing they have (including Government back facilities)
Today’s presentation
100
The trading context
External funding: attitudes to and use of, alongside alternatives
Demand for finance: need, applications and impact of Covid
The future: growth, barriers and future appetite for finance
The immediate impact of Covid 19

26% 25% 22% 20% 8% 7%
Reduce carbon
footprint
Take on staff Invest in
plant/mach/prem
Develop new
product/service
Other major
expenditure
Sell (more)
overseas
56% of SMEs were planning some activity related to growth, with a quarter planning to reduce their carbon footprint significantly
101
How will achieve growth – Q 2021
Q90 all SMEs Q2 2021 4250 865/1403/1318/664
All SMEs
In Q2 2020 the proportion of SMEs planning growth related activities ranged from 52% of those with 0 employees to
75% of those with 10-49 or 50-249 employees (and was also higher amongst those with a plan to grow at 75%) The
proportion planning to significantly reduce their carbon footprint also increased by size, from 25% to 43% and was
higher for younger businesses and those in Agriculture, Wholesale/Retail and Hospitality
43%
39%
31%
25%
50-249 emps
10-49 emps
1-9 emps
0 emps
51%
52%
38%
20%
35%
35%
25%
20%
22%
25%
21%
20%
17%
16%
11%
7%
13%
11%
7%
7%
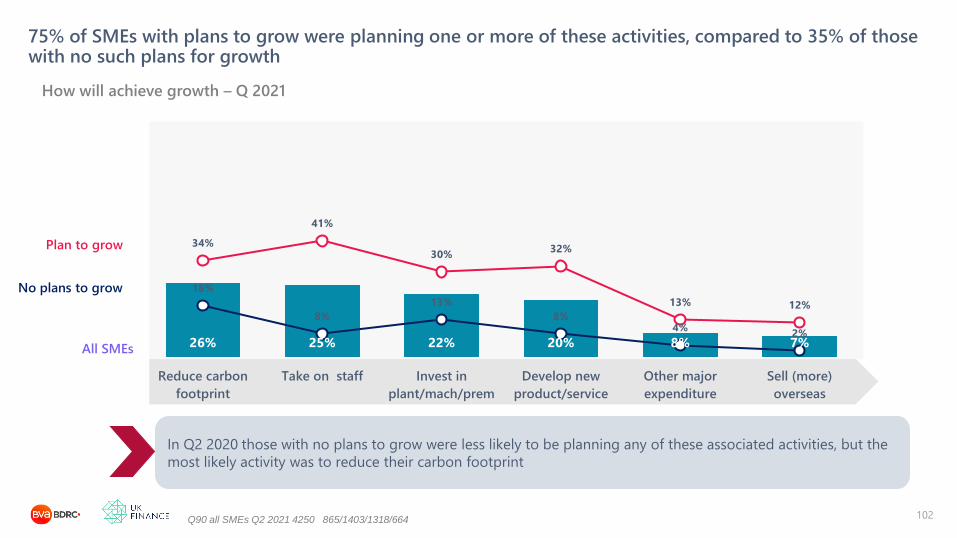
26% 25% 22% 20% 8% 7%
34%
41%
30%32%
13% 12%
18%
8%
13%
8%4%
2%
Reduce carbon
footprint
Take on staff Invest in
plant/mach/prem
Develop new
product/service
Other major
expenditure
Sell (more)
overseas
75% of SMEs with plans to grow were planning one or more of these activities, compared to 35% of those with no such plans for growth
102
How will achieve growth – Q 2021
Q90 all SMEs Q2 2021 4250 865/1403/1318/664
All SMEs
In Q2 2020 those with no plans to grow were less likely to be planning any of these associated activities, but the
most likely activity was to reduce their carbon footprint
No plans to grow
Plan to grow

Initial data suggests those in Agriculture, Wholesale/Retail and Hospitality were most likely to be looking to reduce their carbon footprint
103
Other analysis shows that younger business are the most likely to have plans to reduce
their carbon footprint (33% of Starts) reducing by age to 23% of those trading for more
than 15 years
Sector summary: Plan to significantly reduce carbon footprint
Q93 Base : All SMEs
35% 33%
24%
34% 34%
27%22% 22%
29%
Agric Mfg Constr Whle/Retail Hotel/Rest Trans Prop/Bus Serv Health Other Comm
Q2 21
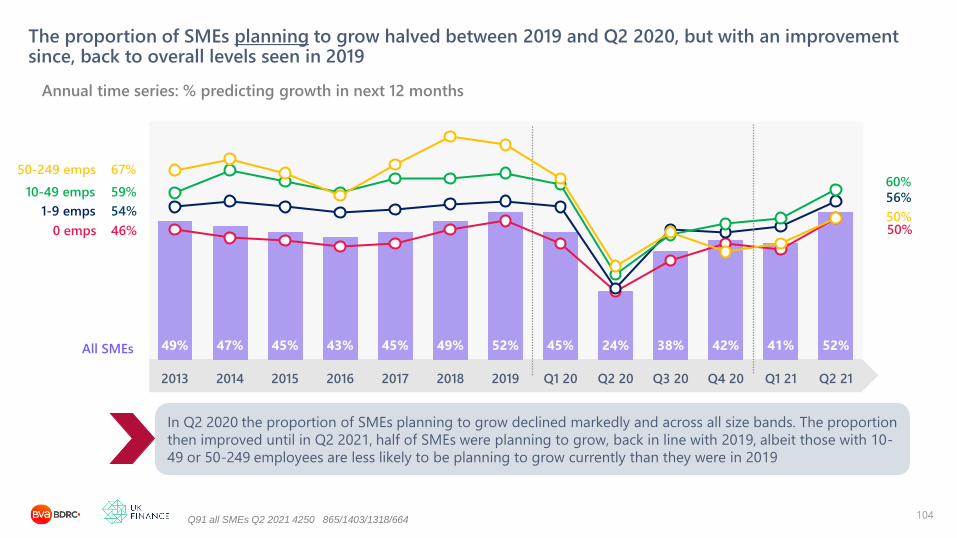
The proportion of SMEs planning to grow halved between 2019 and Q2 2020, but with an improvement since, back to overall levels seen in 2019
104
Annual time series: % predicting growth in next 12 months
Q91 all SMEs Q2 2021 4250 865/1403/1318/664
50-249 emps
10-49 emps
1-9 emps
0 emps
All SMEs
In Q2 2020 the proportion of SMEs planning to grow declined markedly and across all size bands. The proportion
then improved until in Q2 2021, half of SMEs were planning to grow, back in line with 2019, albeit those with 10-
49 or 50-249 employees are less likely to be planning to grow currently than they were in 2019
50%
60%
56%
50%
67%
59%
54%
46%
49% 47% 45% 43% 45% 49% 52% 45% 24% 38% 42% 41% 52%
2013 2014 2015 2016 2017 2018 2019 Q1 20 Q2 20 Q3 20 Q4 20 Q1 21 Q2 21

46%
52%
44%
61%
53%
48%52%
62%
51%
27%
20% 19%
31%
19% 19%
27%25%
29%
34% 34% 33%
58%
37%34%
45%
54%
47%49%
52%
45%49%
55%51%
56%60%
49%
Agric Mfg Constr Whle/Retail Hotel/Rest Trans Prop/Bus Serv Health Other Comm
2019 Q2 20 Q4 20 Q2 21
With the exception of Wholesale/Retail, growth ambitions in Q2 2021 were back in line with 2019
105
Sector summary: Plan to grow – over time
Q91 all SMEs Q2 2021 259/404/733/474/310/443/878/299/450
After a strong Q4 2020, those in Wholesale/Retail were less likely to be expecting to grow in Q1-2
2021 and are now the only sector not matching the growth ambitions reported in 2019
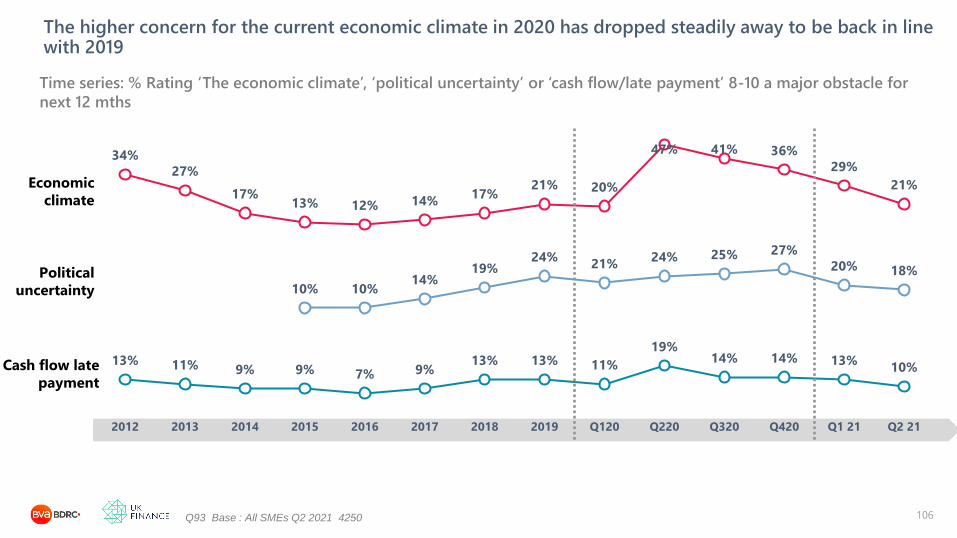
The higher concern for the current economic climate in 2020 has dropped steadily away to be back in line with 2019
106
Time series: % Rating ‘The economic climate’, ‘political uncertainty’ or ‘cash flow/late payment’ 8-10 a major obstacle for
next 12 mths
Q93 Base : All SMEs Q2 2021 4250
34%
27%
17%13% 12% 14%
17%21% 20%
47% 41% 36%
29%
21%Economic
climate
10% 10%14%
19%24%
21%24% 25% 27%
20% 18%Political
uncertainty
13% 11% 9% 9% 7% 9%13% 13% 11%
19%14% 14% 13%
10%
2012 2013 2014 2015 2016 2017 2018 2019 Q120 Q220 Q320 Q420 Q1 21 Q2 21
Cash flow late
payment

14% 17% 21% 20% 47% 41% 36% 29% 21%
2017 2018 2019 Q1 20 Q2 20 Q3 20 Q4 20 Q1 21 Q2 21
14% 19% 24% 21% 24% 25% 27% 20% 18%
2017 2018 2019 Q1 20 Q2 20 Q3 20 Q4 20 Q1 21 Q2 21
The marked increase in concern about the economic climate in Q2 2021 was not maintained for any size of SME and all saw lower levels of concern around political uncertainty
107
Time series: 8-10 major barriers– by size of SME
Q93 Base : All SMEs Q2 2021 4252 865/1403/1318/664
All SMEs
Levels of concern about the economic climate increased markedly to Q2 2020 (47%) and across all
size bands. This was not maintained, and by Q2 2021 was back more in line with 2019.
Concern about political uncertainty on the other hand declined slightly in Q1 2020 (post election),
and then increased slightly to 27% in Q4 (pre Brexit deal) for all but the largest SMEs, but again this
was not maintained into 2021
Current economic
climatePolitical uncertainty
50-249 emps
10-49 emps
1-9 emps
0 emps
22%21%
11%
14%
16%
13%
13%
15%17%
14%15%
13%
18%
9%
18%
13%

SMEs in the Transport sector continued to have the highest levels of concern about the economic climate, while those in Agriculture faced more political uncertainty
108
The current economic climate was more of a barrier for those in Transport and also
Hospitality and Wholesale/Retail. Those in Agriculture were somewhat less concerned,
but were more concerned about political uncertainty
Sector summary: % 8-10 barrier Q2 2021
Q93 Base : All SMEs Q4 2020 256/423/683/463/298/443/914/319/453
16% 15% 13%
24% 23%
34%
20% 20% 21%25%
10%16% 18% 20% 20%
17% 16%20%
Agric Mfg Constr Whle/Retail Hotel/Rest Trans Prop/Bus Serv Health Other Comm
Economic climate Political uncertainty
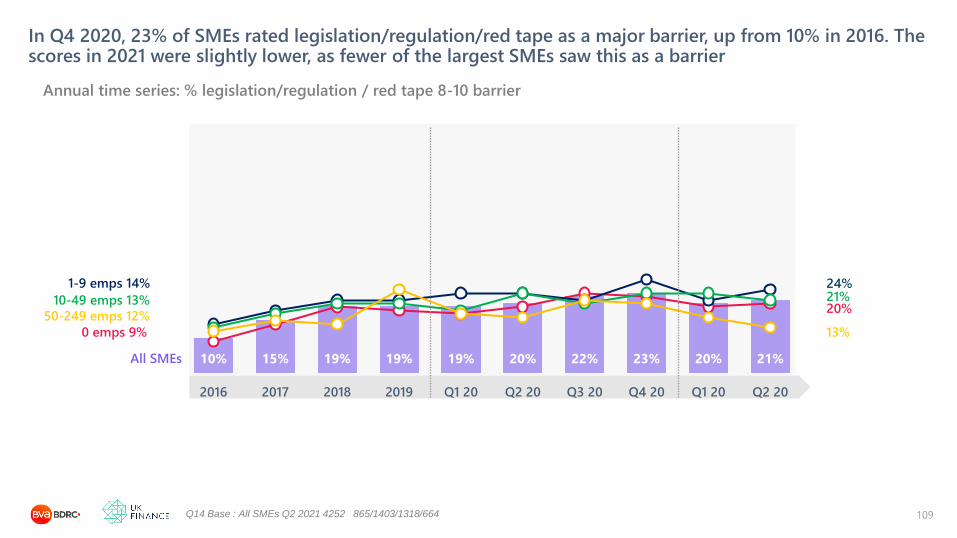
10% 15% 19% 19% 19% 20% 22% 23% 20% 21%
2016 2017 2018 2019 Q1 20 Q2 20 Q3 20 Q4 20 Q1 20 Q2 20
In Q4 2020, 23% of SMEs rated legislation/regulation/red tape as a major barrier, up from 10% in 2016. The scores in 2021 were slightly lower, as fewer of the largest SMEs saw this as a barrier
109
Annual time series: % legislation/regulation / red tape 8-10 barrier
Q14 Base : All SMEs Q2 2021 4252 865/1403/1318/664
50-249 emps 12%
10-49 emps 13%
1-9 emps 14%
0 emps 9%
All SMEs
13%
21%24%
20%

All sectors saw an increase in this barrier over time, with those in Agriculture the most likely to see it as a barrier
110
Hospitality and Transport, who are struggling more generally, are somewhat more likely
to see this as a barrier, alongside Agriculture
Sector summary: % legislation/regulation / red tape 8-10 barrier
Q93 Base : All SMEs
17%
9% 10% 10%15%
12%9% 9% 7%
28%
18% 18%23%
26% 26%21% 23%
20%
Agric Mfg Constr Whle/Retail Hotel/Rest Trans Prop/Bus Serv Health Other Comm
2016 YEQ2 21

22%26%
20% 23%27%
32% 29%
39%31%
36%
76%72%
78% 74%71%
65% 69%57%
66%63%
1% 2% 1% 2% 2% 3% 2% 4% 3% 2%
Q1 21 Q2 21 Q1 21 Q2 21 Q1 21 Q2 21 Q1 21 Q2 21 Q1 21 Q2 21
7 in 10 SMEs said the end of the transition period and the new EU trade deal had not impacted their business. For those affected this was much more likely to be a negative impact than a positive one
111
Time series: Impact of the end of the transition period
Q84c all SMEs excl DK Q2 2021 4158
Positive
No effect
Negative
All SMEs 0 emps 1-9 emps 10-49 emps 50-249 emps

In Q2, almost half of SMEs in Wholesale/Retail identified a negative impact, while those in Agriculture, Manufacturing and Construction were more likely to identify negative impacts to the new trade deal in Q2 than in Q1 2021
112
There is no clear pattern by sector over time – The proportion in Agriculture saying the end of
the transition period had negatively affected their business doubled between Q1 and Q2 2021,
but reduced slightly for those in the Transport sector and Health
Sector summary: A negative impact to end of transition period
Q84c Base : All SMEs Q2 2021 excl Dk 249/392/725/463/300/431/856/299/443
18%
33%
17%
39%
17%
24%
18% 20% 21%
36%
43%
29%
47%
17% 18%22%
14%
22%
Agric Mfg Constr Whle/Retail Hotel/Rest Trans Prop/Bus Serv Health Other Comm
Q1 21 Q2 21
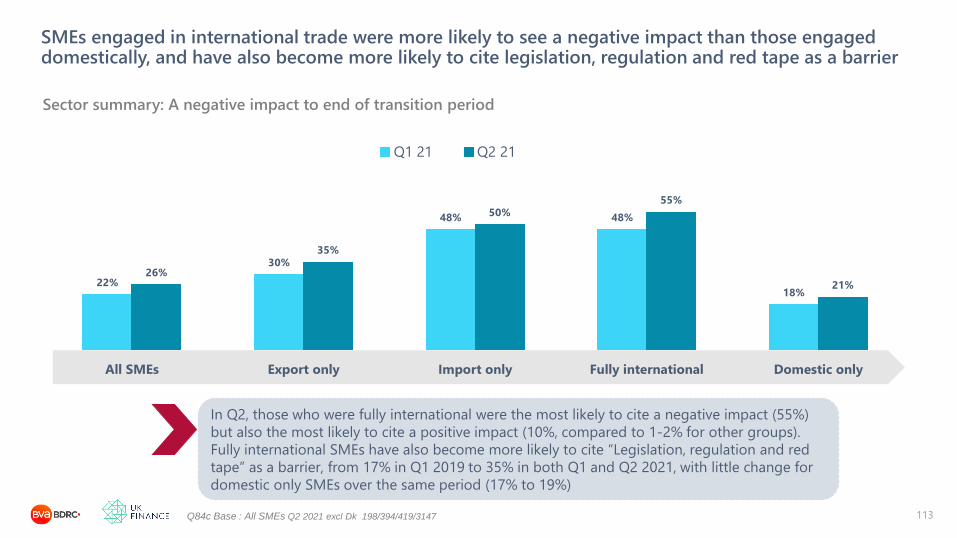
SMEs engaged in international trade were more likely to see a negative impact than those engaged domestically, and have also become more likely to cite legislation, regulation and red tape as a barrier
113
In Q2, those who were fully international were the most likely to cite a negative impact (55%)
but also the most likely to cite a positive impact (10%, compared to 1-2% for other groups).
Fully international SMEs have also become more likely to cite “Legislation, regulation and red
tape” as a barrier, from 17% in Q1 2019 to 35% in both Q1 and Q2 2021, with little change for
domestic only SMEs over the same period (17% to 19%)
Sector summary: A negative impact to end of transition period
Q84c Base : All SMEs Q2 2021 excl Dk 198/394/419/3147
22%
30%
48% 48%
18%
26%
35%
50%55%
21%
All SMEs Export only Import only Fully international Domestic only
Q1 21 Q2 21

“Impact of the pandemic” was the top barrier for those who saw a negative impact to leaving the EU
114
Main barriers (8-10) to running business in next 12 months by impact of Brexit H1 21:
Q93 Barriers to running business as would want in next 12 months
Base : All SMEs H1 2021 8513 184/2433
38%
18%
18%
21%
6%
22%
13%
15%
8%
50%
29%
30%
28%
15%
12%
17%
11%
9%
Impact of pandemic
The current economic climate
Legislation,regulation, red tape
Political uncertainty/future govt policy
Cash flow / late payment
Recruiting and retaining staff
Changes in value of sterling
Access to external finance
Availablity of relevant advice
Positive impact
Negative impact
Those who reported a negative impact to leaving
the EU were more likely to see the pandemic as a
barrier, along with the economic climate,
legislation/regulation, political uncertainty and
cash flow/late payment.
Those who reported a positive effect were more
likely to cite staff as a barrier
64% of those who saw a positive impact to leaving
the EU were planning to grow, compared to 55%
who saw a negative impact and 34% of those who
weren’t sure what the impact would be

80% 84% 83% 83% 85% 83% 84% 80% 77% 76% 78% 76% 76% 78% 77% 78% 77%
60% 65% 60% 65%72%
3%2% 2% 2% 1% 1% 1%
2% 3% 4% 3% 11% 13% 10% 13% 11% 13%
23%23%
25%22%
19%
17% 13% 15% 14% 13% 15% 14% 18% 19% 20% 19%13% 12% 12% 10% 11% 11%
16%12% 14% 13% 9%
2015 2016 2017 2018 2019 Q1 20 Q2 20 Q3 20 Q4 20 Q1 21 Q2 21 2015 2016 2017 2018 2019 Q1 20 Q2 20 Q3 20 Q4 20 Q1 21 Q2 21
While the increase in past borrowing events in 2020 was maintained into 2021, the increase seen in future appetite for finance in 2021 has declined somewhat but remained ahead of pre-pandemic levels
115Pastfin Base : All SMEs Q4 2020 4252
Annual time series: Borrowing profile past and future
Looking forward, from Q2 2020 more SMEs showed an appetite for finance and in particular expect to be
a “Future would-be seeker” of finance, than has typically been the case, albeit levels are somewhat lower
in H1 2021 than in the latter half of 2020
Past events Future plans
Had any event Would be seekers Happy non-seekers

SMEs with 1-9 or 10-49 employees were more likely to report a past borrowing event with the 0 employee SMEs the most likely to have a future appetite for finance
116Pastfin and Futfin Base : All SMEs Q2 2021 4250 865/1403/1318/664
Borrowing profile past and future by size of SME Q4
Past events Future plans
Had any event Would be seekers Happy non-seekers
78% 79% 73% 74%88%
72% 70% 75% 77%85%
3% 3%3% 1%
19% 21% 15% 14%10%19% 18%
24% 25%12% 9% 9% 10% 9% 4%
All 0 emps 1-9 emps 10-49
emps
50-249
emps
All 0 emps 1-9 emps 10-49
emps
50-249
emps
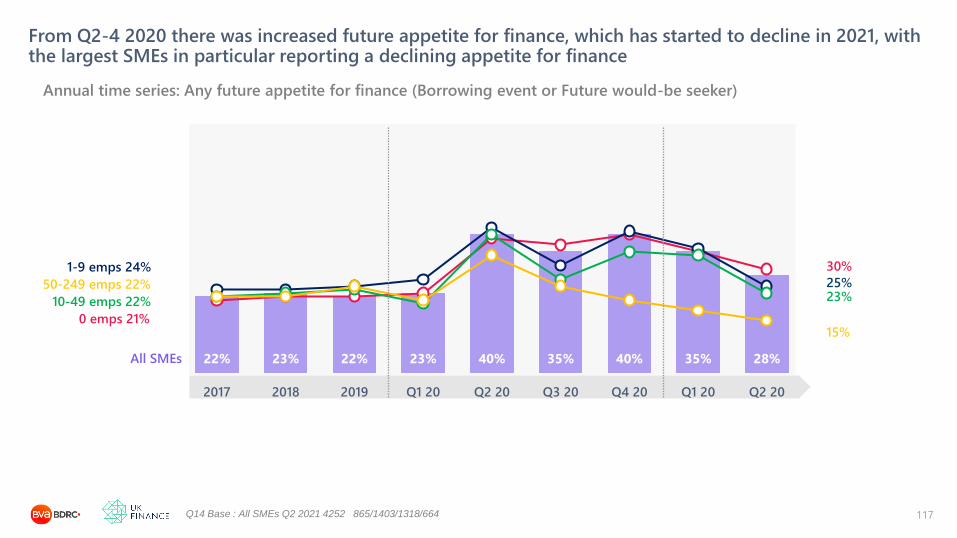
22% 23% 22% 23% 40% 35% 40% 35% 28%
2017 2018 2019 Q1 20 Q2 20 Q3 20 Q4 20 Q1 20 Q2 20
From Q2-4 2020 there was increased future appetite for finance, which has started to decline in 2021, with the largest SMEs in particular reporting a declining appetite for finance
117
Annual time series: Any future appetite for finance (Borrowing event or Future would-be seeker)
Q14 Base : All SMEs Q2 2021 4252 865/1403/1318/664
50-249 emps 22%
10-49 emps 22%
1-9 emps 24%
0 emps 21%
All SMEs
15%
23%25%
30%

75% 76% 76% 76% 77% 73% 79% 83% 82%70% 72% 72% 70% 71% 66%
77% 73%63%
3% 4% 2% 2% 2% 4%3%
6% 3%17% 15% 20% 19% 20% 25%
15% 18%25%
22% 20% 22% 22% 21% 23% 17%11% 15% 13% 13% 8% 11% 9% 9% 8% 8% 11%
Ag
ric
Mfg
Co
nst
r
W/R
et
H/R
est
Tra
ns
Pro
p/B
S
Healt
h
Oth
er
Co
m
Ag
ric
Mfg
Co
nst
r
W/R
et
H/R
est
Tra
ns
Pro
p/B
S
Healt
h
Oth
er
Co
m
Future appetite remained higher than past appetite across sectors, but more of the future appetite was amongst “Would be seekers”, especially in Transport and the Other Community sector
118Pastfin
Base : All SMEs Q2 2021 259/404/733/474/310/443/878/299/450
Borrowing profile past and future by sector Q2 2021
All sectors showed a higher future appetite for finance in Q2 2021 than past appetite, with many
more Future would-be seekers than seen in the past year, notably in Transport and the Other
Community sector, with the latter reporting a lower past appetite for finance along with those in
Health and to a certain extent Property/Business Services
Past events Future plans
Had/Plan any event Would be seekers Happy non-seekers

Past Would-be seekers cited the process of borrowing as the main barrier. Looking forward, most FWBS mentioned the current climate as a barrier, with more mentions in Q2 of their own performance
119Q32/77 Q104/105
Base : All “would be seekers” 225 / 643
Main reason for not seeking borrowing – All “Would-be seekers” YEQ2 21 and Q2 21
Main reason for not applying:
Discouraged: had asked informally but felt
put off, or assumed would be turned down
Process: think it’s too expensive, too much
hassle, needs security
Principle: prefer not to lose control, or can
get funds elsewhere: no longer includes
“prefer not to borrow”
Climate: felt it was not the right time to
borrow in the current economic climate
2% of SMEs were “Would
be seekers” of finance
26%
38%
15%
6%
(22% indirect v
6% direct)
19% of SMEs were “Future
would be seekers” of finance
9%
8%
5%
75%
(8% indirect v
<1% direct)
(50% economic
climate, 24%
performance)

2013 2014 2015 2016 2017 2018 2019 Q1 20 Q2 20 Q3 20 Q4 20 Q1 21 Q2 21
‘Reluctance to borrow now’ remained the key barrier for future applications
120
Annual time series: Main reason for not seeking borrowing amongst future “would-be seekers”
Q239a “Principle of borrowing” no longer includes “prefer not to borrow”
Base : All future “would be seekers” Q2 2021 643
A ‘reluctance to borrow now’ was the main barrier for 75% of FWBS in Q2 2021, remaining
above the 50% in 2017 and 63% in 2019, albeit down slightly from 82% in Q2 2020. It remained
ahead of discouragement which has been mentioned slightly less over time (22% in 2017 to 12%
in 2019 and 9% in Q2 2021) as more people focussed on the economic climate
Reluctant to
borrow now
Process
Discouraged
Principle
9%8%5%
75%64%
14%
13%
3%
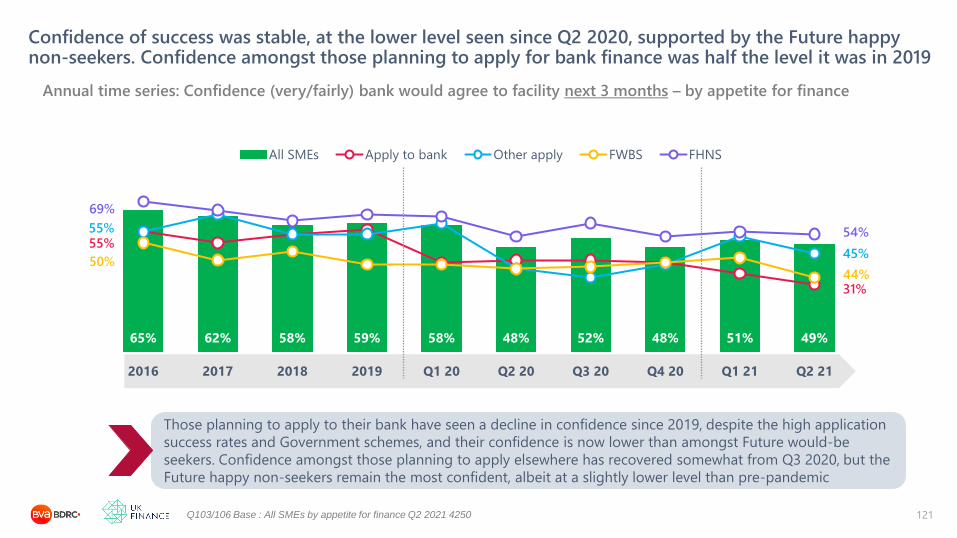
65% 62% 58% 59% 58% 48% 52% 48% 51% 49%
2016 2017 2018 2019 Q1 20 Q2 20 Q3 20 Q4 20 Q1 21 Q2 21
All SMEs Apply to bank Other apply FWBS FHNS
Confidence of success was stable, at the lower level seen since Q2 2020, supported by the Future happy non-seekers. Confidence amongst those planning to apply for bank finance was half the level it was in 2019
121
Annual time series: Confidence (very/fairly) bank would agree to facility next 3 months – by appetite for finance
Q103/106 Base : All SMEs by appetite for finance Q2 2021 4250
69%
50%
55%55%
54%
44%
45%
31%
Those planning to apply to their bank have seen a decline in confidence since 2019, despite the high application
success rates and Government schemes, and their confidence is now lower than amongst Future would-be
seekers. Confidence amongst those planning to apply elsewhere has recovered somewhat from Q3 2020, but the
Future happy non-seekers remain the most confident, albeit at a slightly lower level than pre-pandemic

There was a marked increase in any future appetite for finance from 24% in Q1 2020 to 39% in Q2 2020, when
16% planned to apply for finance. Since then, the proportion planning to apply has declined somewhat to 9%
of SMEs in Q2 2021, now more in line with pre-pandemic levels. Despite the increase in application success
rates, fewer SMEs thought they would be successful if they were to apply (49% in Q2 2021 compared to 59%
in 2019), and this was notably the case for those planning to apply to their bank (31%)
The future- Key findings
122
Over half of SMEs (52%) were planning to grow, back to levels seen in 2019 and twice as high as the level seen
in Q2 2020. 56% were planning any growth related activity, including a quarter planning to take on more staff,
while the same proportion were trying to reduce their carbon footprint
Aside from the pandemic, the current economic climate remained a key barrier, but to a much lesser extent
in Q2 2021 (21%) than in Q2 2020 (47%). Concerns around political uncertainty had also decreased (to 18%)
but over time there has been an increase in the proportion seeing “legislation, regulation and red-tape” as a
barrier (21% in Q2 2021). In Q2 2021, 26% of SMEs said that leaving the EU had had a negative impact,
increasing to 55% of those that both import and export

Covid impact: The regional picture
123

All SMEs: Plan to apply/plan to grow/good mood about business/worst is behind us/income stable or
increased/focus on future/future offers opportunities
Based on their experiences in 2020, SMEs in Y&H, the East of England and the South West were more positive about 2021 across 7 metrics, those in London less so
124
Future prospects v average from Annual Report 2020
1
3
2
1
2
1 1 1
5
3
4
4
3
6
2
5
5
6
1 1
1
4
2 2
5
2
5 5
1
Scotland Wales NI NE Y&H NW W Mids E Mids East SW Lon SE
Less positive
The same as
More positive

196% 207%189% 199% 194%
227%189% 189% 183%
209% 218%183% 190%
260%235% 245% 247%
264% 255%273% 263% 265% 270% 264%
238%270%
England Scotland Wales NI NE Y&H NW W Mids E Mids East SW Lon SE
Q4 20 Q2 21
London remained below average in Q2 2021, now joined by Scotland. Y&H and the South West did not improve as much in Q2 21 as their peers, while the improvement in the East was closer to the average
125
Positive future impact summary score
All SMEs: Total score of plan to grow/ good business mood/ Income to be stable or increased/ future offers opportunities / not worried about
having enough funding for next months
Q420
Q221
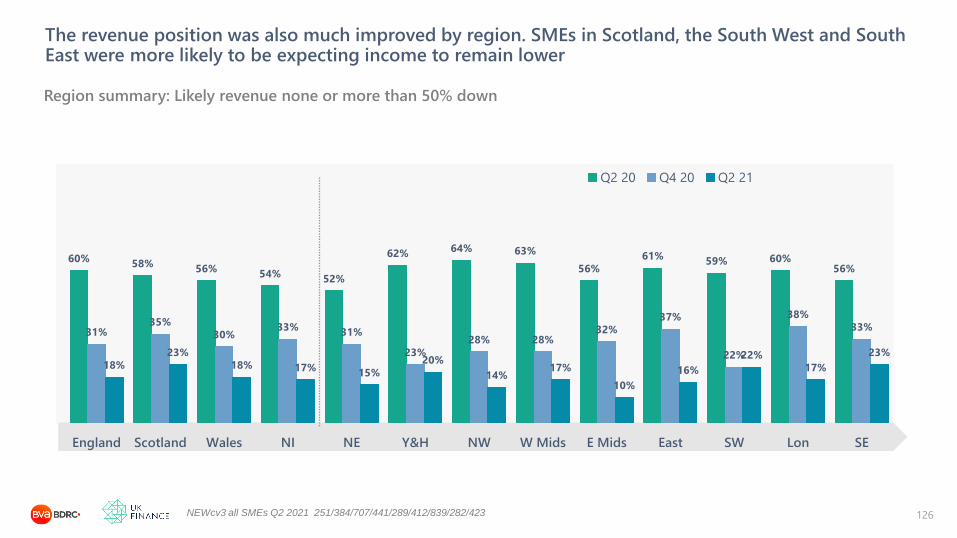
60%58%
56%54%
52%
62%64% 63%
56%
61%59% 60%
56%
31%35%
30%33%
31%
23%
28% 28%32%
37%
22%
38%
33%
18%
23%
18% 17%15%
20%
14%17%
10%
16%
22%
17%
23%
England Scotland Wales NI NE Y&H NW W Mids E Mids East SW Lon SE
Q2 20 Q4 20 Q2 21
The revenue position was also much improved by region. SMEs in Scotland, the South West and South East were more likely to be expecting income to remain lower
126
Region summary: Likely revenue none or more than 50% down
NEWcv3 all SMEs Q2 2021 251/384/707/441/289/412/839/282/423
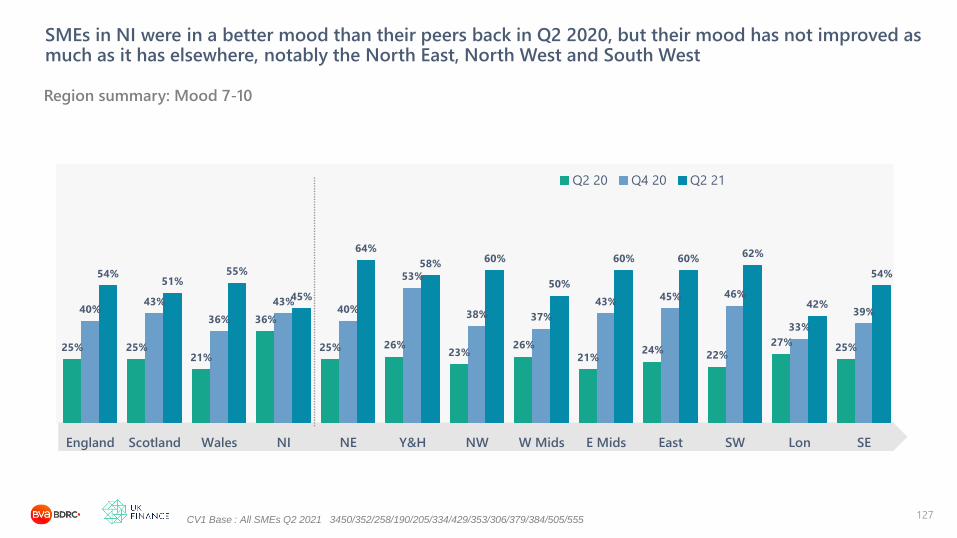
25% 25%21%
36%
25% 26%23%
26%
21%24%
22%
27%25%
40%43%
36%
43%40%
53%
38% 37%
43%45% 46%
33%
39%
54%51%
55%
45%
64%
58%60%
50%
60% 60%62%
42%
54%
England Scotland Wales NI NE Y&H NW W Mids E Mids East SW Lon SE
Q2 20 Q4 20 Q2 21
SMEs in NI were in a better mood than their peers back in Q2 2020, but their mood has not improved as much as it has elsewhere, notably the North East, North West and South West
127
Region summary: Mood 7-10
CV1 Base : All SMEs Q2 2021 3450/352/258/190/205/334/429/353/306/379/384/505/555

SMEs across the regions were less likely to see the pandemic as a barrier than they were, but the improvement has plateaued in Scotland, London and the South West
128
5 in 10 SMEs in Scotland and London still see the pandemic as a major barrier to their
business, compared to fewer than 4 in 10 in the North West, East Midlands and East of
England.
Region summary: % “Impact of pandemic” 8-10 barrier over time
Q93 Base : All SMEs Q2 2021 3450/352/258/190/205/334/429/353/306/379/384/505/555
68% 69% 67% 68%72%
63%
74% 74%69% 67% 66% 64%
67%
51%54%
58%
33%
47%
34%
56%52%
55%50% 48%
55% 53%
44%
52%
45%41%
45% 44%
38%41%
37% 38%
45%
52%
46%
England Scotland Wales NI NE Y&H NW W Mids E Mids East SW Lon SE
Q2 20 Q4 20 Q2 21

3% 3%5% 4% 3% 2% 2%
4% 4% 3% 3% 2% 3%
7% 6%
11%15%
15%
5%7%
10%7%
5% 6%6%
6%
12%10%
11%8%
15%
11%
12%
12%
10%
10% 9%13% 11%
England Scotland Wales NI NE Y&H NW W Mids E Mids East SW Lon SE
Q14b All SMEs Q2 2021 259/404/733/474/310/443/878/299/450
A third of SMEs in the North East were borrowing more than previously, half of whom had started borrowing in the pandemic
129
Change in use of external finance Q2 2021
Taken on extra finance Same facilities used moreStarted borrowing
22% 19% 27% 27% 33% 18% 21% 26% 21% 18% 18% 21% 20%

20%24%
21%17% 16%
24% 22%26% 25%
13% 15%19% 19%
22%
34%30%
15% 13%
25%
31%
17%
25%
19% 18%23%
20%19%
12%
29%
21%
32%
18%23% 25%
17%14%
23%20%
14%
England Scotland Wales NI NE Y&H NW W Mids E Mids East SW Lon SE
Q3 20 Q4 20 Q2 21
SMEs in the North East were much more likely to report an approach for pandemic related funding in Q2 2021, along with SMEs in Wales, both twice as likely as SMEs in the East or South East
130
Region summary: Pandemic impact lending– Any approach from Q3 2020 to Q2 2021
BB1 all SMEs Q2 2021 3450/352/258/190 205/334/429/353/306/379/384/505/555
In Q2 2021, a third of SMEs in the North East, who are also more likely to be
borrowing more than previously, reported having made an application for pandemic
related funding.

52%50% 50%
60%
54%50%
54%
46%
51%
45%
51%
57%
51%
24% 23%
31%28%
18%20%
25% 26%22%
28% 29%26%
19%
42% 42%
47%
36%32%
47% 48%44% 43%
38%36%
47%
38%
52%
46%49%
54%
44%42%
53%50%
47%
53%
46%
59%55%
England Scotland Wales NI NE Y&H NW W Mids E Mids East SW Lon SE
2019 Q2 20 Q4 20 Q2 21
Most regions were back close to, or slightly ahead of, their 2019 growth aspirations, with the exception of the North East and Y&H (down 10 points and 8 points) and the East of England (up 8 points)
131
Regional summary: Plan to grow – over time
Q91 all SMEs Q2 2021 3450/352/258/190 205/334/429/353/306/379/384/505/555
After a sharp decline in Q2 2021, growth aspirations have recovered well, back to 2019 levels in most
cases. Half plan to grow, with the exception of the North East, Y&H and the South West, increasing to
59% in London

Final thoughts
132

• SMEs are, by nature, positive and this is reflected in the improving business sentiment and growth ambitions, albeit
supported by both the pandemic and the wider economy becoming less of a barrier and fewer fearing their income will
be significantly reduced over the coming months
• 1 in 5 is now using more finance than before, including 1 in 10 borrowing where they weren’t before and the proportion
of those using finance who are borrowing more than £25,000 has also increased (28% of those using finance, up from
18% earlier in 2020)
• A quarter of all SMEs are worried they do not have enough funding to get through the coming months and the
equivalent of 1 in 10 is worried about repaying all the finance they currently have (including Covid related funding)
• With a year’s grace before repayments start on Government back facilities, the coming quarters will provide more
information on how these SMEs are feeling about the finance they have and need to repay and the extent to which that
might impact on confidence and future plans
Sentiment is improving, but it is not yet clear what impact the additional finance taken will have
133

Looking forward, whilst sentiment is getting stronger, those with 1-9 employees are potentially more vulnerable to the additional borrowing they have taken on
Q2 2021 All 0
emps
1-9
emps
10-49
emps
50-249
emps
Made a profit 60% 57% 66% 75% 80%
Innovative 43% 41% 48% 62% 61%
£10k+ credit balances 31% 23% 56% 86% 95%
Access to Business Funding 76% 73% 84% 91% 64%
Mood 7-10 54% 51% 59% 75% 70%
Declined in size 60% 61% 59% 48% 42%
Taken out extra borrowing 21% 17% 33% 36% 28%
Worried about ability to repay 9% 8% 11% 10% 3%
Expect income to be reduced 19% 20% 14% 6% 5%
Might not have enough funding 22% 24% 20% 13% 8%
134

BDRC is certified to ISO 20252 and 27001, the recognised international quality standards for market research and information
security.
• Adherence to the standard is independently audited once per year.
• Where subcontractors are used by BDRC, they are assessed to ensure any outsourced parts of the research are conducted
in adherence to ISO 20252 and 27001.
All work will be carried out in conformity to these standards, the MRS Code of Conduct, and all relevant legal requirements
Quality Standards and Other Details
136


