Q2 2019 Financial Statements - ENGLISH
78
Transcript of Q2 2019 Financial Statements - ENGLISH


Innergex Renewable Energy Inc. is a leading Canadian independent renewable power producer. Active since 1990, the Corporation develops, acquires, owns and operates hydroelectric facilities, wind farms and solar farms and carries out its operations in Canada, the United States, France and Chile. The Corporation’s shares are listed on the Toronto Stock Exchange under the symbols INE, INE.PR.A and INE.PR.C and its convertible debentures are listed under the symbols INE.DB.A and INE.DB.B.
Innergex’s mission is to increase its production of renewable energy by developing and operating high-quality facilities while respecting the environment and balancing the best interests of the host communities, its partners and its investors.
MANAGEMENT'S DISCUSSION AND ANALYSIS
This Management's Discussion and Analysis (“MD&A”) is a discussion of the operating results, cash flows and financial position of Innergex Renewable Energy Inc. (“Innergex” or the “Corporation”) for the three- and six-month periods ended June 30, 2019, and reflects all material events up to August 13, 2019, the date on which this MD&A was approved by the Corporation's Board of Directors.
The MD&A should be read in conjunction with the unaudited condensed interim consolidated financial statements and the accompanying notes for the three- and six-month periods ended June 30, 2019.
The unaudited condensed interim consolidated financial statements attached to this MD&A and the accompanying notes for the three- and six-month periods ended June 30, 2019, along with the 2018 comparative figures, have been prepared in accordance with International Financial Reporting Standards (“IFRS”). However, some measures referred to in this MD&A are not recognized measures under IFRS and therefore may not be comparable to those presented by other issuers. Please refer to the "Non-IFRS Measures" section for more information.
All dollar amounts are in thousands of Canadian dollars, except amounts per share or unless otherwise indicated. Some amounts included in this MD&A have been rounded to make reading easier, which may affect some calculations.
To inform readers of the Corporation's future prospects, this MD&A contains forward-looking information within the meaning of applicable securities laws (“Forward-Looking Information”). Please refer to the "Forward-Looking Information" section for more information.
Additional information relating to Innergex, including its Annual Information Form, can be found on the Canadian Securities Administrators' System for Electronic Document Analysis and Retrieval (“SEDAR”) at sedar.com or on the Corporation's website at innergex.com. Information contained in or otherwise accessible through our website does not form part of this MD&A and is not incorporated into the MD&A by reference.
TABLE OF CONTENTS
Financial Highlights Financial PositionOverview Liquidity and Capital ResourcesKey Performance Indicators Free Cash Flow and Payout RatioBusiness Strategy Quarterly Financial InformationSecond Quarter Update Non-IFRS MeasuresOperating Results Forward-Looking InformationGeographic Segments Accounting ChangesDiscontinued Operations Establishment and Maintenance of DC&P and ICFRShare Capital Structure Subsequent Events
3 324 3610 4010 4212 4315 4926 5229 5330 53

Innergex Renewable Energy Inc. Management's Discussion and Analysis p32019 Second Quarter (in thousands of Canadian dollars, except as noted and amounts per share)
FINANCIAL HIGHLIGHTS
Production was 100% of the long-term average ("LTA") for the three-month period ended June 30, 2019. Revenues increased 16% to $144.7 million for the three-month period ended June 30, 2019. Adjusted EBITDA rose 15% to $105.2 million for the three-month period ended June 30, 2019, corresponding to an Adjusted
EBITDA Margin of 72.7%. Adjusted EBITDA Proportionate increased 15% to $120.8 million for the three-month period ended June 30, 2019. Completion of the sale of HS Orka, for a purchase price, after adjustments, of US$297.4 million ($400.9 million). Closing of the construction loan and tax equity commitment for the Foard City wind project. Closing of the initial tax equity funding operation for the Phoebe Solar project under construction in Texas.
Three months ended June 30 1 Six months ended June 30 1
2019 2018 2019 2018OPERATING RESULTS Restated 4,5 Restated 4,5
Production (MWh) 1,741,953 1,509,599 3,050,458 2,453,050Revenues 144,693 124,914 271,112 226,702Adjusted EBITDA2 105,248 91,660 198,491 165,226Adjusted EBITDA Margin2 72.7% 73.4% 73.2% 72.9%Net (Loss) Earnings from continuing operations (10,453) 11,105 (14,873) 1,410Net Earnings 7,345 16,861 6,491 2,021Adjusted Net (Loss) Earnings from continuing operations2 (2,656) (411) (14,028) (10,627)
PROPORTIONATEProduction Proportionate (MWh)2 2,136,983 1,903,778 3,726,810 2,950,890Revenues Proportionate2 169,791 143,937 311,017 251,498Adjusted EBITDA Proportionate2 120,841 105,015 220,516 181,755
COMMON SHARESDividends declared 23,373 22,536 46,733 45,031Weighted Average Number of Common Shares(in 000s) 133,417 132,523 133,143 127,586
Trailing twelve months endedJune 30
2019 2018CASH FLOW Restated 4,5 Restated 4,5
Cash Flow From Operating Activities 222,999 240,022Free Cash Flow2 3 115,689 91,655Payout Ratio2 3 79% 88%Adjusted Payout Ratio2 3 65% 67%
As atJune 30,
20196December 31,
2018FINANCIAL POSITIONTotal Assets 6,325,410 6,481,284Total Liabilities 5,635,247 5,521,723Non-Controlling Interests 85,917 329,769Equity Attributable to Owners 604,246 629,792
1. Results from continuing operations unless otherwise indicated.2. Adjusted EBITDA, Adjusted EBITDA Margin, Adjusted Net (Loss) Earnings from continuing operations, Production Proportionate, Revenues Proportionate,
Adjusted EBITDA Proportionate, Free Cash Flow, Payout Ratio and Adjusted Payout Ratio are not recognized measures under IFRS and therefore may not be comparable to those presented by other issuers. Production Proportionate is a key performance indicator for the Corporation that cannot be reconciled with an IFRS measure. Please refer to the "Non-IFRS Measures" section of this MD&A for more information.
3. For more information on the calculation and explanation, please refer to the "Free Cash Flow and Payout Ratio" section.4. For more information on the restatement, please refer to the "Accounting Changes" section.5. For more information, please refer to the "Discontinued Operations" section.6. Financial Position items include assets/liabilities held for sale as well as assets/liabilities of continuing operations. Please refer to the "Financial Position" section
for more information.

Innergex Renewable Energy Inc. Management's Discussion and Analysis p42019 Second Quarter (in thousands of Canadian dollars, except as noted and amounts per share)
OVERVIEW
The Corporation is a developer, acquirer, owner and operator of renewable power-generating facilities with a focus on hydroelectric, wind and solar power that benefit from simple, proven technologies.
Discontinued OperationsOn May 23, 2019, the Corporation announced completion of the sale of its wholly owned subsidiary Magma Energy Sweden A.B. ("Magma Sweden") which owns an equity interest of approximately 53.9% in HS Orka hf ("HS Orka"), owner of two geothermal facilities in operation, one hydro project in development and prospective projects in Iceland. The Geothermal Power Generation Segment is now accounted for as discontinued operations. For more information, please refer to the "Discontinued Operations" section of this MD&A. As a result, the comparative figures have been restated. The figures presented in this MD&A are for the continuing operations unless otherwise indicated.
Segments
As at June 30, 2019, the Corporation has three operating segments and four geographic segments.
Operating Segments Geographic SegmentsHydroelectric Power Generation Canada
Wind Power Generation FranceSolar Power Generation United States
Chile
Innergex Renewable Energy Inc. Management's Discussion and Analysis p52019 Second Quarter (in thousands of Canadian dollars, except as noted and amounts per share)
Portfolio of Assets
As at the date of this MD&A, the Corporation owns interests in three groups of projects at various stages: the Operating Facilities, the Development Projects and the Prospective Projects.
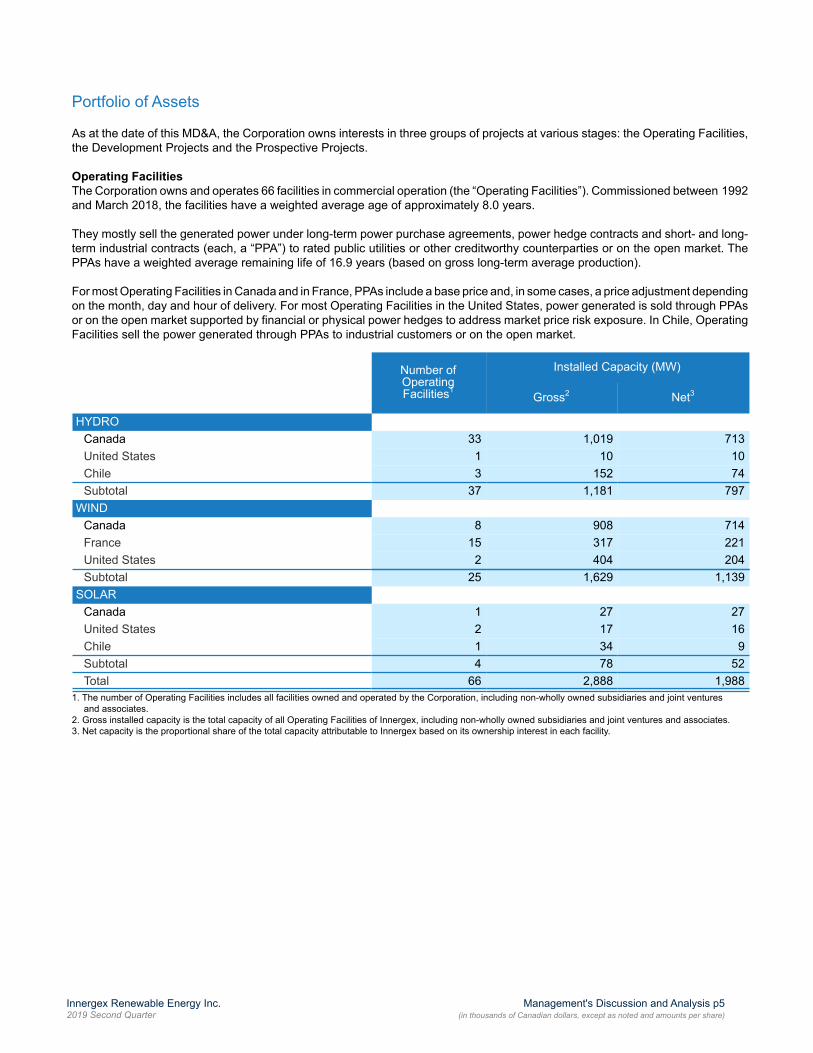
Operating FacilitiesThe Corporation owns and operates 66 facilities in commercial operation (the “Operating Facilities”). Commissioned between 1992 and March 2018, the facilities have a weighted average age of approximately 8.0 years.
They mostly sell the generated power under long-term power purchase agreements, power hedge contracts and short- and long-term industrial contracts (each, a “PPA”) to rated public utilities or other creditworthy counterparties or on the open market. The PPAs have a weighted average remaining life of 16.9 years (based on gross long-term average production).
For most Operating Facilities in Canada and in France, PPAs include a base price and, in some cases, a price adjustment depending on the month, day and hour of delivery. For most Operating Facilities in the United States, power generated is sold through PPAs or on the open market supported by financial or physical power hedges to address market price risk exposure. In Chile, Operating Facilities sell the power generated through PPAs to industrial customers or on the open market.
Number of Operating Facilities1
Installed Capacity (MW)
Gross2 Net3
HYDROCanada 33 1,019 713United States 1 10 10Chile 3 152 74Subtotal 37 1,181 797
WINDCanada 8 908 714France 15 317 221United States 2 404 204Subtotal 25 1,629 1,139
SOLARCanada 1 27 27United States 2 17 16Chile 1 34 9Subtotal 4 78 52Total 66 2,888 1,988
1. The number of Operating Facilities includes all facilities owned and operated by the Corporation, including non-wholly owned subsidiaries and joint ventures and associates.
2. Gross installed capacity is the total capacity of all Operating Facilities of Innergex, including non-wholly owned subsidiaries and joint ventures and associates. 3. Net capacity is the proportional share of the total capacity attributable to Innergex based on its ownership interest in each facility.

Innergex Renewable Energy Inc. Management's Discussion and Analysis p62019 Second Quarter (in thousands of Canadian dollars, except as noted and amounts per share)
Development Projects With the addition of the Innavik hydro project in Quebec, the Corporation now holds interests in eight projects under development. Two Development Projects are currently under construction. These projects are scheduled to begin commercial operation between 2019 and 2022 (the “Development Projects”). For more information on the Development Projects, please refer to the "Second Quarter Update" section.
Number of DevelopmentProjects
Installed Capacity (MW)Gross1 Net2
HYDROQuebec 1 8 4Chile 2 125 47
3 133 51WIND
United States3 1 350 350SOLAR
United States 4 495 495Total 8 978 896
1. Gross installed capacity is the total capacity of all Development Projects of Innergex, including non-wholly owned subsidiaries and joint ventures and associates.2. Net capacity is the proportional share of the total capacity attributable to Innergex based on its ownership interest in each facility.3. Management received approval for a 350 MW layout at the Foard City wind project. For more information, please refer to the "Second Quarter Update" section.
Prospective ProjectsThe Corporation also owns interests in numerous prospective projects at various stages of development. Some have secured land rights, for which an investigative permit application has been filed or for which a proposal has been or could be submitted under a Request for Proposal or a Standing Offer Program (collectively the “Prospective Projects”). The list of Prospective Projects is revised regularly to add or remove projects, according to their advancement potential.
There is no certainty that any Prospective Project will be realized.
Prospective ProjectsGross Projected Capacity (MW)1
Hydro Wind Solar TotalCanada 1,007 4,825 400 6,232United States — 920 95 1,015France — 205 — 205Chile 125 162 28 315Total 1,132 6,112 523 7,767
1. Only Gross Installed Capacity is disclosed for Prospective Projects as the net capacity is not yet defined at this stage.

Innergex Renewable Energy Inc. Management's Discussion and Analysis p72019 Second Quarter (in thousands of Canadian dollars, except as noted and amounts per share)
Shared Ownership
The Corporation shares ownership of some Operating Facilities, Development Projects and Prospective Projects with a corporate, financial, local community or Indigenous partner.
Non-Wholly Owned SubsidiariesSome Operating Facilities have material non-controlling interests and are treated as non-wholly owned subsidiaries. These facilities' results are included in the Corporation's consolidated results. Their summary statements of earnings and comprehensive income and summary statements of financial position are presented at the end of each financial year in the Annual Report.
Operating FacilitiesGross
InstalledCapacity
(MW)
NetInstalledCapacity
(MW)
Sources ofEnergy
Principalplace of
operation
Proportion ofownership interestand voting rights
held by theCorporation
June 30, 2019
Spartan Holdings, LLC Spartan 11 11 Solar Michigan 100.00%1
Muko Partnership Holdings,LLC Kokomo 6 5 Solar Indiana 90.00%
1
Harrison Hydro LimitedPartnership and itssubsidiaries
Douglas Creek, FireCreek, Lamont Creek,Stokke Creek, TipellaCreek and Upper StaveRiver
150 75 Hydro BritishColumbia 50.01%
Kwoiek Creek ResourcesLimited Partnership Kwoiek Creek 50 25 Hydro British
Columbia 50.00%2
Innergex Sainte-MargueriteS.E.C. Sainte-Marguerite 31 15 Hydro Quebec 50.01%
Innergex Europe (2015)Limited Partnership and itssubsidiaries
15 wind farms located inFrance 317 221 Wind France 69.55%
Mesgi'g Ugju's'n (MU) WindFarm L.P. Mesgi'g Ugju's'n 150 75 Wind Quebec 50.00%
2,3
715 427
1. Ownership interest in the sponsor equity. However, tax equity partners hold 100% of the tax equity interests.2. The Corporation owns more than 50% of the economic interest in the subsidiary.3. The Corporation owns a 50% voting interest and a participation interest of 72.4% in 2019 (participation interest to decline over the years).

Innergex Renewable Energy Inc. Management's Discussion and Analysis p82019 Second Quarter (in thousands of Canadian dollars, except as noted and amounts per share)
Joint Ventures and AssociatesSome Operating Facilities are treated as joint ventures and associates and accounted for using the equity method. Their summary statements of earnings and comprehensive income as well as their summary of financial position are presented at the end of each financial year in the Annual Report in the section "Investments in Joint Ventures and Associates". Innergex's share of Production, Revenues and Adjusted EBITDA of the joint ventures and associates are included in the Corporation's proportionate measures.
Operating FacilitiesGross
InstalledCapacity
(MW)
NetInstalledCapacity
(MW)
Sources ofEnergy
Principalplace of
operation
Proportion ofownership interestand voting rights
held by theCorporation
June 30, 2019
Toba Montrose GeneralPartnership
East Toba and MontroseCreek 235 94 Hydro British
Columbia 40.00%1
Shannon Group Holdings,LLC Shannon 204 102 Wind Texas 50.00%
2
Flat Top Group Holdings,LLC Flat Top 200 102 Wind Texas 51.00%
2,3
Dokie General Partnership Dokie 144 37 Wind BritishColumbia 25.50%
Jimmie Creek LimitedPartnership Jimmie Creek 62 32 Hydro British
Columbia 50.99%3
Energía Llaima SpA Guayacán, Peuchén,Mampil and Pampa Elvira 186 84 Hydro
Solar Chile 50.00%
Umbata Falls L.P. Umbata Falls 23 11 Hydro Ontario 49.00%
Parc éolien communautaireViger-Denonville, S.E.C. Viger-Denonville 25 12 Wind Quebec 50.00%
1,079 474
1. The Corporation holds a 51% voting interest and 40% participating economic interest. In 2046, the Corporation’s economic interest will increase to 51% for no additional consideration.
2. Ownership interest in the sponsor equity. However, tax equity partners hold 100% of the tax equity interests.3. The Corporation does not consolidate the entity as it does not have complete control over the decision-making process.

Innergex Renewable Energy Inc. Management's Discussion and Analysis p92019 Second Quarter (in thousands of Canadian dollars, except as noted and amounts per share)
Tax Equity Investment
The Corporation owns equity interests in some facilities that are eligible for tax incentives available for renewable energy facilities in the United States. With its current portfolio of renewable energy facilities, Innergex cannot fully monetize such tax incentives. To take full advantage of these incentives, the Corporation partners with Tax Equity Investors ("TEI") who invest in these facilities in exchange for the tax credits.
Production Tax Credit Program ("PTC")Current United States tax law allows wind energy facilities to receive tax credits that are created for each MWh of generation for the first 10 years of the facility's operation. The TEIs are allocated a portion of the renewable energy facility's taxable income (losses) and PTCs produced and a portion of the cash generated by the facility until they achieve an agreed upon after-tax investment return ("Flip Point"). After the Flip Point, TEIs will be allocated a lesser portion of the cash and the taxable income (losses) generated by the facility.
CommercialOperation Date
Expected TEI Flip Point1
Initial TEIInvestment (M$)
TEI Allocation ofTaxable Income(Loss) and PTCs
TEI Allocation ofCash Distributions
Shannon2 2015 2025 292.4 99.00% 64.10%
Flat Top2 2018 2028 282.4 99.00% 49.84%1. TEI cash allocations are based on quarterly test measurement of cumulative generation for the project since commercial operation date. Lower production could
result in a higher cash allocation to the TEI or a change to the Flip Point. 2. TEIs in U.S. projects generally require certain sponsor guaranties as a condition for their investment. To support the tax equity investments at Shannon and Flat Top,
Alterra, a subsidiary of Innergex, executed a guarantee indemnifying the tax equity investors against certain breaches of project-level representations, warranties and covenants. The Corporation believes these indemnifications cover matters which are substantially within its control, and are very unlikely to occur.
Investment Tax Credit Program ("ITC")Current United States tax law allows wind and solar facilities to receive a one-time federal tax credit, calculated on the basis of the facility's capital cost. Projects that began construction through 2019 are eligible for 30% ITC. This credit steps down to 26% for facilities that began construction in 2020, 22% in 2021 and 10% thereafter.
CommercialOperation Date
Expected TEI FlipPoint
Initial TEIInvestment (M$)
TEI Allocation ofTaxable Income(Loss) and ITC
TEI PreferredAllocation of Cash
Kokomo1 2016 2022 5.2 99.0%2.00% of Initial TEI
Investment3
Spartan1 2017 2023 13.0 99.0%2.00% of Initial TEI
Investment3
Phoebe2 2019 2026 49.6 99.0%5 10.62% in excess of priority distribution4
1. TEIs in U.S. projects generally require certain sponsor guaranties as a condition for their investment. To support the tax equity investments at Kokomo, Spartan and Phoebe, Alterra, a subsidiary of Innergex, executed a guarantee indemnifying the tax equity investors against certain breaches of project-level representations, warranties and covenants. The Corporation believes these indemnifications cover matters which are substantially within its control, and are very unlikely to occur.
2. TEI cash allocations are based on quarterly test measurement of cumulative generation for the project since commercial operation date. Lower production could result in a higher cash allocation to the TEI or a change to the Flip Point.
3. The 2.00% of initial TEI investment preferred allocation of cash will last for 5 years from the COD for both Kokomo (until December 31, 2021) and Spartan (until December 31, 2022). After that date, the TEI will get a proportion of the project cash distributions, representing 17.5% for Kokomo and 10.86% for Spartan.
4. Phoebe’s cash distribution amounts to the TEI are fixed and defined within the TEI partnership agreement. All amounts of distributable cash above this defined threshold are distributed at the rate of 10.62% and 89.38% to the TEI and Innergex respectively.
5. TEI Allocation of Taxable Income (Loss) and ITC will be 66.67% from January 1, 2020 to December 31, 2024 and then return to 99.0% until TEI Flip Point.

Innergex Renewable Energy Inc. Management's Discussion and Analysis p102019 Second Quarter (in thousands of Canadian dollars, except as noted and amounts per share)
KEY PERFORMANCE INDICATORS
The Corporation measures its performance using key performance indicators ("KPIs").
Production KPIs
When evaluating its operating results, a key performance indicator for the Corporation is to compare actual electricity generation with a long-term average ("LTA") which is determined to allow long-term forecasting of the expected power generation of each facility.
Production in comparison with LTA in megawatt/hours (“MWh”) and gigawatt/hours (“GWh”) Production and Production Proportionate
Financial KPIs
Revenues and Revenues Proportionate Adjusted EBITDA, Adjusted EBITDA Margin and Adjusted EBITDA Proportionate Adjusted Net Earnings (Loss) Free Cash Flow Payout Ratio
The Corporation believes that these indicators are important, as they provide management and the reader with additional information about the Corporation's production and cash generating capabilities, its ability to sustain current dividends and dividend increases and its ability to fund its growth. The indicators also facilitate the comparison of results over different periods.
These indicators are not recognized measures under IFRS, have no standardized meaning prescribed by IFRS and therefore may not be comparable to those presented by other issuers. Please refer to the "Non-IFRS Measures" section for more information.
BUSINESS STRATEGY
The Corporation's strategy for building shareholder value is to develop or acquire high-quality renewable power production facilities that generate sustainable cash flows and provide an attractive risk-adjusted return on invested capital and to distribute a sustainable dividend.
Produce Renewable Energy
The Corporation is committed to producing energy exclusively from sustainable renewable sources by balancing economic, social and environmental considerations.

Innergex Renewable Energy Inc. Management's Discussion and Analysis p112019 Second Quarter (in thousands of Canadian dollars, except as noted and amounts per share)
Maintain Diversification of Energy Sources
The Corporation strives to maintain a diversified portfolio of assets in terms of geography and sources of energy to alleviate any seasonal and production variations. The amount of electricity generated by the Operating Facilities is generally dependent on the availability of water flows, wind regimes and solar irradiation. Lower-than-expected resources in any given year could have an impact on the Corporation's revenues and hence on its profitability.
Innergex owns interests in 37 hydroelectric facilities drawing on 31 watersheds, 25 wind farms and 4 solar farms, providing significant diversification in terms of operating revenue sources. Furthermore, the nature of hydroelectric, wind and solar partially offsets any seasonal variations, as illustrated in the following table:
Consolidated LTA and Quarterly Seasonality1
In GWh and % Q1 Q2 Q3 Q4 TotalHYDRO 370 12% 1,065 35% 1,002 33% 581 19% 3,018 49%WIND 945 31% 658 22% 563 18% 885 29% 3,051 50%SOLAR 12 20% 20 33% 20 33% 9 15% 61 1%Total 1,327 22% 1,743 28% 1,585 26% 1,475 24% 6,130 100%
1. The consolidated long-term average production is the annualized LTA for the facilities in operation at August 13, 2019. The LTA is presented in accordance with revenue recognition accounting rules under IFRS and excludes production from facilities that are accounted for using the equity method. Production in comparison to the LTA is a key performance indicator for the Corporation. For more information, please refer to the "Key Performance Indicators" section.
Acquire Quality Assets
Acquisitions are an important component of the Corporation's business strategy. Gaining a foothold in a new market increases our reach, diversity and opportunities for growth. Similarly, increasing our presence in established locations, such as the Canadian market, allows us to consolidate our position as a renewable energy leader. Our focus will remain on generating energy solely from renewable sources and we will continue to explore new technologies that could bring further opportunities.
Build Strategic Relationships
Nurturing relationships to develop long-term partnerships is at the core of our business strategy and values. Our projects flourish with our financial, corporate, Indigenous or municipal partners who share the ownership of our facilities as well as our vision of collaboration, transparency, integrity and responsibility.
Pursue Growth OpportunitiesThe transition to a low-carbon economy will be led by the renewable energy sector. Innergex stands well positioned to continue its strategic growth by further developing, acquiring and operating high-quality renewable energy projects and will continue to champion the advancement of renewable energy solutions.
Deliver Exceptional ResultsInnergex recognizes that what we have accomplished and what is yet to come would not be possible without our highly skilled team of employees and our culture that promotes excellence, accountability and collaboration. Their collective knowledge, talent, abilities, experience and sound judgment have always been key to our long-term success. Our management team has a proven track record of delivering projects on-time and on-budget. Furthermore, we have nurtured a pool of specialized partners we can rely on to provide services outside our realm of expertise when necessary, from engineering firms to environmental monitoring professionals.

Innergex Renewable Energy Inc. Management's Discussion and Analysis p122019 Second Quarter (in thousands of Canadian dollars, except as noted and amounts per share)
SECOND QUARTER UPDATE
Corporate Development
Divestment of HS Orka• On May 23, 2019, Innergex announced completion of the sale of its wholly owned subsidiary Magma Sweden, which owns
an equity interest of approximately 53.9% in HS Orka for US$297.4 million ($400.9 million) after adjustments to Jarðvarmi slhf, which exercised its right of first refusal.
• Net proceeds were used to reimburse the $228 million one-year credit facility contracted on October 24, 2018 at the time of the acquisition of the remaining interest in the Cartier Wind Farms and Operating Entities and the utilized portion of the additional borrowing capacity that was obtained on April 23, 2019. The proceeds were also used to deleverage corporate facilities.
Solar Development in the United States• In the second quarter, the Corporation issued letters of credit to secure 150 MW of solar panels to qualify approximately
750 MW of future solar projects for the full 30% ITC, which will represent an investment of about US$50 million.
Development Activities
Location Gross installedcapacity (MW) Expected COD Gross estimated
LTA1 (GWh)PPA term(years)
HYDRO (Quebec)Innavik Nunavik 7.5 2022 54.7 40HYDRO (Chile)Frontera Biobío 109.0 2022 464.0 - 2
El Canelo Cordillera 16.0 2022 90.0 - 2
SOLAR (United States)Hillcrest Ohio 200.0 2020 410.0 - 2
Hale Kuawehi Hawaii 30.0 3 2022 87.4 25Paeahu Hawaii 15.0 3 2022 41.2 25
1. This information is intended to inform readers of the projects' potential impact on the Corporation's results. Actual results may vary. These estimates are up-to-date as at the date of this MD&A.
2. Power to be sold on the open market or through PPAs yet to be signed.3. Solar project with a battery storage capacity of 120 MWh for Hale Kuawehi and 60 MWh for Paeahu.
InnavikA 7.5 MW hydro project that will serve the Inukjuak community of 2,000 inhabitants in the Nunavik territory in the far north of Quebec. A 40-year PPA was signed with Hydro-Quebec Distribution on May 27, 2019, which is expected to begin in the fourth
quarter of 2022. The PPA is pending approval by the Régie de l'énergie of Quebec. Initial mobilization is expected in the third quarter of 2019 while more intensive construction activities will begin in 2020. Environmental approvals are expected in the third quarter 2019.
Frontera The financing process, which is critical to the project's success, progressed. The project has obtained most of the rights and permits needed to proceed with construction, including technical and
environmental approvals, and is almost shovel-ready. Delays in construction could result in the expiry of certain permits.
El Canelo The project is being redesigned to address various issues, which has delayed the issuance of permits. The project is at a critical point where a decision on its future could be made in the coming months.
Hillcrest Hillcrest's interconnection service agreement is in place. All of the land required has been secured through land leases, easements and options. The Corporation is involved in several advanced discussions to sell the power to be produced by the facility through a
long-term energy sale agreement.

Innergex Renewable Energy Inc. Management's Discussion and Analysis p132019 Second Quarter (in thousands of Canadian dollars, except as noted and amounts per share)
Innergex is moving swiftly to secure construction and major equipment contracts. This was initially expected in the second quarter of 2019 and is now expected in the third quarter of 2019, in order to be ready for the start of construction in the second half of 2019.
An agreement was executed with Southern State Community College ("SSCC") under which Hillcrest will contribute annual funds to SSCC for scholarships for the enrichment of technical programs. The agreement also provides for student field trips to the project site.
Hale Kuawehi The Public Utilities Commission approved the PPA. Environmental and technical studies are ongoing, as are other permitting-related activities.
Paeahu The Public Utilities Commission's procedural schedule for the approval of the PPA is pending. A contested case hearing
is expected in the third quarter of 2019 to address concerns from an opposition group that consists of neighboring residents. Environmental and technical studies are ongoing as are other permitting-related activities. The Special Use Permit
application will be filed in the fourth quarter of 2019 and will likely face opposition from the same group.
Construction Activities
Ownership%
Grossinstalledcapacity
(MW)
ExpectedCOD
Gross estimated
LTA1 (GWh)
PPAterm
(years)
Total projectcost Expected first full year
Estimated1 ($M)
Revenues1 ($M)
Adjusted EBITDA1 2
($M)WIND (United States)Foard City 100.0 3 350.3 4 2019 4 1,303.3 4 12 6 528.2 4 28.5 4 18.5 4
SOLAR (United States)Phoebe 100.0 3 250.0 2019 738.0 12 519.6 5 33.5 5 25.7 5
Total 600.3 2,041.3 1,047.8 62.0 44.21. This information is intended to inform readers of the projects' potential impact on the Corporation's results. Actual results may vary. These estimates are up-to-
date as at the date of this MD&A. 2. Adjusted EBITDA is not a recognized measure under IFRS and therefore may not be comparable to those presented by other issuers. Please
refer to the "Non-IFRS Measures" section of this MD&A for more information.3. Ownership interest is 100% of the sponsor equity in Phoebe and Foard City. However, following tax equity funding, a tax equity partner will hold 100% of the
tax equity interests.4. Management received approval of a layout of 350.3 MW for the Foard City wind project from the Federal Aviation Administration ("FAA"). Gross estimated LTA,
total project cost, Projected Revenues and Projected Adjusted EBITDA have been revised accordingly. Commercial operation date remains Q4 2019. Total Estimated Project Cost at US$403.6 million, Expected Revenues at US$21.8 million and Expected Adjusted EBITDA at US$14.1 million translated at a 1.3087 rate.
5. Total Estimated Project Cost at US$397.0 million, Expected Revenues at US$25.6 million and Expected Adjusted EBITDA at US$19.6 million translated at a 1.3087 rate.
6. PPA for 300 MW to start upon the facility reaching commercial operation.
Foard CityIn the second quarter of 2019, the FAA and the Corporation came to an agreement for 9 additional turbines, representing a total of 139 turbines or 350.3 MW. All 139 Determinations of No Hazard from the FAA were received in May 2019.
On May 8, 2019, the Corporation announced the closing of a construction loan and a tax equity commitment. The construction financing amounts to US$290.9 million ($380.7 million), backed by a US$275.0 million ($359.9 million) tax equity commitment and a US$23.3 million ($30.5 million) 7-year term loan facility with a 10-year amortization period to be provided by lenders upon the commercial operation date.
Construction continued on-site and it is expected that the project would achieve commercial operation in the fourth quarter of 2019.
Total project costs were revised upward to US$403.6 million ($528.2 million) due to the additional turbines. As at June 30, 2019, construction costs were US$335.7 million ($439.4 million).
All 139 of the turbines have now been delivered to site and erected and mechanical completion and testing are proceeding on schedule.
The substation has been energized and energization of the collector lines commenced in early August.

Innergex Renewable Energy Inc. Management's Discussion and Analysis p142019 Second Quarter (in thousands of Canadian dollars, except as noted and amounts per share)
Phoebe In the second quarter of 2019, the civil work was nearly completed and the focus turned to electrical and module installations.
On June 4, 2019, Innergex closed the initial tax equity funding operation in its Phoebe Solar project under construction in Texas. Wells Fargo Central Pacific Holdings, Inc. injected its initial contribution of approximately US$37.1 million ($49.6 million) in Phoebe Solar.
The installation of the piles and trackers was completed and the civil contractor commenced demobilization from site. All of the modules required for construction have now been delivered to the site as at the date of this MD&A. Substation construction was completed and the substation was energized. Inverter delivery was also completed and all
of the inverters were placed in their final locations and are being energized as the Blocks are brought online. There are 7 “Blocks” of modules that make up the project. Blocks 5 and 7 were brought online in June, Blocks 2 and 3
came online in July and Block 4 commenced generation in early August. Module installation on the remaining two Blocks (1 and 6) is nearly complete and they are scheduled to commence
generation in late August. Electricity was produced and sold from the Blocks that were online. Revenues generated were applied toward reducing
the construction costs. Construction costs are in line with the budget at this stage and stand at US$337.7 million ($441.9 million) at the end of
June. The project is expected to begin commercial operation in the third quarter of 2019. The Phoebe project will sell 100% of its output to the ERCOT power grid and receive a fixed price on 89% of the energy
produced under a 12-year PPA.
Operating Activities
Glen MillerOn June 15, 2019, a flood incident occurred at the Glen Miller hydro facility in Ontario. Operations were halted for a few weeks and resumed mid-July. A $1.5 million provision was recorded in other expenses for potential cash outflows related to this event, including contractual penalties.

Innergex Renewable Energy Inc. Management's Discussion and Analysis p152019 Second Quarter (in thousands of Canadian dollars, except as noted and amounts per share)
OPERATING RESULTS
Electricity Production
The Corporation's operating results for the three-month period ended June 30, 2019 are compared with the operating results for the same period in 2018.
Three months ended June 302019 2018 (Restated 3)
Energy SegmentProduction
(MWh)1 LTA (MWh)Productionas a % of
LTAProduction
(MWh)1 LTA (MWh)Productionas a % of
LTAHYDRO
Quebec 225,002 214,050 105% 215,118 214,050 100%Ontario 19,258 20,805 93% 18,597 20,805 89%British Columbia 795,965 813,139 98% 822,493 813,139 101%United States 14,049 16,956 83% 18,564 16,956 109%Subtotal 1,054,274 1,064,950 99% 1,074,772 1,064,950 101%
WINDQuebec2 535,983 501,077 107% 292,919 273,523 107%France 132,259 157,125 84% 120,154 157,125 76%Subtotal 668,242 658,202 102% 413,073 430,648 96%
SOLAROntario 12,453 12,117 103% 13,896 12,202 114%United States 6,984 8,247 85% 7,858 8,845 89%Subtotal 19,437 20,364 95% 21,754 21,047 103%Total 1,741,953 1,743,516 100% 1,509,599 1,516,645 100%
GEOTHERMAL4,5
Iceland 196,878 185,655 106% 321,580 319,740 101%1. Some facilities are treated as joint ventures and associates and accounted for using the equity method; their revenues are not included in the Corporation's
consolidated revenues and, for consistency, their electricity production figures have been excluded from the production table.2. Production and LTA reflects the 62% acquired interest in the Cartier Wind Farms on October 24, 2018. LTAs were revised at the acquisition.3. For more information on the restatement, please refer to the "Accounting Changes" section.4. For more information, please refer to the "Discontinued Operations" section.5. Production and LTA for the period from April 1, 2019, to May 23, 2019 as opposed to a complete period in 2018.
Overall, the hydroelectric facilities produced 99% of their LTA due mostly to: below-average water flows in some regions of British Columbia.
This item was partly offset by: above-average water flows at almost all Quebec facilities.
Overall, the wind farms produced 102% of their LTA due to: above-average wind regimes in Quebec.
This item was partly offset by: below-average wind regimes in France.
Overall, the solar farms produced 95% of their LTA due to: below-average solar irradiation in the United States.
This item was partly offset by: above-average solar irradiation in Ontario.
Production for the three-month period ended June 30, 2019 was 1,741,953 compared with 1,509,599 for the same period last year. The 15% increase is due mainly to the contribution of the 62% interest in the Cartier Wind Farms acquired in 2018, slightly offset by lower production in British Columbia.
The Corporation's operating results for the six-month period ended June 30, 2019 are compared with the operating results for the same period in 2018.

Innergex Renewable Energy Inc. Management's Discussion and Analysis p162019 Second Quarter (in thousands of Canadian dollars, except as noted and amounts per share)
Six months ended June 302019 2018 (Restated 3)
Energy SegmentProduction
(MWh)1 LTA (MWh)Productionas a % of
LTAProduction
(MWh)1 LTA (MWh)Productionas a % of
LTAHYDRO
Quebec 359,815 338,220 106% 341,420 338,220 101%Ontario 43,502 45,099 96% 43,127 45,099 96%British Columbia 923,752 1,026,430 90% 1,001,925 1,026,430 98%United States 19,796 24,883 80% 28,770 24,883 116%Subtotal 1,346,865 1,434,632 94% 1,415,242 1,434,632 99%
WINDQuebec2 1,318,213 1,218,414 108% 645,234 656,468 98%France 354,959 384,830 92% 361,529 384,830 94%Subtotal 1,673,172 1,603,244 104% 1,006,763 1,041,298 97%
SOLAROntario 20,007 19,197 104% 20,444 19,332 106%United States4 10,414 12,920 81% 10,601 12,185 87%Subtotal 30,421 32,117 95% 31,045 31,517 99%Total 3,050,458 3,069,993 99% 2,453,050 2,507,447 98%
GEOTHERMAL5,6
Iceland 545,424 505,395 108% 517,217 514,868 100%1. Some facilities are treated as joint ventures and associates and accounted for using the equity method; their revenues are not included in the Corporation's
consolidated revenues and, for consistency, their electricity production figures have been excluded from the production table.2. Production and LTA reflect the 62% acquired interest in the Cartier Wind Farms on October 24, 2018. LTAs were revised at the acquisition.3. For more information on the restatement, please refer to the "Accounting Changes" section.4. Production and LTA for the period from February 6, 2018, to June 30, 2018, as opposed to a complete period in 2019.5. For more information, please refer to the "Discontinued Operations" section.6. Production and LTA for the period from January 1, 2019, to May 23, 2019 as opposed to a period from February 6 to June 30 in 2018.
Overall, the hydroelectric facilities produced 94% of their LTA due mostly to: below-average water flows at most British Columbia facilities due mostly to cold temperatures in the winter season.
This item was partly offset by: above-average water flows at almost all Quebec facilities.
Overall, the wind farms produced 104% of their LTA due to: above-average wind regimes in Quebec.
This item was partly offset by: below-average wind regimes in France.
Overall, the solar farms produced 95% of their LTA due to: below-average solar irradiation in the United States.
This item was partly offset by: above-average solar irradiation in Ontario.
Production for the six-month period ended June 30, 2019 was 3,050,458 MWh compared with 2,453,050 MWh for the same period last year. The 24% increase is due mainly to the contribution of the 62% interest in the Cartier Wind Farms acquired in 2018, partly offset by lower production in British Columbia and in France.

Innergex Renewable Energy Inc. Management's Discussion and Analysis p172019 Second Quarter (in thousands of Canadian dollars, except as noted and amounts per share)
Production Proportionate1
1. Production Proportionate is a "Key performance indicator" for the Corporation, which cannot be reconciled with an IFRS measure and therefore may not be comparable to those presented by other issuers. Please refer to the "Non-IFRS Measures" section of this MD&A for more information.
For the three-month period ended on June 30, 2019, compared with the same period last year
Production Proportionate of the joint ventures' and associates' hydroelectric facilities was 165,165 MWh (95% of their LTA) in the second quarter of 2019, compared with 146,298 MWh (110% of their LTA) for the same quarter last year, a 13% increase due mainly to:
the investment in Energía Llaima in July 2018.This item was partly offset by:
lower contribution from the British Columbia facilities due to below-average water flows.
Production Proportionate of the joint ventures' and associates' wind farms was 226,651 MWh (92% of their LTA) in the second quarter of 2019 compared with 247,881 MWh (101% of their LTA) for the same period last year, a 9% decrease due mostly to:
the lower contribution of the Shannon facility in Texas.
Production Proportionate of the joint ventures' and associates' solar farm was 3,214 MWh (95% of its LTA) in the second quarter of 2019. The Pampa Elvira solar facility was part of the investment in Energía Llaima in July 2018.
For the six-month period ended on June 30, 2019, compared with the same period last year
Production Proportionate of the joint ventures and associates' hydroelectric facilities was 206,092 MWh (96% of their LTA) for the six-month period ended on June 30, 2019, compared with 157,758 MWh (108% of their LTA) for the same period last year, a 31% increase due mainly to:
the investment in Energía Llaima in July 2018.This item was partly offset by:
lower contribution from the British Columbia facilities due to below-average water flows.
Production Proportionate of the joint ventures' and associates' wind farms was 463,691 MWh (96% of their LTA) for the six-month period ended on June 30, 2019, compared with 340,082 MWh (101% of their LTA) for the same period last year, a 36%increase due mainly to:
the contribution of the Flat Top wind farm commissioned on March 23, 2018; and the contribution of the Alterra acquisition achieved on February 6, 2018.
Production Proportionate of the joint ventures' and associates' solar farm was 6,569 MWh (93% of its LTA) for the six-month period ended on June 30, 2019. The Pampa Elvira solar facility was part of the investment in Energía Llaima in July 2018.

Innergex Renewable Energy Inc. Management's Discussion and Analysis p182019 Second Quarter (in thousands of Canadian dollars, except as noted and amounts per share)
Financial Results
Three months ended June 30 Six months ended June 302019 2018 Change 2019 2018 Change
Restated 3,4 Restated 3,4
Revenues 144,693 124,914 19,779 16 % 271,112 226,702 44,410 20 %Operating expenses 27,686 21,841 5,845 27 % 47,744 39,319 8,425 21 %General andadministrative expenses 8,854 7,348 1,506 20 % 17,541 13,795 3,746 27 %
Prospective projectexpenses 2,905 4,065 (1,160) (29)% 7,336 8,362 (1,026) (12)%
Adjusted EBITDA1 105,248 91,660 13,588 15 % 198,491 165,226 33,265 20 %Adjusted EBITDA margin1 72.7% 73.4% 73.2% 72.9%
Finance costs 58,259 48,972 9,287 19 % 111,230 92,875 18,355 20 %
Other net expenses 552 1,118 (566) (51)% 1,278 5,006 (3,728) (74)%Depreciation andamortization 46,749 36,459 10,290 28 % 93,215 72,700 20,515 28 %
Share of loss of jointventures and associates
2
142 1,983 (1,841) (93)% 7,032 916 6,116 668 %Unrealized net loss(gain) on financialinstruments 8,506 (8,077) 16,583 (205)% 3,194 (5,794) 8,988 (155)%
Income tax expense(recovery of) 1,493 100 1,393 1,393 % (2,585) (1,887) (698) 37 %
Net (loss) earnings fromcontinuing operations (10,453) 11,105 (21,558) (194)% (14,873) 1,410 (16,283) (1,155)%
Net earnings fromdiscontinued operations 17,798 5,756 12,042 209 % 21,364 611 20,753 3,397 %
Net earnings 7,345 16,861 (9,516) (56)% 6,491 2,021 4,470 221 %
Net earnings attributableto:Owners of the parent 10,779 13,331 (2,552) (19)% 4,032 6,714 (2,682) (40)%Non-controlling
interests (3,434) 3,530 (6,964) (197)% 2,459 (4,693) 7,152 (152)%7,345 16,861 (9,516) (56)% 6,491 2,021 4,470 221 %
Basic and diluted net(loss) earnings pershare from continuingoperations attributableto owners ($) (0.07) 0.06 (0.14) 0.03
Basic and diluted netearnings per shareattributable to owners($) 0.07 0.09 0.01 0.03
1. Adjusted EBITDA and Adjusted EBITDA Margin are not recognized measures under IFRS and therefore may not be comparable to those presented by other issuers. Please refer to the "Non-IFRS Measures" section of this MD&A for more information.
2. Some facilities are treated as joint ventures and associates and accounted for using the equity method; their revenues are not included in the Corporation's consolidated revenues.
3. For more information on the restatement, please refer to the "Accounting Changes" section.4. For more information, please refer to the "Discontinued Operations" section.

Innergex Renewable Energy Inc. Management's Discussion and Analysis p192019 Second Quarter (in thousands of Canadian dollars, except as noted and amounts per share)
RevenuesUp 16% to $144.7 million for the three-month period ended June 30, 2019Up 20% to $271.1 million for the six-month period ended June 30, 2019
Three months ended June 30 Six months ended June 30Energy Segment 2019 2018 Change 2019 2018 Change
Restated1,2 Restated1,2
Hydro 76,491 76,014 477 104,529 110,677 (6,148)Wind 62,193 42,113 20,080 157,019 106,163 50,856Solar 6,009 6,787 (778) 9,564 9,862 (298)Revenues 144,693 124,914 19,779 271,112 226,702 44,410
1. For more information on the restatement, please refer to the "Accounting Changes" section.2. For more information, please refer to the "Discontinued Operations" section.
For the three-month period ended on June 30, 2019, compared with the same period last year
The increase in revenues from the hydroelectric power generation segment is mainly due to: higher revenues from some facilities in British Columbia due to higher average selling price.
The increase in revenues from the wind power generation segment is mainly due to: the 62% interest in the Cartier Wind Farms acquired in October 2018; and higher revenues at the French wind facilities due to higher production.
The decrease in revenues from the solar power generation segment is mainly due to: lower revenues at the Stardale facility due to lower production.
For the six-month period ended on June 30, 2019, compared with the same period last year
The decrease in revenues from the hydroelectric power generation segment is mainly due to: lower revenue in British Columbia due to lower production, mostly explained by the cold temperatures in the
winter season.
The increase in revenues from the wind power generation segment is mainly due to: the 62% interest in the Cartier Wind Farms acquired in October 2018; and higher revenues at the Mesgi'g Ugju's'n facility due to higher production.
The decrease in revenues from the solar power generation segment is mainly due to: lower revenues at the Stardale facility due to lower production.
Innergex Renewable Energy Inc. Management's Discussion and Analysis p202019 Second Quarter (in thousands of Canadian dollars, except as noted and amounts per share)
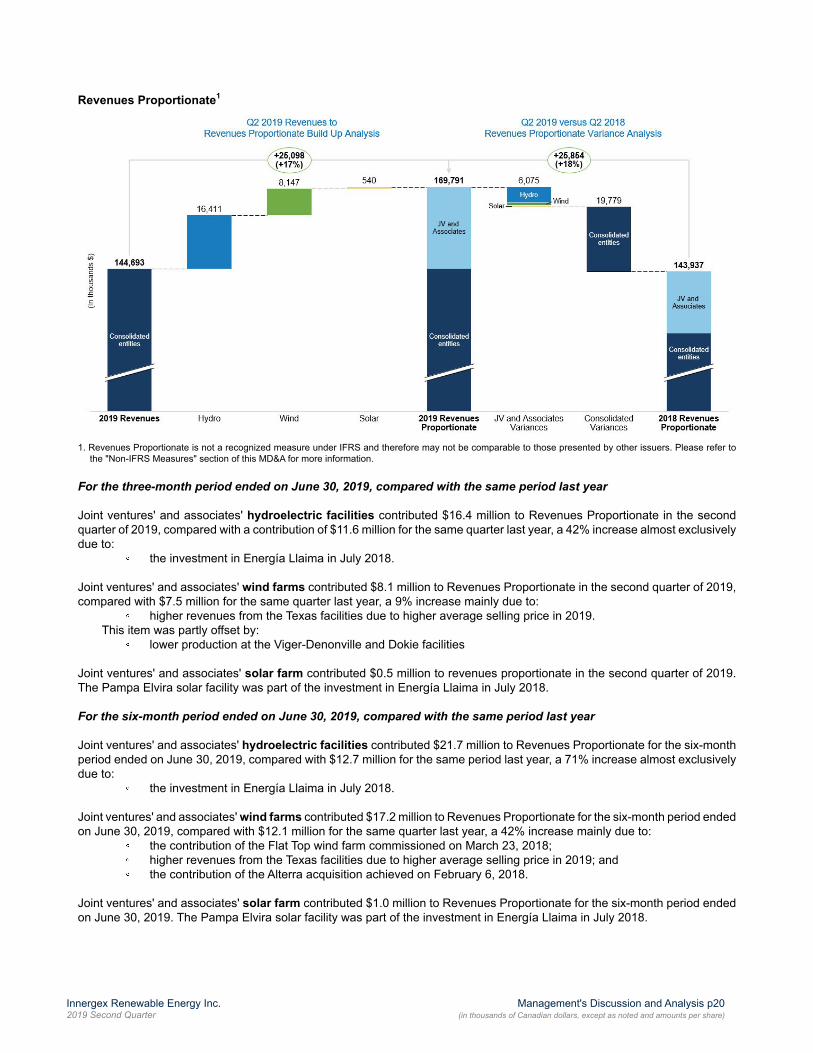
Revenues Proportionate1
1. Revenues Proportionate is not a recognized measure under IFRS and therefore may not be comparable to those presented by other issuers. Please refer to the "Non-IFRS Measures" section of this MD&A for more information.
For the three-month period ended on June 30, 2019, compared with the same period last year
Joint ventures' and associates' hydroelectric facilities contributed $16.4 million to Revenues Proportionate in the second quarter of 2019, compared with a contribution of $11.6 million for the same quarter last year, a 42% increase almost exclusively due to:
the investment in Energía Llaima in July 2018.
Joint ventures' and associates' wind farms contributed $8.1 million to Revenues Proportionate in the second quarter of 2019, compared with $7.5 million for the same quarter last year, a 9% increase mainly due to:
higher revenues from the Texas facilities due to higher average selling price in 2019.This item was partly offset by:
lower production at the Viger-Denonville and Dokie facilities
Joint ventures' and associates' solar farm contributed $0.5 million to revenues proportionate in the second quarter of 2019. The Pampa Elvira solar facility was part of the investment in Energía Llaima in July 2018.
For the six-month period ended on June 30, 2019, compared with the same period last year
Joint ventures' and associates' hydroelectric facilities contributed $21.7 million to Revenues Proportionate for the six-month period ended on June 30, 2019, compared with $12.7 million for the same period last year, a 71% increase almost exclusively due to:
the investment in Energía Llaima in July 2018.
Joint ventures' and associates' wind farms contributed $17.2 million to Revenues Proportionate for the six-month period ended on June 30, 2019, compared with $12.1 million for the same quarter last year, a 42% increase mainly due to:
the contribution of the Flat Top wind farm commissioned on March 23, 2018; higher revenues from the Texas facilities due to higher average selling price in 2019; and the contribution of the Alterra acquisition achieved on February 6, 2018.
Joint ventures' and associates' solar farm contributed $1.0 million to Revenues Proportionate for the six-month period ended on June 30, 2019. The Pampa Elvira solar facility was part of the investment in Energía Llaima in July 2018.

Innergex Renewable Energy Inc. Management's Discussion and Analysis p212019 Second Quarter (in thousands of Canadian dollars, except as noted and amounts per share)
Adjusted EBITDA1
Up 15% to $105.2 million for the three-month period ended June 30, 2019Up 20% to $198.5 million for the six-month period ended June 30, 2019
1. Adjusted EBITDA is not a recognized measure under IFRS and therefore may not be comparable to those presented by other issuers. Please refer to the "Non-IFRS Measures" section for more information.
For the three-month period ended on June 30, 2019, compared with the same period last year
The decrease in Adjusted EBITDA in the hydroelectric power generation segment is mainly due to: overall higher operational expenses at most British Columbia facilities.
The increase in Adjusted EBITDA in the wind power generation segment is due mainly to: the 62% interest in the Cartier Wind Farms acquired in October 2018; better performance at the Mesgi'g Ugju's'n facility; and a slight improvement at the facilities in France.
The decrease in Adjusted EBITDA in the solar power generation segment is mainly due to: lower revenues at the Stardale facility.
The increase in other expenses is mainly due to: higher general and administrative expenses related to the acquisitions and investments made in 2018.
For the six-month period ended on June 30, 2019, compared with the same period last year
The decrease in Adjusted EBITDA from the hydroelectric power generation segment is due mainly to: lower contribution from the British Columbia facilities; and lower revenues from the Quebec facilities.
The increase in Adjusted EBITDA in the wind power generation segment is due mainly to: higher revenues in Quebec due mainly to the 62% interest in the Cartier Wind Farms acquired in October 2018
and to higher production at the Mesgi'g Ugju's'n facility.This item was partly offset by:
a lower contribution from the French wind facilities.
The decrease in Adjusted EBITDA in the solar power generation segment is mainly due to: lower revenues at the Stardale and Spartan facilities.

Innergex Renewable Energy Inc. Management's Discussion and Analysis p222019 Second Quarter (in thousands of Canadian dollars, except as noted and amounts per share)
The increase in other expenses is mainly due to: higher general and administrative expenses related to the acquisitions and investments made in 2018.
Adjusted EBITDA Margin1
Down to 72.7% from 73.4% for the three-month period ended on June 30, 2019Up from 72.9% to 73.2% for the six-month period ended on June 30, 2019
The decrease for the three-month period is mainly explained by: lower margin in the hydro segment due to higher operating costs in British Columbia; and lower margin from the French facilities explained mainly by higher operating costs.
The increase for the six-month period is mainly explained by: changes in the mix of segments as wind generation now represents a higher proportion of Adjusted EBITDA.
Wind activities typically have a better return on revenues than hydro due to lower operating costs. This item was partly offset by:
a lower margin in the hydro segment due to higher operating costs in British Columbia; and a lower margin from the French facilities.
1. Adjusted EBITDA Margin is not a recognized measure under IFRS and therefore may not be comparable to those presented by other issuers. Please refer to the "Non-IFRS Measures" section of this MD&A for more information.
Adjusted EBITDA Proportionate2
2. Adjusted EBITDA Proportionate is not a recognized measure under IFRS and therefore may not be comparable to those presented by other issuers. Please refer to the "Non-IFRS Measures" section of this MD&A for more information.
For the three-month period ended on June 30, 2019, compared with the same period last year
The joint ventures' and associates' hydroelectric facilities contributed $11.4 million to the Adjusted EBITDA Proportionate in the second quarter of 2019, compared with $9.5 million for the same quarter last year, a 20% increase mainly due to:
the investment in Energía Llaima in July 2018.
The joint ventures' and associates' wind farms contributed $4.2 million to the Adjusted EBITDA Proportionate for the second quarter of 2019, compared with $3.9 million for the same quarter last year, an 8% increase mainly due to:
higher revenues at the Shannon and Flat Top facilities.The increase was partly offset by:
lower production at the Dokie and Viger-Denonville facilities.

Innergex Renewable Energy Inc. Management's Discussion and Analysis p232019 Second Quarter (in thousands of Canadian dollars, except as noted and amounts per share)
The joint ventures' and associates' solar farm contributed $0.02 million to Adjusted EBITDA Proportionate in the second quarterof 2019. The Pampa Elvira solar facility was part of the investment in Energía Llaima in July 2018.
For the six-month period ended on June 30, 2019, compared with the same period last year
The joint ventures' and associates' hydroelectric facilities contributed $12.5 million to the Adjusted EBITDA Proportionate for the six-month period ended on June 30, 2019, compared with $9.6 million for the same period last year, a 30% increase mainly due to:
the investment in Energía Llaima in July 2018.The increase was partly offset by:
lower Adjusted EBITDA at the Jimmie Creek and Toba Montrose facilities resulting from higher operating costs.
The joint ventures' and associates' wind farms contributed $9.3 million to Adjusted EBITDA Proportionate for the six-month period ended on June 30, 2019, compared with $7.0 million for the same period last year, a 33% increase mainly due to:
the contribution of the Flat Top wind farm commissioned on March 23, 2018; higher revenues in the Texas facilities due to higher average selling price in 2019; and higher revenues at the Dokie and Viger-Denonville facilities.
The joint ventures' and associates' solar farm contributed $0.3 million to the Adjusted EBITDA Proportionate for the six-month period ended on June 30, 2019. The Pampa Elvira solar facility was part of the investment in Energía Llaima in July 2018.
Finance Costs Up 19% to $58.3 million for the three-month period ended June 30, 2019Up 20% to $111.2 million for the six-month period ended June 30, 2019
The increases for the three- and six-month periods are due mainly to: interest expenses related to the acquisitions and investments made in 2018; and the interest expense from the 4.75% convertible debentures offering on June 12, 2018.
The effective all-in interest rate on the Corporation's debt and convertible debentures was 4.46% as at June 30, 2019 (4.48% as at December 31, 2018).
Depreciation and AmortizationUp 28% to $46.7 million for the three-month period ended June 30, 2019Up 28% to $93.2 million for the six-month period ended June 30, 2019
The increases for the three- and six-month periods are mainly due to: the 62% acquired interest in the Cartier Wind Farms.
Share of Loss of Joint Ventures and Associates Share of loss of $0.1 million for the three-month period ended June 30, 2019, compared with a share of loss of $2.0 million for the corresponding period in 2018 Share of loss of $7.0 million for the six-month period ended June 30, 2019, compared with a share of loss of $0.9 million for the corresponding period in 2018
The improvement of share of loss of the joint ventures and associates for the three-month period is mainly due to: an increase in the earnings allocated to Innergex from the Shannon and Flat Top wind farms combined with a
positive variation attributable to the hypothetical liquidation at book value ("HLBV") due to more favourable assumptions on market conditions at the end of the quarter;
The decrease was partly offset by: a loss from the Energía Llaima joint venture.
The increase in share of loss of the joint ventures and associates for the six-month period is mainly due to: a higher loss from the Toba Montrose and Jimmie Creek hydro facilities in British Columbia; a loss from the Energía Llaima joint venture; and a loss from the Umbata Falls facility.

Innergex Renewable Energy Inc. Management's Discussion and Analysis p242019 Second Quarter (in thousands of Canadian dollars, except as noted and amounts per share)
Unrealized Net Loss (Gain) on Financial Instruments Unrealized net loss of $8.5 million for the three-month period ended June 30, 2019, compared with an unrealized net gain of $8.1 million for the corresponding period in 2018 Unrealized net loss of $3.2 million for the six-month period ended June 30, 2019, compared with an unrealized net gain of $5.8 million for the corresponding period in 2018
Derivatives are used by the Corporation to manage its exposure to the risk of rising interest rates on its existing and upcoming debt financing and to reduce the Corporation's foreign exchange risk, thereby protecting the economic value of its facilities.
The unrealized net loss on financial instruments for the three-month period ended June 30, 2019 is mainly due to: an unfavourable variation of the CAD-EUR foreign exchange rate.
This item was partly offset by: the amortization of the accumulated losses from the pre-hedge accounting period; and a favourable variation of the Phoebe power hedge.
The unrealized net loss on financial instruments for the six-month period ended June 30, 2019, is due mainly to: a favourable variation of the CAD-EUR foreign exchange rate; the amortization of the accumulated losses from the pre-hedge accounting period; and a favourable variation of the Phoebe power hedge.
Income Tax Expense (Recovery of)Income tax expense of $1.5 million for the three-month period ended June 30, 2019Income tax recovery of $2.6 million for the six-month period ended June 30, 2019
For the three-month period ended June 30, 2019, the Corporation recorded : a current income tax expense of $19.6 million ($0.0 million for the corresponding period in 2018); and a deferred income tax recovery of $18.1 million (expense of $0.1 million for the corresponding period in 2018).
For the six-month period ended June 30, 2019, the Corporation recorded : a current income tax expense of $22.1 million ($2.5 million for the corresponding period in 2018); and and a deferred income tax recovery of $24.6 million ($4.4 million for the corresponding period in 2018).
For the three- and six-month periods ended June 30, 2019, the Corporation recorded an increase in the current income tax expense due mainly to the realization of a taxable gain following an interco transaction related to the introduction of a tax equity investor in the Phoebe solar project.
For the three- and six-month period ended June 30, 2019, the Corporation recorded a deferred income tax recovery due mainly to a deductible temporary difference registered following an interco transaction related to the introduction of a tax equity investor in the Phoebe solar project.
Net (Loss) Earnings from continuing operations At $10.5 million for the three-month period ended June 30, 2019At $14.9 million for the six-month period ended June 30, 2019
For the three-month period ended June 30, 2019, the Corporation recorded a net loss from continuing operations of $10.5 million(basic and diluted loss from continuing operations of $0.07 per share), compared with net earnings from continuing operations of $11.1 million (basic and diluted net earnings from continuing operations of $0.06 per share) for the corresponding period in 2018.
The $21.6 million variation can be explained by: a $16.6 million unfavourable variation in unrealized net loss (gain) on financial instruments; a $10.3 million increase in depreciation and amortization; a $9.3 million increase in finance costs; and a $1.4 million increase in the income tax expenses.
These items were partly offset by: a $13.6 million increase in Adjusted EBITDA; a $1.8 million decrease in the share of loss of joint ventures and associates; and a $0.6 million decrease in other net expenses.

Innergex Renewable Energy Inc. Management's Discussion and Analysis p252019 Second Quarter (in thousands of Canadian dollars, except as noted and amounts per share)
For the six-month period ended June 30, 2019, the Corporation recorded a net loss from continuing operations of $14.9 million(basic and diluted net loss from continuing operations of $0.14 per share), compared with net earnings from continuing operations of $1.4 million (basic and diluted net earnings from continuing operations of $0.03 per share) for the corresponding period in 2018.
The $16.3 million variation can be explained by: a $20.5 million increase in depreciation and amortization; an $18.4 million increase in finance costs; a $9.0 million unfavourable variation in unrealized net loss (gain) on financial instruments; and a $6.1 million increase in the share of loss of joint ventures and associates.
These items were partly offset by: a $33.3 million increase in Adjusted EBITDA; a $3.7 million decrease in other net expenses; and a $0.7 million increase in the recovery of income taxes.
Adjusted Net Loss from continuing operations Down to $2.7 million for the three-month period ended June 30, 2019Down to $14.0 million for the six-month period ended June 30, 2019
When evaluating its operating results and to provide a more accurate picture of them, a key performance indicator for the Corporation is Adjusted Net Loss from continuing operations. Adjusted Net Loss from continuing operations is not a recognized measure under IFRS, has no standardized meaning prescribed by IFRS and therefore may not be comparable with measures presented by other issuers. Please refer to the "Non-IFRS Measures" section for more information.
Impact on net (loss) earnings of financial instrumentsThree months ended June 30 Six months ended June 30
2019 2018 2019 2018Restated 1,2 Restated1,2
Net (loss) earnings from continuing operations (10,453) 11,105 (14,873) 1,410Add (Subtract):
Unrealized net loss (gain) on financial instruments 8,506 (8,077) 3,194 (5,794)
Realized (gain) loss on financial instruments (448) 2 (448) (826)Income tax expenses (recovery of) related to above
items 247 (250) (774) 2,397Share of unrealized net gain on financial instruments
of joint ventures and associates, net of relatedincome tax (508) (3,191) (1,127) (7,814)
Adjusted Net Loss from continuing operations (2,656) (411) (14,028) (10,627)1. For more information on the restatement, please refer to the "Accounting Changes" section.2. For more information, please refer to the "Discontinued Operations" section.
Excluding loss (gain) on financial instruments and the related income taxes, Adjusted Net Loss from continuing operations for the three-month period ended June 30, 2019, would have been $2.7 million, compared with Adjusted Net Earnings from continuing operations of $0.4 million in 2018.
Excluding loss (gain) on financial instruments and the related income taxes, Adjusted Net Loss from continuing operations for the six-month period ended June 30, 2019, would have been $14.0 million, compared with Adjusted Net Loss from continuing operations of $10.6 million in 2018.
Non-controlling InterestsAttribution of losses of $3.4 million for the three-month period ended June 30, 2019, compared with an attribution of earnings of $3.5 million for the corresponding period in 2018Attribution of earnings of $2.5 million for the six-month period ended June 30, 2019, compared with an attribution of losses of $4.7 million for the corresponding period in 2018
Non-controlling interests are related to the non-wholly owned subsidiaries identified in the "Overview" section and to Creek Power Inc. and subsidiaries ("Creek Power"), which is wholly owned since May 15, 2018.
The non-controlling interests figures include the activities of HS Orka, which are now treated as discontinued operations.

Innergex Renewable Energy Inc. Management's Discussion and Analysis p262019 Second Quarter (in thousands of Canadian dollars, except as noted and amounts per share)
The attribution of losses from continuing operations to non-controlling interests of $2.7 million for the three-month period ended June 30, 2019, compared with an attribution of earnings of $1.1 million last year resulted mainly from:
a higher net loss at Innergex Europe, mostly explained by a higher unfavourable variation of unrealized gain on financial instruments; and
lower net income attributable to HHLP due to higher compensation interest on real-return bonds combined with lower revenues.
These items were partly offset by: the absence of losses allocated to Creek Power due to the acquisition of the remaining interest.
The attribution of losses from discontinued operations of $0.8 million for the three-month period ended June 30, 2019, compared with an attribution of earnings of $2.5 million for the corresponding period in 2018 is mainly explained by:
an unrealized loss on the change in fair value of the embedded derivatives held by HS Orka compared with an unrealized gain in the previous year, partially offset by the cessation of depreciation and amortization following the classification of its net assets as held for sale.
The attribution of earnings from continuing operations to non-controlling interests of $0.3 million for the six-month period ended June 30, 2019, compared with an attribution of losses of $5.7 million last year resulting mainly from:
the absence of loss allocated to Creek Power due to the acquisition of the remaining interest; net earnings as calculated by the HLBV model, attributable to the Kokomo and Spartan facilities; and the higher revenues at the Mesgi'g Ugju's'n wind facility.
These items were partly offset by: lower revenues at HHLP; and a higher net loss at Innergex Europe mostly explained by lower operating results.
The attribution of earnings from discontinued operations to non-controlling interests of $2.1 million for the six-month periodended June 30, 2019, compared with an attribution of earnings of $1.0 million for the corresponding period in 2018, is mainly explained by:
a decrease in the unrealized gain on the change in fair value of the embedded derivatives held by HS Orka, partially offset by the cessation of depreciation and amortization in the second quarter of 2019 following the classification of its net assets as held for sale in the first quarter of 2019.
GEOGRAPHIC SEGMENTSAs at June 30, 2019, and excluding its investments in joint ventures and associates, which are accounted for using the equity method, the Corporation had interests in the following operating facilities: 29 hydroelectric facilities, six wind farms and onesolar farm in Canada, 15 wind farms in France and one hydroelectric facility and two solar farms in the United States. The Corporation operates in four principal geographical areas, which are detailed below.
Three months ended June 30 Six months ended June 302019 2018 2019 2018
Revenues Restated1,2 Restated1,2
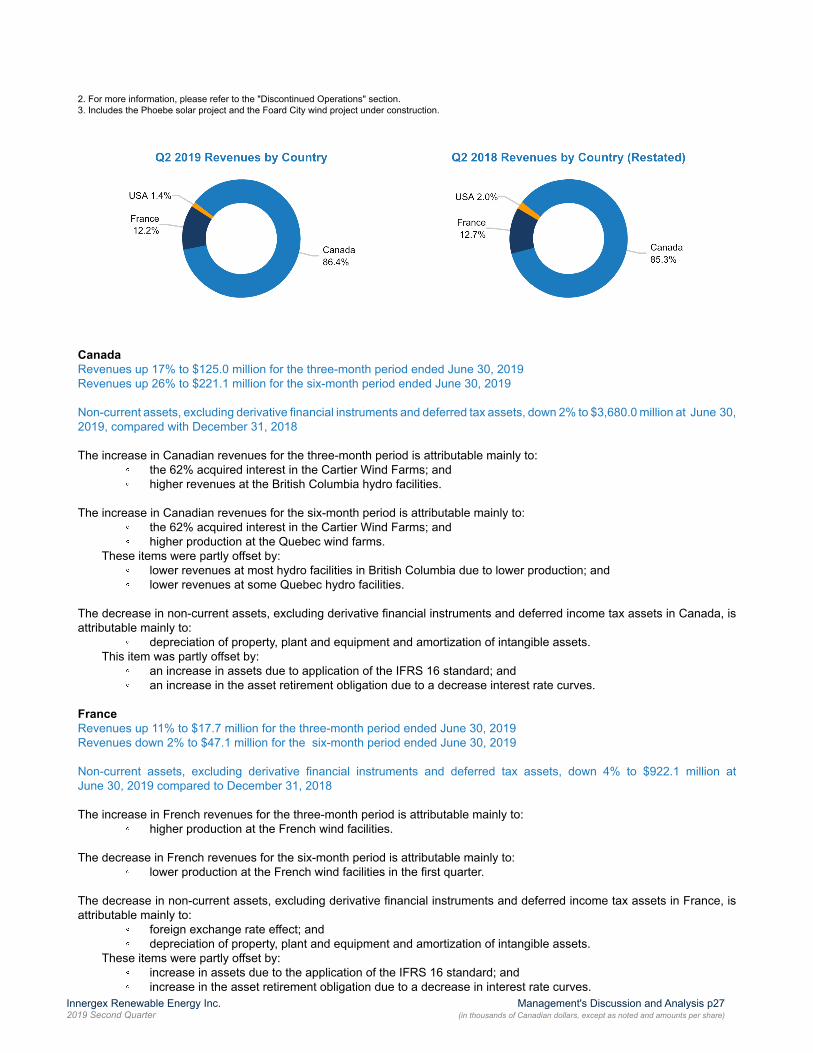
Canada 125,014 106,545 221,144 174,975France 17,677 15,860 47,139 48,080United States 2,002 2,509 2,829 3,647Chile — — — —
144,693 124,914 271,112 226,7021. For more information on the restatement, please refer to the "Accounting Changes" section.2. For more information, please refer to the "Discontinued Operations" section.
As atJune 30, 2019 December 31, 2018
Non-current assets, excluding derivative financial instruments and deferred tax assets 1,2
Canada 3,680,012 3,757,207France 922,090 956,214United States 3 1,219,168 526,716Chile 144,382 154,299
5,965,652 5,394,4361. Includes the investments in joint ventures and associates.
Innergex Renewable Energy Inc. Management's Discussion and Analysis p272019 Second Quarter (in thousands of Canadian dollars, except as noted and amounts per share)
2. For more information, please refer to the "Discontinued Operations" section.3. Includes the Phoebe solar project and the Foard City wind project under construction.
CanadaRevenues up 17% to $125.0 million for the three-month period ended June 30, 2019Revenues up 26% to $221.1 million for the six-month period ended June 30, 2019
Non-current assets, excluding derivative financial instruments and deferred tax assets, down 2% to $3,680.0 million at June 30, 2019, compared with December 31, 2018
The increase in Canadian revenues for the three-month period is attributable mainly to: the 62% acquired interest in the Cartier Wind Farms; and higher revenues at the British Columbia hydro facilities.
The increase in Canadian revenues for the six-month period is attributable mainly to: the 62% acquired interest in the Cartier Wind Farms; and higher production at the Quebec wind farms.
These items were partly offset by: lower revenues at most hydro facilities in British Columbia due to lower production; and lower revenues at some Quebec hydro facilities.
The decrease in non-current assets, excluding derivative financial instruments and deferred income tax assets in Canada, is attributable mainly to:
depreciation of property, plant and equipment and amortization of intangible assets. This item was partly offset by:
an increase in assets due to application of the IFRS 16 standard; and an increase in the asset retirement obligation due to a decrease interest rate curves.
FranceRevenues up 11% to $17.7 million for the three-month period ended June 30, 2019Revenues down 2% to $47.1 million for the six-month period ended June 30, 2019
Non-current assets, excluding derivative financial instruments and deferred tax assets, down 4% to $922.1 million at June 30, 2019 compared to December 31, 2018
The increase in French revenues for the three-month period is attributable mainly to: higher production at the French wind facilities.
The decrease in French revenues for the six-month period is attributable mainly to: lower production at the French wind facilities in the first quarter.
The decrease in non-current assets, excluding derivative financial instruments and deferred income tax assets in France, is attributable mainly to:
foreign exchange rate effect; and depreciation of property, plant and equipment and amortization of intangible assets.
These items were partly offset by: increase in assets due to the application of the IFRS 16 standard; and increase in the asset retirement obligation due to a decrease in interest rate curves.

Innergex Renewable Energy Inc. Management's Discussion and Analysis p282019 Second Quarter (in thousands of Canadian dollars, except as noted and amounts per share)
United StatesRevenues down 20% to $2.0 million for the three-month period ended June 30, 2019Revenues down 22% to $2.8 million for the six-month period ended June 30, 2019
Non-current assets, excluding derivative financial instruments and deferred tax assets, up 131% to $1,219.2 million at June 30, 2019, compared with December 31, 2018
The decrease in the US revenues for the three-month period is attributable mainly to: lower production at the hydro and solar facilities.
The decrease in the US revenues for the six-month period is attributable mainly to: lower production at the hydro facility; and lower revenues at the solar facilities.
The increase in non-current assets, excluding derivative financial instruments and deferred income tax assets in the United States is attributable mainly to:
the addition of the Phoebe solar project and the Foard City wind project, both being under construction; and the increase in assets due to application of the IFRS 16 standard.
These items were partly offset by: depreciation of property, plant and equipment and amortization of intangible assets.
ChileNon-current assets, excluding derivative financial instruments and deferred tax assets, down 6% at $144.4 million at June 30, 2019, compared with December 31, 2018
The Corporation's investment in Energía Llaima in Chile is accounted for using the equity method; therefore its revenues are not consolidated.
For the period ended June 30, 2019, the decrease in non-current assets is attributable to the reduction in the investment value due to a comprehensive loss attributable to Energía Llaima.

Innergex Renewable Energy Inc. Management's Discussion and Analysis p292019 Second Quarter (in thousands of Canadian dollars, except as noted and amounts per share)
DISCONTINUED OPERATIONS FINANCIAL RESULTS
Three months ended June 30, 2019 Three months ended June 30, 2018Innergex1 HS Orka2 Total Innergex1 HS Orka2 Total
Restated3
Production 1,741,953 196,878 1,938,831 1,509,599 321,580 1,831,179Revenues 144,693 13,412 158,105 124,914 25,578 150,492Adjusted EBITDA4 105,248 3,521 108,769 91,660 8,258 99,918Net (loss) earnings (10,453) 17,798 7,345 11,105 5,756 16,861
1. Equivalent to continuing operations.2. Equivalent to discontinued operations.3. For more information on the restatement, please refer to the "Accounting Changes" section.4. Adjusted EBITDA is not a recognized measure under IFRS and therefore may not be comparable to those presented by other issuers. Please refer to the "Non-
IFRS Measures" section of this MD&A for more information.
Six months ended June 30, 2019 Six months ended June 30, 2018Innergex1 HS Orka2 Total Innergex1 HS Orka2 Total
Restated3
Production 3,050,458 545,424 3,595,882 2,453,050 517,217 2,970,267Revenues 271,112 40,006 311,118 226,702 41,995 268,697Adjusted EBITDA4 198,491 13,291 211,782 165,226 3,909 169,135Net (loss) earnings (14,873) 21,364 6,491 1,410 611 2,021
1. Equivalent to continuing operations.2. Equivalent to discontinued operations.3. For more information on the restatement, please refer to the "Accounting Changes" section.4. Adjusted EBITDA is not a recognized measure under IFRS and therefore may not be comparable to those presented by other issuers. Please refer to the "Non-
IFRS Measures" section of this MD&A for more information.
As at May 23, 2019CAD
Consideration received or receivable, net of transaction costs:Cash consideration (US$299,910) 404,219Consideration payable for working capital adjustment (US$2,542) (3,327)Transaction costs (6,453)
Total disposal consideration, net of transaction costs 394,439Carrying amount of net assets sold 331,147Gain on sale before reclassification of foreign currency translation differences 63,292Reclassification of foreign currency translation differences 46,015Gain on sale 17,277
As at May 23, 2019Current assets 37,039Non-current assets 855,734
892,773
Current liabilities 71,976Non-current liabilities 228,804Equity attributable to owners of the parent 331,147Non-controlling interests 260,846
892,773
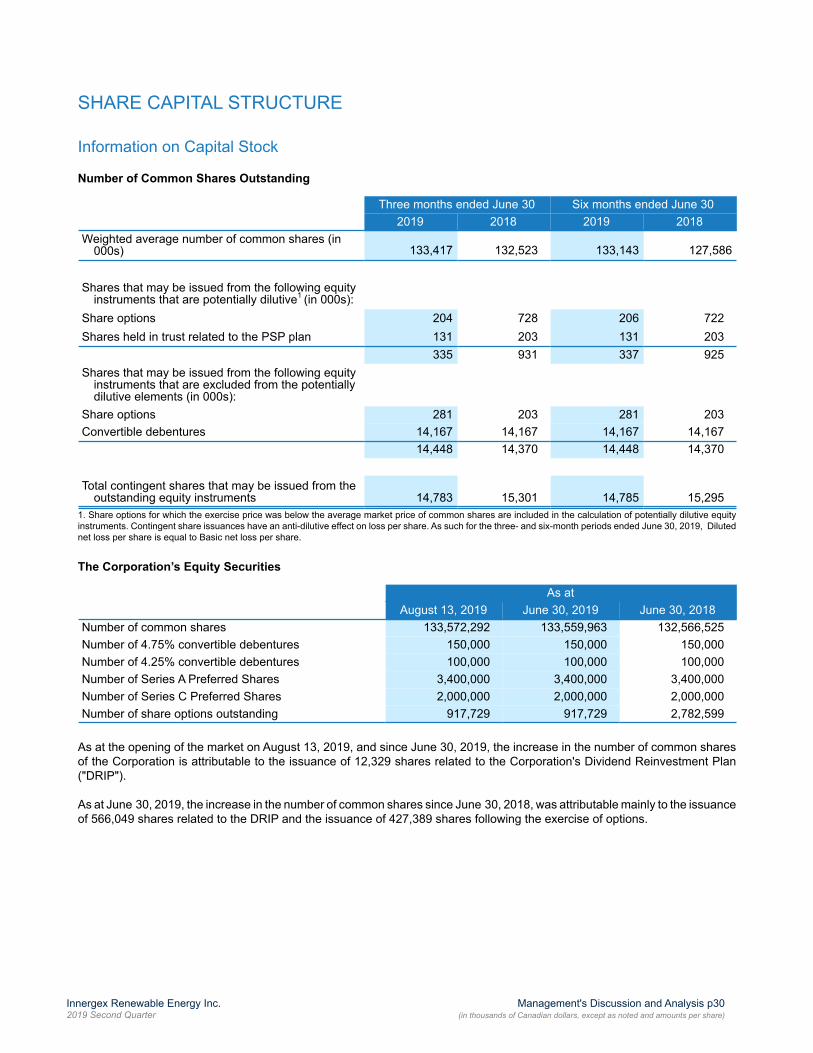
Innergex Renewable Energy Inc. Management's Discussion and Analysis p302019 Second Quarter (in thousands of Canadian dollars, except as noted and amounts per share)
SHARE CAPITAL STRUCTURE
Information on Capital Stock
Number of Common Shares Outstanding
Three months ended June 30 Six months ended June 302019 2018 2019 2018
Weighted average number of common shares (in000s) 133,417 132,523 133,143 127,586
Shares that may be issued from the following equity instruments that are potentially dilutive1 (in 000s):
Share options 204 728 206 722Shares held in trust related to the PSP plan 131 203 131 203
335 931 337 925Shares that may be issued from the following equity
instruments that are excluded from the potentially dilutive elements (in 000s):
Share options 281 203 281 203Convertible debentures 14,167 14,167 14,167 14,167
14,448 14,370 14,448 14,370
Total contingent shares that may be issued from theoutstanding equity instruments 14,783 15,301 14,785 15,295
1. Share options for which the exercise price was below the average market price of common shares are included in the calculation of potentially dilutive equity instruments. Contingent share issuances have an anti-dilutive effect on loss per share. As such for the three- and six-month periods ended June 30, 2019, Diluted net loss per share is equal to Basic net loss per share.
The Corporation’s Equity Securities
As atAugust 13, 2019 June 30, 2019 June 30, 2018
Number of common shares 133,572,292 133,559,963 132,566,525Number of 4.75% convertible debentures 150,000 150,000 150,000Number of 4.25% convertible debentures 100,000 100,000 100,000Number of Series A Preferred Shares 3,400,000 3,400,000 3,400,000Number of Series C Preferred Shares 2,000,000 2,000,000 2,000,000Number of share options outstanding 917,729 917,729 2,782,599
As at the opening of the market on August 13, 2019, and since June 30, 2019, the increase in the number of common shares of the Corporation is attributable to the issuance of 12,329 shares related to the Corporation's Dividend Reinvestment Plan ("DRIP").
As at June 30, 2019, the increase in the number of common shares since June 30, 2018, was attributable mainly to the issuance of 566,049 shares related to the DRIP and the issuance of 427,389 shares following the exercise of options.

Innergex Renewable Energy Inc. Management's Discussion and Analysis p312019 Second Quarter (in thousands of Canadian dollars, except as noted and amounts per share)
Dividends
The Corporation's dividend policy is determined by its board of directors and is based on the Corporation's operating results, cash flows, financial condition, debt covenants, long-term growth prospects, solvency test imposed under corporate law for the declaration of dividends and other relevant factors.
The following dividends were declared by the Corporation:
Three months ended June 30 Six months ended June 302019 2018 2019 2018
Dividends declared on common shares1 23,373 22,536 46,733 45,031
Dividends declared on common shares ($/share) 0.175 0.170 0.350 0.340
Dividends declared on Series A Preferred Shares 767 767 1,533 1,533Dividends declared on Series A Preferred Shares($/share) 0.2255 0.2255 0.4510 0.4510
Dividends declared on Series C Preferred Shares 719 719 1,438 1,438Dividends declared on Series C Preferred Shares($/share) 0.359375 0.359375 0.718750 0.718750
1. The increase in dividends declared on common shares is attributable to the increase in quarterly dividend, to the issuance of shares following the exercise of share options and to the issuance of shares under the DRIP.
The following dividends will be paid by the Corporation on October 15, 2019:
Date ofannouncement Record date Payment date
Dividend percommon share ($)
Dividend per Series APreferred Share ($)
Dividend per Series CPreferred Share ($)
08/13/2019 9/30/2019 10/15/2019 0.1750 0.2255 0.359375
On February 27, 2019, the Board of Directors increased the quarterly dividend from $0.170 to $0.175 per common share, corresponding to an annual dividend of $0.70 per common share. This is the sixth consecutive $0.02 annual dividend increase.
Normal Course Issuer Bid
On May 21, 2019, Innergex announced that it has received approval from the Toronto Stock Exchange (TSX) to proceed with a normal course issuer bid on its common shares (the "New Bid"). Under the New Bid, the Corporation could purchase for cancellation up to 2,000,000 of its common shares, representing approximately 1.5% of the 133,559,963 issued and outstanding common shares of the Corporation as at May 15, 2019. The New Bid commenced on May 24, 2019 and will terminate on May 23, 2020. Up to June 30, 2019, no common shares have been purchased and cancelled.
In August 2017, the Corporation proceeded with a normal course issuer bid on its Common Shares (the "Bid") covering the period between August 17, 2017, and August 16, 2018. The Corporation could purchase for cancellation up to 2,000,000 of its Common Shares, corresponding to approximately 1.84% of the 108,640,790 issued and outstanding Common Shares as at August 14, 2017. Under the Bid, the Corporation has entered into an automatic purchase plan agreement with a designated broker to allow for purchases of Common Shares at times when it would ordinarily not be permitted to do so due to self-imposed blackout periods or regulatory restrictions. Under the Bid, the Corporation purchased for cancellation 697,212 Common Shares at an average price of $13.60 per share, for an aggregate consideration of $9.5 million during the year ended December 31, 2018.

Innergex Renewable Energy Inc. Management's Discussion and Analysis p322019 Second Quarter (in thousands of Canadian dollars, except as noted and amounts per share)
FINANCIAL POSITION
As at June 30, 2019 December 31, 2018
ASSETSCurrent assets
Cash and cash equivalents 88,622 79,586Restricted cash 63,564 29,981Other current assets 105,201 118,710
Total current assets 257,387 228,277
Non-current assetsProperty, plant and equipment 4,681,295 4,482,928Intangible assets 697,888 925,009Investments in joint ventures and associates 452,212 604,773Goodwill 61,275 109,995Other non-current assets 175,353 130,302
Total non-current assets 6,068,023 6,253,0076,325,410 6,481,284
LIABILITIESCurrent liabilities 892,781 641,500
Non-current liabilitiesLong-term debt 3,853,114 4,024,324Convertible debentures 240,038 238,648Other non-current liabilities 649,314 617,251
Total non-current liabilities 4,742,466 4,880,2235,635,247 5,521,723
SHAREHOLDERS' EQUITYTotal shareholders’ equity 690,163 959,561
6,325,410 6,481,284

Innergex Renewable Energy Inc. Management's Discussion and Analysis p332019 Second Quarter (in thousands of Canadian dollars, except as noted and amounts per share)
Working Capital Items
Current assetsCurrent assets amounted to $257.4 million as at June 30, 2019, compared with $228.3 million as at December 31, 2018, an increase of $29.1 million due mainly to:
an increase of $33.6 million in restricted cash, mainly due to the $49.9 million related to the contribution received from the Corporation's tax equity partner on the Phoebe solar project; and
an increase of $9.0 million in cash and cash equivalents derived from operating, financing and investing activities. This increase was partly offset by:
a decrease of $15.3 million in accounts receivable stemming primarily from the sale of HS Orka, and from lower revenues in June 2019 compared to December 2018.
Current liabilitiesCurrent liabilities amounted to $892.8 million as at June 30, 2019, compared to $641.5 million as at December 31, 2018, an increase of $251.3 million due mainly to:
a $126.5 million increase of the current portion of the long-term debt and other liabilities due to drawings on the Phoebe and Foard construction loans; and
an increase in accounts payable of $130.9 million arising mainly from the construction of the Foard City wind and Phoebe solar projects, partly offset by a decrease in accounts payable stemming from the sale of HS Orka.
Working capital was negative at $635.4 million, as at June 30, 2019, with a working capital ratio of 0.29:1.00 (as at December 31, 2018, working capital was negative at $413.2 million, with a working capital ratio of 0.36:1.00), a deterioration of $222.2 milliondue to the items explained above.
The Corporation considers its current level of working capital to be sufficient to meet its needs, considering that the construction loans for the Foard City wind and Phoebe solar projects will be reimbursed through the tax equity investment at commercial operation. As at June 30, 2019, the Corporation had $700.0 million in revolving term credit facilities and had drawn $312.5 million as cash advances, while $191.5 million had been used for issuing letters of credit, leaving $196.0 million available.
Non-current assetsNon-current assets amounted to $6,068.0 million as at June 30, 2019, compared to $6,253.0 million as at December 31, 2018, a decrease of $185.0 million due mainly to:
an $855.7 million decrease stemming from the sale of HS Orka, comprised of the following: – $466.1 million in property, plant and equipment; – $189.4 million in intangible assets;– $15.5 million in development costs; – $130.0 million in investments in associates for the Blue Lagoon Spa; – $47.3 million in goodwill; and– $7.4 million in other non-current assets;
depreciation and amortization; and a strengthening of the Canadian dollar against the Euro and the US dollar.
These items were partly offset by: a $674.6 million increase in property, plant and equipment due mainly to the advancement of the Foard City and
Phoebe construction projects; and a $123.9 million increase in property, plant and equipment stemming from the initial application of IFRS 16 (please
refer to the "Accounting Changes" section).

Innergex Renewable Energy Inc. Management's Discussion and Analysis p342019 Second Quarter (in thousands of Canadian dollars, except as noted and amounts per share)
Non-current liabilitiesNon-current liabilities amounted to $4,742.5 million as at June 30, 2019, compared with $4,880.2 million as at December 31, 2018, a decrease of $137.8 million mainly due to:
a $229.4 million decrease stemming from the sale of HS Orka, comprised of the following: – $37.6 million in financial instruments;– $88.9 million in long-term debt;– $1.2 million related to lease obligation;– $39.3 million in other liabilities related to the pension fund; and– $62.4 million in deferred tax liabilities.
an $82.4 million net decrease in long-term debt mainly due to net repayments made on the corporate revolving facilities with the proceeds received from the sale of HS Orka, as well as scheduled principal repayments on long-term debt and a favourable fluctuation in exchange rates; and
a strengthening of the Canadian dollar against the Euro and the US dollar These items were partly offset by:
a $40.2 million net increase in derivative financial instruments due to an overall decrease in interest rates; and a $117.2 million increase in lease liabilities stemming from the initial application of IFRS 16 (please refer to the
"Accounting Changes" section).
As at June 30, 2019, the Corporation and its subsidiaries have met all material financial and non-financial conditions, unless indicated below, related to their credit agreements, trust indentures and PPAs. Were they not met, certain financial and non-financial covenants included in the credit agreements, trust indentures and PPAs entered into by various subsidiaries of the Corporation could limit the capacity of these subsidiaries to transfer funds to the Corporation. These restrictions could have a negative impact on the Corporation's ability to meet its obligations.
Derivative Financial Instruments and Risk ManagementThe Corporation uses derivative financial instruments ("derivatives") to manage its exposure to the risk of increasing interest rates on its debt financing, to manage its exposure to exchange rate fluctuations on the future repatriation of cash flows from its French operations, and to reduce exposure to the risk of decreasing power prices.
Current Notional Fair Value After Credit Adjustment
As at June 30, 2019 CurrencyCurrency of
origin CADCurrency of
origin CAD
Interest rate swaps CAD 1,070,410 1,070,410 (74,275) (74,275)Interest rate swaps USD 404,614 529,518 (11,765) (15,404)Interest rate swaps EUR 193,027 287,360 (14,901) (22,184)
Foreign exchange forward contracts EUR VS CAD 369,986 550,798 (23,006) (23,006)
Power Hedges USD N/A N/A 41,256 53,991
(82,691) (80,878)
Shareholders' Equity Shareholders' equity amounted to $690.2 million as at June 30, 2019, compared with $959.6 million as at December 31, 2018, a decrease of $269.4 million mainly due to:
a $260.8 million decrease in non-controlling interests stemming from the sale of HS Orka; dividends declared on common and preferred shares totaling $49.7 million; and distributions declared to non-controlling interests of $10.4 million.
The decrease is partly offset by: a $49.9 million equity funding received from the Corporation's tax equity partner on the Phoebe solar project.
Off-Balance-Sheet ArrangementsAs at June 30, 2019, the Corporation had issued letters of credit totaling $353.7 million, including $191.5 million from its revolving term credit facilities, to meet its obligations under its various PPAs and other agreements. These letters of credit were issued as payment securities for various projects under construction (including the Phoebe solar project and the Foard City wind project) and as performance or financial guarantees under PPAs and other contractual obligations. As at that date, Innergex had also issued a total of $109.2 million in corporate guaranties used mainly to guarantee the long-term currency hedging instruments of its operations in France. The corporate guaranties were also used to support the performance of the Brown Lake and Miller Creek hydroelectric facilities, the post-commissioning activities at the Mesgi'g Ugju's'n facility, the Foard City development project and the Griffin Trail, Boswell and other prospective projects.

Innergex Renewable Energy Inc. Management's Discussion and Analysis p352019 Second Quarter (in thousands of Canadian dollars, except as noted and amounts per share)
Tax equity investors in U.S. projects generally require sponsor guaranties as a condition to their investment. To support the tax equity investments at Shannon, Kokomo, Spartan, Flat Top, Phoebe and Foard, Alterra, a subsidiary of Innergex, has executed guaranties effective on funding of the tax equity investments indemnifying the tax equity investors against certain breaches of project-level representations, warranties and covenants and other events. The Corporation believes these indemnifications cover matters that are substantially under its control and are very unlikely to occur. With respect to the Phoebe project, Alterra has also provided a guarantee to the lenders related to debt-service payments, which will become effective only in the unlikely event that the Phoebe tax equity investors call upon their corresponding guarantee.

Innergex Renewable Energy Inc. Management's Discussion and Analysis p362019 Second Quarter (in thousands of Canadian dollars, except as noted and amounts per share)
LIQUIDITY AND CAPITAL RESOURCES
Three months ended June 30 Six months ended June 302019 2018 2019 2018
Restated 1,2 Restated 1,2
OPERATING ACTIVITIES
Cash flows from operating activities fromcontinuing operations before changes innon-cash operating working capital items 60,257 53,129 117,758 88,347
Changes in non-cash operating workingcapital items 16,372 (1,784) 947 10,856
Cash flows from operating activities fromcontinuing operations 76,629 51,345 118,705 99,203
Cash flows from operating activities fromdiscontinued operations 2,580 16,561 13,122 19,014
79,209 67,906 131,827 118,217
FINANCING ACTIVITIESCash flows from financing activities from
continuing operations (24,851) 86,054 69,327 186,774Cash flows from financing activities from
discontinued operations 20,689 (1,139) 20,059 2,756(4,162) 84,915 89,386 189,530
INVESTING ACTIVITIES
Cash flows from investing activities fromcontinuing operations (74,613) 12,371 (178,984) (125,611)
Cash flows from investing activities fromdiscontinued operations (13,395) (5,854) (31,957) (11,924)
(88,008) 6,517 (210,941) (137,535)Effects of exchange rate changes on cash
and cash equivalents (553) (55) (1,236) 954Net change in cash and cash equivalents (13,514) 159,283 9,036 171,166Cash and cash equivalents, beginning of
period 97,972 73,797 79,586 61,914
Plus: Cash and cash equivalents held for sale beginning of period 4,164 — — —
Cash and cash equivalents, end of period 88,622 233,080 88,622 233,0801. For more information on the restatement, please refer to the "Accounting Changes" section.2. For more information, please refer to the "Discontinued Operations" section.

Innergex Renewable Energy Inc. Management's Discussion and Analysis p372019 Second Quarter (in thousands of Canadian dollars, except as noted and amounts per share)
Cash Flows from Operating Activities from Continuing Operations
Up $25.3 million to $76.6 million for the three-month period ended June 30, 2019Up $19.5 million to $118.7 million for the six-month period ended June 30, 2019
For the three-month period ended on June 30, 2019, compared with the same period last year
The increase in cash flows from operating activities from continuing operations is primarily attributable to: an $18.2 million favourable change in non-cash operating working capital items, due mainly to:
– a $16.3 million unfavourable variation in non-cash operating working capital changes from accounts receivable;
– a $33.7 million favourable variation in non-cash operating working capital changes from accounts payable and other payables; and
a $13.6 million increase in Adjusted EBITDA.
Discontinued operations contributed to decreasing cash flows from operating activities by $14.0 million, from $16.6 million in 2018 to $2.6 million in 2019.
For the six-month period ended on June 30, 2019, compared with the same period last year
The increase in cash flows from operating activities from continuing operations is primarily attributable to: a $33.3 million increase in Adjusted EBITDA.
The increase was partly offset by: a $9.9 million unfavourable change in non-cash operating working capital items, due mainly to:
– a $27.4 million unfavourable variation in non-cash operating working capital changes from accounts receivable; and
– a $17.5 million favourable variation in non-cash operating working capital changes from accounts payable and other payables;
Discontinued operations also contributed to increasing cash flows from operating activities by $5.9 million, from $19.0 millionin 2018 to $13.1 million in 2019.

Innergex Renewable Energy Inc. Management's Discussion and Analysis p382019 Second Quarter (in thousands of Canadian dollars, except as noted and amounts per share)
Cash Flows from Financing Activities from Continuing Operations
Down $110.9 million to a cash outflow of $24.9 million for the three-month period ended June 30, 2019Cash inflow down $117.4 million to $69.3 million for the six-month period ended June 30, 2019
For the three-month period ended on June 30, 2019, compared with the same period last year
The increase in cash outflows from financing activities from continuing operations stems mainly from: a $143.6 million decrease in cash flows related to the issuance of convertible debentures in the second quarter
of 2018, while no issuance occurred during the same period of 2019. a $45.1 million net decrease in long-term debt in 2019, compared with a $35.7 million net decrease in long-term
debt in 2018. The $45.1 million net decrease in long-term debt in 2019 is mainly attributable to:– the reimbursement of the $228.0 million credit facility contracted on October 24, 2018 and the utilized
portion of the additional borrowing capacity of $100.0 million that was obtained on April 23, 2019; and– scheduled repayments of project loans.
The above decrease in long-term debt was partly offset by:– a $280.5 million draw on the Foard construction loan used for the Foard City wind project; and– a $101.2 million draw on the Phoebe construction loan used for the Phoebe solar project;
These items were partly offset by: a $49.9 million funding received from the Corporation's tax equity partner on the Phoebe solar project.
Discontinued operations also contributed to increasing cash flows from financing activities $21.8 million, from an outflow $1.1 million in 2018, to an inflow $20.7 million in 2019.
For the six-month period ended on June 30, 2019, compared with the same period last year
The decrease in cash flows from financing activities from continuing operations stems mainly from: a $143.6 million decrease in cash flows related to the issuance of convertible debentures in the second quarter
of 2018, while no issuance occurred during the same period of 2019; and a $79.9 million net increase in long-term debt in 2019, compared with a $93.8 million net increase in long-term
debt in 2018. These items were partly offset by:
a $49.9 million funding received from the Corporation's tax equity partner on the Phoebe solar project.
Discontinued operations also contributed to increasing cash flows from financing activities by $17.3 million, from $2.8 millionin 2018, to $20.1 million in 2019.

Innergex Renewable Energy Inc. Management's Discussion and Analysis p392019 Second Quarter (in thousands of Canadian dollars, except as noted and amounts per share)
Cash Flows from Investing Activities from Continuing OperationsDown $87.0 million to a cash outflow of $74.6 million for the three-month period ended June 30, 2019Outflow down $53.4 million to $179.0 million for the six-month period ended June 30, 2019
For the three-month period ended on June 30, 2019, compared with the same period last year
The increase in cash outflow from investing activities from continuing operations is mainly related to: increased additions to property, plant and equipment of $413.6 million, from a $7.4 million outflow in 2018 to
$421.1 million in 2019, related primarily to the construction of the Phoebe solar and Foard City wind projects; a $59.2 million increase in restricted cash, of which $49.9 million relates to the contribution received from the
Corporation's tax equity partner on the Phoebe solar project. The increase in cash outflow from investing activities from continuing operations is partly offset by:
a $383.9 million cash inflow representing the US$299.9 million ($404.2 million) proceeds received from the sale of HS Orka, net of transaction costs and cash disposed.
Discontinued operations contributed to the decrease in cash outflows from investing activities by $7.5 million, from an outflow of $5.9 million in 2018 to an outflow of $13.4 million in 2019.
For the six-month period ended on June 30, 2019, compared with the same period last year
The increase in cash outflow from investing activities from continuing operations is mainly related to: increased additions to property, plant and equipment of $500.1 million, from a $19.2 million outflow in 2018 to
$519.3 million in 2019, related primarily to the construction of the Phoebe solar and Foard City wind projects; a $53.6 million increase in restricted cash, of which $49.9 million relates to the contribution received from the
Corporation's tax equity partner on the Phoebe solar project. The increase in cash outflow from investing activities from continuing operations is partly offset by:
a decrease in cash outlays toward business acquisitions, from $113.0 million in 2018 in relation to the Alterra acquisition to nil in 2019; and
a $383.9 million cash inflow stemming from the US$299.9 million ($404.2 million) proceeds received from the sale of HS Orka, net of transaction costs and cash disposed.
Discontinued operations partly offset the decrease in cash outflows from investing activities by $20.0 million, from an outflow of $11.9 million in 2018 to an outflow of $32.0 million in 2019.

Innergex Renewable Energy Inc. Management's Discussion and Analysis p402019 Second Quarter (in thousands of Canadian dollars, except as noted and amounts per share)
FREE CASH FLOW AND PAYOUT RATIO
Free Cash Flow and Payout Ratio calculation1Trailing twelve months ended
June 302019 2018
Restated 3 Restated 3
Cash flows from operating activities 222,999 240,022Add (Subtract) the following items:
Changes in non-cash operating working capital items 17,294 (42,811)Maintenance capital expenditures net of proceeds from disposals (9,224) (7,394)Scheduled debt principal payments (104,385) (83,140)Free Cash Flow attributed to non-controlling interests2 (22,335) (19,216)Dividends declared on Preferred shares (5,942) (5,942)Transaction costs related to realized acquisitions 2,121 10,963Realized loss (gain) on derivative financial instruments 6,919 (827)Recovery of maintenance capital expenditures and prospective project expenses, net of attribution to non-controlling interests4 8,242 —
Free Cash Flow 115,689 91,655
Dividends declared on common shares 91,917 80,877Payout Ratio 79% 88%
Adjust for the following items:Prospective projects expenses 17,937 16,475
Adjusted Free Cash Flow 133,626 108,130
Dividends declared on common shares - DRIP adjusted 86,650 72,877Adjusted Payout Ratio 65% 67%
1. Free Cash Flow, Adjusted Free Cash Flow, Payout ratio and Adjusted Payout Ratio are not recognized measures under IFRS and therefore may not be comparable to those presented by other issuers. Please refer to the "Non-IFRS Measures" section for more information.
2. The portion of Free Cash Flow attributed to non-controlling interests is subtracted, regardless of whether an actual distribution to non-controlling interests is made, in order to reflect the fact that such distributions may not occur in the period they are generated.
3. For more information on the restatement, please refer to the "Accounting Changes" section.4. The sale of HS Orka has allowed for the recovery of maintenance capital expenditures and prospective project expenses incurred thereon since the acquisition
of the project in February 2018, totaling $5.7 million and $9.6 million, respectively. An amount of $7.1 million was deducted from the total recovery as it pertains to non-controlling interests.
Free Cash Flow
For the trailing twelve months ended June 30, 2019, the Corporation generated Free Cash Flow of $115.7 million, compared with $91.7 million for the corresponding period last year.
The increase in Free Cash Flow is due mainly to: higher cash flows from operating activities before changes in non-cash working capital items; and the recovery of maintenance capital expenditures and prospective project expenses, net of attribution to non-
controlling interests.This item was partly offset by:
greater scheduled debt principal payments, mainly from the acquisition of Cartier and the French projects that reached term conversion in 2018.

Innergex Renewable Energy Inc. Management's Discussion and Analysis p412019 Second Quarter (in thousands of Canadian dollars, except as noted and amounts per share)
Payout Ratio
For the trailing twelve months ended June 30, 2019, the dividends on common shares declared by the Corporation amounted to 79% of Free Cash Flow, compared with 88% for the corresponding period last year.
This change results mainly from: a $24.0 million increase in Free Cash Flow.
This item was partly offset by: higher dividend payments as a result of the issuance of 24,327,225 shares on February 6, 2018, related to the
Alterra acquisition; an increase in the quarterly dividend; and additional shares issued under the DRIP.
The Payout Ratio is a measure of the Corporation's ability to sustain current dividends and dividend increases as well as its ability to fund its growth. The Payout Ratio level reflects the Corporation's decision to invest yearly in advancing the development of its Prospective Projects, which investments must be expensed as incurred. The Corporation considers such investments essential to its long-term growth and success, as it believes that the greenfield development of renewable energy projects offers the greatest potential internal rates of return and represents the most efficient use of management's expertise and value-added skills.

Innergex Renewable Energy Inc. Management's Discussion and Analysis p422019 Second Quarter (in thousands of Canadian dollars, except as noted and amounts per share)
QUARTERLY FINANCIAL INFORMATION
Three months ended
(in millions of dollars, unless otherwise stated)June 30,
2019March 31,
2019Dec. 31,
2018Sept. 30,
2018Restated 2,3 Restated 2,3
Production (MWh) 1,741,953 1,308,505 1,396,066 1,236,722Revenues 144.7 126.4 138.3 116.5Adjusted EBITDA1 105.2 93.2 103.3 83.7Net earnings (loss) 7.3 (0.9) 14.2 9.5Net (loss) earnings from continuing operations attributable to
owners of the parent (7.8) (7.4) 17.4 8.8Net (loss) earnings from continuing operations attributable to
owners of the parent ($ per share – basic and diluted) (0.07) (0.07) 0.12 0.06
Net earnings (loss) attributable to owners of the parent 10.8 (6.7) 15.2 10.7Net earnings (loss) attributable to owners of the parent ($ per
share – basic and diluted) 0.07 (0.06) 0.10 0.07Dividends declared on common shares 23.4 23.4 22.6 22.6Dividends declared on common shares, $ per share 0.175 0.175 0.170 0.170
1. Adjusted EBITDA is not a recognized measure under IFRS and therefore may not be comparable to those presented by other issuers. Please refer to the "Non-IFRS Measures" section for more information.
2. For more information on the restatement, please refer to the "Accounting Changes" section. 3. For more information, please refer to the "Discontinued Operations" section.
Three months ended
(in millions of dollars, unless otherwise stated)June 30,
2018March 31,
2018Dec. 31,
2017Sept. 30,
2017
Restated2,3 Restated2,3
Production (MWh) 1,509,599 944,108 1,106,060 1,243,099Revenues 124.9 101.8 108.0 108.2Adjusted EBITDA1 91.7 73.6 80.1 81.8Net earnings (loss) 16.9 (14.8) 3.4 4.2Net earnings (loss) from continuing operations attributable to
owners of the parent 10.0 (2.9) 7.0 5.7Net earnings (loss) from continuing operations attributable to
owners of the parent ($ per share – basic and diluted) 0.06 (0.04) 0.05 0.04
Net earnings (loss) attributable to owners of the parent 13.3 (6.6) 7.0 5.7Net earnings (loss) attributable to owners of the parent ($ per
share – basic and diluted) 0.09 (0.07) 0.05 0.04Dividends declared on common shares 22.5 22.5 17.9 17.9Dividends declared on common shares, $ per share 0.170 0.170 0.165 0.165
1. Adjusted EBITDA is not a recognized measure under IFRS and therefore may not be comparable to those presented by other issuers. Please refer to the "Non-IFRS Measures" section for more information.
2. For more information on the restatement, please refer to the "Accounting Changes" section. 3. For more information, please refer to the "Discontinued Operations" section.
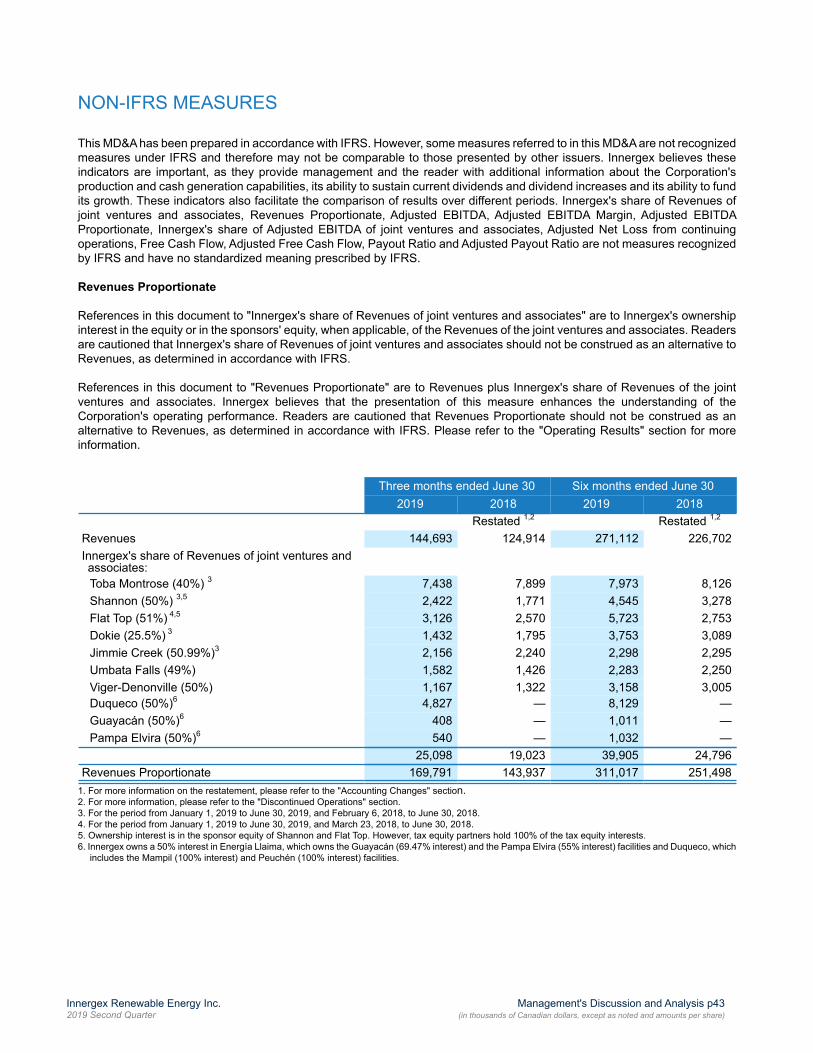
Innergex Renewable Energy Inc. Management's Discussion and Analysis p432019 Second Quarter (in thousands of Canadian dollars, except as noted and amounts per share)
NON-IFRS MEASURES
This MD&A has been prepared in accordance with IFRS. However, some measures referred to in this MD&A are not recognized measures under IFRS and therefore may not be comparable to those presented by other issuers. Innergex believes these indicators are important, as they provide management and the reader with additional information about the Corporation's production and cash generation capabilities, its ability to sustain current dividends and dividend increases and its ability to fund its growth. These indicators also facilitate the comparison of results over different periods. Innergex's share of Revenues of joint ventures and associates, Revenues Proportionate, Adjusted EBITDA, Adjusted EBITDA Margin, Adjusted EBITDA Proportionate, Innergex's share of Adjusted EBITDA of joint ventures and associates, Adjusted Net Loss from continuing operations, Free Cash Flow, Adjusted Free Cash Flow, Payout Ratio and Adjusted Payout Ratio are not measures recognized by IFRS and have no standardized meaning prescribed by IFRS.
Revenues Proportionate
References in this document to "Innergex's share of Revenues of joint ventures and associates" are to Innergex's ownership interest in the equity or in the sponsors' equity, when applicable, of the Revenues of the joint ventures and associates. Readers are cautioned that Innergex's share of Revenues of joint ventures and associates should not be construed as an alternative to Revenues, as determined in accordance with IFRS.
References in this document to "Revenues Proportionate" are to Revenues plus Innergex's share of Revenues of the joint ventures and associates. Innergex believes that the presentation of this measure enhances the understanding of the Corporation's operating performance. Readers are cautioned that Revenues Proportionate should not be construed as an alternative to Revenues, as determined in accordance with IFRS. Please refer to the "Operating Results" section for more information.
Three months ended June 30 Six months ended June 302019 2018 2019 2018
Restated 1,2 Restated 1,2
Revenues 144,693 124,914 271,112 226,702Innergex's share of Revenues of joint ventures andassociates:Toba Montrose (40%) 3 7,438 7,899 7,973 8,126Shannon (50%) 3,5 2,422 1,771 4,545 3,278Flat Top (51%) 4,5 3,126 2,570 5,723 2,753Dokie (25.5%) 3 1,432 1,795 3,753 3,089Jimmie Creek (50.99%)3 2,156 2,240 2,298 2,295Umbata Falls (49%) 1,582 1,426 2,283 2,250Viger-Denonville (50%) 1,167 1,322 3,158 3,005Duqueco (50%)6 4,827 — 8,129 —Guayacán (50%)6 408 — 1,011 —Pampa Elvira (50%)6 540 — 1,032 —
25,098 19,023 39,905 24,796Revenues Proportionate 169,791 143,937 311,017 251,498
1. For more information on the restatement, please refer to the "Accounting Changes" section.2. For more information, please refer to the "Discontinued Operations" section.3. For the period from January 1, 2019 to June 30, 2019, and February 6, 2018, to June 30, 2018.4. For the period from January 1, 2019 to June 30, 2019, and March 23, 2018, to June 30, 2018.5. Ownership interest is in the sponsor equity of Shannon and Flat Top. However, tax equity partners hold 100% of the tax equity interests.6. Innergex owns a 50% interest in Energía Llaima, which owns the Guayacán (69.47% interest) and the Pampa Elvira (55% interest) facilities and Duqueco, which
includes the Mampil (100% interest) and Peuchén (100% interest) facilities.

Innergex Renewable Energy Inc. Management's Discussion and Analysis p442019 Second Quarter (in thousands of Canadian dollars, except as noted and amounts per share)
Adjusted EBITDA and Adjusted EBITDA Margin
References in this document to “Adjusted EBITDA” are to net earnings (loss) from continuing operations, to which are added (deducted) provision (recovery) for income tax expenses, finance cost, depreciation and amortization, other net expenses, share of (earnings) loss of joint ventures and associates and unrealized net (gain) loss on financial instruments. Innergex believes that the presentation of this measure enhances the understanding of the Corporation's operating performance. Readers are cautioned that Adjusted EBITDA should not be construed as an alternative to net earnings, as determined in accordance with IFRS.
References in this document to "Adjusted EBITDA Margin" are to Adjusted EBITDA divided by revenues. Innergex believes that the presentation of this measure enhances the understanding of the Corporation's operating performance.
Three months ended June 30 Six months ended June 302019 2018 2019 2018
Restated 1,2 Restated 1,2
Net (loss) earnings from continuing operations (10,453) 11,105 (14,873) 1,410Income tax expense (recovery of) 1,493 100 (2,585) (1,887)Finance costs 58,259 48,972 111,230 92,875Depreciation and amortization 46,749 36,459 93,215 72,700EBITDA 96,048 96,636 186,987 165,098Other net expenses 552 1,118 1,278 5,006Share of loss of joint ventures and associates 142 1,983 7,032 916Unrealized net loss (gain) on financial instruments 8,506 (8,077) 3,194 (5,794)Adjusted EBITDA 105,248 91,660 198,491 165,226Adjusted EBITDA margin 72.7% 73.4% 73.2% 72.9%
1. For more information on the restatement, please refer to the "Accounting Changes" section.2. For more information, please refer to the "Discontinued Operations" section.

Innergex Renewable Energy Inc. Management's Discussion and Analysis p452019 Second Quarter (in thousands of Canadian dollars, except as noted and amounts per share)
Adjusted EBITDA Proportionate
References in this document to "Innergex's share of Adjusted EBITDA of the joint ventures and associates" are to Innergex's ownership interest in the equity or in the sponsors' equity, when applicable, of the Adjusted EBITDA of the joint ventures and associates.
References in this document to "Adjusted EBITDA Proportionate" are to Adjusted EBITDA plus Innergex's share of Adjusted EBITDA of the joint ventures and associates. Innergex believes that the presentation of this measure enhances the understanding of the Corporation's operating performance. Readers are cautioned that Adjusted EBITDA Proportionate should not be construed as an alternative to net earnings, as determined in accordance with IFRS. Please refer to the "Operating Results" section of this MD&A for more information.
Three months ended June 30 Six months ended June 302019 2018 2019 2018
Restated 1,2 Restated 1,2
Adjusted EBITDA 105,248 91,660 198,491 165,226Innergex's share of Adjusted EBITDA of jointventures and associates:Toba Montrose (40%) 3 6,004 6,359 5,016 5,878Shannon (50%) 3,5 1,149 569 2,108 1,328Flat Top (51%) 4,5 1,194 925 1,925 903Dokie (25.5%) 3 911 1,275 2,704 2,242Jimmie Creek (50.99%) 3 1,746 1,828 1,370 1,656Umbata Falls (49%) 1,436 1,318 1,862 2,022Viger-Denonville (50%) 898 1,081 2,551 2,500Duqueco (50%)6 2,082 — 3,661 —Guayacán (50%)6 149 — 553 —Pampa Elvira (50%)6 24 — 275 —
15,593 13,355 22,025 16,529Adjusted EBITDA Proportionate 120,841 105,015 220,516 181,755
1. For more information, please refer to the "Accounting Changes" section.2. For more information, please refer to the "Discontinued Operations" section.3. For the period from January 1, 2019, to June 30, 2019, and February 6, 2018, to June 30, 2018.4. For the period from January 1, 2019, to June 30, 2019, and March 23, 2018, to June 30, 2018.5. Ownership interest is in the sponsor equity of Shannon and Flat Top. However, tax equity partners hold 100% of the tax equity interests.6. Innergex owns a 50% interest in Energía Llaima, which owns the Guayacán (69.47% interest) and the Pampa Elvira (55% interest) facilities, and Duqueco,
which includes the Mampil (100% interest) and Peuchén (100% interest) facilities.

Innergex Renewable Energy Inc. Management's Discussion and Analysis p462019 Second Quarter (in thousands of Canadian dollars, except as noted and amounts per share)
Adjusted Net Loss from continuing operations
References to "Adjusted Net Loss from continuing operations" are to net earnings or losses from continuing operations of the Corporation, to which the following elements are added (subtracted): unrealized net (gain) loss on financial instruments; realized (gain) loss on financial instruments; income tax expense (recovery) related to the above items; and the share of unrealized net (gain) loss on derivative financial instruments of joint ventures and associates, net of related tax. Innergex uses derivative financial instruments to hedge its exposure to various risks. Accounting for derivatives under IFRS requires that all derivatives are marked-to-market with changes in the mark-to-market of the derivatives for which hedge accounting is not applied being taken to the profit and loss account. The application of this accounting standard results in a significant amount of profit and loss volatility arising from the use of derivatives that are not designated for hedge accounting. The Adjusted Net Loss from continuing operations of the Corporation aims to eliminate the impact of the mark-to-market rules on derivatives on the profit and loss of the Corporation. Innergex believes the analysis and presentation of net earnings or loss on this basis enhances understanding of the Corporation's operating performance. Readers are cautioned that Adjusted Net Loss from continuing operations should not be construed as an alternative to net earnings, as determined in accordance with IFRS. Please refer to the "Operating Results" section for reconciliation of the Adjusted Net Loss from continuing operations.
Free Cash Flow and Payout Ratio
References to “Free Cash Flow” are to cash flows from operating activities before changes in non-cash operating working capital items, less maintenance capital expenditures net of proceeds from disposals, scheduled debt principal payments, preferred share dividends declared and the portion of Free Cash Flow attributed to non-controlling interests, plus or minus other elements that are not representative of the Corporation's long-term cash generating capacity, such as transaction costs related to realized acquisitions (which are financed at the time of the acquisition), realized losses or gains on derivative financial instruments used to hedge the interest rate on project-level debt or the exchange rate on equipment purchases. Innergex believes that presentation of this measure enhances the understanding of the Corporation's cash generation capabilities, its ability to sustain current dividends and dividend increases and its ability to fund its growth. Readers are cautioned that Free Cash Flow should not be construed as an alternative to cash flows from operating activities, as determined in accordance with IFRS. Please refer to the "Free Cash Flow and Payout Ratio" section for the reconciliation of Free Cash Flow.
References to "Adjusted Free Cash Flow" are to Free Cash Flow excluding prospective project expenses and non-recurring items.
References to “Payout Ratio” are to dividends declared on common shares divided by Free Cash Flow. Innergex believes that this is a measure of its ability to sustain current dividends and dividend increases as well as its ability to fund its growth.
References to "Adjusted Payout Ratio" are to dividends declared on common shares divided by Adjusted Free Cash Flow after the impact of the DRIP.

Innergex Renewable Energy Inc. Management's Discussion and Analysis p472019 Second Quarter (in thousands of Canadian dollars, except as noted and amounts per share)
Production KPIs
Production Proportionate
References in this document to "Innergex's share of Production of the joint ventures and associates" are to Innergex's ownership interest in the equity or in the sponsors' equity, when applicable, of the Production of the joint ventures and associates.
References in this document to "Production Proportionate" are to Production plus Innergex's share of Production of the joint ventures and associates. Innergex believes that the presentation of this measure enhances the understanding of the Corporation's operating performance. Please refer to the "Operating Results" section of this MD&A for more information.
Three months ended June 302019 2018
(in MWh)Production
(MWh) LTA (MWh)
Productionas a % of
LTAProduction
(MWh) LTA (MWh)
Productionas a % of
LTARestated1,2
Production 1,741,953 1,743,516 100% 1,509,599 1,516,645 100%Innergex's share of Production of jointventures and associates:Toba Montrose (40%) 3 87,168 92,018 95% 98,986 92,047 108%Shannon (50%) 3,5 89,172 101,901 88% 104,525 101,901 103%Flat Top (51%) 4,5 115,450 119,335 97% 116,271 119,390 97%Dokie (25.5%)3 14,311 16,158 89% 18,296 16,158 113%Jimmie Creek (50.99%) 3 25,456 22,973 111% 29,122 22,973 127%Umbata Falls (49%) 20,905 18,533 113% 18,190 18,533 98%Viger-Denonville (50%) 7,718 7,725 100% 8,789 7,725 114%Duqueco (50%)6 27,498 34,763 79% — — —%Guayacán (50%)6 4,138 5,140 81% — — —%Pampa Elvira (50%)6 3,214 3,368 95% — — —%
395,030 421,914 94% 394,179 378,727 104%Production Proportionate 2,136,983 2,165,430 99% 1,903,778 1,895,372 100%
1. For more information on the restatement, please refer to the "Accounting Changes" section.2. For more information, please refer to the "Discontinued Operations" section.3. For the period from January 1, 2019, to June 30, 2019, and February 6, 2018, to June 30, 2018.4. For the period from January 1, 2019, to June 30, 2019, and March 23, 2018, to June 30, 2018.5. Ownership interest is in the sponsor equity of Shannon and Flat Top. However, tax equity partners hold 100% of the tax equity interests.6. Innergex owns a 50% interest in Energía Llaima, which owns the Guayacán (69.47% interest) and Pampa Elvira (55% interest) facilities, and Duqueco, which
includes the Mampil (100% interest) and Peuchén (100% interest) facilities.

Innergex Renewable Energy Inc. Management's Discussion and Analysis p482019 Second Quarter (in thousands of Canadian dollars, except as noted and amounts per share)
Six months ended June 302019 2018
(in MWh)Production
(MWh) LTA (MWh)
Productionas a % of
LTAProduction
(MWh) LTA (MWh)
Productionas a % of
LTARestated1,2
Production 3,050,458 3,069,993 99% 2,453,050 2,507,447 98%Innergex's share of Production of jointventures and associates:Toba Montrose (40%) 3 91,638 100,082 92% 100,492 96,165 104%Shannon (50%) 3,5 180,781 194,204 93% 165,397 160,620 103%Flat Top (51%) 4,5 231,126 235,990 98% 126,286 130,929 96%Dokie (25.5%)3 30,887 37,216 83% 28,418 27,318 104%Jimmie Creek (50.99%) 3 26,221 23,678 111% 29,434 23,368 126%Umbata Falls (49%) 30,149 26,828 112% 27,832 26,828 104%Viger-Denonville (50%) 20,897 17,875 117% 19,981 17,875 112%Duqueco (50%)6 47,298 51,365 92% — — —%Guayacán (50%)6 10,786 11,752 92% — — —%Pampa Elvira (50%)6 6,569 7,049 93% — — —%
676,352 706,039 96% 497,840 483,103 103%Production Proportionate 3,726,810 3,776,032 99% 2,950,890 2,990,550 99%
1. For more information on the restatement, please refer to the "Accounting Changes" section.2. For more information, please refer to the "Discontinued Operations" section.3. For the period from January 1, 2019, to June 30, 2019, and February 6, 2018, to June 30, 2018.4. For the period from January 1, 2019, to June 30, 2019, and March 23, 2018, to June 30, 2018.5. Ownership interest is in the sponsor equity of Shannon and Flat Top. However, tax equity partners hold 100% of the tax equity interests.6. Innergex owns a 50% interest in Energía Llaima, which owns the Guayacán (69.47% interest) and Pampa Elvira (55% interest) facilities, and Duqueco, which
includes the Mampil (100% interest) and Peuchén (100% interest) facilities.

Innergex Renewable Energy Inc. Management's Discussion and Analysis p492019 Second Quarter (in thousands of Canadian dollars, except as noted and amounts per share)
FORWARD-LOOKING INFORMATION
To inform readers of the Corporation's future prospects, this MD&A contains forward-looking information within the meaning of applicable securities laws (“Forward-Looking Information”), including the Corporation's power production, prospective projects, successful development, construction and financing (including tax equity funding) of the projects under construction and the advanced-stage prospective projects, sources and impact of funding project acquisitions, execution of non–recourse project level financing (including the timing and amount thereof), and strategic, operational and financial benefits and accretion expected to result from such acquisitions, business strategy, future development and growth prospects, business integration, governance, business outlook, objectives, plans and strategic priorities, and other statements that are not historical facts. Forward-Looking Information can generally be identified by the use of words such as “approximately”, “may”, “will”, "could", “believes", “expects", “intends”, "should", "would", “plans”, “potential”, "project", “anticipates”, “estimates”, “scheduled” or “forecasts”, or other comparable terms that state that certain events will or will not occur. It represents the projections and expectations of the Corporation relating to future events or results as of the date of this MD&A.
Future-oriented financial information: Forward-Looking Information includes future-oriented financial information or financial outlook within the meaning of securities laws, including information regarding the Corporation's expected production, projected revenues, projected Adjusted EBITDA and projected Adjusted EBITDA Proportionate, Projected Free Cash Flow and intention to pay dividend quarterly, the estimated project costs. Such information is intended to inform readers of the potential financial impact of expected results, of the expected commissioning of Development Projects, of the potential financial impact of completed and future acquisitions and of the Corporation's ability to sustain current dividends and to fund its growth. Such information may not be appropriate for other purposes.
Assumptions: Forward-Looking Information is based on certain key assumptions made by the Corporation, including, without restriction, those concerning hydrology, wind regimes and solar irradiation, performance of operating facilities, project performance, economic, financial and financial market conditions, the Corporation’s success in developing and constructing new facilities, expectations and assumptions concerning availability of capital resources and timely performance by third parties of contractual obligations and receipt of regulatory approvals.
Risks and Uncertainties: Forward-Looking Information involves risks and uncertainties that may cause actual results or performance to be materially different from those expressed, implied or presented by the Forward-Looking Information. These are referred to in the "Risks and Uncertainties" section of the Annual Report and include, without limitation: the ability of the Corporation to execute its strategy for building shareholder value; its ability to raise additional capital and the state of the capital markets; liquidity risks related to derivative financial instruments; variability in hydrology, wind regimes and solar irradiation; delays and cost overruns in the design and construction of projects; the ability to secure new power purchase agreements or renew any power purchase agreement; fluctuations affecting prospective power prices; health, safety and environmental risks; uncertainties surrounding the development of new facilities; obtainment of permits; equipment failure or unexpected operations and maintenance activity; interest rate fluctuations and refinancing risk; financial leverage and restrictive covenants governing current and future indebtedness; the possibility that the Corporation may not declare or pay a dividend; failure to realize the anticipated benefits of such acquisitions (including the acquisition of the Cartier Wind Farms); integration of the businesses acquired or to be acquired (including the Alterra Acquisition and the acquisition of the Cartier Wind Farms); changes in governmental support to increase electricity to be generated from renewable sources by independent power producers; variability of installation performance and related penalties; the ability to attract new talent or to retain officers or key employees; litigation; performance of major counterparties; social acceptance of renewable energy projects; relationships with stakeholders; equipment supply; exposure to many different forms of taxation in various jurisdictions; changes in general economic conditions; regulatory and political risks; ability to secure appropriate land; reliance on PPAs; availability and reliability of transmission systems (including due to reliance on third parties); foreign market growth and development risks; foreign exchange fluctuations; increases in water rental cost or changes to regulations applicable to water use; assessment of water, wind and solar resources and associated electricity production; natural disasters and force majeure; cybersecurity; sufficiency of insurance coverage limits and exclusions; a credit rating that may not reflect actual performance of the Corporation or a lowering (downgrade) of the credit rating; integration of the facilities and projects acquired and to be acquired; reliance on shared transmission and interconnection infrastructure and the fact that revenues from certain facilities will vary based on the market (or spot) price of electricity; risks related to U.S. production and investment tax credits; changes in U.S. corporate tax rates and availability of tax equity financing; host country economic, social and political conditions; risk inherent to rockslides, avalanches, tornadoes, hurricanes or other occurrences outside the Corporation’s control; adverse claims to property title; unknown liabilities; reliance on intellectual property and confidential agreements to protect our rights and confidential information; and reputational risks arising from misconduct of representatives of the Corporation.
Although the Corporation believes that the expectations and assumptions on which Forward-Looking Information is based are reasonable under the current circumstances, readers are cautioned not to rely unduly on this Forward-Looking Information, as no assurance can be given that it will prove to be correct. Forward-Looking Information contained herein is provided as at the date of this MD&A, and the Corporation does not undertake any obligation to update or revise any Forward-Looking Information, whether as a result of events or circumstances occurring after the date hereof, unless so required by law.
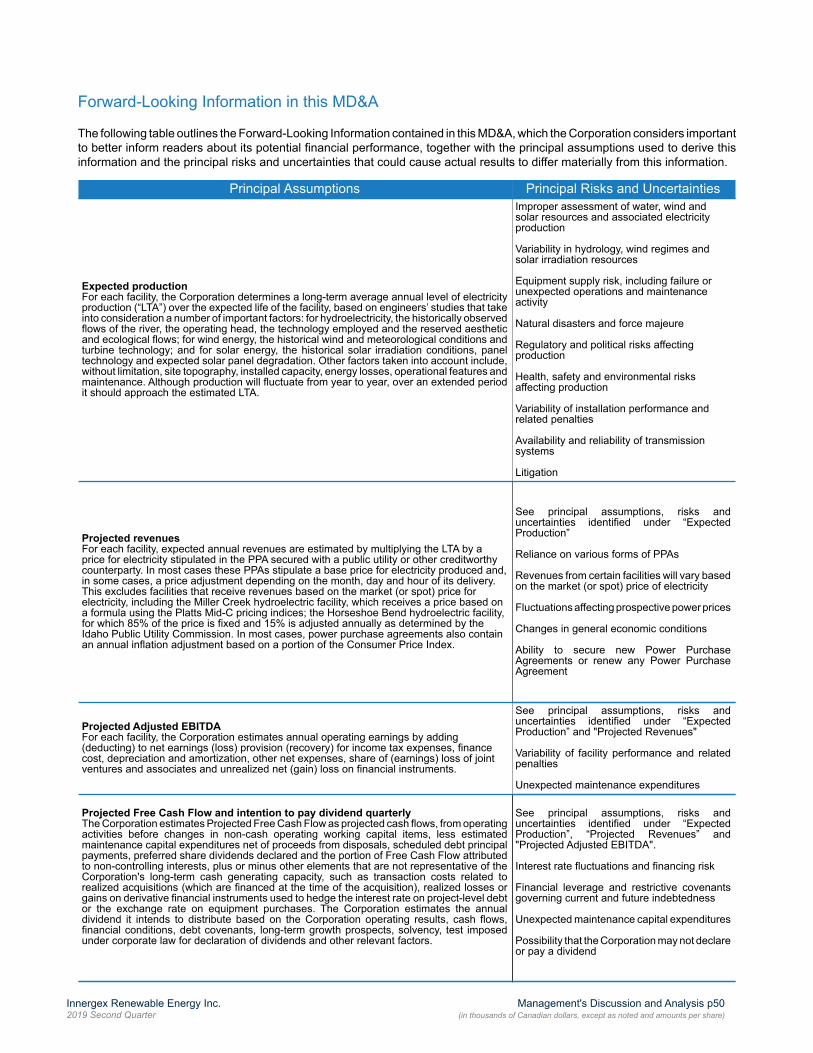
Innergex Renewable Energy Inc. Management's Discussion and Analysis p502019 Second Quarter (in thousands of Canadian dollars, except as noted and amounts per share)
Forward-Looking Information in this MD&A
The following table outlines the Forward-Looking Information contained in this MD&A, which the Corporation considers important to better inform readers about its potential financial performance, together with the principal assumptions used to derive this information and the principal risks and uncertainties that could cause actual results to differ materially from this information.
Principal Assumptions Principal Risks and Uncertainties
Expected productionFor each facility, the Corporation determines a long-term average annual level of electricity production (“LTA”) over the expected life of the facility, based on engineers’ studies that take into consideration a number of important factors: for hydroelectricity, the historically observed flows of the river, the operating head, the technology employed and the reserved aesthetic and ecological flows; for wind energy, the historical wind and meteorological conditions and turbine technology; and for solar energy, the historical solar irradiation conditions, panel technology and expected solar panel degradation. Other factors taken into account include, without limitation, site topography, installed capacity, energy losses, operational features and maintenance. Although production will fluctuate from year to year, over an extended period it should approach the estimated LTA.
Improper assessment of water, wind and solar resources and associated electricity production
Variability in hydrology, wind regimes and solar irradiation resources
Equipment supply risk, including failure or unexpected operations and maintenance activity
Natural disasters and force majeure
Regulatory and political risks affecting production
Health, safety and environmental risks affecting production
Variability of installation performance and related penalties
Availability and reliability of transmission systems
Litigation
Projected revenues For each facility, expected annual revenues are estimated by multiplying the LTA by a price for electricity stipulated in the PPA secured with a public utility or other creditworthy counterparty. In most cases these PPAs stipulate a base price for electricity produced and, in some cases, a price adjustment depending on the month, day and hour of its delivery. This excludes facilities that receive revenues based on the market (or spot) price for electricity, including the Miller Creek hydroelectric facility, which receives a price based on a formula using the Platts Mid-C pricing indices; the Horseshoe Bend hydroelectric facility, for which 85% of the price is fixed and 15% is adjusted annually as determined by the Idaho Public Utility Commission. In most cases, power purchase agreements also contain an annual inflation adjustment based on a portion of the Consumer Price Index.
See principal assumptions, risks and uncertainties identified under “Expected Production”
Reliance on various forms of PPAs
Revenues from certain facilities will vary based on the market (or spot) price of electricity
Fluctuations affecting prospective power prices
Changes in general economic conditions
Ability to secure new Power Purchase Agreements or renew any Power Purchase Agreement
Projected Adjusted EBITDA For each facility, the Corporation estimates annual operating earnings by adding (deducting) to net earnings (loss) provision (recovery) for income tax expenses, finance cost, depreciation and amortization, other net expenses, share of (earnings) loss of joint ventures and associates and unrealized net (gain) loss on financial instruments.
See principal assumptions, risks and uncertainties identified under “Expected Production” and "Projected Revenues"
Variability of facility performance and related penalties
Unexpected maintenance expenditures
Projected Free Cash Flow and intention to pay dividend quarterlyThe Corporation estimates Projected Free Cash Flow as projected cash flows, from operating activities before changes in non-cash operating working capital items, less estimated maintenance capital expenditures net of proceeds from disposals, scheduled debt principal payments, preferred share dividends declared and the portion of Free Cash Flow attributed to non-controlling interests, plus or minus other elements that are not representative of the Corporation's long-term cash generating capacity, such as transaction costs related to realized acquisitions (which are financed at the time of the acquisition), realized losses or gains on derivative financial instruments used to hedge the interest rate on project-level debt or the exchange rate on equipment purchases. The Corporation estimates the annual dividend it intends to distribute based on the Corporation operating results, cash flows, financial conditions, debt covenants, long-term growth prospects, solvency, test imposed under corporate law for declaration of dividends and other relevant factors.
See principal assumptions, risks and uncertainties identified under “Expected Production”, “Projected Revenues” and "Projected Adjusted EBITDA".
Interest rate fluctuations and financing risk
Financial leverage and restrictive covenants governing current and future indebtedness
Unexpected maintenance capital expenditures
Possibility that the Corporation may not declare or pay a dividend

Innergex Renewable Energy Inc. Management's Discussion and Analysis p512019 Second Quarter (in thousands of Canadian dollars, except as noted and amounts per share)
Principal Assumptions Principal Risks and Uncertainties
Estimated project costs, expected obtainment of permits, start of construction, work conducted and start of commercial operation for Development Projects or Prospective ProjectsFor each Development Project and Prospective Project, the Corporation may provide (where available) an estimate of potential installed capacity, estimated project costs, project financing terms and each project’s development and construction schedule, based on its extensive experience as a developer, in addition to information directly related to incremental internal costs, site acquisition costs and financing costs, which are eventually adjusted for the projected costs and construction schedule provided by the engineering, procurement and construction (“EPC”) contractor retained for the project.The Corporation provides indications based on assumptions regarding its current strategic positioning and competitive outlook, as well as scheduling and construction progress, for its Development Projects and its Prospective Projects, which the Corporation evaluates based on its experience as a developer.
Uncertainties surrounding development of new facilities
Performance of major counterparties, such as suppliers or contractors
Delays and cost overruns in the design and construction of projects
Ability to secure appropriate land
Obtainment of permits
Health, safety and environmental risks
Higher-than-expected inflation
Equipment supply
Interest rate fluctuations and financing risk
Risks related to U.S. PTCs and ITCs, changes in U.S. corporate tax rates and availability of tax equity financing
Regulatory and political risks
Natural disaster
Relationships with stakeholders
Foreign market growth and development risks
Outcome of insurance claims
Intention to respond to requests for proposalsThe Corporation provides indications of its intention to submit proposals in response to requests for proposals (“Request for Proposals” or “RFP”) based on the state of readiness of some of its Prospective Projects and their compatibility with the announced terms of these RFPs.
Regulatory and political risks
Ability of the Corporation to execute its strategy for building shareholder value
Ability to secure new PPAs
Changes in governmental support to increase electricity to be generated from renewable sources by independent power producers
Social acceptance of renewable energy projects
Relationships with stakeholders
Qualification for PTCs and ITC and Expected Tax Equity Investment Flip Point For certain Development Projects in the United States, the Corporation has conducted on- and off-site activities expected to qualify its Development Projects for PTCs or ITC at the full rate and to obtain tax equity financing on such a basis. To assess the potential qualification of a project, the Corporation takes into account the construction work performed and the timing of such work. The expected Tax Equity Flip Point for tax equity investment is determined according to the LTAs and revenues of each such project and is subject in addition to the related risks mentioned above.
Risks related to U.S. PTCs and ITC, changes in U.S. corporate tax rates and availability of tax equity financing
Regulatory and political risks
Delays and cost overruns in the design and construction of projects
Obtainment of permits

Innergex Renewable Energy Inc. Management's Discussion and Analysis p522019 Second Quarter (in thousands of Canadian dollars, except as noted and amounts per share)
ACCOUNTING CHANGES
New Accounting Standards and Interpretations Adopted During the Year
IFRS 16, Leases
On January 13, 2016, the IASB issued IFRS 16, Leases (“IFRS 16”) which provides a comprehensive model for the identification of lease arrangements and their treatment in the financial statements of both lessees and lessors. It supersedes IAS 17, Leasesand its associated interpretive guidance. Significant changes were made to lessee accounting with the distinction between operating and finance leases removed and assets and liabilities recognized in respect of all leases (subject to limited exceptions for short-term leases and leases of low value assets). In contrast, IFRS 16 does not include significant changes to the requirements for lessors. The Corporation adopted this standard retrospectively on January 1, 2019 without restating the figures for the comparative periods, as permitted under the specific transitional provisions in the standard (modified retrospective approach).
The following table shows the effects of the application of IFRS 16 on the opening balances on the consolidated statement of financial position as at January 1, 2019:
Hydroelectric Wind SolarSite
development/ Corporate
Total
Current assetsPrepaid and others — (1,640) (50) — (1,690)
Non-current assetsRight-of-use assets presented in Property, plant and equipment 2,775 56,652 839 63,622 123,888
Current liabilities
Accounts payable and other payables — (72) — — (72)Lease liabilities presented in other liabilities 50 2,410 12 2,612 5,084
50 2,338 12 2,612 5,012Non-current liabilities
Lease liabilities presented in other liabilities 2,725 52,674 777 61,010 117,186
Non-wholly owned subsidiaries
Prior to its acquisition by the Corporation on February 6, 2018, Alterra was accounting for Kokomo and Spartan as joint ventures using the equity method. On December 31, 2018, the Corporation completed its review of the various partnership agreements and concluded it has control over these entities and as such, they should be consolidated. This change has been reflected in the consolidated financial statements for the year ended December 31, 2018, but these entities were accounted for as joint ventures using the equity method in all of the 2018 condensed interim consolidated financial statements. As such, the comparative figures presented in this condensed interim consolidated financial statements for the period ended June 30, 2018 have been restated to reflect this reassessment.

Innergex Renewable Energy Inc. Management's Discussion and Analysis p532019 Second Quarter (in thousands of Canadian dollars, except as noted and amounts per share)
ESTABLISHMENT AND MAINTENANCE OF DISCLOSURE CONTROLS AND PROCEDURES AND INTERNAL CONTROL OVER FINANCIAL REPORTING
In accordance with Regulation 52-109 respecting Certification of Disclosure in Issuers' Annual and Interim Filings, the President and Chief Executive Officer and the Chief Financial Officer of the Corporation have certified that they have designed, or caused it to be designed under their supervision:
• Disclosure controls and procedures (“DC&P”) to provide reasonable assurance that: (i) material information relating to the Corporation is made known to the President and Chief Executive Officer and the Chief Financial Officer by others, particularly during the period in which the interim filings are being prepared; and (ii) the information required to be disclosed by the Corporation in its annual filings, interim filings and other reports filed or submitted by it under securities legislation is recorded, processed, summarized and reported within the time periods specified in securities legislation.
• Internal control over financial reporting (“ICFR”) to provide reasonable assurance regarding the reliability of financial reporting and the preparation of financial statements for external purposes in accordance with IFRS.
During the period beginning on April 1, 2019 and ended on June 30, 2019, there was no change in the ICFR that has materially affected, or is reasonably likely to materially affect, the Corporation's ICFR.
SUBSEQUENT EVENTSNew swap contracts signed
On July 18, 2019 and July 22, 2019 the Corporation entered into six hedge agreements to mitigate the risk of fluctuations in the interest rates on the revolving credit facilities held by the Corporation. The notional amounts of theses contracts total $125 million and will mature between 2029 and 2049. The fair value is based on Level 2 valuation techniques. The Corporation designated the interest rate swaps as a cash flow hedge for accounting purposes.
Favourable decision from the Environmental Appeal Board ("EAB")
In 2017, the Comptroller of Water Rights has sought to apply the higher water rights rates retroactively to the Fire Creek, Lamont Creek, Stokke Creek, Tipella Creek and Upper Stave River for the years 2011 and 2012 and by doing so sought an additional $3.2 million in water rental for these two years. An appeal of this decision was filed with the Environmental Appeal Board. On July 26, 2019, the Environmental Appeal Board rendered its decision, granting the appeal and ordering the Comptroller of Water Rights to reimburse to each facility its proportionate share of the adjusted water rental amounts overcharged with interest. This decision is subject to appeal by the Comptroller.
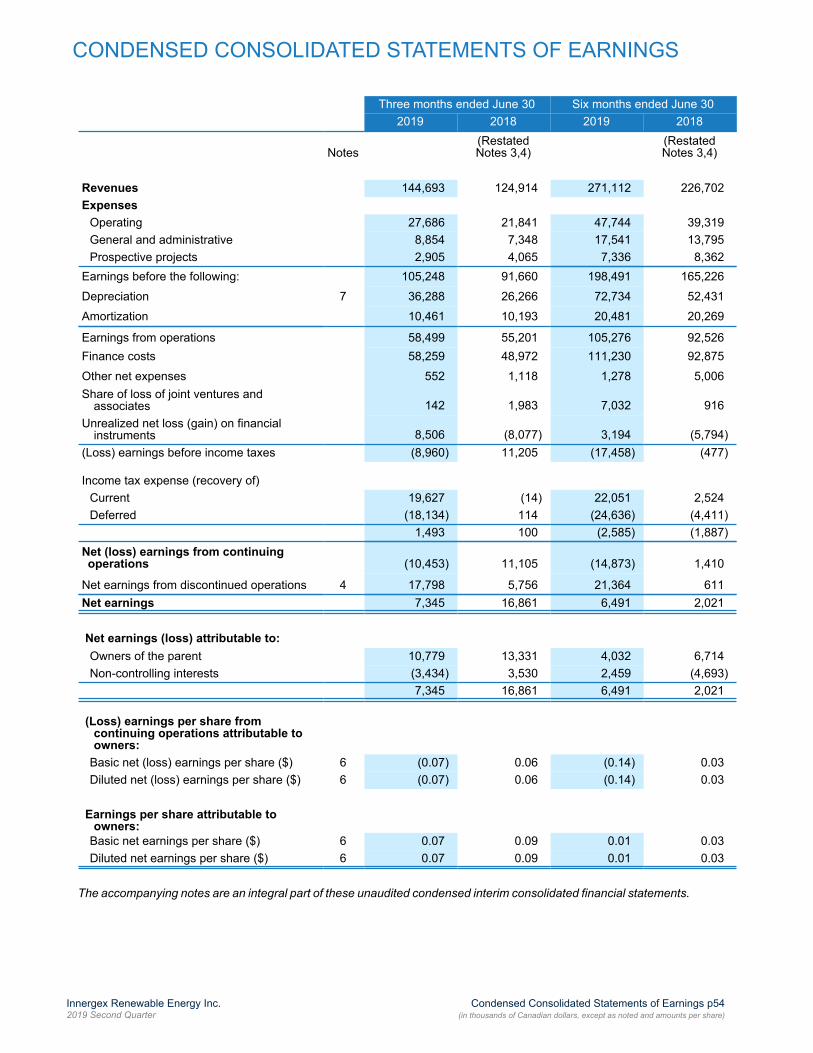
CONDENSED CONSOLIDATED STATEMENTS OF EARNINGS
Innergex Renewable Energy Inc. Condensed Consolidated Statements of Earnings p542019 Second Quarter (in thousands of Canadian dollars, except as noted and amounts per share)
Three months ended June 30 Six months ended June 302019 2018 2019 2018
Notes(RestatedNotes 3,4)
(RestatedNotes 3,4)
Revenues 144,693 124,914 271,112 226,702Expenses
Operating 27,686 21,841 47,744 39,319General and administrative 8,854 7,348 17,541 13,795Prospective projects 2,905 4,065 7,336 8,362
Earnings before the following: 105,248 91,660 198,491 165,226
Depreciation 7 36,288 26,266 72,734 52,431
Amortization 10,461 10,193 20,481 20,269
Earnings from operations 58,499 55,201 105,276 92,526Finance costs 58,259 48,972 111,230 92,875
Other net expenses 552 1,118 1,278 5,006Share of loss of joint ventures and
associates 142 1,983 7,032 916Unrealized net loss (gain) on financial
instruments 8,506 (8,077) 3,194 (5,794)(Loss) earnings before income taxes (8,960) 11,205 (17,458) (477)
Income tax expense (recovery of)Current 19,627 (14) 22,051 2,524Deferred (18,134) 114 (24,636) (4,411)
1,493 100 (2,585) (1,887)Net (loss) earnings from continuingoperations (10,453) 11,105 (14,873) 1,410
Net earnings from discontinued operations 4 17,798 5,756 21,364 611Net earnings 7,345 16,861 6,491 2,021
Net earnings (loss) attributable to:Owners of the parent 10,779 13,331 4,032 6,714Non-controlling interests (3,434) 3,530 2,459 (4,693)
7,345 16,861 6,491 2,021
(Loss) earnings per share fromcontinuing operations attributable toowners:
Basic net (loss) earnings per share ($) 6 (0.07) 0.06 (0.14) 0.03Diluted net (loss) earnings per share ($) 6 (0.07) 0.06 (0.14) 0.03
Earnings per share attributable toowners:
Basic net earnings per share ($) 6 0.07 0.09 0.01 0.03Diluted net earnings per share ($) 6 0.07 0.09 0.01 0.03
The accompanying notes are an integral part of these unaudited condensed interim consolidated financial statements.

CONDENSED CONSOLIDATED STATEMENTS OF COMPREHENSIVE INCOME (LOSS)
Innergex Renewable Energy Inc. Condensed Consolidated Statements of Comprehensive Income (Loss) p552019 Second Quarter (in thousands of Canadian dollars, except as noted and amounts per share)
Three months ended June 30 Six months ended June 302019 2018 2019 2018
Notes(RestatedNotes 3,4)
(RestatedNotes 3,4)
Net earnings 7,345 16,861 6,491 2,021
Items of comprehensive income (loss)that will be subsequently reclassifiedto earnings:
Foreign currency translation differencesfor foreign operations (8,118) 574 (14,783) 6,874
Change in fair value of financialinstruments designated as netinvestment hedges (2,496) 1,268 3,566 (1,472)
Change in fair value of financialinstruments designated as cash flowhedges (25,039) (689) (2,748) 2,915
Change in fair value of financialinstruments of joint ventures andassociates designated as cash flowhedges 6,383 20,808 4,263 12,873
Related deferred income taxes on all itemsabove 4,443 (4,052) 1,348 (3,580)
Other comprehensive (loss) incomefrom continuing operations (24,827) 17,909 (8,354) 17,610
Other comprehensive income (loss)from discontinued operations 4 41,718 (35,342) 3,928 1,519
Other comprehensive income (loss) 16,891 (17,433) (4,426) 19,129
Total comprehensive income (loss) 24,236 (572) 2,065 21,150
Total comprehensive income (loss)attributable to:Owners of the parent 28,440 8,948 24,103 23,578Non-controlling interests (4,204) (9,520) (22,038) (2,428)
24,236 (572) 2,065 21,150
The accompanying notes are an integral part of these unaudited condensed interim consolidated financial statements.

CONDENSED CONSOLIDATED STATEMENTS OF FINANCIAL POSITION
Innergex Renewable Energy Inc. Condensed Consolidated Statements of Financial Position p562019 Second Quarter (in thousands of Canadian dollars, except as noted and amounts per share)
As at June 30, 2019 December 31, 2018Notes
ASSETSCurrent assets
Cash and cash equivalents 88,622 79,586Restricted cash 63,564 29,981Accounts receivable 88,553 103,886Derivative financial instruments 5,358 2,370Prepaid and others 11,290 12,454
Total current assets 257,387 228,277
Non-current assetsProperty, plant and equipment 7 4,681,295 4,482,928Intangible assets 697,888 925,009Project development costs 13,512 30,119Investments in joint ventures and associates 452,212 604,773Derivative financial instruments 58,231 9,817Deferred tax assets 44,140 16,465Goodwill 61,275 109,995Other long-term assets 59,470 73,901
6,325,410 6,481,284
LIABILITIESCurrent liabilities
Accounts payable and other payables 295,970 165,068Derivative financial instruments 23,885 29,999Current portion of long-term debt and other liabilities 572,926 446,433
Total current liabilities 892,781 641,500
Non-current liabilitiesDerivative financial instruments 120,582 118,002Long-term debt 3,853,114 4,024,324Other liabilities 270,540 173,345Convertible debentures 240,038 238,648Deferred tax liabilities 258,192 325,904
5,635,247 5,521,723
SHAREHOLDERS' EQUITYTotal shareholders’ equity 9 690,163 959,561
6,325,410 6,481,284
The accompanying notes are an integral part of these unaudited condensed interim consolidated financial statements.

CONDENSED CONSOLIDATED STATEMENTS OF CHANGES IN SHAREHOLDERS’ EQUITY
Innergex Renewable Energy Inc. Condensed Consolidated Statements of Changes in Shareholders' Equity p572019 Second Quarter (in thousands of Canadian dollars, except as noted and amounts per share)
Equity attributable to owners
For the six-month period ended June 30, 2019Common
sharecapital
account
Contributedsurplus
Preferredshares
Convertibledebentures Deficit
Accumulatedother
comprehensiveincome (loss)
TotalNon-
controllinginterests
Totalshareholders’
equity
Balance January 1, 2019 6,546 1,272,604 131,069 3,976 (748,890) (35,513) 629,792 329,769 959,561
Net earnings — — — — 4,032 — 4,032 2,459 6,491
Other comprehensive income (loss) — — — — — 20,071 20,071 (24,497) (4,426)
Reclassification of defined benefit plan actuarial losses — — — — (378) 378 — — —Total comprehensive income (loss) — — — — 3,654 20,449 24,103 (22,038) 2,065
Common shares issued through dividend reinvestment plan 2,039 — — — — — 2,039 — 2,039Share-based payments — 34 — — — — 34 — 34Common share options exercised 1,181 (4,256) — — — — (3,075) — (3,075)Shares vested - Performance Share Plan 1,057 — — — — — 1,057 — 1,057
Buyback of non-controlling interests — — — — — — — (218) (218)Disposition of non controlling interests (Note 4) — — — — — — — (260,846) (260,846)Investments from non-controlling interests (Note 10) — — — — — — — 49,629 49,629Dividends declared on common shares — — — — (46,733) — (46,733) — (46,733)Dividends declared on preferred shares — — — — (2,971) — (2,971) — (2,971)Distributions to non-controlling interests — — — — — — — (10,379) (10,379)
Balance June 30, 2019 10,823 1,268,382 131,069 3,976 (794,940) (15,064) 604,246 85,917 690,163
The accompanying notes are an integral part of these unaudited condensed interim consolidated financial statements.

CONDENSED CONSOLIDATED STATEMENTS OF CHANGES IN SHAREHOLDERS’ EQUITY
Innergex Renewable Energy Inc. Condensed Consolidated Statements of Changes in Shareholders' Equity p582019 Second Quarter (in thousands of Canadian dollars, except as noted and amounts per share)
Equity attributable to owners
For the six-month period ended June 30, 2018Commonsharescapital
account
Contributedsurplus
Preferredshares
Convertibledebentures Deficit
Accumulatedother
comprehensive(loss) income
TotalNon-
controllinginterests
Totalshareholders’
equity
Balance January 1, 2018 2,867 940,760 131,069 1,877 (645,297) 9,929 441,205 14,920 456,125
Net earnings (loss) (Restated Note 3) — — — — 6,714 — 6,714 (4,693) 2,021Other comprehensive income — — — — — 16,864 16,864 2,265 19,129
Total comprehensive income (loss) — — — — 6,714 16,864 23,578 (2,428) 21,150
Common shares issued on February 6, 2018 330,607 — — — — — 330,607 — 330,607
Business acquisition — — — — — — — 296,534 296,534Common shares issued through dividend reinvestment plan 4,423 — — — — — 4,423 — 4,423Reduction of capital on common shares (337,785) 337,785 — — — — — — —Buyback of common shares (20) (6,010) — — (3,457) — (9,487) — (9,487)Share-based payments — 42 — — — — 42 — 42Equity portion of convertible debentures issued (Net of
$766 of deferred income taxes — — — 2,099 — — 2,099 — 2,099Shares vested - Performance Share Plan 948 — — — — — 948 — 948
Buyback of non-controlling interests (33,808) — (33,808) 32,108 (1,700)Investments from non-controlling interests — — — — — — — 697 697
Dividends declared on common shares — — — — (45,031) — (45,031) — (45,031)
Dividends declared on preferred shares — — — — (2,971) — (2,971) — (2,971)Distributions to non-controlling interests — — — — — — — (7,794) (7,794)
Balance June 30, 2018 (Restated Note 3) 1,040 1,272,577 131,069 3,976 (723,850) 26,793 711,605 334,037 1,045,642
The accompanying notes are an integral part of these unaudited condensed interim consolidated financial statements.
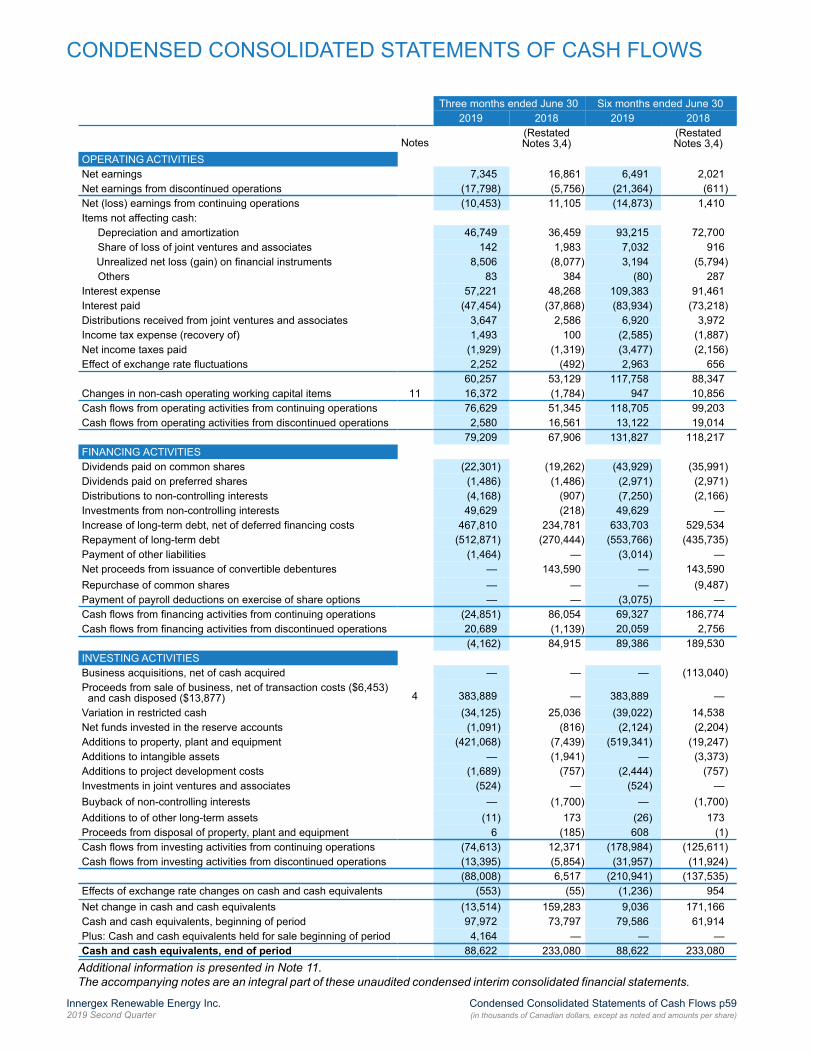
CONDENSED CONSOLIDATED STATEMENTS OF CASH FLOWS
Innergex Renewable Energy Inc. Condensed Consolidated Statements of Cash Flows p592019 Second Quarter (in thousands of Canadian dollars, except as noted and amounts per share)
Three months ended June 30 Six months ended June 302019 2018 2019 2018
Notes(RestatedNotes 3,4)
(RestatedNotes 3,4)
OPERATING ACTIVITIESNet earnings 7,345 16,861 6,491 2,021Net earnings from discontinued operations (17,798) (5,756) (21,364) (611)Net (loss) earnings from continuing operations (10,453) 11,105 (14,873) 1,410Items not affecting cash:
Depreciation and amortization 46,749 36,459 93,215 72,700Share of loss of joint ventures and associates 142 1,983 7,032 916
Unrealized net loss (gain) on financial instruments 8,506 (8,077) 3,194 (5,794)Others 83 384 (80) 287
Interest expense 57,221 48,268 109,383 91,461Interest paid (47,454) (37,868) (83,934) (73,218)Distributions received from joint ventures and associates 3,647 2,586 6,920 3,972Income tax expense (recovery of) 1,493 100 (2,585) (1,887)Net income taxes paid (1,929) (1,319) (3,477) (2,156)Effect of exchange rate fluctuations 2,252 (492) 2,963 656
60,257 53,129 117,758 88,347Changes in non-cash operating working capital items 11 16,372 (1,784) 947 10,856Cash flows from operating activities from continuing operations 76,629 51,345 118,705 99,203Cash flows from operating activities from discontinued operations 2,580 16,561 13,122 19,014
79,209 67,906 131,827 118,217FINANCING ACTIVITIESDividends paid on common shares (22,301) (19,262) (43,929) (35,991)Dividends paid on preferred shares (1,486) (1,486) (2,971) (2,971)Distributions to non-controlling interests (4,168) (907) (7,250) (2,166)Investments from non-controlling interests 49,629 (218) 49,629 —Increase of long-term debt, net of deferred financing costs 467,810 234,781 633,703 529,534Repayment of long-term debt (512,871) (270,444) (553,766) (435,735)Payment of other liabilities (1,464) — (3,014) —Net proceeds from issuance of convertible debentures — 143,590 — 143,590Repurchase of common shares — — — (9,487)Payment of payroll deductions on exercise of share options — — (3,075) —Cash flows from financing activities from continuing operations (24,851) 86,054 69,327 186,774Cash flows from financing activities from discontinued operations 20,689 (1,139) 20,059 2,756
(4,162) 84,915 89,386 189,530INVESTING ACTIVITIESBusiness acquisitions, net of cash acquired — — — (113,040)Proceeds from sale of business, net of transaction costs ($6,453)
and cash disposed ($13,877) 4 383,889 — 383,889 —Variation in restricted cash (34,125) 25,036 (39,022) 14,538Net funds invested in the reserve accounts (1,091) (816) (2,124) (2,204)Additions to property, plant and equipment (421,068) (7,439) (519,341) (19,247)Additions to intangible assets — (1,941) — (3,373)Additions to project development costs (1,689) (757) (2,444) (757)Investments in joint ventures and associates (524) — (524) —Buyback of non-controlling interests — (1,700) — (1,700)Additions to of other long-term assets (11) 173 (26) 173Proceeds from disposal of property, plant and equipment 6 (185) 608 (1)Cash flows from investing activities from continuing operations (74,613) 12,371 (178,984) (125,611)Cash flows from investing activities from discontinued operations (13,395) (5,854) (31,957) (11,924)
(88,008) 6,517 (210,941) (137,535)Effects of exchange rate changes on cash and cash equivalents (553) (55) (1,236) 954Net change in cash and cash equivalents (13,514) 159,283 9,036 171,166Cash and cash equivalents, beginning of period 97,972 73,797 79,586 61,914Plus: Cash and cash equivalents held for sale beginning of period 4,164 — — —Cash and cash equivalents, end of period 88,622 233,080 88,622 233,080
Additional information is presented in Note 11.The accompanying notes are an integral part of these unaudited condensed interim consolidated financial statements.
Innergex Renewable Energy Inc. Notes to the Condensed Interim Consolidated Financial Statements p602019 Second Quarter (in thousands of Canadian dollars, except as noted and amounts per share)
DESCRIPTION OF BUSINESS
Innergex Renewable Energy Inc. (“Innergex” or the “Corporation”) was incorporated under the Canada Business Corporation Act on October 25, 2002, and its shares and convertible debentures are listed on the Toronto Stock Exchange. The Corporation is a developer, acquirer, owner and operator of renewable power-generating facilities, essentially focused on the hydroelectric, wind and solar power sectors. The Corporation's head office is located at 1225 St-Charles Street West, 10th floor, Longueuil, QC, J4K 0B9, Canada.
These unaudited condensed interim consolidated financial statements have neither been audited nor reviewed by the Corporation's independent auditors and were approved by the Board of Directors on August 13, 2019.
The Corporation's revenues are variable with each season and are normally at their highest in the second quarter due to the snow melt season and at their lowest in the first quarter due to the cold temperatures. As a result, earnings of interim periods should not be considered as indicative of results for an entire year.
1. BASIS OF PRESENTATION AND STATEMENT OF COMPLIANCE
Statement of Compliance
These unaudited condensed interim consolidated financial statements have been prepared in accordance with International Financial Reporting Standards (“IFRS”), as issued by the International Accounting Standards Board (“IASB”). The condensed interim consolidated financial statements are in compliance with IAS 34, Interim Financial Reporting. Except as described below, the same accounting policies and methods of application as described in the Corporation’s latest annual report have been used. However, these unaudited condensed interim consolidated financial statements do not include all disclosures required under IFRS and, accordingly, should be read in conjunction with the audited consolidated financial statements and the notes thereto included in the Corporation’s latest annual report.
Basis of Measurement
The unaudited condensed interim consolidated financial statements have been prepared on a historical cost basis, except for certain financial instruments and assets and liabilities acquired in business combinations at acquisition date that are measured at fair value, as described in the significant accounting policies included in the Corporation's latest annual report.Historical cost is generally based on the fair value of the consideration given in exchange for assets.
Functional Currency and Presentation Currency
These unaudited condensed interim consolidated financial statements are presented in Canadian dollars, which is the Corporation’s functional currency.

Innergex Renewable Energy Inc. Notes to the Condensed Interim Consolidated Financial Statements p612019 Second Quarter (in thousands of Canadian dollars, except as noted and amounts per share)
2. SIGNIFICANT ACCOUNTING POLICIES
Leases (policy applicable from January 1, 2019)
Nature of leasing activities
The Corporation typically leases land and offices. Lease agreements are generally made for fixed long-term periods based on each project's estimated length at inception. Land leases for a given project are usually negotiated jointly, with governments, for government-owned land, or directly with groups of private landowners for privately-owned land. Office and other leases are negotiated on an individual basis and contain a wide range of different terms and conditions. Being negotiated for long-term periods, most land leases provide for additional payments based on changes in inflation. In addition, leases generally include an option to renew the lease for an additional period after the non-cancellable contract period. The Corporation assesses at lease commencement whether it is reasonably certain to exercise the extension options.
Leases are recognized as a right-of-use asset and a corresponding lease liability at the date at which the leased asset is available for use by the Corporation. Each lease payment is allocated between the lease liability and finance costs. The finance costs are charged to earnings or loss over the lease period so as to produce a constant periodic rate of interest on the remaining balance of the liability for each period.
(i) Lease liabilities
Lease liabilities are recognized in other liabilities in the consolidated statement of financial position at the present value of the future lease payments, discounted using the interest rate implicit in the lease. If that rate cannot be determined, the lessee’s incremental borrowing rate is used, being the rate that the lessee would have to pay to borrow the funds necessary to obtain an asset of similar value in a similar economic environment with similar terms and conditions. When determining the amount of the future lease payments, the Corporation takes the following information into account: fixed payments, including in-substance fixed payments, less any lease incentives receivable; and variable lease payment that are based on an index or a rate;
Payments associated with short-term leases and leases of low-value assets are recognized on a straight-line basis as an expense in earnings or loss. Short-term leases correspond to lease agreement with a term of 12 months or less.
Lease liabilities are subsequently measured at amortized cost using the effective interest method. A remeasurement of the lease liabilities occur when there is a change in future lease payments arising from a variation in the relevant index or rate.
(ii) Right-of-use assets
Right-of-use assets are recognized in property, plant and equipment in the consolidated statement of financial position at cost, comprising the amount of the initial measurement of the lease liability, any lease payments made at or before the commencement date and any initial direct costs.
Right-of-use asset are subsequently depreciated on a straight-line basis over the lesser of (i) the estimated useful lives of the assets or (ii) the lease term, including, when it is reasonably certain that they will be exercised, options to extend the lease term. The estimated useful lives of right-of-use assets are determined on the same basis as those of property, plant and equipment.
Project development costs
Project development costs are recorded at cost less any impairment losses, as applicable, and represent costs incurred for the acquisition of prospective projects and for the design and development of hydroelectric, wind farm and solar sites. Borrowing costs directly attributable to the acquisition or development are capitalized as project development costs.
The Corporation defers project development costs when it becomes probable that the project will be completed and that it will generate future economic benefits that will flow to the Corporation. The Corporation makes this determination by taking into consideration various factors, either individually or combined, such as (amongst others): whether a prospective project has been granted, or whether it is probable that it will be granted, the required permits; rights of access to the required land have been secured or it is probable that they will be secured; the announcement, or the probability thereto, that a prospective project is awarded a power-purchase agreement; and access to an open market if the project is not in a market where it is expected to be awarded a power-purchase agreement.

Innergex Renewable Energy Inc. Notes to the Condensed Interim Consolidated Financial Statements p622019 Second Quarter (in thousands of Canadian dollars, except as noted and amounts per share)
These costs are transferred to property, plant and equipment or intangible assets at the commencement of construction. When it is no longer probable that a project will be carried out, the project's development costs deferred to that date are expensed. Current costs for prospective projects are expensed as incurred.
Non-current assets held for sale and discontinued operations
Non-current assets are classified as held for sale if their carrying amount will be recovered principally through a sale transaction rather than through continuing use and a sale is considered highly probable. They are measured at the lower of their carrying amount and fair value less costs to sell, except for assets such as deferred tax assets and assets arising from employee benefits, which are specifically exempt from this requirement.
Non-current assets are not depreciated or amortized while they are classified as held for sale. Interest and other expenses attributable to the liabilities directly associated with the assets classified as held for sale continue to be recognized.
Assets classified as held for sale are presented separately from the other assets in the consolidated statement of financial position. The liabilities directly associated with the assets classified as held for sale are presented separately from other liabilities in the consolidated statement of financial position.
A discontinued operation is a component of the Corporation's business that has been disposed of or is classified as held for sale and that represents a separate major line of business or geographical area of operations and is part of a single co-ordinated plan to dispose of such a line of business or area of operations. The results of discontinued operations are presented separately in the consolidated statement of earnings. Comparative figures are adjusted on the consolidated statement of earnings and on the consolidated statement of comprehensive income as if the operations had been discontinued from the beginning of the comparative period.
Non-controlling interests
Non-controlling interests in the net assets of consolidated subsidiaries are identified separately from the Corporation's equity therein. The interest of non-controlling shareholders may be initially measured either at fair value of the consideration received or receivable, or at the non-controlling interest's proportionate share in the recognized amounts of the acquiree's identifiable net assets. The choice of measurement basis is made on an acquisition by acquisition basis. Subsequent to acquisition, non-controlling interests consist of the amount attributed to such interests at initial recognition and the non-controlling interest's share of changes in equity since the date of the acquisition.
In the case of projects in the United States where tax equity investors are involved, the initial measurement of the interest of non-controlling shareholders is performed at the fair value of the consideration received or receivable, while subsequent measurements are calculated in accordance with the hypothetical liquidation at book value (“HLBV”) method which allocates earnings or losses by measuring the distribution amounts that would be due to the non-controlling shareholders in a hypothetical liquidation of the entity at the net book value of the underlying assets. For such projects which are still under construction, provided they do not generate taxable income (losses) as no revenues are being recognized and all expenses are being capitalized, in those instances, subsequent measurements using HLBV model, as described previously, occurs onwards from the effective date commercial operation is achieved, as the projects commence generating taxable income (losses).

Innergex Renewable Energy Inc. Notes to the Condensed Interim Consolidated Financial Statements p632019 Second Quarter (in thousands of Canadian dollars, except as noted and amounts per share)
3. CHANGES IN ACCOUNTING STANDARDS
3.1 New accounting standards and interpretations adopted during the year
The Corporation has adopted the following new standards and interpretations, with a date of initial application of January 1, 2019:
IFRS 16, Leases
On January 13, 2016, the IASB issued IFRS 16, Leases (“IFRS 16”) which provides a comprehensive model for the identification of lease arrangements and their treatment in the financial statements of both lessees and lessors. It supersedes IAS 17, Leases and its associated interpretive guidance. Significant changes were made to lessee accounting with the distinction between operating and finance leases removed and assets and liabilities recognized in respect of all leases (subject to limited exceptions for short-term leases and leases of low value assets). In contrast, IFRS 16 does not include significant changes to the requirements for lessors. The Corporation adopted this standard retrospectively on January 1, 2019 without restating the figures for the comparative periods, as permitted under the specific transitional provisions in the standard (modified retrospective approach).
The initial adoption of IFRS 16 resulted in the recognition of lease liabilities in the consolidated statement of financial position, in relation to leases which had previously been classified as operating leases under the principles of IAS 17, Leases, with the recognition of a corresponding right-of-use asset. The lease liabilities were measured at the present value of the remaining lease payments, discounted using the lessee’s incremental borrowing rate as of January 1, 2019. The weighted average lessee’s incremental borrowing rate applied to the lease liabilities on January 1, 2019 was 3.79%.
The right-of-use assets were measured at an amount equal to the lease liability, adjusted by the amount of any prepaid or accrued lease payments relating to the corresponding lease agreement recognized in the consolidated statement of financial position as at December 31, 2018. There were no onerous lease contracts that would have required an adjustment to the right-of-use assets at the date of initial application.
Upon initial application of IFRS 16, the Corporation has used the following practical expedients permitted by the standard: reliance on previous assessments on whether leases are onerous; the accounting for operating leases with a remaining lease term of less than 12 months as at January 1, 2019 as
short-term leases; the exclusion of initial direct costs for the measurement of the right-of-use asset at the date of initial application; and the use of hindsight in determining the lease term where the contract contains options to extend or terminate the
lease.
A reconciliation of the lease liability as at January 1, 2019 is as follows:
As at January 1, 2019
Operating lease commitments comprised in the total commitments disclosed as at December 31, 2018 188,983Discounted using the lessee’s incremental borrowing rate at the date of initial application 122,270
Lease liability recognized as at January 1, 2019 122,270
Add: net lease-related prepaid as at December 31, 2018 1,618
Right-of-use asset recognized as at January 1, 2019 123,888
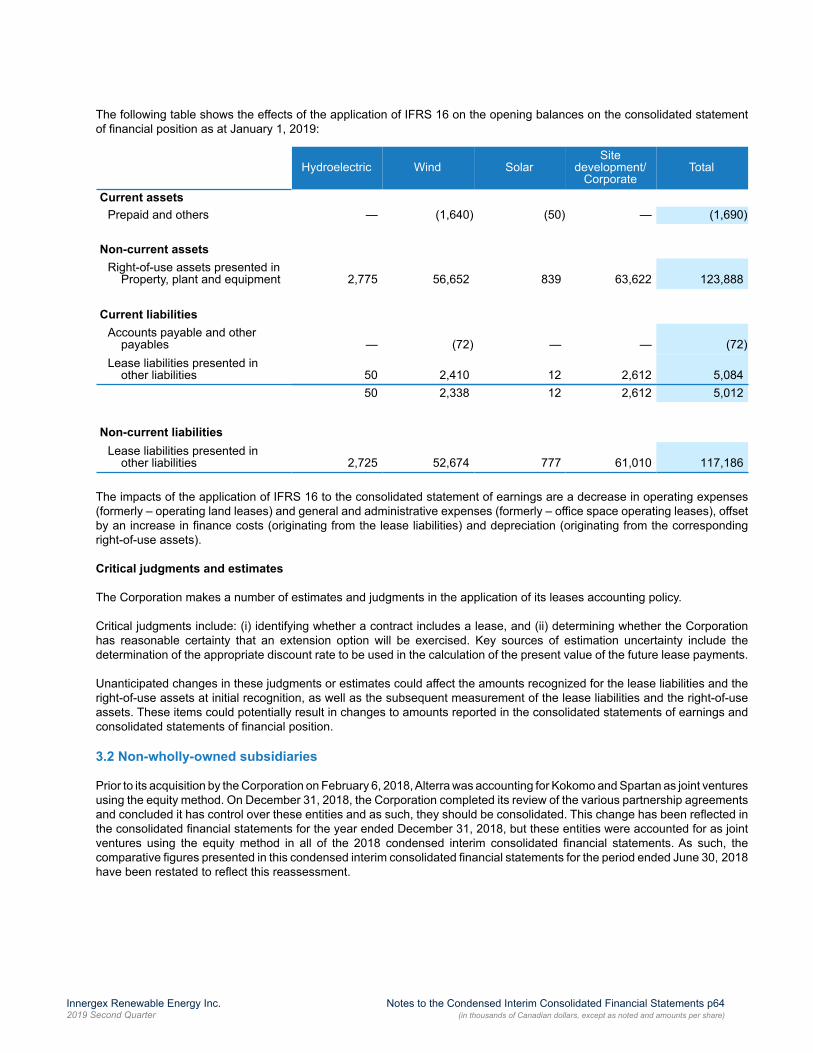
Innergex Renewable Energy Inc. Notes to the Condensed Interim Consolidated Financial Statements p642019 Second Quarter (in thousands of Canadian dollars, except as noted and amounts per share)
The following table shows the effects of the application of IFRS 16 on the opening balances on the consolidated statement of financial position as at January 1, 2019:
Hydroelectric Wind SolarSite
development/Corporate
Total
Current assetsPrepaid and others — (1,640) (50) — (1,690)
Non-current assetsRight-of-use assets presented in Property, plant and equipment 2,775 56,652 839 63,622 123,888
Current liabilitiesAccounts payable and other payables — (72) — — (72)Lease liabilities presented in other liabilities 50 2,410 12 2,612 5,084
50 2,338 12 2,612 5,012
Non-current liabilitiesLease liabilities presented in other liabilities 2,725 52,674 777 61,010 117,186
The impacts of the application of IFRS 16 to the consolidated statement of earnings are a decrease in operating expenses (formerly – operating land leases) and general and administrative expenses (formerly – office space operating leases), offset by an increase in finance costs (originating from the lease liabilities) and depreciation (originating from the corresponding right-of-use assets).
Critical judgments and estimates
The Corporation makes a number of estimates and judgments in the application of its leases accounting policy.
Critical judgments include: (i) identifying whether a contract includes a lease, and (ii) determining whether the Corporation has reasonable certainty that an extension option will be exercised. Key sources of estimation uncertainty include the determination of the appropriate discount rate to be used in the calculation of the present value of the future lease payments.
Unanticipated changes in these judgments or estimates could affect the amounts recognized for the lease liabilities and the right-of-use assets at initial recognition, as well as the subsequent measurement of the lease liabilities and the right-of-use assets. These items could potentially result in changes to amounts reported in the consolidated statements of earnings and consolidated statements of financial position.
3.2 Non-wholly-owned subsidiaries
Prior to its acquisition by the Corporation on February 6, 2018, Alterra was accounting for Kokomo and Spartan as joint ventures using the equity method. On December 31, 2018, the Corporation completed its review of the various partnership agreements and concluded it has control over these entities and as such, they should be consolidated. This change has been reflected in the consolidated financial statements for the year ended December 31, 2018, but these entities were accounted for as joint ventures using the equity method in all of the 2018 condensed interim consolidated financial statements. As such, the comparative figures presented in this condensed interim consolidated financial statements for the period ended June 30, 2018 have been restated to reflect this reassessment.

Innergex Renewable Energy Inc. Notes to the Condensed Interim Consolidated Financial Statements p652019 Second Quarter (in thousands of Canadian dollars, except as noted and amounts per share)
4. DISCONTINUED OPERATIONS
On March 25, 2019, the Corporation reached an agreement to sell its wholly owned subsidiary Magma Energy Sweden A.B., which owns an equity interest of approximately 53.9% in HS Orka hf ("HS Orka"). HS Orka represented both the Corporation's Icelandic geographic segment and geothermal operation segment. The fair value less selling costs was estimated to be in excess of the carrying value of the net assets held for sale. As at March 31, 2019, the criteria for assets held for sale were met, requiring the assets and liabilities of HS Orka to be classified as held for sale.
On May 23, 2019, the sale of HS Orka to Jarðvarmi slhf was completed for a sale price of US$299,910 ($404,219), before giving effect to closing adjustments described below, on the same terms and conditions as those announced on March 25, 2019.
The closing adjustments to the sale were finalized in July 2019 and resulted in an adjustment reducing the purchase price by US$2,542 ($3,327), to US$297,368 ($400,892).
The following table summarizes the net earnings from discontinued operations:
Period of 53days ended
May 23, 2019
Three-monthperiod endedJune 30, 2018
Period of 143days ended
May 23, 2019
Period of 145days ended
June 30, 2018
Revenues 13,412 25,578 40,006 41,995
Expenses 18,225 19,597 39,677 43,392Share of earnings of joint ventures andassociates (1,434) (943) (3,718) (3,016)
(Loss) earnings before income taxes (3,379) 6,924 4,047 1,619
(Recovery of) income taxes expenses (966) 1,168 (40) 1,008Net (loss) earnings from discontinued operationsbefore the following: (2,413) 5,756 4,087 611
Gain on sale of the subsidiary (20,211) — (17,277) —
Net earnings from discontinued operations 17,798 5,756 21,364 611Other comprehensive income (loss) fromdiscontinued operations 41,718 (35,342) 3,928 1,519
Total comprehensive income (loss) fromdiscontinued operations 59,516 (29,586) 25,292 2,130
Net earnings (loss) from discontinued operations attributable to:
Owners of the parent 18,567 3,304 19,231 (423)
Non-controlling interests (769) 2,452 2,133 1,034
17,798 5,756 21,364 611Total comprehensive income (loss) fromdiscontinued operations attributable to:
Owners of the parent 58,433 (19,548) 42,381 (1,215)
Non-controlling interests 1,083 (10,038) (17,089) 3,345
59,516 (29,586) 25,292 2,130Net earnings per share from discontinuedoperationsBasic net earnings per share ($) 0.14 0.03 0.15 —Diluted net earnings per share ($) 0.14 0.03 0.15 —

Innergex Renewable Energy Inc. Notes to the Condensed Interim Consolidated Financial Statements p662019 Second Quarter (in thousands of Canadian dollars, except as noted and amounts per share)
4.1 Details of the sale of the subsidiary
As at May 23, 2019CAD
Consideration received or receivable, net of transaction costs:Cash consideration (US$299,910) 404,219Consideration payable for working capital adjustment (US$2,542) (3,327)Transaction costs (6,453)
Total disposal consideration, net of transaction costs 394,439Carrying amount of net assets sold 331,147Gain on sale before reclassification of foreign currency translation differences 63,292Reclassification of foreign currency translation differences 46,015Gain on sale 17,277
The carrying amounts of assets and liabilities as at the date of sale:
As at May 23, 2019
Current assets 37,039
Non-current assets 855,734
Total assets held for sale 892,773
Current liabilities 71,976Non-current liabilities 228,804Equity attributable to owners of the parent 331,147Non-controlling interests 260,846Total liabilities held for sale 892,773
5. DERIVATIVE FINANCIAL INSTRUMENTS
On May 8, 2019 and June 5, 2019 the Corporation entered into eight US$ denominated hedge agreements to mitigate the risk of fluctuations in the interest rates on the long-term debts held by Foard City Partnership Holdings, LLC. The notional amounts of theses contracts as at June 30, 2019 total US$23,370 and will mature in 2029. The fair value is based on Level 2 valuation techniques. The Corporation designated the interest rate swaps as a cash flow hedge for accounting purposes.
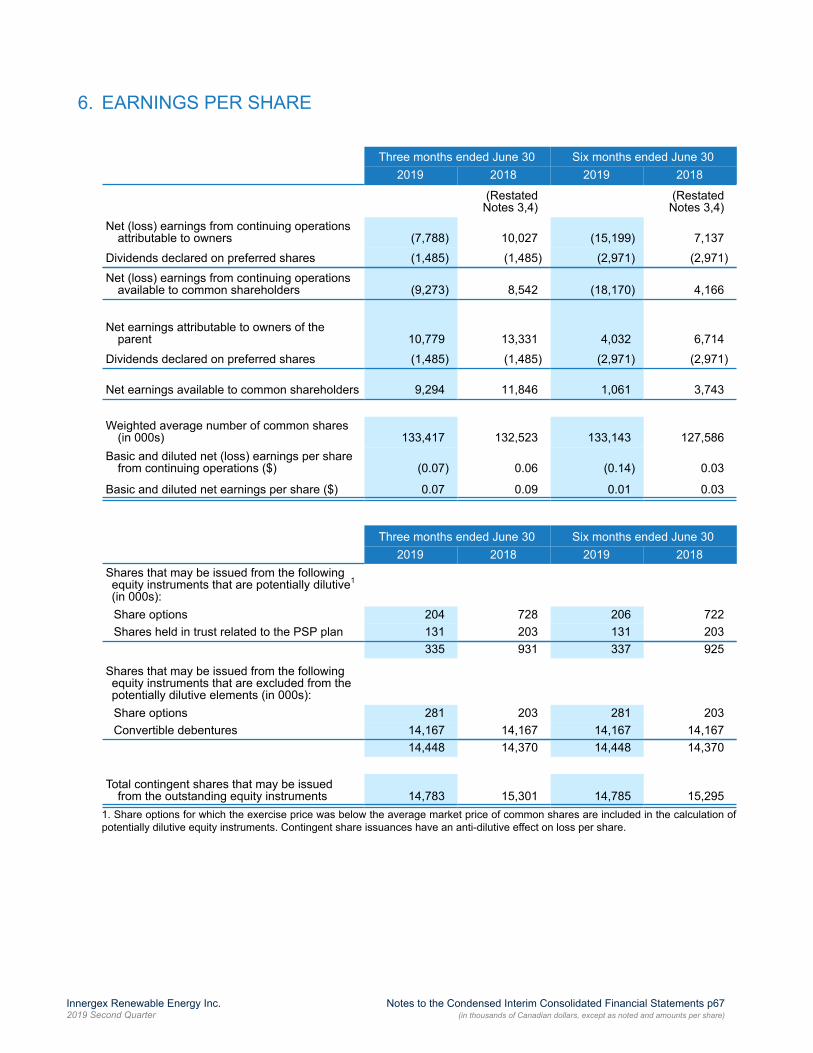
Innergex Renewable Energy Inc. Notes to the Condensed Interim Consolidated Financial Statements p672019 Second Quarter (in thousands of Canadian dollars, except as noted and amounts per share)
6. EARNINGS PER SHARE
Three months ended June 30 Six months ended June 302019 2018 2019 2018
(RestatedNotes 3,4)
(RestatedNotes 3,4)
Net (loss) earnings from continuing operationsattributable to owners (7,788) 10,027 (15,199) 7,137
Dividends declared on preferred shares (1,485) (1,485) (2,971) (2,971)
Net (loss) earnings from continuing operationsavailable to common shareholders (9,273) 8,542 (18,170) 4,166
Net earnings attributable to owners of theparent 10,779 13,331 4,032 6,714
Dividends declared on preferred shares (1,485) (1,485) (2,971) (2,971)
Net earnings available to common shareholders 9,294 11,846 1,061 3,743
Weighted average number of common shares(in 000s) 133,417 132,523 133,143 127,586
Basic and diluted net (loss) earnings per sharefrom continuing operations ($) (0.07) 0.06 (0.14) 0.03
Basic and diluted net earnings per share ($) 0.07 0.09 0.01 0.03
Three months ended June 30 Six months ended June 302019 2018 2019 2018
Shares that may be issued from the following equity instruments that are potentially dilutive1
(in 000s):Share options 204 728 206 722Shares held in trust related to the PSP plan 131 203 131 203
335 931 337 925
Shares that may be issued from the followingequity instruments that are excluded from thepotentially dilutive elements (in 000s):Share options 281 203 281 203Convertible debentures 14,167 14,167 14,167 14,167
14,448 14,370 14,448 14,370
Total contingent shares that may be issuedfrom the outstanding equity instruments 14,783 15,301 14,785 15,295
1. Share options for which the exercise price was below the average market price of common shares are included in the calculation of potentially dilutive equity instruments. Contingent share issuances have an anti-dilutive effect on loss per share.
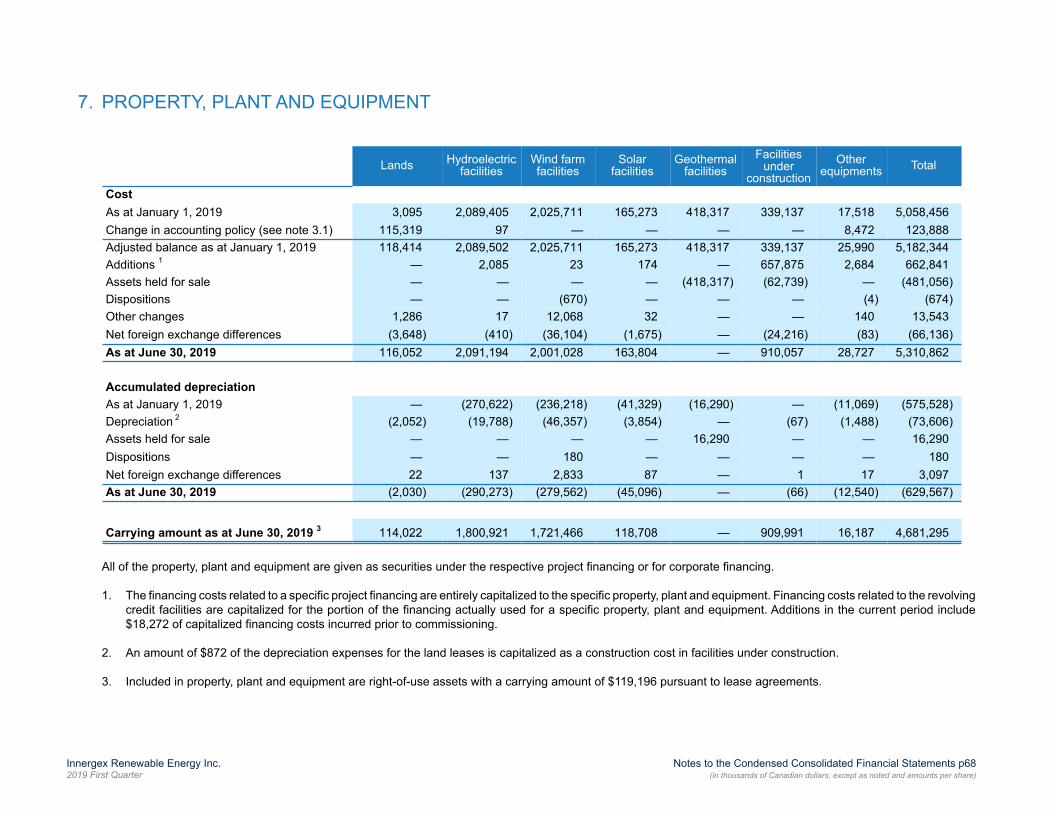
Innergex Renewable Energy Inc. Notes to the Condensed Consolidated Financial Statements p682019 First Quarter (in thousands of Canadian dollars, except as noted and amounts per share)
7. PROPERTY, PLANT AND EQUIPMENT
Lands Hydroelectricfacilities
Wind farmfacilities
Solarfacilities
Geothermalfacilities
Facilitiesunder
constructionOther
equipments Total
CostAs at January 1, 2019 3,095 2,089,405 2,025,711 165,273 418,317 339,137 17,518 5,058,456Change in accounting policy (see note 3.1) 115,319 97 — — — — 8,472 123,888Adjusted balance as at January 1, 2019 118,414 2,089,502 2,025,711 165,273 418,317 339,137 25,990 5,182,344Additions 1 — 2,085 23 174 — 657,875 2,684 662,841Assets held for sale — — — — (418,317) (62,739) — (481,056)Dispositions — — (670) — — — (4) (674)Other changes 1,286 17 12,068 32 — — 140 13,543Net foreign exchange differences (3,648) (410) (36,104) (1,675) — (24,216) (83) (66,136)As at June 30, 2019 116,052 2,091,194 2,001,028 163,804 — 910,057 28,727 5,310,862
Accumulated depreciationAs at January 1, 2019 — (270,622) (236,218) (41,329) (16,290) — (11,069) (575,528)Depreciation 2 (2,052) (19,788) (46,357) (3,854) — (67) (1,488) (73,606)Assets held for sale — — — — 16,290 — — 16,290Dispositions — — 180 — — — — 180Net foreign exchange differences 22 137 2,833 87 — 1 17 3,097As at June 30, 2019 (2,030) (290,273) (279,562) (45,096) — (66) (12,540) (629,567)
Carrying amount as at June 30, 2019 3 114,022 1,800,921 1,721,466 118,708 — 909,991 16,187 4,681,295
All of the property, plant and equipment are given as securities under the respective project financing or for corporate financing.
1. The financing costs related to a specific project financing are entirely capitalized to the specific property, plant and equipment. Financing costs related to the revolving credit facilities are capitalized for the portion of the financing actually used for a specific property, plant and equipment. Additions in the current period include $18,272 of capitalized financing costs incurred prior to commissioning.
2. An amount of $872 of the depreciation expenses for the land leases is capitalized as a construction cost in facilities under construction.
3. Included in property, plant and equipment are right-of-use assets with a carrying amount of $119,196 pursuant to lease agreements.

Innergex Renewable Energy Inc. Notes to the Condensed Interim Consolidated Financial Statements p692019 Second Quarter (in thousands of Canadian dollars, except as noted and amounts per share)
8. LONG-TERM DEBT
a. Increase of the One-Year Credit Facility
On April 23, 2019, Innergex amended its one-year credit facility contracted in October 2018, at the time of the acquisition of the Cartier Wind Farms and Operating Entities, to add additional capacity of $100,000 to be drawn as needed to provide greater flexibility. Innergex has repaid the facility with the net proceeds of the sale of its equity interest in HS Orka.
b. Closing of the Financing of the Foard City Wind Project
On May 8, 2019, the Corporation entered into a construction and long-term credit agreement for the Foard City wind project.
The credit agreement comprises two facilities:• a US$23,370 construction loan facility carrying an interest rate of LIBOR + 1.00%. As at June 30, 2019, the full
amount of US$23,370 ($30,584) had been drawn from this tranche. Following the commencement of commercial operations, the construction facility will be replaced with a term loan carrying an interest rate of LIBOR +1.75% for the first 4 years following term conversion, to +1.88% thereafter until the maturity date. All of the variable interest rate exposure has been fixed through an interest rate swap which becomes effective on September 30, 2019, resulting in a fixed interest rate of 2.43%. The term loan is for a period of 7 years with principal payments due upon maturity.
• A US$267,540 tax equity bridge loan carrying an interest rate of LIBOR +1.00%; following the commencement of commercial operations, the tax equity bridge loan will be repaid with the proceeds from the tax equity investor’s contribution. As at June 30, 2019, an amount of US$186,344 ($243,868) had been drawn from this facility.
9. SHAREHOLDERS' CAPITAL
Buyback of common shares
On May 21, 2019, Innergex announced that it has received approval from the Toronto Stock Exchange (TSX) to proceed with a normal course issuer bid on its common shares (the Bid). Under the Bid, the Corporation could purchase for cancellation up to 2,000,000 of its common shares, representing approximately 1.5% of the 133,559,963 issued and outstanding common shares of the Corporation as at May 15, 2019. The Bid commenced on May 24, 2019 and will terminate on May 23, 2020. Up to June 30, 2019, no common shares have been purchased and cancelled.
Share-based payments
During the first quarter of 2019, 1,943,012 share options have been exercised at different prices per share resulting in 427,389 common shares issued cashless. The difference between the 1,943,012 options exercised and the 427,389 shares issued is the result of the exercise of the options without disbursement by the holders and the withholding of deductions at source by the Corporation, as authorized by the share option plan and the Board of Directors.
Also 78,142 share options were granted during the three months ended March 31, 2019. The options granted under the share options plan vest in equal amounts on a yearly basis over a period of four years following the grant date. Options must be exercised before August 2026 at an exercise price of $14.41.

Innergex Renewable Energy Inc. Notes to the Condensed Interim Consolidated Financial Statements p702019 Second Quarter (in thousands of Canadian dollars, except as noted and amounts per share)
Year of granting Exercise price($)
Optionsoutstanding,
January 1, 2019(000's)
Number ofoptions
exercised(000's)
Optionsoutstanding,
June 30, 2019(000's)
2010 8.75 618 (366) 2522011 9.88 770 (770) —2012 10.70 397 (397) —2013 9.13 397 (221) 1762014 10.96 397 (189) 2082016 14.65 126 — 1262017 14.52 77 — 772019 14.41 78 — 78
2,860 (1,943) 917
Dividend Declared on common shares
The following dividends on common shares were declared by the Corporation:
Three months ended June 30 Six months ended June 302019 2018 2019 2018
Dividends declared on common shares ($/share) 0.175 0.170 0.350 0.340
Dividend Declared on common shares not recognized at the end of the reporting period
The following dividends will be paid by the Corporation on October 15, 2019:
Date ofannouncement Record date Payment date
Dividend percommon share ($)
Dividend per Series APreferred Share ($)
Dividend per Series CPreferred Share ($)
08/13/2019 9/30/2019 10/15/2019 0.1750 0.2255 0.359375
10. SUBSIDIARIES
Phoebe Solar Project
On June 4, 2019, The Corporation was able to complete the Initial Funding, which marks the beginning of shared ownership of Phoebe between Innergex and Wells Fargo. The Corporation holds 100% of the sponsor equity interest in the Phoebe Solar while the tax equity interest is held by Wells Fargo. During this quarter, Wells Fargo invested an initial amount of US$37,100 ($49,629) which represents 20% of their capital contribution.

Innergex Renewable Energy Inc. Notes to the Condensed Interim Consolidated Financial Statements p712019 Second Quarter (in thousands of Canadian dollars, except as noted and amounts per share)
11. ADDITIONAL INFORMATION TO THE CONSOLIDATED STATEMENTS OF CASH FLOWS
a. Changes in non-cash operating working capital items
Three months ended June 30 Six months ended June 302019 2018 2019 2018
(RestatedNotes 3,4)
(RestatedNotes 3,4)
Accounts receivable (18,931) (2,646) (1,806) 25,586Prepaid and others 1,359 577 (526) (555)Accounts payable and other payables 33,944 285 3,279 (14,175)
16,372 (1,784) 947 10,856
b. Additional information
Three months ended June 30 Six months ended June 302019 2018 2019 2018
(RestatedNotes 3,4)
(RestatedNotes 3,4)
Interest paid relative to operating activities (47,454) (37,868) (83,934) (73,218)Capitalized interest relative to investing
activities (2,865) (220) (5,859) (220)Total interest paid (50,319) (38,088) (89,793) (73,438)
Non-cash transactions:Unpaid property, plant and equipment 49,013 4,814 119,999 158Shares vested in PSP plan — — 1,057 948in unpaid transactions costs of convertibledebentures — 490 — 490
Unpaid project development costs 41 — (711) —Common shares issued through shareoptions exercised — — 1,181 —
Unpaid distributions to non-controllinginterests in subsidiaries (3,263) (2,535) 47 —
Remeasurement of asset retirementobligations 24,396 (230) 24,396 (63)
Common shares issued through dividendreinvestment plan 1,059 3,232 2,039 4,423
Change in fair value of lease liabilities 1,476 — 1,476 —Common shares issued upon theacquisition of Alterra — — — 330,607
Investment from non-controlling interestsin subsidiaries — 915 — 697
Unpaid closing adjustments related to thesale of HS Orka 3,327 — 3,327 —

Innergex Renewable Energy Inc. Notes to the Condensed Interim Consolidated Financial Statements p722019 Second Quarter (in thousands of Canadian dollars, except as noted and amounts per share)
c. Changes in liabilities arising from financing activities
Three months ended June 30 Six months ended June 302019 2018 2019 2018
Changes in long-term debtLong-term debt at beginning of the period 4,469,724 3,622,329 4,470,252 3,149,354Reclassified as held for sale — — (96,515) —Increase of long-term debt 481,520 240,032 648,340 542,118Repayment of long-term debt (512,871) (270,917) (553,766) (437,021)Payment of deferred financing costs (13,710) (73) (14,637) (2,687)Business acquisitions — 8,321 — 313,366Other non-cash finance costs 15,677 12,128 18,004 7,844Net foreign exchange differences (19,373) (22,639) (50,711) 16,207Long-term debt at end of the period 4,420,967 3,589,181 4,420,967 3,589,181
Changes in convertible debenturesConvertible debentures at beginning of theperiod 239,339 96,592 238,648 96,246
Increase of convertible debentures issued — 140,235 — 140,235Accretion of convertible debentures 699 420 1,390 766Convertible debentures at end of the period 240,038 237,247 240,038 237,247

Innergex Renewable Energy Inc. Notes to the Condensed Interim Consolidated Financial Statements p732019 Second Quarter (in thousands of Canadian dollars, except as noted and amounts per share)
12. SEGMENT INFORMATION
Operating segments
The Corporation produces and sells electricity generated by its hydroelectric, wind and solar facilities to publicly owned utilities or other creditworthy counterparties. The Corporation’s Management analyses the results and manages operations based on the type of technology, resulting in different cost structures and skillset requirements for the operating teams. The Corporation consequently has three operating segments: (a) hydroelectric power generation (b) wind power generation and (c) solar power generation.
During the six-month period ended June 30, 2019, concurrent with reaching an agreement to sell its ownership interests in HS Orka, the Corporation’s geothermal power generation segment has been reclassified as discontinued operations (see Note 4). As a result, the comparative segmented information has been restated.
The Corporation’s Management evaluates the performance of its operating segments based on revenues and Adjusted EBITDA. During the period, Management revised its operating segments disclosure to better reflect how it evaluates the performance of its operating segments. Certain corporate allocations (such as general and administrative expenses) that were previously made were discontinued to enhance discernment of the operating performance from the corporate performance. In addition, through emphasizing on certain measures, the revised disclosure clarifies how Management evaluates the performance of its operating segments. The Corporation’s investments in joint ventures and associates have also increased significantly during 2018 following certain business acquisitions. As such, by including the contribution from joint ventures and associates to the key performance measures, the revised disclosure better reflects the Corporation’s recent structural changes. Certain of the comparative figures have been restated to conform with the revised presentation.
"Revenues Proportionate" are Revenues plus Innergex's share of Revenues of the joint ventures and associates.“Adjusted EBITDA” represents net earnings (loss) before income tax expenses, finance cost, depreciation and amortization, adjusted to exclude other net expenses, share of (earnings) loss of joint ventures and associates, and unrealized net (gain) loss on financial instruments. "Adjusted EBITDA Proportionate" represents Adjusted EBITDA plus the Corporation’s share of Adjusted EBITDA of the joint ventures and associates. "Adjusted EBITDA Margin" represents Adjusted EBITDA divided by revenues. Adjusted EBITDA, Adjusted EBITDA Proportionate and Adjusted EBITDA Margin are not recognized measures under IFRS and have no standardized meaning prescribed by IFRS. They may therefore not be comparable to similar measures presented by other issuers. Readers are cautioned that Adjusted EBITDA, Adjusted EBITDA Proportionate and Adjusted EBITDA Margin should not be construed as an alternative to net earnings (loss), as determined in accordance with IFRS.
Except for Adjusted EBITDA, Adjusted EBITDA Proportionate and Adjusted EBITDA Margin described above, the accounting policies for these segments are the same as those described in the significant accounting policies. The Corporation accounts for inter-segment and management sales at the carrying amount.

Innergex Renewable Energy Inc. Notes to the Condensed Interim Consolidated Financial Statements p742019 Second Quarter (in thousands of Canadian dollars, except as noted and amounts per share)
Three months ended June 30, 2019
Operating segments Hydroelectric Wind Solar Segmentresults
Segment revenues 76,491 62,193 6,009 144,693Innergex's share of revenues of joint ventures and
associates 16,411 8,147 540 25,098Segment Revenues Proportionate 92,902 70,340 6,549 169,791
Segment Adjusted EBITDA 60,842 48,698 5,723 115,263Innergex's share of Adjusted EBITDA of joint ventures
and associates 11,417 4,152 24 15,593Segment Adjusted EBITDA Proportionate 72,259 52,850 5,747 130,856
Segment Adjusted EBITDA Margin 80% 78% 95% 80%
Six months ended June 30, 2019
Operating segments Hydroelectric Wind Solar Segmentresults
Segment revenues 104,529 157,019 9,564 271,112Innergex's share of revenues of joint ventures and
associates 21,694 17,179 1,032 39,905Segment Revenues Proportionate 126,223 174,198 10,596 311,017
Segment Adjusted EBITDA 78,120 133,662 9,050 220,832Innergex's share of Adjusted EBITDA of joint ventures
and associates 12,462 9,288 275 22,025Segment Adjusted EBITDA Proportionate 90,582 142,950 9,325 242,857
Segment Adjusted EBITDA Margin 75% 85% 95% 81%
As at June 30, 2019 Hydroelectric Wind Solar Segmenttotals
Investments in joint ventures and associates 186,248 191,697 15,762 393,707Acquisition of property, plant and equipment during the
period 2,092 23 174 2,289
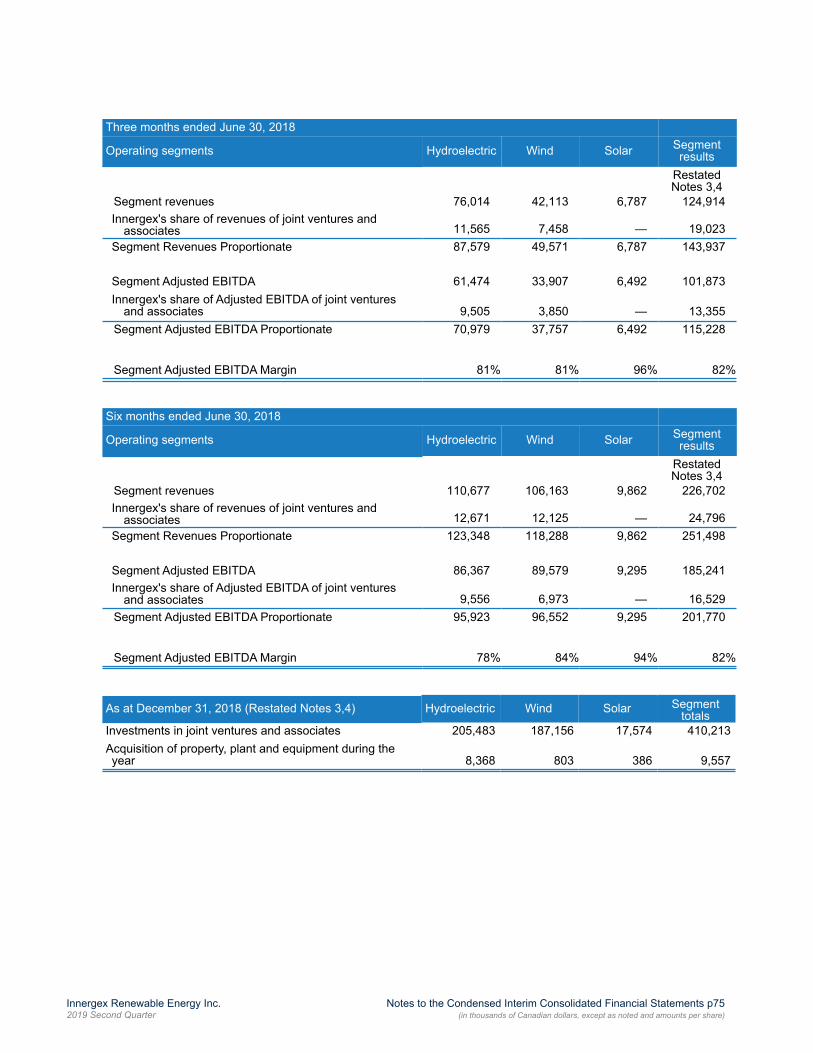
Innergex Renewable Energy Inc. Notes to the Condensed Interim Consolidated Financial Statements p752019 Second Quarter (in thousands of Canadian dollars, except as noted and amounts per share)
Three months ended June 30, 2018
Operating segments Hydroelectric Wind Solar Segmentresults
RestatedNotes 3,4
Segment revenues 76,014 42,113 6,787 124,914Innergex's share of revenues of joint ventures and
associates 11,565 7,458 — 19,023Segment Revenues Proportionate 87,579 49,571 6,787 143,937
Segment Adjusted EBITDA 61,474 33,907 6,492 101,873Innergex's share of Adjusted EBITDA of joint ventures
and associates 9,505 3,850 — 13,355Segment Adjusted EBITDA Proportionate 70,979 37,757 6,492 115,228
Segment Adjusted EBITDA Margin 81% 81% 96% 82%
Six months ended June 30, 2018
Operating segments Hydroelectric Wind Solar Segmentresults
RestatedNotes 3,4
Segment revenues 110,677 106,163 9,862 226,702Innergex's share of revenues of joint ventures and
associates 12,671 12,125 — 24,796Segment Revenues Proportionate 123,348 118,288 9,862 251,498
Segment Adjusted EBITDA 86,367 89,579 9,295 185,241Innergex's share of Adjusted EBITDA of joint ventures
and associates 9,556 6,973 — 16,529Segment Adjusted EBITDA Proportionate 95,923 96,552 9,295 201,770
Segment Adjusted EBITDA Margin 78% 84% 94% 82%
As at December 31, 2018 (Restated Notes 3,4) Hydroelectric Wind Solar Segmenttotals
Investments in joint ventures and associates 205,483 187,156 17,574 410,213Acquisition of property, plant and equipment during theyear 8,368 803 386 9,557

Innergex Renewable Energy Inc. Notes to the Condensed Interim Consolidated Financial Statements p762019 Second Quarter (in thousands of Canadian dollars, except as noted and amounts per share)
Segment Adjusted EBITDA and Adjusted EBITDA Margin are reconciled to the most comparable IFRS measure, namely, net earnings (loss) from continuing operations, in the following table:
Three months ended June 30 Six months ended June 30
2019 2018 2019 2018
RestatedNotes 3,4
RestatedNotes 3,4
Segment Adjusted EBITDA 115,263 101,873 220,832 185,241Unallocated expenses:
General and administrative 7,110 6,148 15,005 11,653Prospective projects 2,905 4,065 7,336 8,362
Adjusted EBITDA 105,248 91,660 198,491 165,226Share of loss of joint ventures and associates 142 1,983 7,032 916Unrealized net loss (gain) on financial instruments 8,506 (8,077) 3,194 (5,794)Other net expenses 552 1,118 1,278 5,006EBITDA 96,048 96,636 186,987 165,098Finance costs 58,259 48,972 111,230 92,875Depreciation and amortization 46,749 36,459 93,215 72,700Income tax expense (recovery of) 1,493 100 (2,585) (1,887)Net (loss) earnings from continuing operations (10,453) 11,105 (14,873) 1,410
Geographic segments
As at June 30, 2019, excluding its investments in joint ventures and associates which are accounted for as equity method, the Corporation had interests in the following operating assets: 29 hydroelectric facilities, six wind farms and one solar farm in Canada, 15 wind farms in France and one hydroelectric facility and two solar farms in the United States. The Corporation operates in four principal geographical areas, which are detailed below:
Three months ended June 30 Six months ended June 302019 2018 2019 2018
RevenuesRestatedNotes 3,4
RestatedNote 3,4
Canada 125,014 106,545 221,144 174,975France 17,677 15,860 47,139 48,080United States 2,002 2,509 2,829 3,647
144,693 124,914 271,112 226,702
As at June 30, 2019 December 31, 2018Non-current assets, excluding derivatives financial instruments and deferred tax assets 1 Restated Notes 3,4
Canada 3,680,012 3,757,207France 922,090 956,214United States 2 1,219,168 526,716Chile 144,382 154,299
5,965,652 5,394,4361. Includes the investments in joint ventures and associates2. Includes the Phoebe solar project under construction and the Foard City wind project under construction.

Innergex Renewable Energy Inc. Notes to the Condensed Interim Consolidated Financial Statements p772019 Second Quarter (in thousands of Canadian dollars, except as noted and amounts per share)
13. SUBSEQUENT EVENTS
a. New swap contracts signed
On July 18, 2019 and July 22, 2019 the Corporation entered into six hedge agreements to mitigate the risk of fluctuations in the interest rates on the revolving credit facilities held by the Corporation. The notional amounts of theses contracts total $125,000 and will mature between 2029 and 2049. The fair value is based on Level 2 valuation techniques. The Corporation designated the interest rate swaps as a cash flow hedge for accounting purposes.
b. Favourable decision from the Environmental Appeal Board ("EAB")
In 2017, the Comptroller of Water Rights has sought to apply the higher water rights rates retroactively to the Fire Creek, Lamont Creek, Stokke Creek, Tipella Creek and Upper Stave River for the years 2011 and 2012 and by doing so sought an additional $3,200 in water rental for these two years. An appeal of this decision was filed with the Environmental Appeal Board. On July 26, 2019, the Environmental Appeal Board rendered its decision, granting the appeal and ordering the Comptroller of Water Rights to reimburse to each facility its proportionate share of the adjusted water rental amounts overcharged with interest. This decision is subject to appeal by the Comptroller.
14. COMPARATIVE FIGURES
Certain reclassifications have been made to the prior year's financial statements to enhance comparability with the current year's financial statements.
As a result, certain line items have been amended in the statement of financial position, statement of earnings and other comprehensive income (loss), statement of changes in equity and statements of cash flow, and the related notes to the financial statements. Comparative figures have been adjusted to conform to the current year's presentation.

SHAREHOLDER INFORMATION
Head Office
1225 St-Charles West, 10th floorLongueuil QC J4K 0B9Tel. 450 928.2550Fax 450 928.2544 innergex.com
Investor RelationsJean-François NeaultChief Financial OfficerTel. 450 928.2550 [email protected]
Common Shares - TSX: INE
Series A Preferred Shares - TSX: INE.PR.A
Series C Preferred Shares - TSX: INE.PR.C
Convertible Debentures - TSX: INE.DB.ATSX: INE.DB.B
Credit Rating by Standard & Poor'sInnergex Renewable Energy Inc.Series A Preferred SharesSeries C Preferred Shares
BBB-P-3P-3
Dividend Reinvestment Plan (DRIP)Innergex Renewable Energy Inc. offers a Dividend Reinvestment Plan (DRIP) for its shareholders of common shares. This plan enables eligible holders of common shares to acquire additional common shares of the Corporation by reinvesting all or part of their cash dividends. For more information about the Corporation's DRIP, please visit our website at innergex.com or contact the DRIP administrator: AST Trust Company (Canada). Please note that if you wish to enrol in the DRIP but own your shares indirectly through a broker or financial institution, you must contact this intermediary and ask them to enrol in the DRIP on your behalf.
Transfer Agent and Registrar
For information concerning share certificates,dividend payments, a change of address, orelectronic delivery of shareholder documents, pleasecontact:
AST Trust Company (Canada)2001 Robert-Bourassa, Suite 1600Montreal QC H3A 2A6Tel. 1 800 387.0825 416 [email protected]
Ce document est disponible en français.Pour la version numérique, visitez innergex.comPour la version papier, écrivez-nous à [email protected]