Q2 2015 Seas Investor Presentation (Final)
37
Q2 2015 Investor Presentation As of June 30, 2015
Transcript of Q2 2015 Seas Investor Presentation (Final)
Q2 2015 Investor Presentation
As of June 30, 2015

Cautionary Statements
2
Statement Regarding Forward-Looking Statements This presentation contains “forward-looking statements” within the meaning of U.S. federal securities laws. All statements contained in this presentation other than statements of historical facts are forward-looking statements. Words such as “might,” “will,” “may,” “should,” “estimates,” “expects,” “continues,” “contemplates,” “anticipates,” “projects,” “plans,” “potential,” “predicts,” “intends,” “believes,” “forecasts,” “future” and variations of such words or similar expressions are intended to identify forward-looking statements. Forward-looking statements are not historical facts, and are based upon management’s current expectations, beliefs, estimates and projections, and various assumptions, many of which are inherently uncertain and beyond our control. Such expectations, beliefs, estimates and projections are expressed in good faith and management believes there is a reasonable basis for them. However, there can be no assurance that management’s expectations, beliefs, estimates and projections will be achieved and actual results may differ materially from what is expressed in or indicated by the forward-looking statements. Forward-looking statements are subject to risks and uncertainties that could cause actual performance or results to differ materially from those expressed in the forward-looking statements, including risks detailed in SeaWorld Entertainment, Inc.’s (“SeaWorld” or the “Company”) 2014 Annual Report on Form 10-K as filed with the U.S. Securities and Exchange Commission (the “SEC”), as such risk factors may be updated from time to time in our periodic filings with the SEC. Forward-looking statements speak only as of the date the statements are made. The Company assumes no obligation to update forward-looking statements to reflect actual results, subsequent events or circumstances or other changes affecting forward-looking information except to the extent required by applicable securities laws. Statement Regarding Non-GAAP Financial Measures This presentation includes several metrics which are not calculated in accordance with the generally accepted accounting principles in the United States (“GAAP”), including Adjusted EBITDA, Free Cash Flow and Adjusted Free Cash Flow. These metrics have important limitations and should not be considered in isolation or as a substitute for measures of the Company’s financial performance or liquidity prepared in accordance with GAAP. In addition, these metrics, as presented by the Company, may not be comparable to similarly titled measures of other companies due to varying methods of calculations. Adjusted EBITDA is defined as net income (loss) before interest expense, income tax expense (benefit), depreciation and amortization, as further adjusted to exclude certain unusual, non-cash and other items permitted in calculating covenant compliance under the credit agreement governing the Company’s senior secured credit facilities. The Company believes that the presentation of Adjusted EBITDA is appropriate to provide additional information to investors about the calculation of, and compliance with, certain financial covenants in the credit agreement. Adjusted EBITDA is a material component of these covenants. The Company also uses Adjusted EBITDA in connection with certain components of its executive compensation program. In addition, investors, lenders, financial analysts and rating agencies have historically used EBITDA-related measures in the Company’s theme park and entertainment industry, along with other measures to evaluate the Company’s ability to meet its debt service requirement, to estimate the value of a company and to make informed investment decisions. Free Cash Flow is defined as net cash provided by operating activities reduced by capital expenditures. Adjusted Free Cash Flow is defined as Free Cash Flow reduced by the one-time cash payment of the 2009 Advisory Agreement termination fee. For a reconciliation of Adjusted EBITDA to net income (loss) and Free Cash Flow and Adjusted Free Cash Flow to cash flow from operating activities, please refer to the Appendix in this presentation or our Quarterly Earnings Release, which can be found at our website www.seaworldentertainment.com. Statement Regarding Use of Registered Trademarks The Company owns or has rights to use a number of registered and common law trademarks, service marks and trade names in connection with its business in the United States and in certain foreign jurisdictions, including SeaWorld Entertainment, SeaWorld Parks & Entertainment, SeaWorld®, Shamu®, Busch Gardens®, Aquatica™, Discovery Cove®, Sea Rescue™, and other names and marks that identify our theme parks, characters, rides, attractions and other businesses. In addition, the Company has certain rights to use Sesame Street® marks, characters and related indicia through certain license agreements with Sesame Workshop (f/k/a Children’s Television Workshop). Solely for convenience, trademarks, service marks and trade names referred to in this presentation may be without the ® and ™ symbols, but such references are not intended to indicate, in any way, that the Company will not assert, to the fullest extent under applicable law, its rights or the rights of the applicable licensors to these trademarks, service marks, and trade names.

3
Company Overview & Investment Highlights

4
A Leading Theme Park and Entertainment Company
We inspire people, through the power of entertainment, to celebrate, connect with and care for the natural world we share.
4
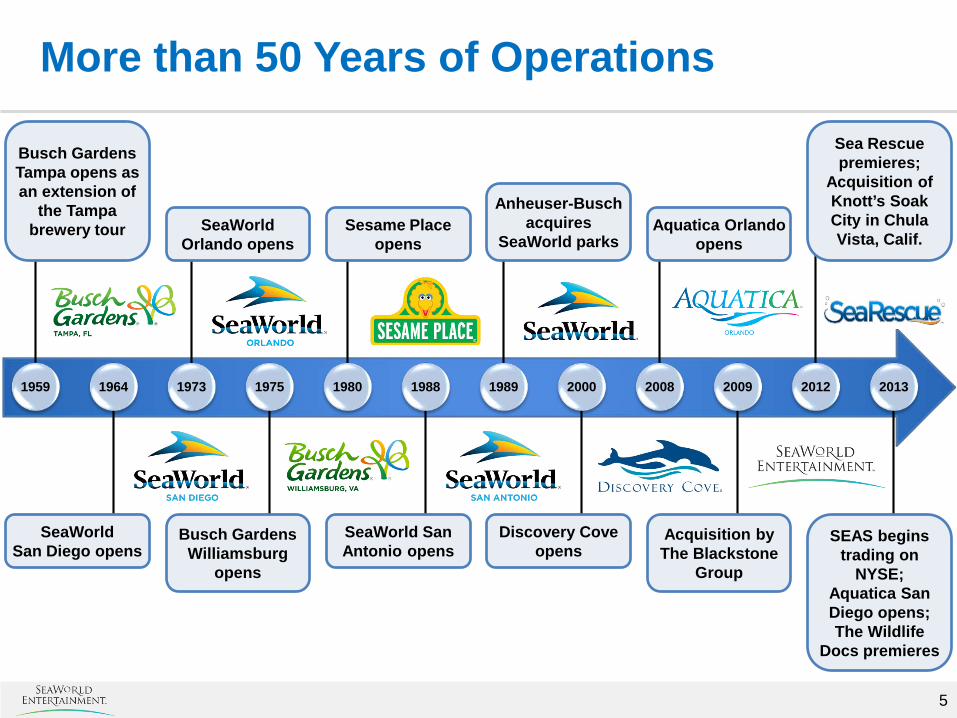
More than 50 Years of Operations
5
1959
Busch Gardens Tampa opens as an extension of
the Tampa brewery tour
SeaWorld San Diego opens
1964 2013 1973
SeaWorld Orlando opens
1975
Busch Gardens Williamsburg
opens
1980 1988
SeaWorld San Antonio opens
Sesame Place opens
1989
Anheuser-Busch acquires
SeaWorld parks
SEAS begins trading on
NYSE; Aquatica San Diego opens; The Wildlife
Docs premieres
2012
Sea Rescue premieres;
Acquisition of Knott’s Soak City in Chula Vista, Calif.
Acquisition by The Blackstone
Group
2009
Aquatica Orlando opens
2008 2000
Discovery Cove opens

SeaWorld Entertainment, Inc. At a Glance…
6
• 22.5 million in Attendance • $1,367 million of Revenue • $355 million of Adjusted EBITDA • $126 million of Free Cash Flow
• 11 parks in 5 states • 4 of top 20 theme parks by attendance in
North America1
• Over 50 year operating history • Approximately 89,000 animals2
• Over 600 rides and attractions2
• Approximately 2,000 acres of owned land, with nearly 400 acres available for future development3
2015 LTM Results4
Operations
• Large scale parks • Located in key markets: warm weather, sizable
local populations, tourist destinations • Park clusters in 5 of 6 markets • Distinct zoological collection • Strong brands and intellectual property
SeaWorld’s Differentiation
1 Source: Theme Index: The Global Attractions Attendance Report TEA / AECOM, 2015. 2 As of the year ended December 31, 2014. 3 Developable land defined as unimproved acreage outside park perimeter, including unpaved guest parking lots but excluding paved parking lots. 4 2015 LTM results represent latest twelve months through June 30, 2015.
Investment Highlights
7
Diversified Revenue Base
Globally Recognized Parks, Brands and Intellectual Property
Well-Capitalized Parks Positioned for Sustained Growth
Strong Free Cash Flow Generation
Continued Growth Opportunities
Experienced and Execution–Focused Management Team
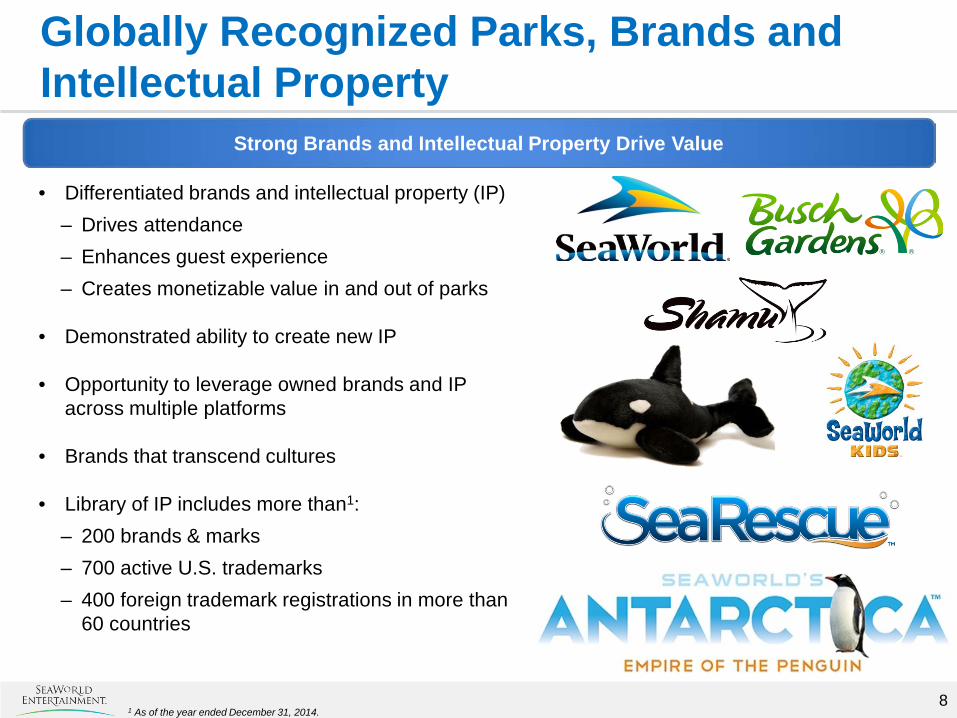
Globally Recognized Parks, Brands and Intellectual Property
8
• Differentiated brands and intellectual property (IP) – Drives attendance – Enhances guest experience – Creates monetizable value in and out of parks
• Demonstrated ability to create new IP
• Opportunity to leverage owned brands and IP across multiple platforms
• Brands that transcend cultures
• Library of IP includes more than1: – 200 brands & marks – 700 active U.S. trademarks – 400 foreign trademark registrations in more than
60 countries
Strong Brands and Intellectual Property Drive Value
1 As of the year ended December 31, 2014.

Among the World’s Largest Zoological Collections
9
• One-of-a-kind zoological collection of approximately 89,000 marine and terrestrial animals1
• More than 80% of our marine mammals were born in human care1
• Successful and innovative breeding programs that have produced 32 killer whales, 165 dolphins and 148 sea lions, among other species1
• Our marine animal populations are characterized by their substantial genetic diversity
• One of the world’s largest penguin populations
Inspiring Guests to Care for the Natural World through Up-Close Animal Experiences
1 As of the year ended December 31, 2014.
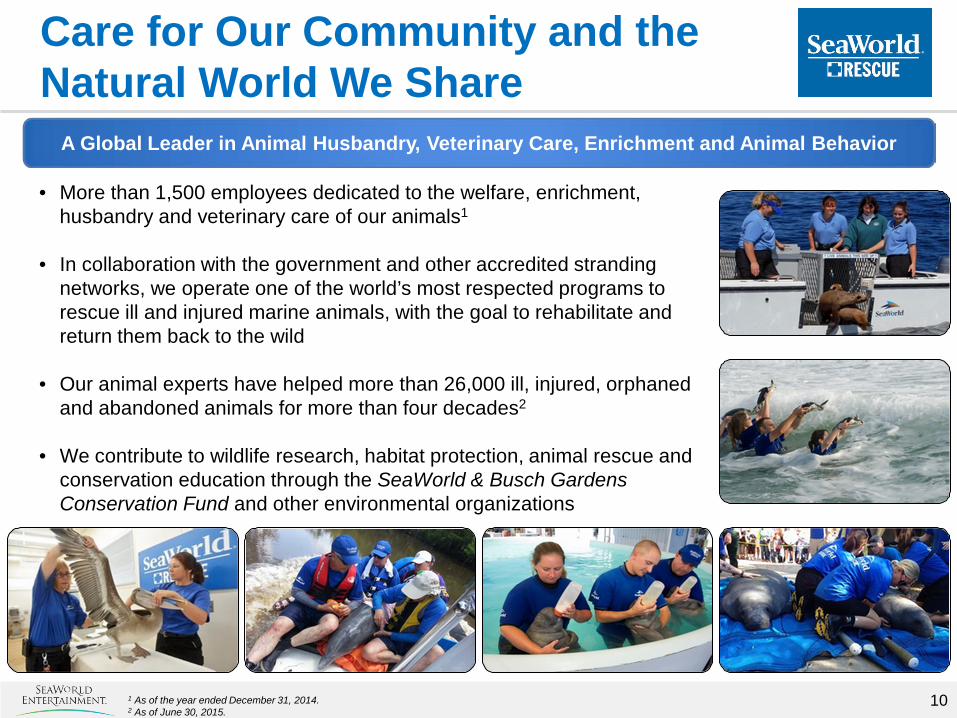
Care for Our Community and the Natural World We Share
10
• More than 1,500 employees dedicated to the welfare, enrichment, husbandry and veterinary care of our animals1
• In collaboration with the government and other accredited stranding networks, we operate one of the world’s most respected programs to rescue ill and injured marine animals, with the goal to rehabilitate and return them back to the wild
• Our animal experts have helped more than 26,000 ill, injured, orphaned and abandoned animals for more than four decades2
• We contribute to wildlife research, habitat protection, animal rescue and conservation education through the SeaWorld & Busch Gardens Conservation Fund and other environmental organizations
A Global Leader in Animal Husbandry, Veterinary Care, Enrichment and Animal Behavior
1 As of the year ended December 31, 2014. 2 As of June 30, 2015.

Investment Highlights
11
Diversified Revenue Base
Globally Recognized Parks, Brands and Intellectual Property
Well-Capitalized Parks Positioned for Sustained Growth
Strong Free Cash Flow Generation
Continued Growth Opportunities
Experienced and Execution–Focused Management Team

Well-Capitalized Parks Positioned for Sustained Growth
12
• In 2015 TripAdvisor ranked 7 of our 11 theme parks among the best 25 attractions in the U.S., including Discovery Cove, which was voted the Number 2 amusement park in the world
• Busch Gardens Williamsburg has been named the most beautiful amusement park in the world for 24 consecutive years by the National Amusement Park Historical Association2
• Winner of the top three spots in Amusement Today’s Golden Ticket Award for Best Marine Life Park since 20063
• Busch Gardens Williamsburg has been recognized with the Golden Ticket Award for Best Landscaping each year since the award’s inception in 19983
Well-Maintained and Industry Recognized Theme Parks and Attractions
Busch Gardens Williamsburg
Discovery Cove
1 TripAdvisor Traveler’s Choice Awards, 2015. 2 National Amusement Park Historical Association, 2014. 3 Amusement Today, Inc. Golden Ticket Awards, 2014.
SeaWorld Orlando
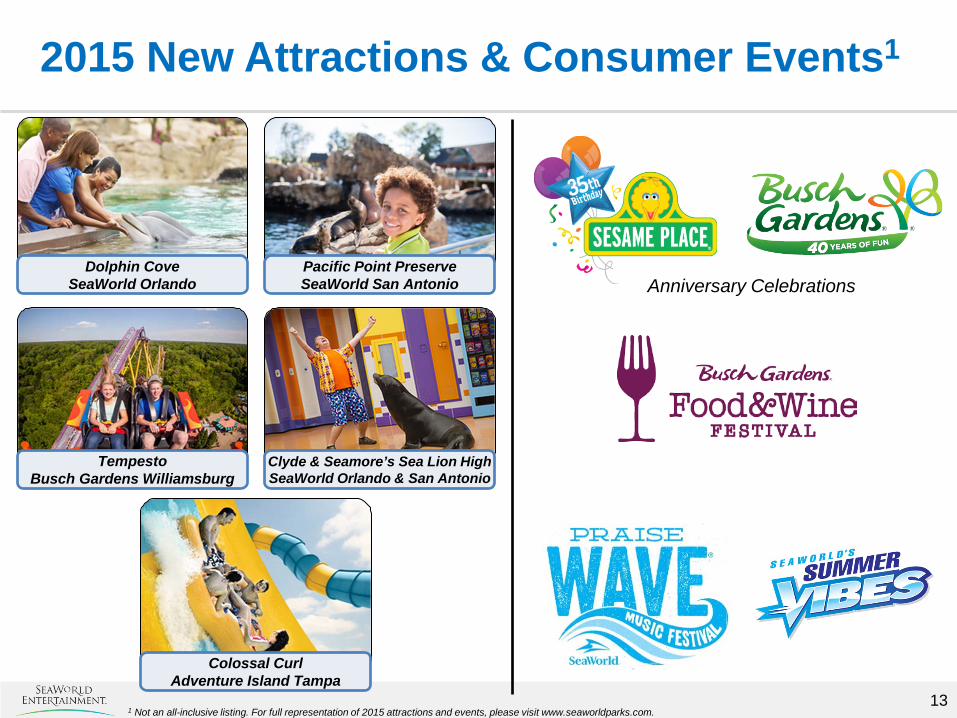
2015 New Attractions & Consumer Events1
Clyde & Seamore’s Sea Lion High SeaWorld Orlando & San Antonio
Tempesto Busch Gardens Williamsburg
Colossal Curl Adventure Island Tampa
Dolphin Cove SeaWorld Orlando
13 1 Not an all-inclusive listing. For full representation of 2015 attractions and events, please visit www.seaworldparks.com.
Pacific Point Preserve SeaWorld San Antonio Anniversary Celebrations

2016 New Attraction: Mako
14
• Opening at SeaWorld Orlando in summer 2016 • Will be the tallest, longest and fastest coaster in any of Orlando’s theme parks • Hypercoaster manufactured by leading roller coaster builder Bolliger & Mabillard • Mako will be the centerpiece of a newly themed shark realm, which includes walkthrough
attraction Shark Encounter and signature dining experience Sharks Underwater Grill

2016 New Attraction: Discovery Point
15
• Opening at SeaWorld San Antonio in May 2016 • Discovery Point provides the opportunity for guests to learn about dolphin behaviors and
communication, and interact and swim with dolphins in a naturalistic setting1
• In addition to the dolphin swim experience, underwater viewing panes are being added which will allow guests to watch dolphins swimming, playing and interacting from a new vantage point
• The expanded environment will more than double the water volume of SeaWorld San Antonio’s dolphin lagoon
• Discovery Point reflects the Company’s ongoing commitment to improve its animal habitats while providing new ways for guests to make connections with the animals in its care
1 A paid reservation is required to participate in Discovery Point’s dolphin swim experience.

2016 New Attraction: Cobra’s Curse
16
• Opening at Busch Gardens Tampa in 2016 • Family-friendly spin coaster located in the Egypt area of the park • Cobra’s Curse ride elements include an elevator-like vertical lift and an 80-foot cobra icon

Blue World Project
17
• Blue World Project is expected to open at SeaWorld San Diego in 2018 – Expands existing killer whale facilities, with a maximum depth of 50
feet and surface area of nearly 1.5 acres – Transforms how our guests experience killer whales through up-
close and personal encounters • As part of the project’s vision, the Company announced $10 million in
matching funds for research focused on identifying threats to killer whales in the wild and as well as a multi-million dollar partnership focused on ocean health
• Visit http://blueworldproject.seaworld.com to learn more

Investment Highlights
18
Diversified Revenue Base
Globally Recognized Parks, Brands and Intellectual Property
Well-Capitalized Parks Positioned for Sustained Growth
Strong Free Cash Flow Generation
Continued Growth Opportunities
Experienced and Execution–Focused Management Team

Diversified Revenue Base1
19
FL 56% CA
19%
VA 13%
Other 12%
2014 Revenue by State
2014 Attendance by Guest Origin
• Our parks are near large metro areas, with over 50 million people located within 150 miles
Domestic 84%
International 16%
• Our diversified guest base is comprised of local visitors, non-local domestic visitors and international tourists
• Our parks have broad demographic appeal, with an average party size of 3.9 people
Family 54%
Adult Only 46%
2014 Revenue by Line of Business
2014 Attendance by Family Demographic
Admissions 62%
All Other 38%
1 As of the year ended December 31, 2014.
• Our parks operate more than 100 culinary outlets and nearly 300 specialty retail shops

Investment Highlights
20
Diversified Revenue Base
Globally Recognized Parks, Brands and Intellectual Property
Well-Capitalized Parks Positioned for Sustained Growth
Strong Free Cash Flow Generation
Continued Growth Opportunities
Experienced and Execution–Focused Management Team

$355
$270
$126
($10)
$73
$1 $12 $10 $144
Strong Free Cash Flow Generation
21
($ in millions)
Strong Free Cash Flow Generation with Growth Opportunities in the Future
Restructuring & other related charges
Working Capital and
Other2
Deleveraging over time
~$650M in Federal
NOLs create minimal
cash taxes
Minimal working
capital needs
Capital Expenditures
Disciplined and flexible
capital spending
2015 LTM Adjusted EBITDA1
Cash paid for Interest
Cash Flow from
Operations
2015 LTM Free Cash
Flow1
1 2015 LTM results represent latest twelve months through June 30, 2015. 2 Excludes other non-cash items.
Cash paid for Taxes
Reduce duplication to increase efficiencies
Estimated cost savings
Estimated cost savings

Investment Highlights
22
Diversified Revenue Base
Globally Recognized Parks, Brands and Intellectual Property
Well-Capitalized Parks Positioned for Sustained Growth
Strong Free Cash Flow Generation
Continued Growth Opportunities
Experienced and Execution–Focused Management Team

Continued Growth Opportunities
23
Increasing Admissions Revenue and In-Park Spending1
1 In-Park Spending represents total food, merchandise and other revenue.
• Expand application of variable pricing to additional markets • Optimize pricing and benefits for tiered pass products • Promote in-park product offerings and special events
– Quick Queue, PhotoKey and All-Day Dining Deal – Cashless Wristband Program
• Refresh restaurant concepts to market style, away from traditional cafeteria style service
• Create premium in-park experiences utilizing mobile technology to drive higher in-park spending
Multi-year Focus on Digital Innovation
• “Discovery Guide” mobile apps put the parks into guests’ pockets – In-app purchasing, mobile ticketing and ability to redeem
special offers – Guests can use the app to pre-order meals or for table delivery
at some dining locations
Expedition Café (market style) SeaWorld Orlando

Expansion Opportunities
24
• Capital-light joint ventures leverage Company’s brands and expertise while generating royalties and management fees – Memorandum of Understanding to build a multi-park
development in the Middle East; first phase projected to open in 2020
– Letter of Intent with Village Roadshow Theme Parks to co-develop parks in Pan-Asia, India and Russia
• Ability to replicate proven park formats and attractions • Significant owned and available land for development • Variety of park formats and sizes expands opportunity set
• Opportunistic acquisition and expansion opportunities, particularly for smaller park formats
• Ability to rebrand acquired parks with Company brands
International Expansion
New Businesses
Self-Funded New Parks
(2000: Discovery Cove)
• Extend Company-branded entertainment outside of parks • Possible opportunities may include lodging, cruise and
entertainment districts
Opportunities
Opportunistic Acquisitions
(2012: Aquatica San Diego)

25
• Sea Rescue™ focuses on the rescue, rehab, and return of sea life back into their natural habitat – Nominated for a 2014 Daytime Emmy® Award for
“Outstanding Children's Series” – Premiered in April 2012 and began its fourth season on
October 4, 2014; renewed for its fifth season – Top-rated Saturday morning show in most major U.S. markets
• The Wildlife Docs™ gives a behind the scenes look at Busch Gardens Tampa’s elite zoological team – Much of the show takes place in the park's Animal Care
Center, an innovative medical center that brings park guests into the animal care experience
– Nominated for a 2015 Daytime Emmy® Award for “Outstanding Children's Series”
– Premiered in October 2013 and began its second season on October 4, 2014; renewed for its third season
Leveraging our Brands into Media and Entertainment

Investment Highlights
26
Diversified Revenue Base
Globally Recognized Parks, Brands and Intellectual Property
Well-Capitalized Parks Positioned for Sustained Growth
Strong Free Cash Flow Generation
Continued Growth Opportunities
Experienced and Execution-Focused Management Team

Experienced and Execution-Focused Management Team
27
Name Title Years with SEAS1
Years in Industry1
Joel Manby Chief Executive Officer, President & Director <1 16
Marc Swanson Chief Accounting Officer and Interim Chief Financial Officer 14 14
Dan Brown Chief Parks Operations Officer 40 40
Scott Helmstedter Chief Creative Officer 4 29
Dave Hammer Chief Human Resources Officer 35 35
Brad Andrews Chief Zoological Officer 43 43
Tony Taylor Chief Legal & Corporate Affairs Officer, General Counsel & Corporate Secretary 15 15
1 As of August 6, 2015.

28
Financial Summary

Financial Performance
29
1 2015 LTM results represent latest twelve months through June 30, 2015. 2 Calculated as total revenue divided by attendance. 3 Certain prior year amounts included in this presentation have been revised. Refer to the Company’s 2014 Annual Report on Form 10K for additional information. 4 Excludes a one-time fee of $46.3 million paid to an affiliate of Blackstone in connection with the termination of the 2009 Advisory Agreement in Q2 2013.
(In millions except per capita data)
2010 2011 2012 2013 2014 2010 – 2014 CAGR
2015 LTM1
Attendance 22.4 23.6 24.4 23.4 22.4 0.0% 22.5
Total Revenue per Capita2 $53.32 $56.31 $58.37 $62.43 $61.51 3.6% $60.84
Revenue $1,196 $1,331 $1,424 $1,460 $1,378 3.6% $1,367
Adjusted EBITDA $343 $382 $415 $439 $370 1.9% $355
Capital Expenditures $120 $225 $192 $166 $155 6.5% $144
Adjusted Free Cash Flow3 $82 $39 $108 $1674 $107 6.8% $126
Disciplined Capital Spending
30
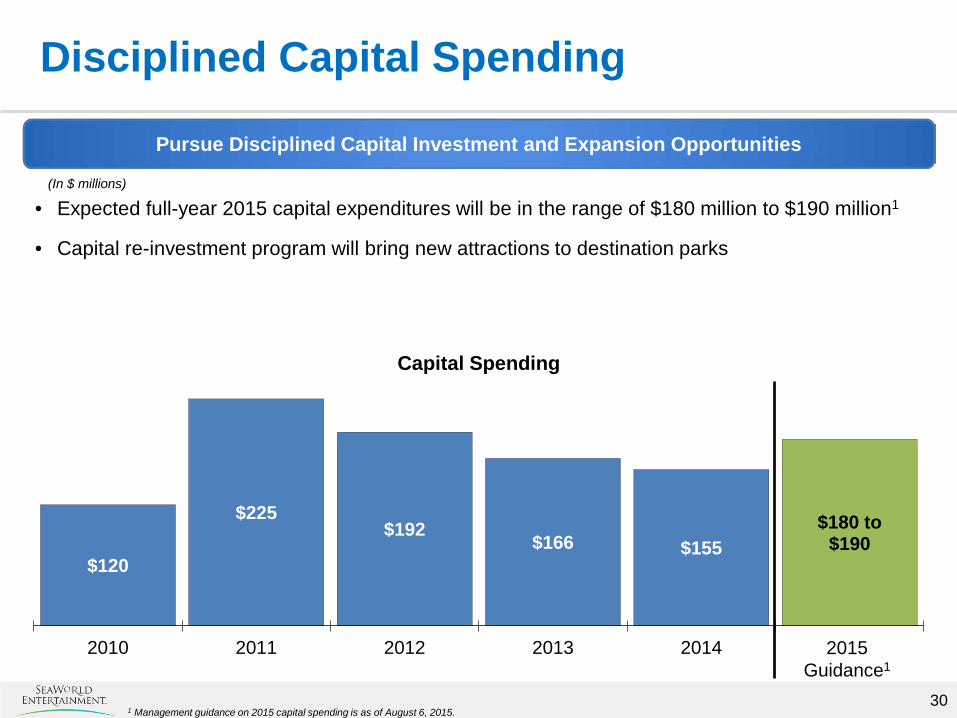
• Expected full-year 2015 capital expenditures will be in the range of $180 million to $190 million1
• Capital re-investment program will bring new attractions to destination parks
Pursue Disciplined Capital Investment and Expansion Opportunities
1 Management guidance on 2015 capital spending is as of August 6, 2015.
(In $ millions)
$120
$225 $192
$166 $155 $180 to
$190
2010 2011 2012 2013 2014 2015 Guidance1
Capital Spending
Efficient Capital Structure
31
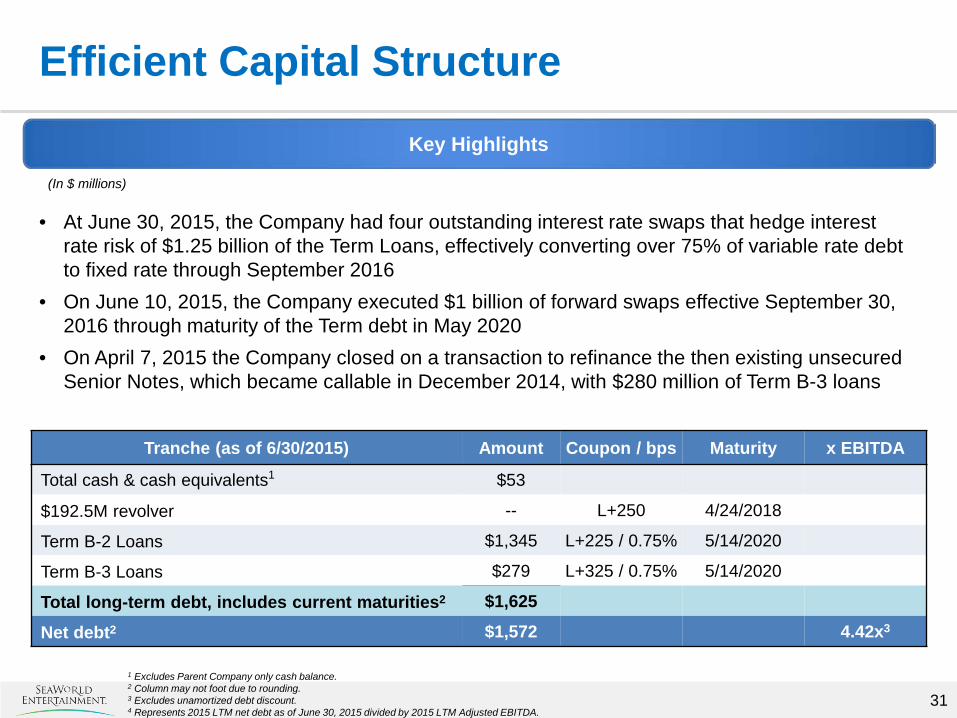
• At June 30, 2015, the Company had four outstanding interest rate swaps that hedge interest rate risk of $1.25 billion of the Term Loans, effectively converting over 75% of variable rate debt to fixed rate through September 2016
• On June 10, 2015, the Company executed $1 billion of forward swaps effective September 30, 2016 through maturity of the Term debt in May 2020
• On April 7, 2015 the Company closed on a transaction to refinance the then existing unsecured Senior Notes, which became callable in December 2014, with $280 million of Term B-3 loans
Key Highlights
1 Excludes Parent Company only cash balance. 2 Column may not foot due to rounding. 3 Excludes unamortized debt discount. 4 Represents 2015 LTM net debt as of June 30, 2015 divided by 2015 LTM Adjusted EBITDA.
(In $ millions)
Tranche (as of 6/30/2015) Amount Coupon / bps Maturity x EBITDA
Total cash & cash equivalents1 $53
$192.5M revolver -- L+250 4/24/2018
Term B-2 Loans $1,345 L+225 / 0.75% 5/14/2020
Term B-3 Loans $279 L+325 / 0.75% 5/14/2020
Total long-term debt, includes current maturities2 $1,625
Net debt2 $1,572 4.42x3

Returning Value to Shareholders
32
Capital Allocation Priorities 1. Grow the Company through opportunistic acquisitions and brand extensions What we did: Acquired eleventh theme park in 2012; expansion into media, digital and licensing 2. Provide a stable dividend that grows over time What we did: Began dividend program in 2013; increased dividend by $0.01 per share in 2014 3. Opportunistically buy back our own stock What we did: Authorized to repurchase up to $250 million of common stock, with $235 million
available for future repurchases1
4. Proactively manage long-term debt What we did: April 2015 refinanced unsecured Senior Notes into new Term B-3 Loans
Q3 2013 Q4 2013 Q1 2014 Q2 2014 Q3 2014 Q4 2014 Q1 2015 Q2 2015 Total
Dividends Paid
0.20 0.20 0.20 0.20 0.21 0.21 0.21 0.21 $1.64 $18 $18 $18 $18 $18 $18 $18 $18 $144
Share Buybacks
-- 1.5 -- 1.75 -- 0.86 -- -- 4.11 -- 44 -- 51 -- 15 -- -- $110
(In millions except per share amounts)
Over $250 Million in Net Value Returned to Shareholders through 6/30/2015
$ per share
$ value
total shares
net $ value
Total Value $254
1 As of June 30, 2015.

Investment Summary
33
Diversified Revenue Base
Globally Recognized Parks, Brands and Intellectual Property
Well-Capitalized Parks Positioned for Sustained Growth
Strong Free Cash Flow Generation
Continued Growth Opportunities
Experienced and Execution-Focused Management Team
34
Appendix

35 1 Certain prior year amounts included in this presentation have been revised. Refer to the Company’s 2014 Annual Report on Form 10K for more information. 2 2015 LTM results represent latest twelve months through June 30, 2015. 3 Column may not foot due to rounding.
(In $ millions)
Reconciliation of Adjusted EBITDA to Net (Loss) Income1
2010 2011 2012 2013 2014 2015 LTM2
Net (loss) income ($45) $15 $74 $52 $50 $24
(Benefit from) provision for income taxes (29) 11 37 26 29 13
Loss on early extinguishment of debt -- 15 2 30 -- 21
Interest expense 134 98 111 90 82 77
Depreciation & amortization 207 214 167 166 176 186
Restructuring & other related costs -- -- -- -- 12 12
Secondary offering costs -- -- -- 1 1 --
Termination of advisory agreement -- -- -- 50 -- --
Advisory fees 5 6 6 3 -- --
Equity-based compensation expense -- 1 2 6 2 4
Debt refinancing costs -- 4 5 4 -- --
Other adjusting items -- -- 1 1 3 1
Other non-cash expenses 9 12 10 10 5 8
Carve-out costs 45 6 -- -- -- --
Estimated cost savings -- -- -- -- 10 10
Deferred revenue write-down 17 -- -- -- -- --
Adjusted EBITDA3 $343 $382 $415 $439 $370 $355
36
(In $ millions)
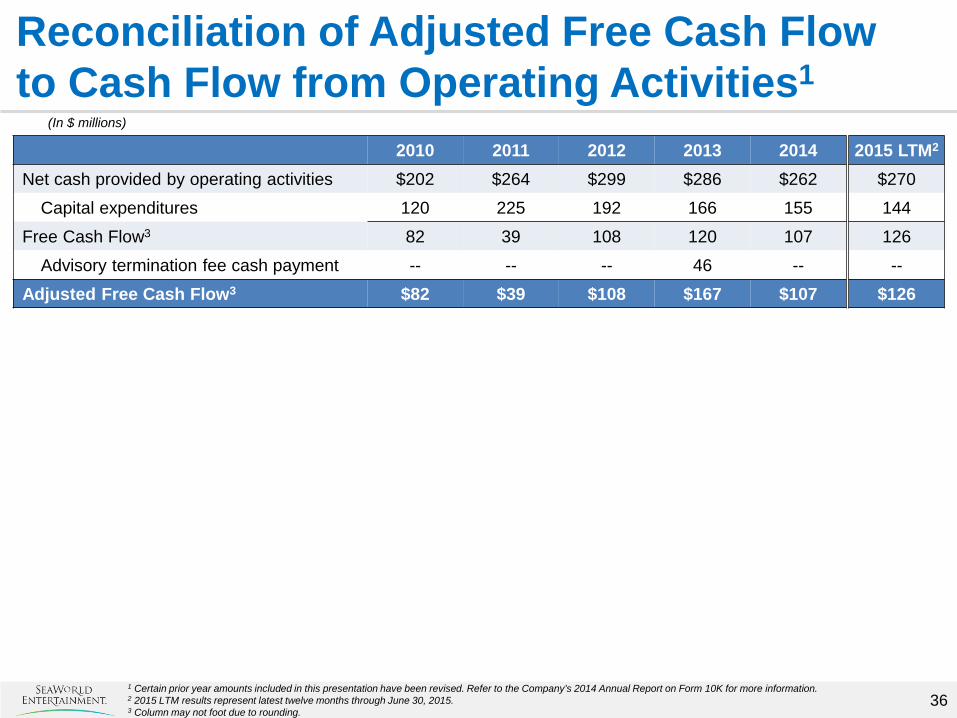
Reconciliation of Adjusted Free Cash Flow to Cash Flow from Operating Activities1
2010 2011 2012 2013 2014 2015 LTM2
Net cash provided by operating activities $202 $264 $299 $286 $262 $270
Capital expenditures 120 225 192 166 155 144
Free Cash Flow3 82 39 108 120 107 126
Advisory termination fee cash payment -- -- -- 46 -- --
Adjusted Free Cash Flow3 $82 $39 $108 $167 $107 $126
1 Certain prior year amounts included in this presentation have been revised. Refer to the Company’s 2014 Annual Report on Form 10K for more information. 2 2015 LTM results represent latest twelve months through June 30, 2015. 3 Column may not foot due to rounding.

Q2 2015 Investor Presentation
As of June 30, 2015