Q2 2015 Quarterly Earnings Call Presentation relations...Earnings Call Q2 2015 Presentation Safe...
21
Q2 2015 Quarterly Earnings Call Presentation August 13, 2015
Transcript of Q2 2015 Quarterly Earnings Call Presentation relations...Earnings Call Q2 2015 Presentation Safe...

Q2 2015 Quarterly Earnings Call
Presentation
August 13, 2015

Earnings Call Q2 2015 Presentation
Safe Harbor Statement
2
Certain statements and information included in this presentation constitute "forward-looking information" within the meaning of applicable Canadian securities legislation and "forward-looking statements" within the meaning of Section 27A of the Securities Act of 1933, as amended, and Section 21E of the Securities Exchange Act of 1934, as amended (collectively, "forward-looking statements"), which are made in reliance upon the protections provided by such legislation for forward-looking statements. All statements other than statements of historical facts included in this presentation, including statements regarding the update on the South Carolina Project, including the expected masking tape production transfer, the realization of ramp-up and savings, the expected Duplicate Overhead Costs for 2015 and to completion of masking tape transfer, the annualized expected cash savings and the timing, the Company's expected capital expenditures for 2015, the Company's expected manufacturing cost reductions for 2015, the Company's dividends, the Company's renewed normal course issuer bid and the Company's outlook, including the expected third quarter revenue, third quarter gross margin, and third quarter adjusted EBITDA, may constitute forward-looking statements. These forward-looking statements are based on current beliefs, assumptions, expectations, estimates, forecasts and projections made by the Company's management. Words such as "may," "will," "should," "expect," "continue," "intend," "estimate," "anticipate," "plan," "foresee," "believe," or "seek" or the negatives of these terms or variations of them or similar terminology are intended to identify such forward-looking statements. Although the Company believes that the expectations reflected in these forward-looking statements are reasonable, these statements, by their nature, involve risks and uncertainties and are not guarantees of future performance. Such statements are also subject to assumptions concerning, among other things: business conditions and growth or declines in the Company's industry, the Company's customers' industries and the general economy; the anticipated benefits from the Company's manufacturing facility closures and other restructuring efforts; the quality, and market reception, of the Company's products; the Company's anticipated business strategies; risks and costs inherent in litigation; the Company’s ability to maintain and improve quality and customer service; anticipated trends in the Company's business; anticipated cash flows from the Company’s operations; availability of funds under the Company’s Credit Facility; and the Company's ability to continue to control costs. The Company can give no assurance that these statements and expectations will prove to have been correct. Actual outcomes and results may, and often do, differ from what is expressed, implied or projected in such forward-looking statements, and such differences may be material. You are cautioned not to place undue reliance on any forward-looking statement.
For additional information regarding important factors that could cause actual results to differ materially from those expressed in these forward-looking statements and other risks and uncertainties, and the assumptions underlying the forward-looking statements, you are encouraged to read "Item 3. Key Information - Risk Factors," "Item 5. Operating and Financial Review and Prospects (Management's Discussion & Analysis)" and statements located elsewhere in the Company's annual report on Form 20-F for the year ended December 31, 2014 and the other statements and factors contained in the Company's filings with the Canadian securities regulators and the US Securities and Exchange Commission. Each of these forward-looking statements speaks only as of the date of this presentation. The Company will not update these statements unless applicable securities laws require it to do so.
This presentation contains certain non-GAAP financial measures as defined under applicable securities legislation, including Adjusted EBITDA, Adjusted EBITDA as a Percentage of Revenue, Adjusted Net Earnings, Adjusted Earnings per Share, Free Cash Flow, and Debt to Trailing Twelve Month (“TTM”) Adjusted EBITDA. The Company believes such non-GAAP financial measures improve the transparency of the Company’s disclosures, and improves the period-to-period comparability of the Company’s results from its core business operations. As required by applicable securities legislation, the Company has provided definitions of these non-GAAP measures contained in this presentation, as well as a reconciliation of each of them to the most directly comparable GAAP measure, on its website at http://www.intertapepolymer.com under “Investor Relations” and “Events and Presentations” and “Investor Presentations”. You are encouraged to review the related GAAP financial measures and the reconciliation of non-GAAP measures to their most directly comparable GAAP measures set forth on the website and should consider non-GAAP measures only as a supplement to, not as a substitute for or as a superior measure to, measures of financial performance prepared in accordance with GAAP.

Earnings Call Q2 2015 Presentation
• Revenue of $196.6M, an increase of 4.0%– Sales volume increased 5% - return to more normal levels of demand– Additional revenue of $4.3M due to the Better Packages acquisition– Revenue reduction of $4.9M attributed to the commissioning of the South Carolina
Project– Average selling price, including the impact of product mix, decreased 1%
• Gross margin increased to 21.6% from 19.6%– Increase in the spread between selling prices and lower raw material costs, a decrease
in South Carolina Duplicate Overhead Costs– Favourable product mix– Partially offset by South Carolina ramp-up inefficiencies
• Net Earnings of $11.7M, a decrease of less than $0.1 million• Adjusted EBITDA of $27.1M, an increase of 15.1%
– Higher gross profit partially offset by increases in variable compensation expenses and SG&A from the Better Packages acquisition
Q2 2015 vs Q1 2015 Highlights
3
Earnings Call Q2 2015 Presentation
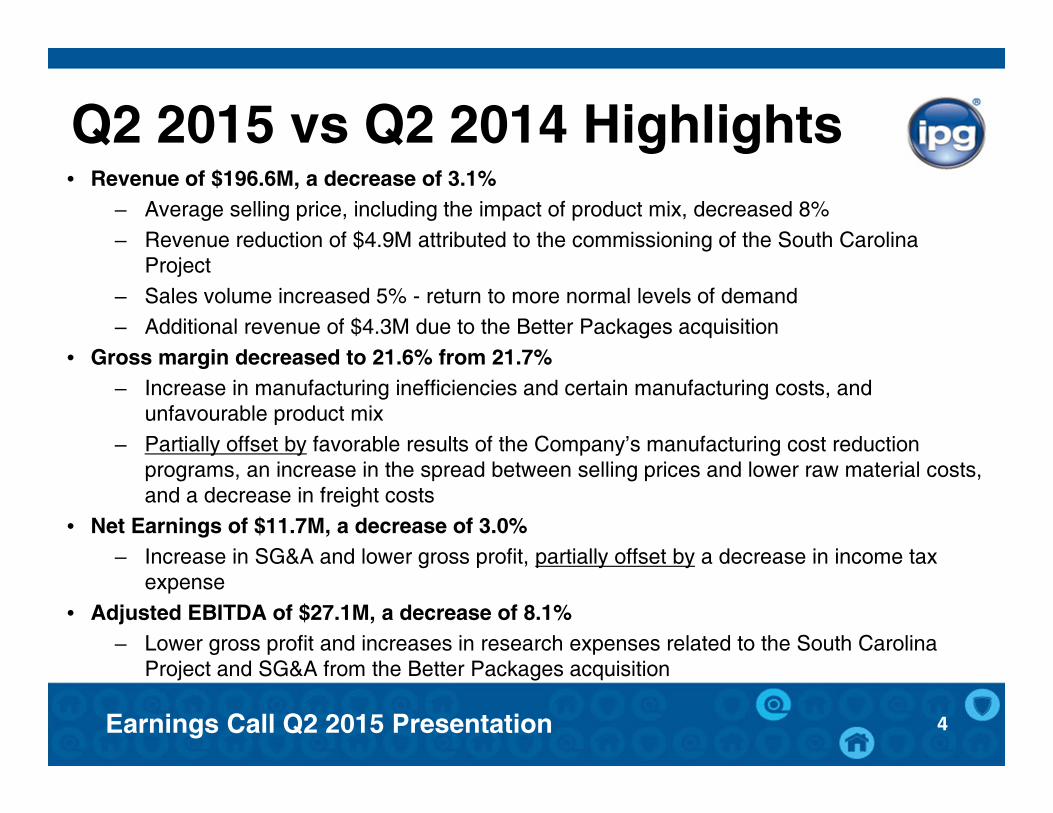
• Revenue of $196.6M, a decrease of 3.1%– Average selling price, including the impact of product mix, decreased 8%– Revenue reduction of $4.9M attributed to the commissioning of the South Carolina
Project– Sales volume increased 5% - return to more normal levels of demand– Additional revenue of $4.3M due to the Better Packages acquisition
• Gross margin decreased to 21.6% from 21.7%– Increase in manufacturing inefficiencies and certain manufacturing costs, and
unfavourable product mix– Partially offset by favorable results of the Company’s manufacturing cost reduction
programs, an increase in the spread between selling prices and lower raw material costs, and a decrease in freight costs
• Net Earnings of $11.7M, a decrease of 3.0%– Increase in SG&A and lower gross profit, partially offset by a decrease in income tax
expense• Adjusted EBITDA of $27.1M, a decrease of 8.1%
– Lower gross profit and increases in research expenses related to the South Carolina Project and SG&A from the Better Packages acquisition
Q2 2015 vs Q2 2014 Highlights
4

Earnings Call Q2 2015 Presentation
• Revenue of $385.6M, a decrease of 4.3%– Average selling price, including the impact of product mix, decreased 6%– Revenue reduction of $4.9M attributed to the commissioning of the South Carolina
Project– Sales volume increased 2% - increased demand for tape and woven products – Additional revenue of $4.3M due to the Better Packages acquisition
• Gross margin decreased to 20.6% from 21.5%– Increase in manufacturing inefficiencies and certain manufacturing costs – Unfavourable product mix and South Carolina Duplicate Overhead Costs – Partially offset by favorable results of the Company’s manufacturing cost reduction
programs, an increase in the spread between selling prices and lower raw material costs and a decrease in freight costs
• Net Earnings of $23.5M, a decrease of 1.0%– Decrease in gross profit and increase in SG&A, partially offset by a decreases in income
tax expense, manufacturing facility closures, restructuring and other related charges, and foreign exchange losses
• Adjusted EBITDA of $50.6M, a decrease of 9.8% – Lower gross profit partially offset by a decrease in variable compensation expense
Q2 YTD 2015 Highlights(as compared to Q2 YTD 2014)
5
Earnings Call Q2 2015 Presentation
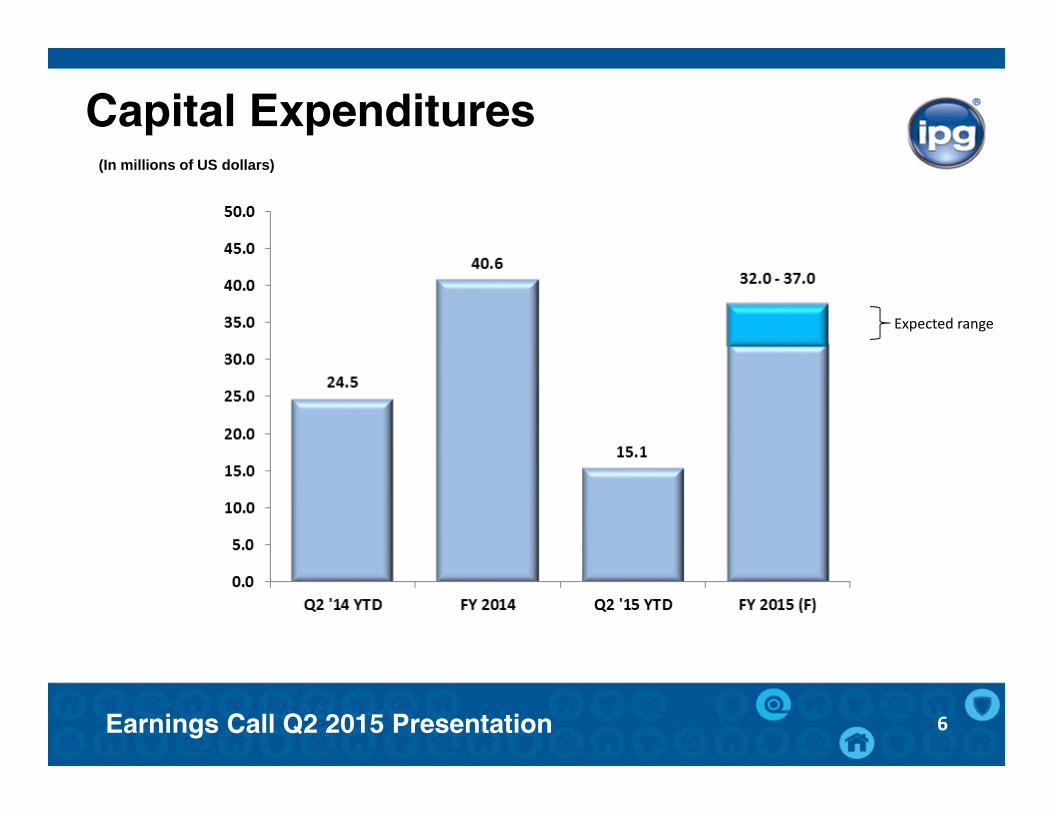
Capital Expenditures
6
(In millions of US dollars)
Expected range

Earnings Call Q2 2015 Presentation
Manufacturing Cost Reductions (1)
7
(1) Approximate values. Cost reductions are calculated by comparing the cost of a manufacturing process before and after implementing an improvement. The savings are reported for a period of 12 months upon implementation of the initiative.
(In millions of US dollars)
Expected range

Earnings Call Q2 2015 Presentation
Other Significant Items
8
• Better Packages Acquisition on April 7, 2015– Purchase price $16.0M cash, subject to working capital adjustment, – Expected annualized revenue of approximately $18M and EBITDA margin of over 15%– $4.3M revenue recognized in second quarter 2015
• Share Repurchases under Normal Course Issuer Bid – Repurchased 1,564,588 common shares for a total purchase price of $21.3 million
through July 9, 2015– Renewed effective July 10, 2015 through July 9, 2016; can repurchase up to 2 million
shares
• Dividends– Dividend of $0.12 per common share paid on March 31 and June 30, 2015– Increased the annualized dividend by approximately 8% from $0.48 to $0.52 per share– Declared a dividend of $0.13 per common share payable on September 30, 2015 to
shareholders of record at the close of business on September 15, 2015

Earnings Call Q2 2015 Presentation
Revenue Analysis
9
(In millions of US dollars)
(1) Reduction in revenue attributed to sales generated while the Company was in the process of commissioning the duct production line and therefore was accounted for as a reduction of revenue and a reduction of the cost of the South Carolina Project. However, the impact on gross profit and capital expenditures was minimal due to the requirement to offset this revenuewith the associated cost of sales in the reclassification of the gross profit as a reduction of the capital expenditures.

Earnings Call Q2 2015 Presentation
Summary Q2 2015 Results
10
Earnings Call Q2 2015 Presentation
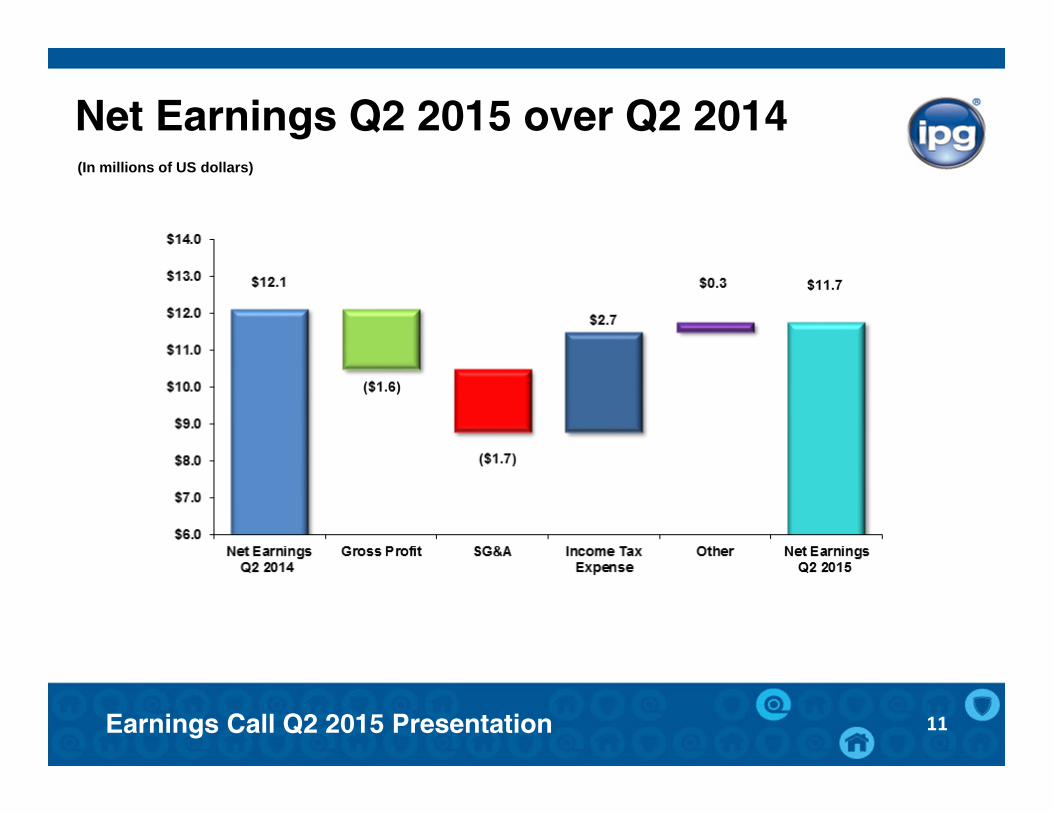
Net Earnings Q2 2015 over Q2 2014
11
(In millions of US dollars)

Earnings Call Q2 2015 Presentation
Adjusted EBITDA Q2 2015 over Q2 2014
12
(In millions of US dollars)
Earnings Call Q2 2015 Presentation
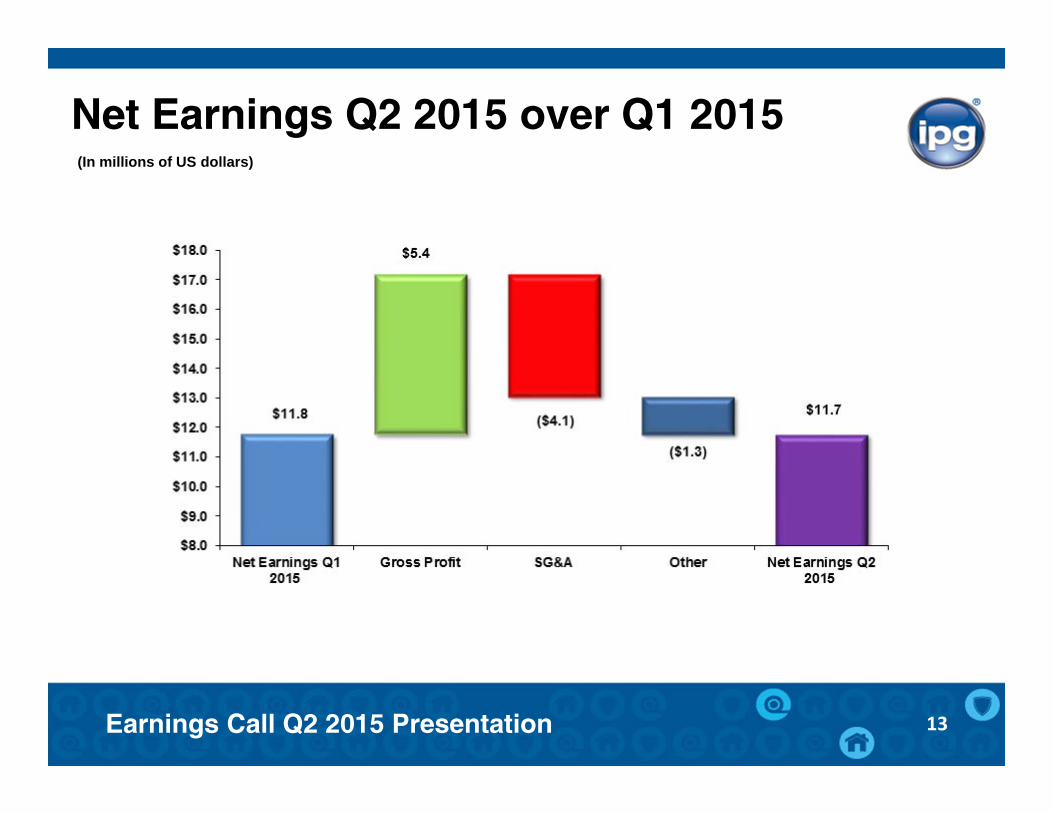
Net Earnings Q2 2015 over Q1 2015
13
(In millions of US dollars)

Earnings Call Q2 2015 Presentation
Adjusted EBITDA Q2 2015 over Q1 2015
14
(In millions of US dollars)

Earnings Call Q2 2015 Presentation
Net Earnings Q2 YTD 2015 over Q2 YTD 2014
15
(In millions of US dollars)

Earnings Call Q2 2015 Presentation
Adjusted EBITDA Q2 YTD 2015 over Q2 YTD 2014
16
(In millions of US dollars)

Earnings Call Q2 2015 Presentation
Summary Q2 2015 Results
17

Earnings Call Q2 2015 Presentation
Update on South Carolina Project
18
• Transferred production of flatback and duct tape • Experienced ramp-up inefficiencies in duct tape production (yield and
operating inefficiencies) – improvements already being achieved• Masking tape production transfer now delayed to the end of Q2 2016• Overall expectation of more gradual realization of ramp-up and savings
Actual Project Results Q2 2015 Q2 YTD2015
Net ramp‐up inefficiency costs (ie, net of cost savings)
$1.3M $1.3M
South Carolina Duplicate Overhead Costs
$0.8M $3.0M
South Carolina Project Capital Expenditures
$0.8M $4.1M

Earnings Call Q2 2015 Presentation
Update on South Carolina Project (continued)
19
Actual Net Savings Impact on Gross Profit & Adjusted EBITDA
Q2 2015 Net negative impact $1.3M
Net Savings Outlook Impact on Gross Profit & Adjusted EBITDA
Second Half 2015 Net negative impact but improved vs Q2 2015
Full year 2015 Net negative impact
2016 Net positive impact with significant improvement vs. 2015
2017 Full $13 million savings with significant improvement vs. 2016
Additional Project Items ‐ Outlook
South Carolina Duplicate Overhead Costs Full Year 2015 ~$5M
South Carolina Duplicate Overhead Costs to Completion of Masking Tape Transfer ~$1M per quarter
South Carolina Project Capital Expenditures – Total Project ~$55M
Other
Expected Manufacturing Cost Reductions Full Year 2015 $9M ‐ $12M
Expected Gross Margin (assuming raw material costs at current levels) 22%‐24% prior to completion of SouthCarolina Project

Earnings Call Q2 2015 Presentation
Q3 2015 Outlook
20
• The Company anticipates revenue for Q3 2015 to be higher compared to revenue for Q2 2015 primarily due to seasonally higher sales volume.
• Gross margin for Q3 2015 is anticipated to be lower compared to Q2 2015 primarily due to planned annual maintenance shutdowns at many of the manufacturing facilities.
• Adjusted EBITDA for Q3 2015 is anticipated to be similar to Q2 2015.

Earnings Call Q2 2015 Presentation 21
Industrial Packaging
Marine & Composites
Building & ConstructionHVAC
Geo Membrane AerospaceStructured FabricsAutomotive Aftermarket