Q2 2012 results presentation conf call
30
AGNICO-EAGLE MINES LIMITED Second Quarter 2012 Results July 2012
-
Upload
agnico-eagle-mines -
Category
Investor Relations
-
view
32.438 -
download
3
Transcript of Q2 2012 results presentation conf call
AGNICO-EAGLE MINES LIMITED
Second Quarter 2012 ResultsJuly 2012
Forward Looking Statements
2
The information in this document has been prepared as at July 26, 2012. Certain statements contained in this document constitute “forward-looking statements” within the meaning of the United States Private Securities Litigation Reform Act of 1995 and forward looking information under the provisions of Canadian provincial securities laws. When used in this document, the words “anticipate”, “expect”, “estimate”, “forecast”, “will”, “planned”, and similar expressions are intended to identify forward-looking statements or information.
Such statements include without limitation: statements regarding timing and amounts of capital expenditures and other assumptions; estimates of future reserves, resources, mineral production, optimization efforts and sales; estimates of mine life; estimates of future internal rates of return, mining costs, cash costs, minesite costs and other expenses; estimates of future capital expenditures and other cash needs, and expectations as to the funding thereof; statements and information as to the projected development of certain ore deposits, including estimates of exploration, development and production and other capital costs, and estimates of the timing of such exploration, development and production or decisions with respect to such exploration, development and production; estimates of reserves and resources, and statements and information regarding anticipated future exploration; the anticipated timing of events with respect to the Company's mine sites and statements and information regarding the sufficiency of the Company's cash resources. Such statements and information reflect the Company's views as at the date of this document and are subject to certain risks, uncertainties and assumptions, and undue reliance should not be placed on such statements and information. Many factors, known and unknown could cause the actual results to be materially different from those expressed or implied by such forward looking statements and information. Such risks include, but are not limited to: the volatility of prices of gold and other metals; uncertainty of mineral reserves, mineral resources, mineral grades and mineral recovery estimates; uncertainty of future production, capital expenditures, and other costs; currency fluctuations; financing of additional capital requirements; cost of exploration and development programs; mining risks; community protests; risks associated with foreign operations; governmental and environmental regulation; the volatility of the Company's stock price; and risks associated with the Company's byproduct metal derivative strategies. For a more detailed discussion of such risks and other factors that may affect the Company’s ability to achieve the expectations set forth in the forward-looking statements contained in this document, see the Company's Annual Report on Form 20-F for the year ended December 31, 2011, as well as the Company's other filings with the Canadian Securities Administrators and the U.S. Securities and Exchange Commission. The Company does not intend, and does not assume any obligation, to update these forward-looking statements and information. Marc Legault, a Qualified Person and the Company’s Senior Vice-President, Project Evaluations, reviewed the technical information disclosed herein. For a detailed breakdown of the Company’s reserve and resource position see the February 15, 2012 press release on the Company’s website. That press release also lists the Qualified Persons for each project.
Notes To Investors
Note Regarding The Use Of Non-GAAP Financial Measures
This document presents estimates of future "total cash cost per ounce" and "minesite cost per tonne" that are not recognized measures under United States generally accepted accounting principles ("US GAAP"). This data may not be comparable to data presented by other gold producers. These future estimates are based upon the total cash costs per ounce and minesite costs per tonne that the Company expects to incur to mine gold at the applicable projects and do not include production costs attributable to accretion expense and other asset retirement costs, which will vary over time as each project is developed and mined. It is therefore not practicable to reconcile these forward-looking non-GAAP financial measures to the most comparable GAAP measure. A reconciliation of the Company's total cash cost per ounce and minesite cost per tonne to the most comparable financial measures calculated and presented in accordance with US GAAP for the Company's historical results of operations is set forth in the notes to the financial statements included in the Company's Annual Information Form and Annual Report on Form 20-F, for the year ended December 31, 2011, as well as the Company's other filings with the Canadian Securities Administrators and the SEC.
Note Regarding Production Guidance The gold production guidance is based on the Company’s mineral reserves but includes contingencies and assumes metal prices and foreign exchange rates that are different from those used in the reserve estimates. These factors and others mean that the gold production guidance presented in this disclosure does not reconcile exactly with the production models used to support these mineral reserves.
3
Agnico-Eagle Mines LimitedStrong Cash Generation With Measured, Focused Growth and Attractive Dividend Yield
Portfolio of quality, long-life mines that continue to perform well
Low risk production growth from existing assets
Significant exploration upside and reserve growth demonstrated at existing 100%-owned assets
Political risk profile expected to remain low
Strong cash flow funds dividend, exploration, capital reinvestment programs and enhances financial position
4
Q2 2012 Operating Highlights
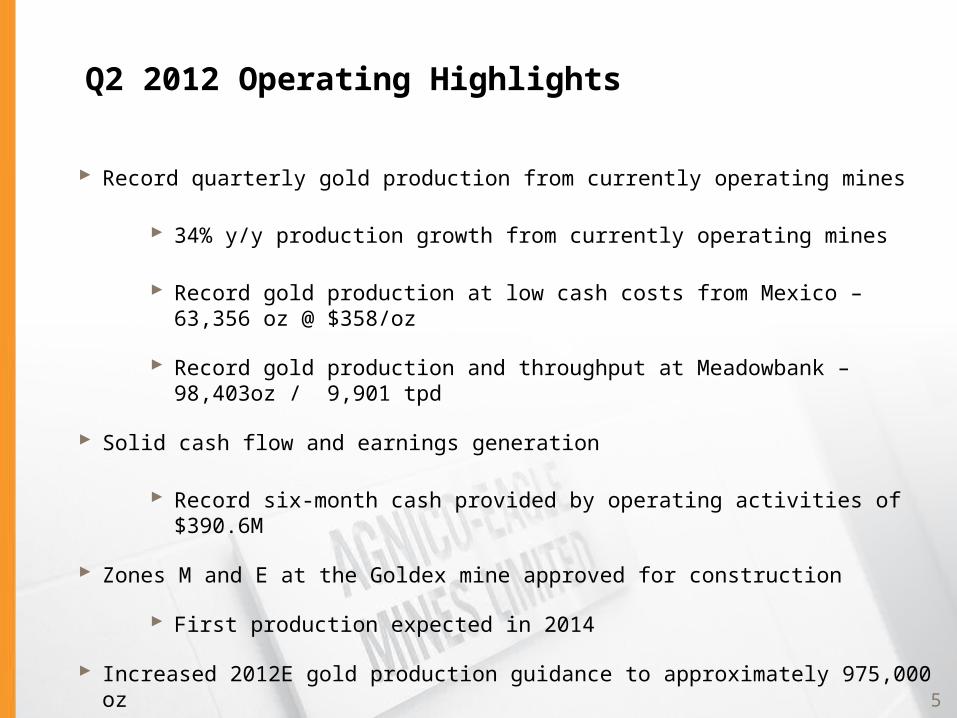
Record quarterly gold production from currently operating mines
34% y/y production growth from currently operating mines
Record gold production at low cash costs from Mexico – 63,356 oz @ $358/oz
Record gold production and throughput at Meadowbank – 98,403oz / 9,901 tpd
Solid cash flow and earnings generation
Record six-month cash provided by operating activities of $390.6M
Zones M and E at the Goldex mine approved for construction
First production expected in 2014
Increased 2012E gold production guidance to approximately 975,000 oz
5
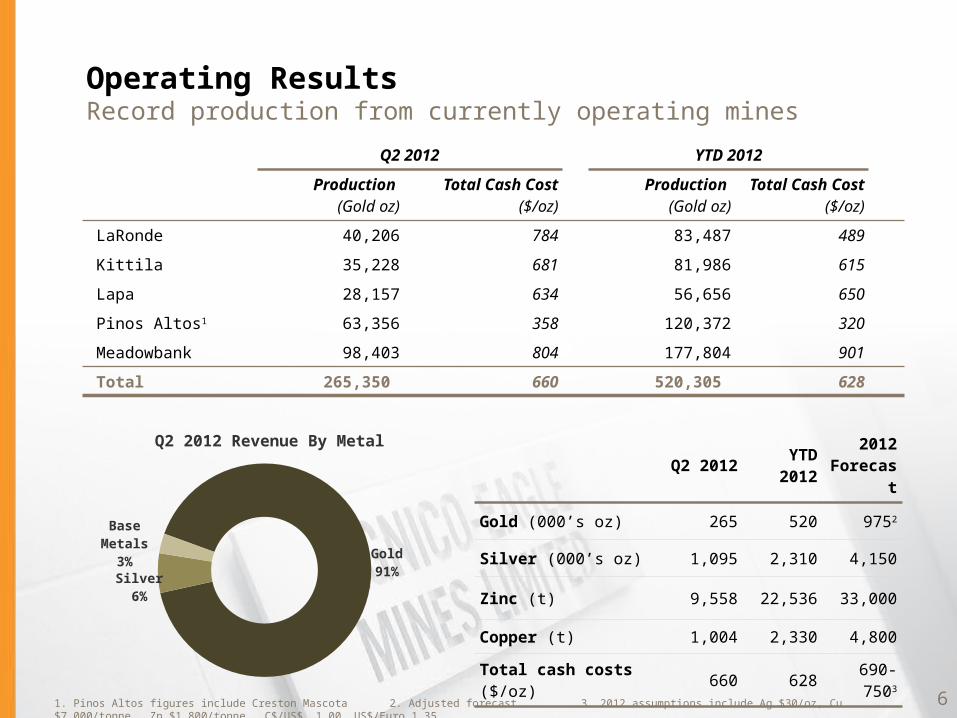
Operating ResultsRecord production from currently operating mines
Q2 2012 YTD 2012
Production (Gold oz)
Total Cash Cost ($/oz)
Production (Gold oz)
Total Cash Cost ($/oz)
LaRonde 40,206 784 83,487 489
Kittila 35,228 681 81,986 615
Lapa 28,157 634 56,656 650
Pinos Altos1 63,356 358 120,372 320
Meadowbank 98,403 804 177,804 901
Total 265,350 660 520,305 628
1. Pinos Altos figures include Creston Mascota 2. Adjusted forecast 3. 2012 assumptions include Ag $30/oz, Cu $7,000/tonne, Zn $1,800/tonne, C$/US$ 1.00, US$/Euro 1.35
6
Q2 2012YTD 2012
2012 Forecast
Gold (000’s oz) 265 520 9752
Silver (000’s oz) 1,095 2,310 4,150
Zinc (t) 9,558 22,536 33,000
Copper (t) 1,004 2,330 4,800
Total cash costs ($/oz) 660 628 690-7503
Gold91%
Silver6%
Base Metals3%
Q2 2012 Revenue By Metal

Financial ResultsStrong earnings and cash flow
7
Q2 2012 Q2 2011 YTD 2012 YTD 2011 H1 Y/Y Change
Gold (ounces in thousands)
265 239 520 492 6%
Revenues frommining operations (millions)
$460 $434 $932 $846 10%
Net income (millions)
$43 $69 $122 $114 7%
Net income per share (basic)
$0.25 $0.41 $0.71 $0.68 4%
Cash provided by operating activities (millions)
$194 $163 $391 $338 16%
*All $ amounts are in US$
Laronde19%
Lapa11%
Kittila16%
Pinos Altos30%
Mead-owbank
24%
YTD 2012 Total Operating Margin - $498M
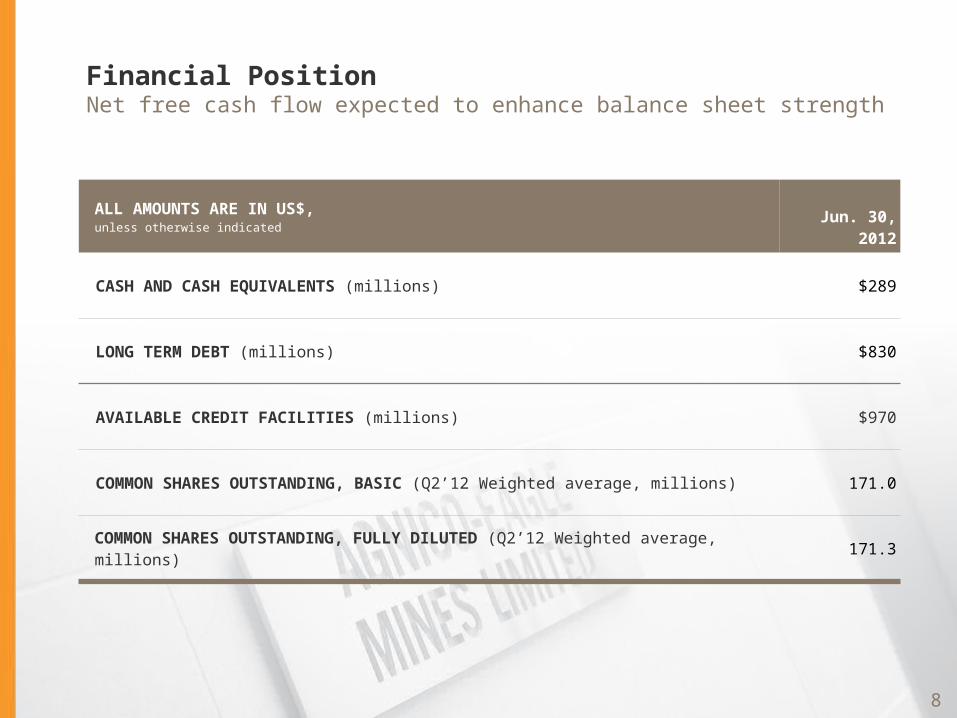
Financial PositionNet free cash flow expected to enhance balance sheet strength
8
ALL AMOUNTS ARE IN US$, unless otherwise indicated Jun. 30, 2012
CASH AND CASH EQUIVALENTS (millions) $289
LONG TERM DEBT (millions) $830
AVAILABLE CREDIT FACILITIES (millions) $970
COMMON SHARES OUTSTANDING, BASIC (Q2’12 Weighted average, millions) 171.0
COMMON SHARES OUTSTANDING, FULLY DILUTED (Q2’12 Weighted average, millions) 171.3
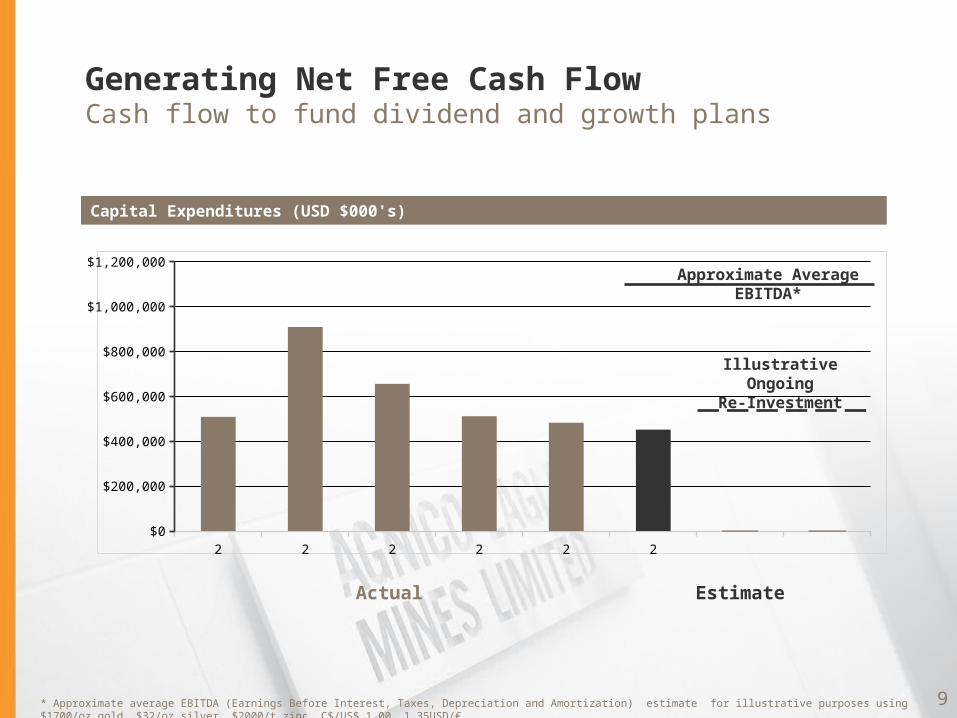
Generating Net Free Cash Flow Cash flow to fund dividend and growth plans
2007A 2008A 2009A 2010A 2011A 2012E 2013 2014$0
$200,000
$400,000
$600,000
$800,000
$1,000,000
$1,200,000
Actual Estimate
Approximate Average EBITDA*
* Approximate average EBITDA (Earnings Before Interest, Taxes, Depreciation and Amortization) estimate for illustrative purposes using $1700/oz gold, $32/oz silver, $2000/t zinc, C$/US$ 1.00, 1.35USD/€
Capital Expenditures (USD $000's)
Illustrative OngoingRe-Investment
9
Operations and Projects
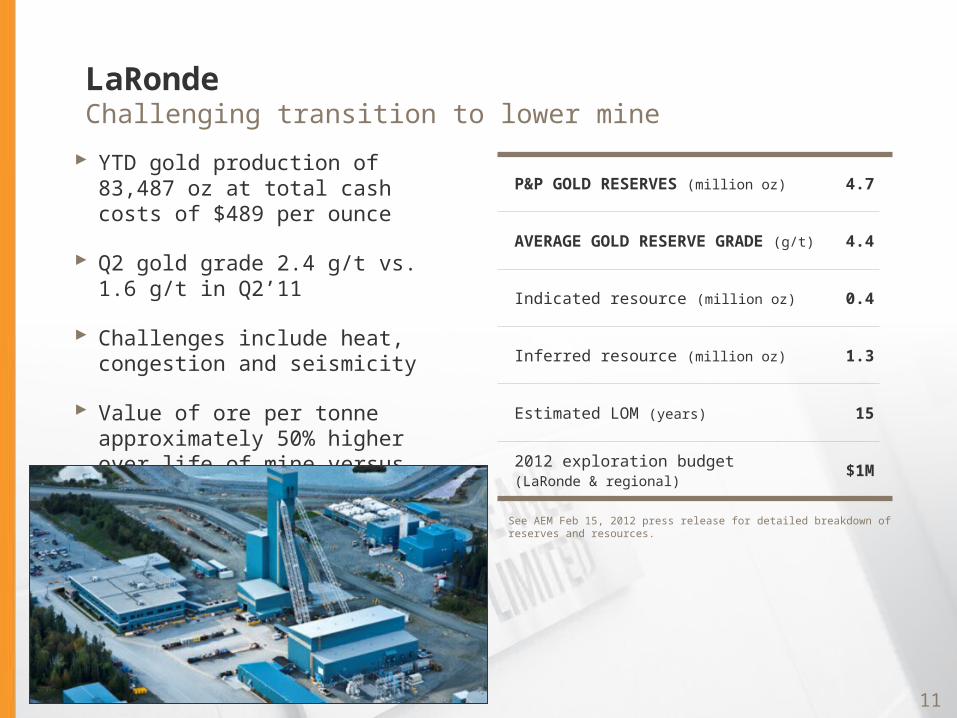
LaRonde Challenging transition to lower mine
YTD gold production of 83,487 oz at total cash costs of $489 per ounce
Q2 gold grade 2.4 g/t vs. 1.6 g/t in Q2’11
Challenges include heat, congestion and seismicity
Value of ore per tonne approximately 50% higher over life of mine versus 2011 at same metals prices
11
P&P GOLD RESERVES (million oz) 4.7
AVERAGE GOLD RESERVE GRADE (g/t) 4.4
Indicated resource (million oz) 0.4
Inferred resource (million oz) 1.3
Estimated LOM (years) 15
2012 exploration budget (LaRonde & regional)
$1M
See AEM Feb 15, 2012 press release for detailed breakdown of reserves and resources.
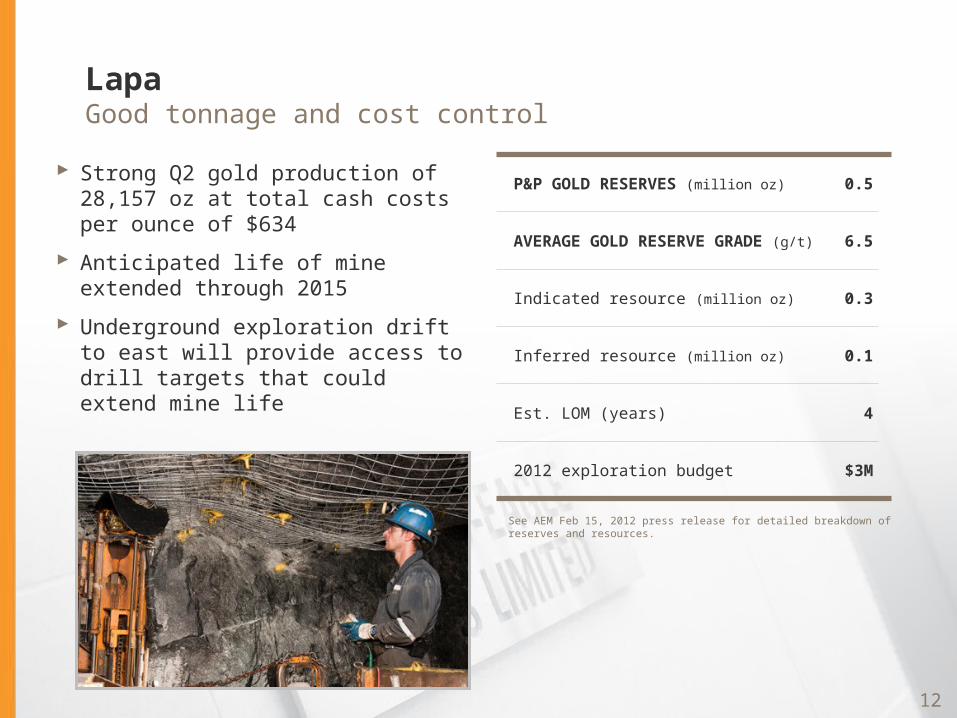
Lapa Good tonnage and cost control
Strong Q2 gold production of 28,157 oz at total cash costs per ounce of $634
Anticipated life of mine extended through 2015
Underground exploration drift to east will provide access to drill targets that could extend mine life
12
P&P GOLD RESERVES (million oz) 0.5
AVERAGE GOLD RESERVE GRADE (g/t) 6.5
Indicated resource (million oz) 0.3
Inferred resource (million oz) 0.1
Est. LOM (years) 4
2012 exploration budget $3M
See AEM Feb 15, 2012 press release for detailed breakdown of reserves and resources.
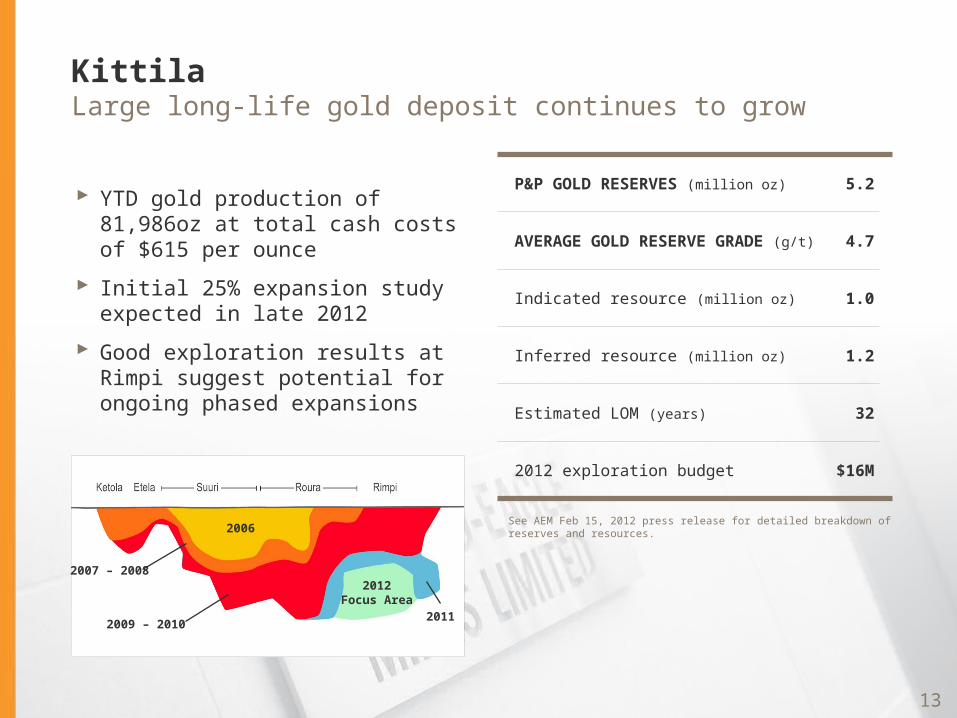
Kittila Large long-life gold deposit continues to grow
YTD gold production of 81,986oz at total cash costs of $615 per ounce
Initial 25% expansion study expected in late 2012
Good exploration results at Rimpi suggest potential for ongoing phased expansions
13
2007 – 2008
2006
2009 – 20102011
2012Focus Area
P&P GOLD RESERVES (million oz) 5.2
AVERAGE GOLD RESERVE GRADE (g/t) 4.7
Indicated resource (million oz) 1.0
Inferred resource (million oz) 1.2
Estimated LOM (years) 32
2012 exploration budget $16M
See AEM Feb 15, 2012 press release for detailed breakdown of reserves and resources.
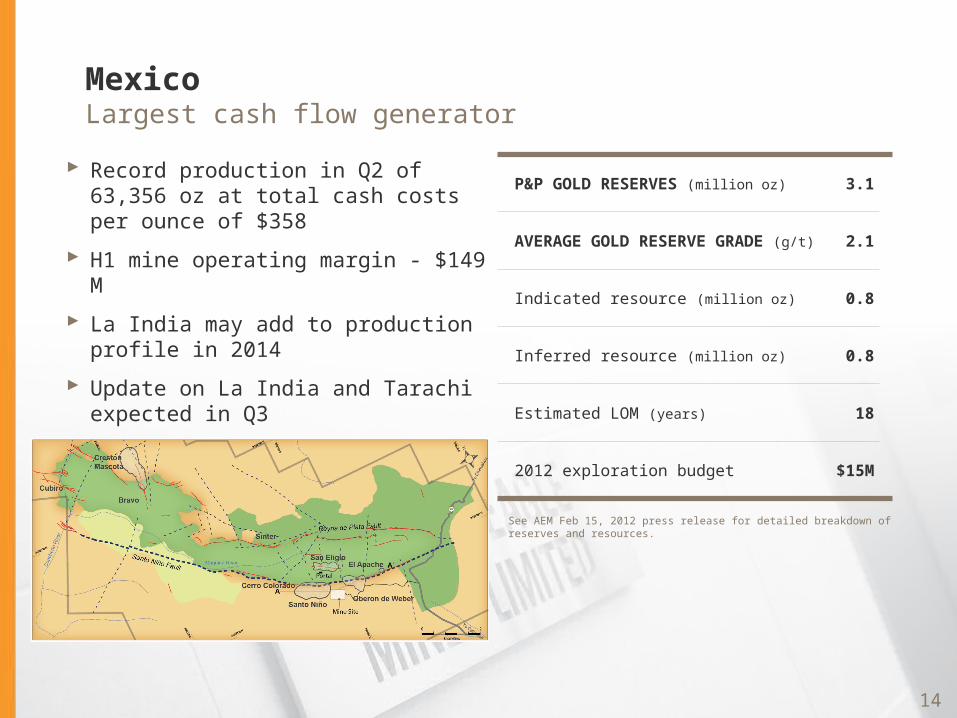
MexicoLargest cash flow generator
Record production in Q2 of 63,356 oz at total cash costs per ounce of $358
H1 mine operating margin - $149 M
La India may add to production profile in 2014
Update on La India and Tarachi expected in Q3
14
P&P GOLD RESERVES (million oz) 3.1
AVERAGE GOLD RESERVE GRADE (g/t) 2.1
Indicated resource (million oz) 0.8
Inferred resource (million oz) 0.8
Estimated LOM (years) 18
2012 exploration budget $15M
See AEM Feb 15, 2012 press release for detailed breakdown of reserves and resources.
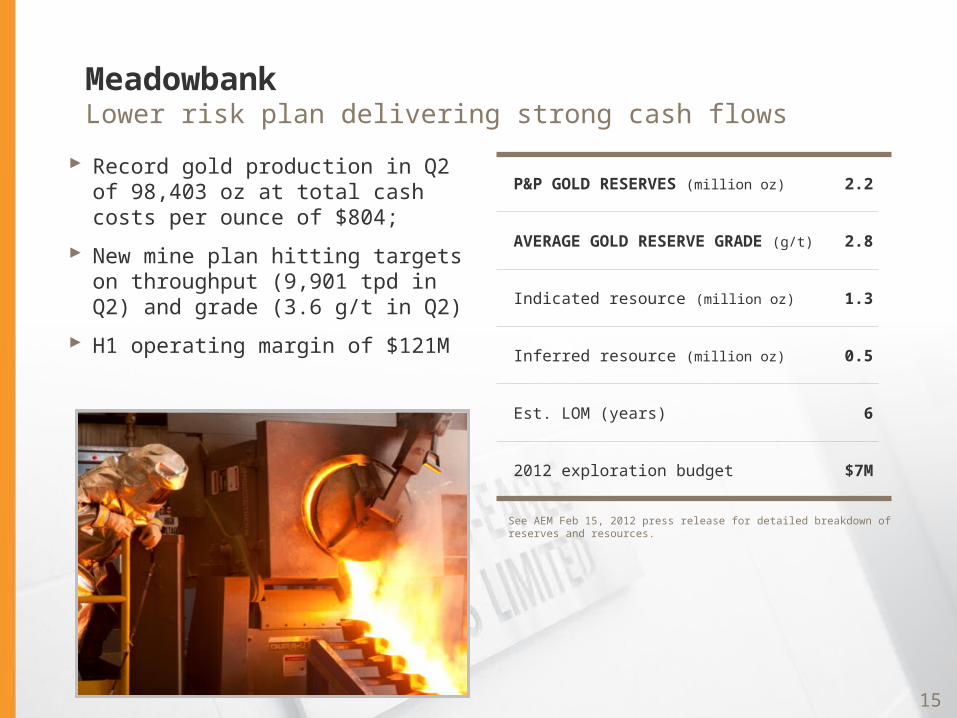
Meadowbank Lower risk plan delivering strong cash flows
Record gold production in Q2 of 98,403 oz at total cash costs per ounce of $804;
New mine plan hitting targets on throughput (9,901 tpd in Q2) and grade (3.6 g/t in Q2)
H1 operating margin of $121M
15
P&P GOLD RESERVES (million oz) 2.2
AVERAGE GOLD RESERVE GRADE (g/t) 2.8
Indicated resource (million oz) 1.3
Inferred resource (million oz) 0.5
Est. LOM (years) 6
2012 exploration budget $7M
See AEM Feb 15, 2012 press release for detailed breakdown of reserves and resources.
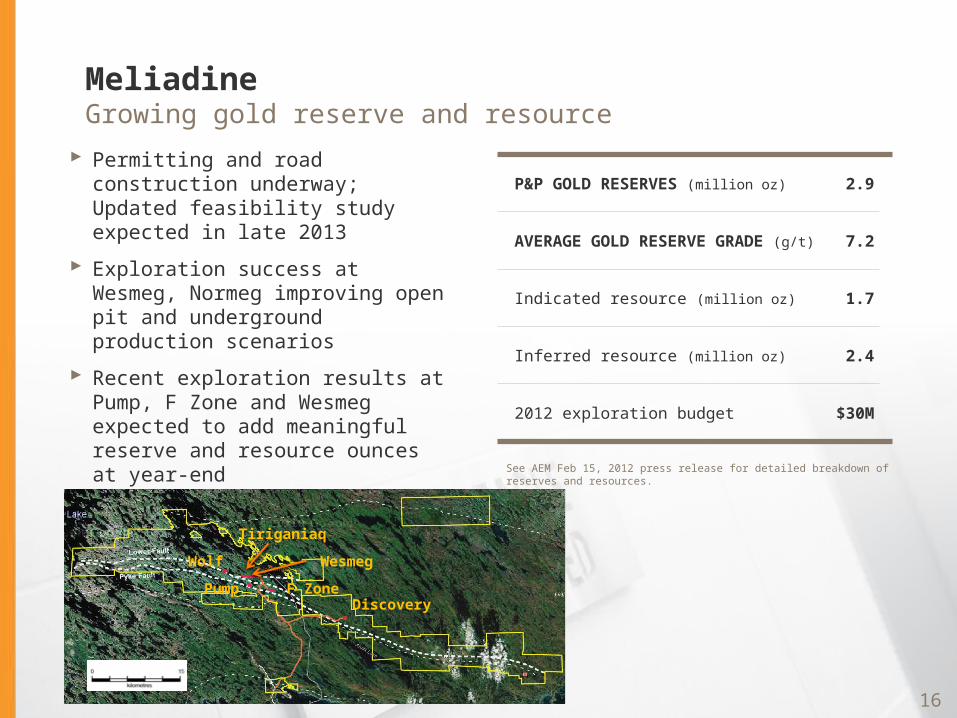
Meliadine Growing gold reserve and resource
Permitting and road construction underway; Updated feasibility study expected in late 2013
Exploration success at Wesmeg, Normeg improving open pit and underground production scenarios
Recent exploration results at Pump, F Zone and Wesmeg expected to add meaningful reserve and resource ounces at year-end
16
Wolf
Pump F Zone
Tiriganiaq
Wesmeg
Discovery
P&P GOLD RESERVES (million oz) 2.9
AVERAGE GOLD RESERVE GRADE (g/t) 7.2
Indicated resource (million oz) 1.7
Inferred resource (million oz) 2.4
2012 exploration budget $30M
See AEM Feb 15, 2012 press release for detailed breakdown of reserves and resources.
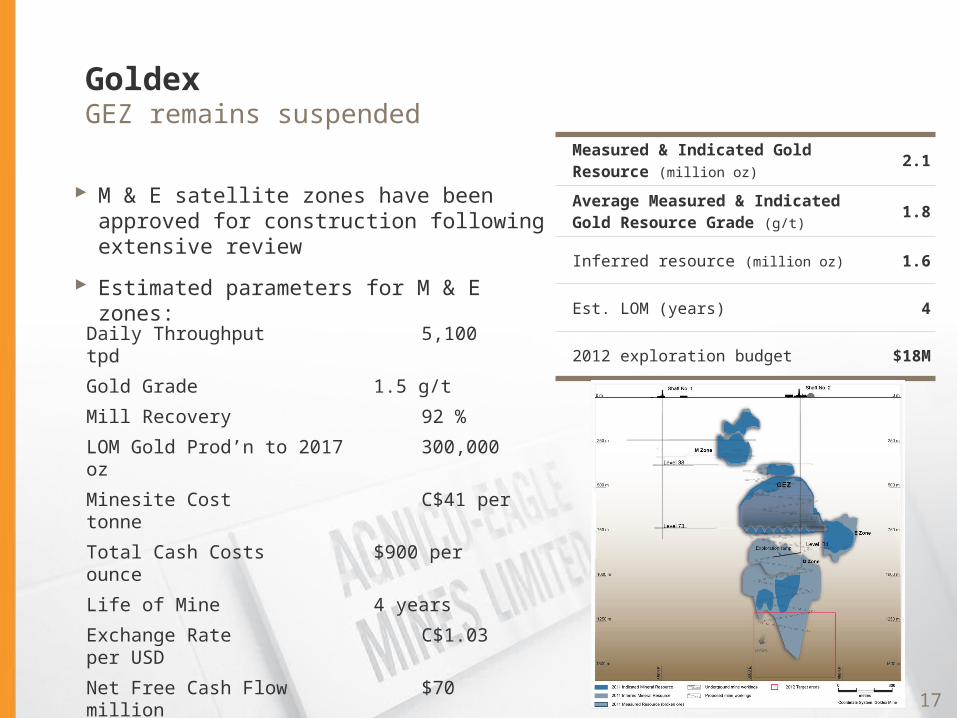
Goldex GEZ remains suspended
M & E satellite zones have been approved for construction following extensive review
Estimated parameters for M & E zones:
17
Measured & Indicated Gold Resource (million oz)
2.1
Average Measured & Indicated Gold Resource Grade (g/t)
1.8
Inferred resource (million oz) 1.6
Est. LOM (years) 4
2012 exploration budget $18MDaily Throughput
5,100 tpd
Gold Grade1.5 g/t
Mill Recovery92 %
LOM Gold Prod’n to 2017300,000 oz
Minesite Cost C$41 per tonne
Total Cash Costs $900 per ounce
Life of Mine4 years
Exchange RateC$1.03 per USD
Net Free Cash Flow $70 million
Exploration UpsideLarge, Growing Gold Deposits
18
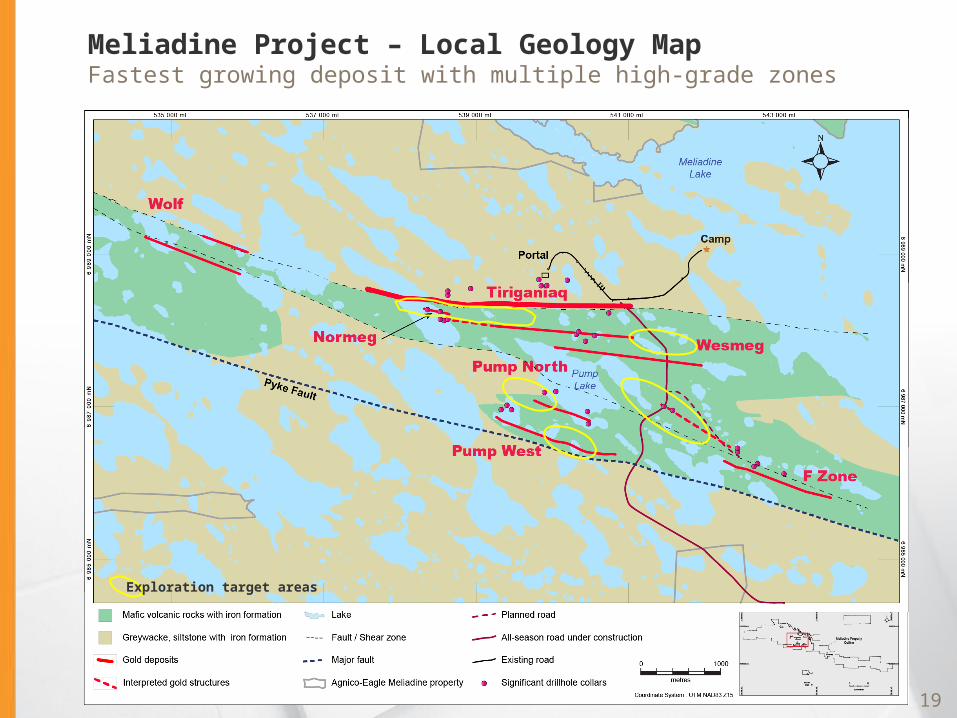
Meliadine Project – Local Geology MapFastest growing deposit with multiple high-grade zones
Exploration target areas
19
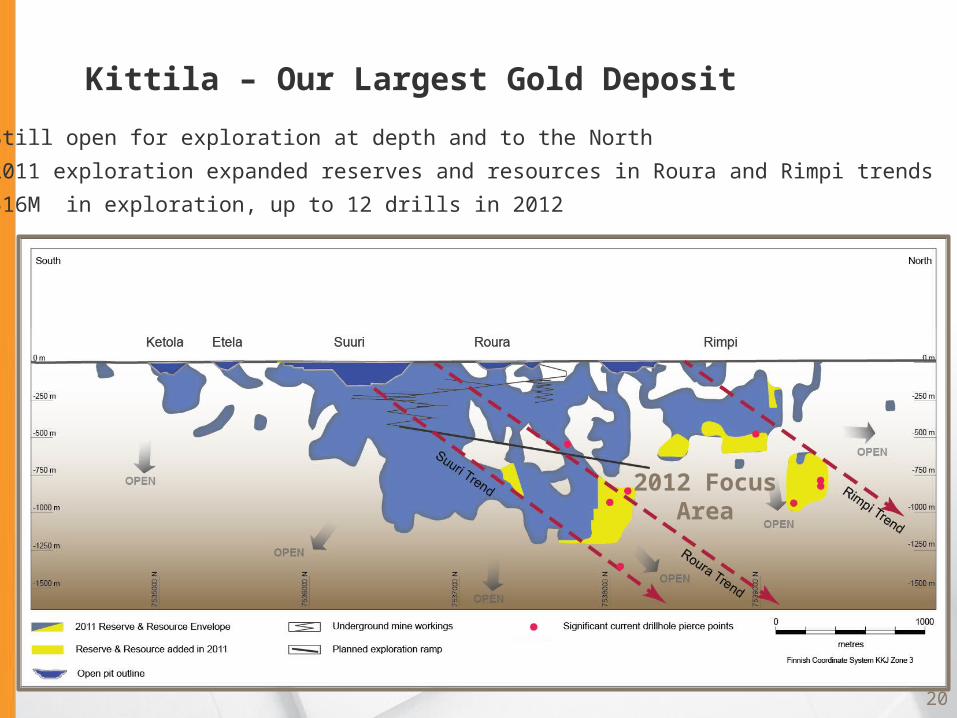
Kittila – Our Largest Gold Deposit
2012 Focus Area
Still open for exploration at depth and to the North
2011 exploration expanded reserves and resources in Roura and Rimpi trends
$16M in exploration, up to 12 drills in 2012
20
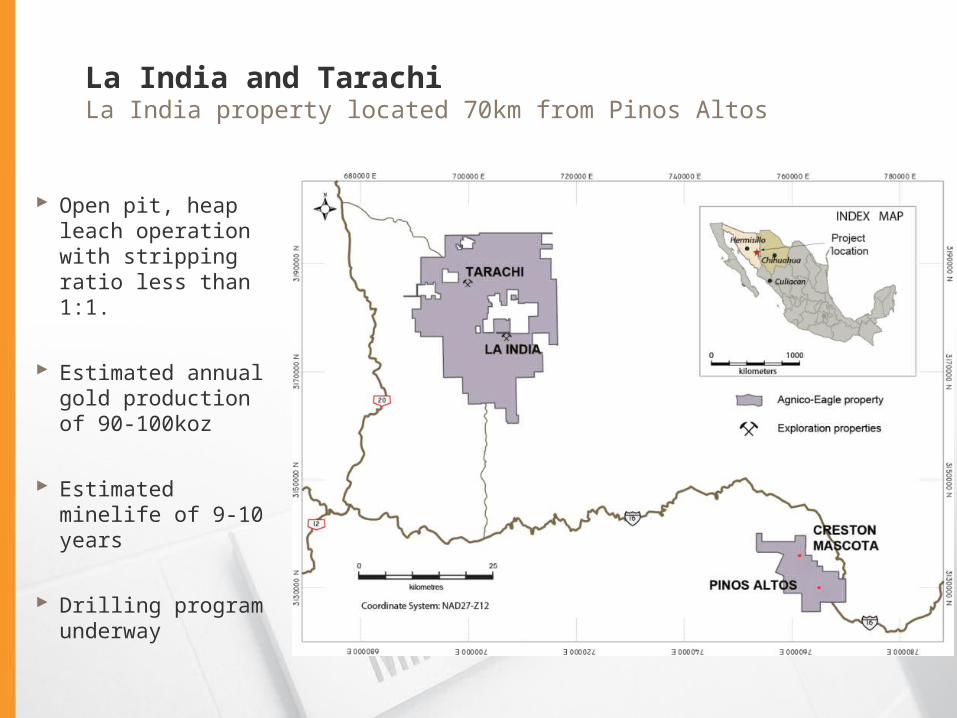
La India and TarachiLa India property located 70km from Pinos Altos
Open pit, heap leach operation with stripping ratio less than 1:1.
Estimated annual gold production of 90-100koz
Estimated minelife of 9-10 years
Drilling program underway

Sound Business Continues To Deliver No change in strategy or focus
AEM is among industry leaders in per share production, reserves, cash flows and dividends
Meaningful near-term production growth driven by LaRonde, La India and Goldex, with manageable, fully funded capex
Solid, achievable production and cost guidance
Expecting growth in reserves through exploration of existing assets
Business generating strong cash flows in regions of low political risk
Allocated to dividends, exploration and reinvesting in our core assets
22

Appendix
23

Operating Metrics
Q3 10 Q4 10 Q1 11 Q2 11 Q3 11 Q4 11 Q1 12 Q2 124,000tpd
4,500tpd
5,000tpd
5,500tpd
6,000tpd
6,500tpd
7,000tpd
7,500tpd
$0/t
$20/t
$40/t
$60/t
$80/t
$100/t
$120/t
$140/t
LaRonde - Ore milled ('000 tonnes)
LaRonde - Minesite costs per tonne (C$)
Q3 10
Q1 11
Q3 11
Q1 12
0tpd
2tpd
4tpd
6tpd
8tpd
10tpd
12tpd
$50/t
$70/t
$90/t
$110/t
$130/t
$150/t
$170/t
Lapa - Ore milled ('000 tonnes)
Lapa - Minesite costs per tonne (C$)Lapa
LaRonde
24
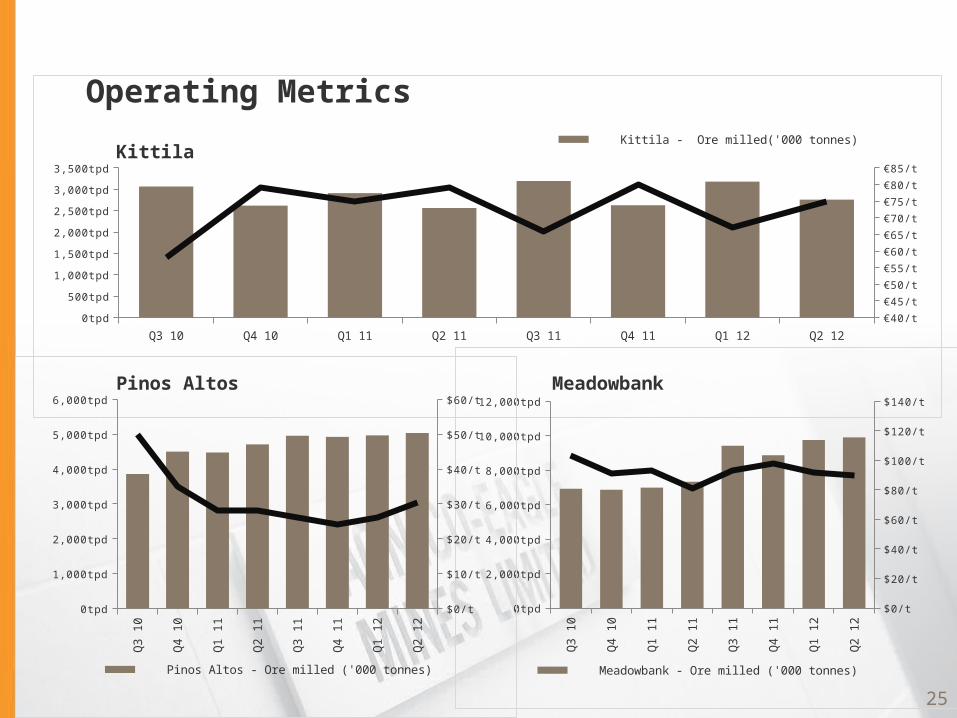
Operating Metrics
Q3 10 Q4 10 Q1 11 Q2 11 Q3 11 Q4 11 Q1 12 Q2 120tpd
500tpd
1,000tpd
1,500tpd
2,000tpd
2,500tpd
3,000tpd
3,500tpd
€40/t
€45/t
€50/t
€55/t
€60/t
€65/t
€70/t
€75/t
€80/t
€85/t
Kittila - Ore milled('000 tonnes) Kittila - Minesite costs per tonne (EUR)
Q3
10
Q4
10
Q1
11
Q2
11
Q3
11
Q4
11
Q1
12
Q2
12
0tpd
2,000tpd
4,000tpd
6,000tpd
8,000tpd
10,000tpd
12,000tpd
$0/t
$20/t
$40/t
$60/t
$80/t
$100/t
$120/t
$140/t
Meadowbank - Ore milled ('000 tonnes) Meadowbank - Minesite costs per tonne (C$)
Pinos Altos Meadowbank
Kittila
25
Q3
10
Q4
10
Q1
11
Q2
11
Q3
11
Q4
11
Q1
12
Q2
12
0tpd
1,000tpd
2,000tpd
3,000tpd
4,000tpd
5,000tpd
6,000tpd
$0/t
$10/t
$20/t
$30/t
$40/t
$50/t
$60/t
Pinos Altos - Ore milled ('000 tonnes) Pinos Altos - Minesite costs per tonne (USD$)

Gold and Silver Reserves and ResourcesDecember 31, 2011
Gold
Tonnes (000’s)
Gold (g/t)
Gold(ounces)
(000’s)
Proven 11,029 2.80 994
Probable 146,057 3.78 17,757
Total Reserves 157,086 3.71 18,750
Measured & Indicated 168,336 1.78 9,633
Inferred 131,216 2.30 9,712
Silver
Tonnes (000’s)
Silver (g/t)
Silver(ounces)
(000’s)
Proven 7,318 45.35 10,670
Probable 72,693 45.06 105,319
Total Reserves 80,011 45.09 115,989
Measured & Indicated 27,801 27.24 24,344
Inferred 34,513 19.00 21,082
See AEM Feb 15, 2012 press release for detailed breakdown of reserves and resources. Reserves are not a subset of resources.
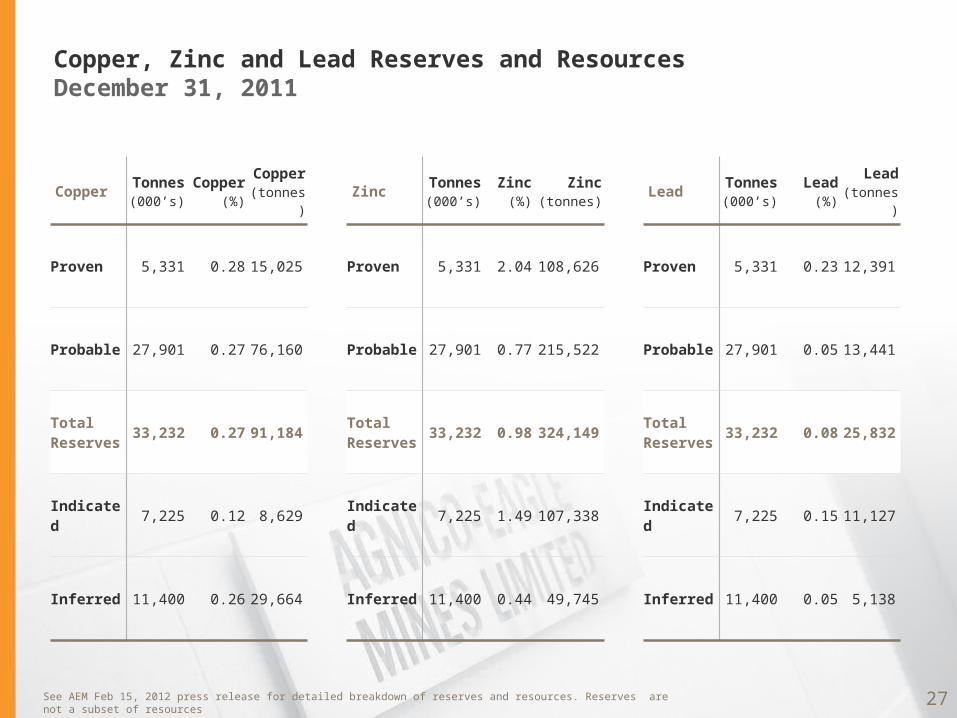
Copper, Zinc and Lead Reserves and ResourcesDecember 31, 2011
Copper Tonnes (000’s)
Copper(%)
Copper(tonnes)
Proven 5,331 0.28 15,025
Probable 27,901 0.27 76,160
Total Reserves 33,232 0.27 91,184
Indicated 7,225 0.12 8,629
Inferred 11,400 0.26 29,664
Zinc Tonnes (000’s)
Zinc(%)
Zinc(tonnes)
Proven 5,331 2.04 108,626
Probable 27,901 0.77 215,522
Total Reserves 33,232 0.98 324,149
Indicated 7,225 1.49 107,338
Inferred 11,400 0.44 49,745
Lead Tonnes (000’s)
Lead(%)
Lead(tonnes)
Proven 5,331 0.23 12,391
Probable 27,901 0.05 13,441
Total Reserves 33,232 0.08 25,832
Indicated 7,225 0.15 11,127
Inferred 11,400 0.05 5,138
27See AEM Feb 15, 2012 press release for detailed breakdown of reserves and resources. Reserves are not a subset of resources
Notes to Investors Regarding the Use of Resources
Cautionary Note to Investors Concerning Estimates of Measured and Indicated Resources This document uses the terms "measured resources" and "indicated resources". We advise investors that while those terms are recognized and required by Canadian regulations, the SEC does not recognize them. Investors are cautioned not to assume that any part or all of mineral deposits in these categories will ever be converted into reserves. Cautionary Note to Investors Concerning Estimates of Inferred Resources This document also uses the term "inferred resources". We advise investors that while this term is recognized and required by Canadian regulations, the SEC does not recognize it. "Inferred resources" have a great amount of uncertainty as to their existence, and great uncertainty as to their economic and legal feasibility. It cannot be assumed that all or any part of an inferred mineral resource will ever be upgraded to a higher category. Under Canadian rules, estimates of inferred mineral resources may not form the basis of feasibility or pre-feasibility studies, except in rare cases. Investors are cautioned not to assume that part or all of an inferred resource exists, or is economically or legally mineable. Scientific and Technical Data Agnico-Eagle Mines Limited is reporting mineral resource and reserve estimates in accordance with the CIM guidelines for the estimation, classification and reporting of resources and reserves. Cautionary Note To U.S. Investors - The SEC permits U.S. mining companies, in their filings with the SEC, to disclose only those mineral deposits that a company can economically and legally extract or produce. Agnico-Eagle uses certain terms in this press release, such as “measured”, “indicated”, and “inferred”, and “resources” that the SEC guidelines strictly prohibit U.S. registered companies from including in their filings with the SEC. U.S. investors are urged to consider closely the disclosure in our Form 20-F, which may be obtained from us, or from the SEC’s website at: http://sec.gov/edgar.shtml. A “final” or “bankable” feasibility study is required to meet the requirements to designate reserves under Industry Guide 7. Estimates for all properties were calculated using historic three-year average metals prices and foreign exchange rates in accordance with the SEC Industry Guide 7. Industry Guide 7 requires the use of prices that reflect current economic conditions at the time of reserve determination, which the Staff of the SEC has interpreted to mean historic three-year average prices. The assumptions used for the mineral reserves and resources estimates reported by the Company on February 15, 2012 were based on three-year average prices for the period ending December 31, 2011 of $1,255 per ounce gold, $23.00 per ounce silver, $0.91 per pound zinc, $3.25 per pound copper, $0.95 per pound lead and C$/US$, US$/Euro and MXP/US$ exchange rates of 1.05, 1.37 and 12.86, respectively. The Canadian Securities Administrators’ National Instrument 43-101 (“NI 43-101”) requires mining companies to disclose reserves and resources using the subcategories of “proven” reserves, “probable” reserves, “measured” resources, “indicated” resources and “inferred” resources. Mineral resources that are not mineral reserves do not have demonstrated economic viability.
28
Notes to Investors Regarding the Use of Resources
A mineral reserve is the economically mineable part of a measured or indicated mineral resource demonstrated by at least a preliminary feasibility study. This study must include adequate information on mining, processing, metallurgical, economic and other relevant factors that demonstrate, at the time of reporting, that economic extraction can be justified. A mineral reserve includes diluting materials and allows for losses that may occur when the material is mined. A proven mineral reserve is the economically mineable part of a measured mineral resource demonstrated by at least a preliminary feasibility study. A probable mineral reserve is the economically mineable part of an indicated, and in some circumstances, a measured mineral resource demonstrated by at least a preliminary feasibility study.
A mineral resource is a concentration or occurrence of natural, solid, inorganic material, or natural solid fossilized organic material including base and precious metals in or on the Earth’s crust in such form and quantity and of such a grade or quality that it has reasonable prospects for economic extraction. The location, quantity, grade, geological characteristics and continuity of a mineral resource are known, estimated or interpreted from specific geological evidence and knowledge. A measured mineral resource is that part of a mineral resource for which quantity, grade or quality, densities, shape and physical characteristics are so well established that they can be estimated with confidence sufficient to allow the appropriate application of technical and economic parameters, to support production planning and evaluation of the economic viability of the deposit. The estimate is based on detailed and reliable exploration, sampling and testing information gathered through appropriate techniques from locations such as outcrops, trenches, pits, workings and drill holes that are spaced closely enough to confirm both geological and grade continuity. An indicated mineral resource is that part of a mineral resource for which quantity, grade or quality, densities, shape and physical characteristics can be estimated with a level of confidence sufficient to allow the appropriate application of technical and economic parameters, to support mine planning and evaluation of the economic viability of the deposit. The estimate is based on detailed and reliable exploration and testing information gathered through appropriate techniques from locations such as outcrops, trenches, pits, workings and drill holes that are spaced closely enough for geological and grade continuity to be reasonably assumed. An inferred mineral resource is that part of a mineral resource for which quantity and grade or quality can be estimated on the basis of geological evidence and limited sampling and reasonably assumed, but not verified, geological and grade continuity. The estimate is based on limited information and sampling gathered through appropriate techniques from locations such as outcrops, trenches, pits, workings and drill holes. Mineral resources which are not mineral reserves do not have demonstrated economic viability. Investors are cautioned not to assume that part or all of an inferred resource exists, or is economically or legally mineable. A Feasibility Study is a comprehensive technical and economic study of the selected development option for a mineral project that includes appropriately detailed assessments of realistically assumed mining, processing, metallurgical, economic, marketing, legal, environmental, social and governmental considerations together with any other relevant operational factors and detailed financial analysis, that are necessary to demonstrate at the time of reporting that extraction is reasonably justified (economically mineable). The results of the study may reasonably serve as the basis for a final decision by a proponent or financial institution to proceed with, or finance, the development of the project. The confidence level of the study will be higher than that of a Pre-Feasibility Study.
The effective date for all of the Company’s mineral resource and reserve estimates in this document is December 31, 2011. Additional information about each of the mineral projects that is required by NI 43-101, sections 3.2 and 3.3 and paragraphs 3.4 (a), (c) and (d) can be found in Technical Reports, which may be found at www.sedar.com. Other important operating information can be found in the Company’s Form 20-F and its news release dated February 15, 2012.
Marc Legault, a Qualified Person and the Company’s Senior Vice-President, Project Evaluations, reviewed the technical information disclosed herein.
29
A solid financial position, low-cost structure, well-funded growth projects in regions of low political risk, and a focused, consistent strategy put Agnico-Eagle in a strong position to continue creating exceptional per share value.
Sean BoydPresident and Chief Executive Officer
David SmithSVP, Strategic Planning & Investor Relations
Trading Symbol: AEM on TSX & NYSE
Investor Relations:[email protected]
Executive and Registered Office:145 King Street East, Suite 400Toronto, Ontario, Canada, M5C 2Y7Tel: 416-947-1212Toll-Free: 888-822-6714 Fax: 416-367-4681
agnico-eagle.com