Q2 2008 Results conference English - Jean Coutu
18
Review of Q2 2008 Financial Results January 10, 2008
Transcript of Q2 2008 Results conference English - Jean Coutu

Review ofQ2 2008
Financial ResultsJanuary 10, 2008

1
FORWARD-LOOKINGSTATEMENT DISCLAIMER
Certain statements in this presentation are forward-looking statements whichinvolve risks and uncertainties. Forward-looking statements include all statements that do not relate solely to historical or current facts and are subjectto risks and uncertainities that may change at any time, and, therefore, ouractual results may differ materially from those expected. While the Companybelieves that its assumptions are reasonable, it is very difficult to predict the impact of known factors, and, of course, it is impossible to anticipate all factorsthat could affect the Company’s actual results. For further information, readersare referred to the section on Risks and Uncertainties contained in the MD&A and other Company filings. The Company disclaims any intention or obligation to update or revise any forward-looking information contained in itscommunications, whether as a result of new information, future events or otherwise.
This presentation also contains certain Non-GAAP financial measures. Suchinformation is reconciled to the most directly comparable financial measures in the Company’s communications with shareholders.

Mr. François J. CoutuPresident and chief executive officer
The Jean Coutu Group (PJC) Inc.

3
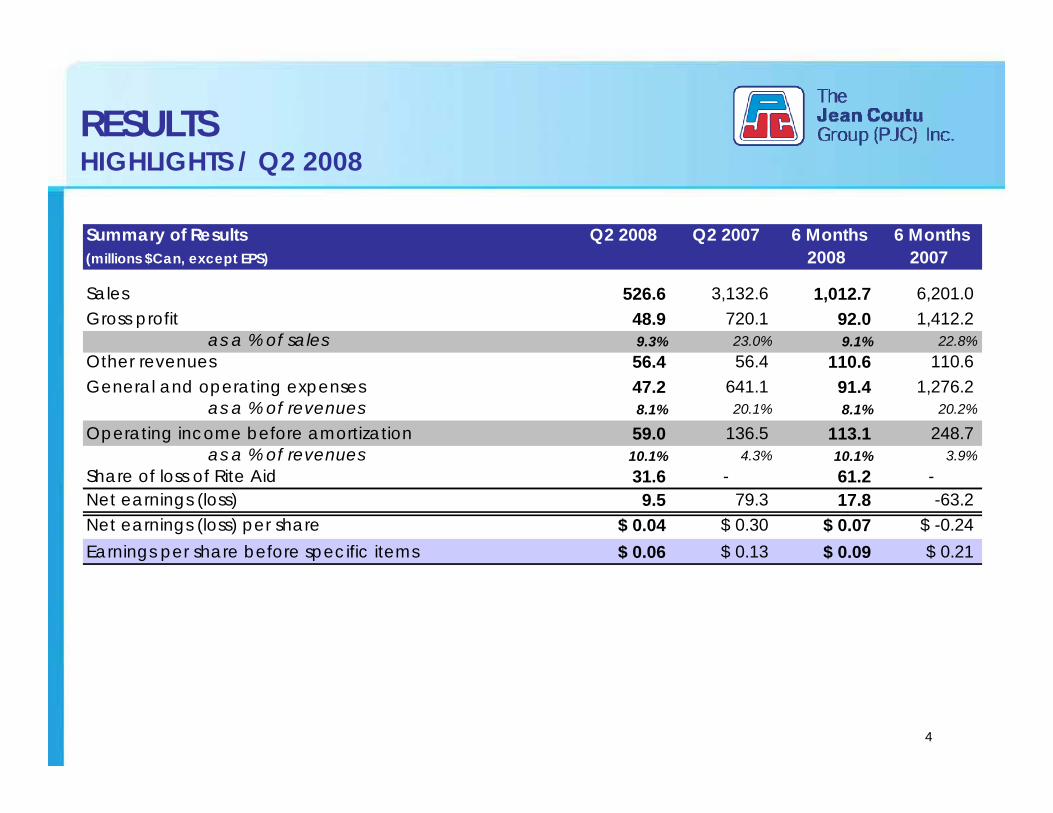
RESULTSHIGHLIGHTS / Q2 2008
Revenues increased 8.3% during the quarter (excluding the US operations sold to Rite Aid):
6.8% network sales growth
8.5% increase in distribution center sales
Operating income before amortization was $59.0 M comparedwith $52.7 M for the same period last year (excluding $83.8 M for the US operations sold to Rite Aid)
Long-term debt increased to $161.8 M on December 1, 2007, principally due to the repurchase of 10.9 M PJC.A commonshares in the maount of $146.5 M
The Company’s after-tax share of loss of Rite Aid amounted to $26.1 M for the second quarter of fiscal 2008 and the Companyrecognized a $3.0 million after-tax provision for losses in respect of Third Party ABCP holdings
4
RESULTSHIGHLIGHTS / Q2 2008
Summary of Results Q2 2008 Q2 2007 6 Months 6 Months(millions $Can, except EPS) 2008 2007
Sales 526.6 3,132.6 1,012.7 6,201.0Gross profit 48.9 720.1 92.0 1,412.2
as a % of sales 9.3% 23.0% 9.1% 22.8%Other revenues 56.4 56.4 110.6 110.6General and operating expenses 47.2 641.1 91.4 1,276.2
as a % of revenues 8.1% 20.1% 8.1% 20.2%
Operating income before amortization 59.0 136.5 113.1 248.7as a % of revenues 10.1% 4.3% 10.1% 3.9%
Share of loss of Rite Aid 31.6 - 61.2 -Net earnings (loss) 9.5 79.3 17.8 -63.2 Net earnings (loss) per share $ 0.04 $ 0.30 $ 0.07 $ -0.24 Earnings per share before specific items $ 0.06 $ 0.13 $ 0.09 $ 0.21

5
50
58 56 5459
53
10.1%10.0%10.1%10.2%9.8%10.3%
0
10
20
30
40
50
60
70
Q1 Q2 Q3 Q4 Q1 Q2 Q3 Q40%
5%
10%
15%
20%
25%
583540550
571538
488
0
100
200
300
400
500
600
700
Q1 Q2 Q3 Q4 Q1 Q2 Q3 Q4
REVENUES OIBA
M CAN$ M CAN$OIBA
margin
CANADIAN OPERATIONSREVENUES AND OIBA
2007 2008 2007 2008

6
9.38.99.08.88.68.9
0.02.04.06.08.0
10.0
Q1 Q2 Q3 Q4 Q1 Q2 Q3 Q4
527486493513485436
0
200
400
600
Q1 Q2 Q3 Q4 Q1 Q2 Q3 Q4
Sales
Gross Margin
CANADIAN OPERATIONSDISTRIBUTION SALES AND GROSS MARGIN
20082007
M CAN$
%
20082007

7
2007
CANADIAN NETWORKRETAIL SALES GROWTH - COMPARABLE STORES
%
0
1
2
3
4
5
6
7
8
9
10
Q1 Q2 Q3 Q4 Q1 Q2 Q3 Q4
Combined Front-End Pharmacy
2008

8
CANADIAN OPERATIONSHIGHLIGHTS / Q2 2008
Real estate development:
- Opened 5 new drugstores including 3 relocations
- Relocated a PJC drugstore in rural New Brunswick to a new 10,400 square foot location, for a 1,900 increase in selling square footage
- 17 drugstore renovationprojects in progress

9
HEALTH AND WELLNESS SERVICES
Diabetes information kits
Smoke-free familycampaign

10
PROMOTIONAL CAMPAIGNTRIP TO PARIS CONTEST
700 winners including 50 lucky winners of a trip to Paris

11
COSMETICS INITIATIVES
12
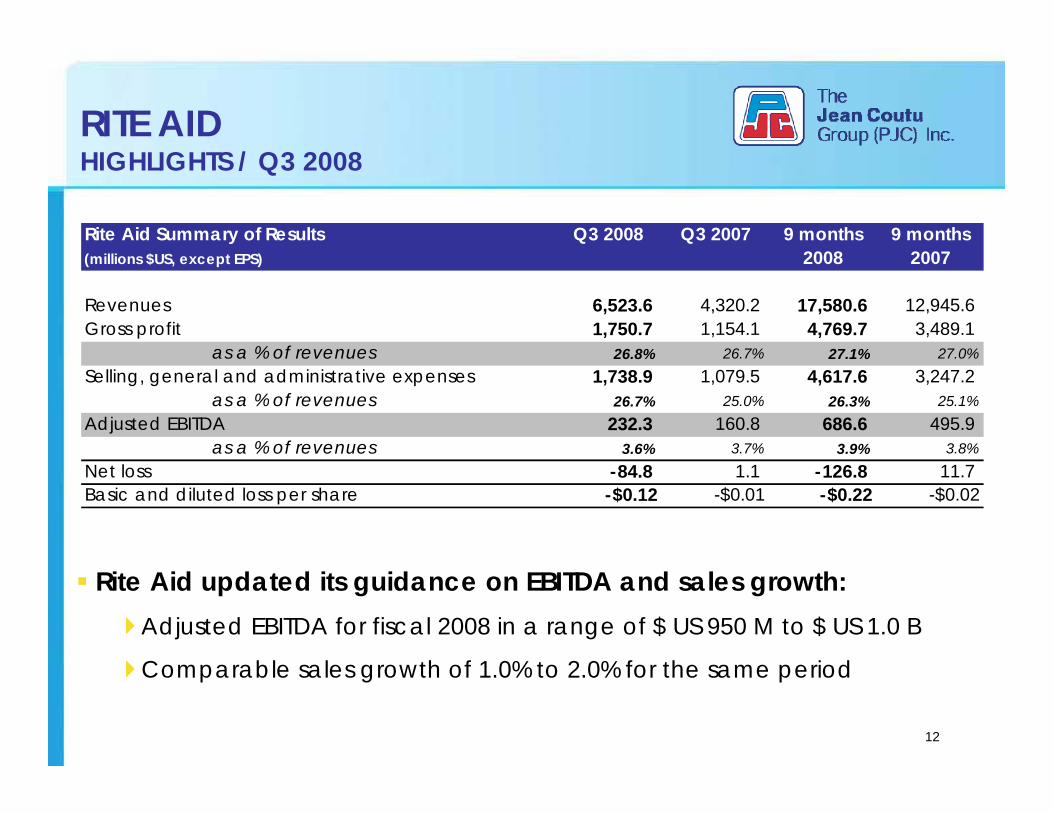
RITE AIDHIGHLIGHTS / Q3 2008
Rite Aid updated its guidance on EBITDA and sales growth:Adjusted EBITDA for fiscal 2008 in a range of $ US 950 M to $ US 1.0 B
Comparable sales growth of 1.0% to 2.0% for the same period
Rite Aid Summary of Results Q3 2008 Q3 2007 9 months 9 months(millions $US, except EPS) 2008 2007
Revenues 6,523.6 4,320.2 17,580.6 12,945.6Gross profit 1,750.7 1,154.1 4,769.7 3,489.1
as a % of revenues 26.8% 26.7% 27.1% 27.0%Selling, general and administrative expenses 1,738.9 1,079.5 4,617.6 3,247.2
as a % of revenues 26.7% 25.0% 26.3% 25.1%Adjusted EBITDA 232.3 160.8 686.6 495.9
as a % of revenues 3.6% 3.7% 3.9% 3.8%Net loss -84.8 1.1 -126.8 11.7Basic and diluted loss per share -$0.12 -$0.01 -$0.22 -$0.02

Mr. André BelzileSenior Vice-President Finance and
Corporate AffairsThe Jean Coutu Group (PJC) Inc.
14
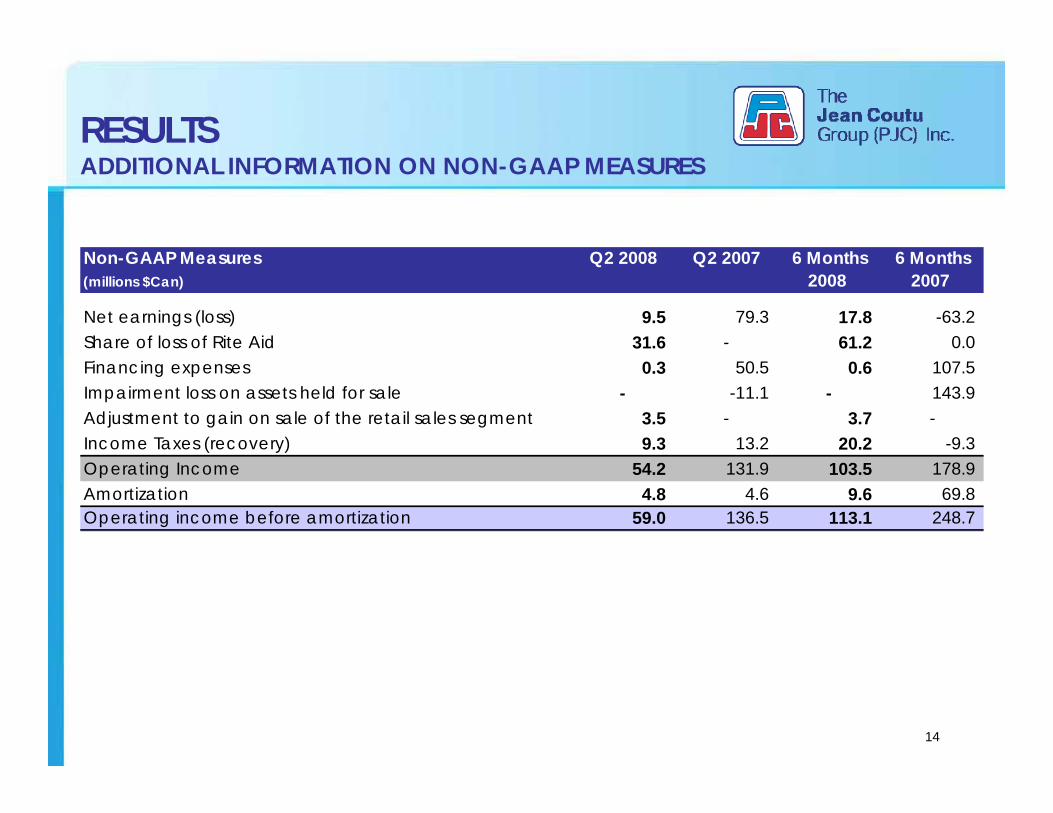
RESULTSADDITIONAL INFORMATION ON NON-GAAP MEASURES
Non-GAAP Measures Q2 2008 Q2 2007 6 Months 6 Months(millions $Can) 2008 2007
Net earnings (loss) 9.5 79.3 17.8 -63.2 Share of loss of Rite Aid 31.6 - 61.2 0.0Financing expenses 0.3 50.5 0.6 107.5Impairment loss on assets held for sale - -11.1 - 143.9Adjustment to gain on sale of the retail sales segment 3.5 - 3.7 -Income Taxes (recovery) 9.3 13.2 20.2 -9.3 Operating Income 54.2 131.9 103.5 178.9Amortization 4.8 4.6 9.6 69.8Operating income before amortization 59.0 136.5 113.1 248.7

15
RESULTSADDITIONAL INFORMATION ON NON-GAAP MEASURESNon-GAAP Measures Q2 2008 Q2 2007 6 Months 6 Months(millions $Can, except EPS) 2008 2007
Net earnings (loss) 9.5 79.3 17.8 -63.2 Specific items after taxesRestructuring charges - 6.6 - 13.7Write-down of investments 3.0 - 3.0 -Unrealized loss (gain) on moneraty items and derivative financial instruments - -6.2 -0.1 -6.1 Reversal of amortization of the retail sales segment in consolidation - -33.8 - -33.8 Impairment loss (reversal) on assets held for sale - -11.1 - 143.9Adjustment to gain on sale of the retail sales segment 2.9 - 3.1 -Earnings before specific items 15.4 34.8 23.8 54.5Net earnings (loss) per share 0.04 $ 0.30 $ 0.07 $ -0.24 $ Specific items after taxesRestructuring charges - 0.02 $ - 0.05 $ Write-down of investments 0.01 $ - 0.01 $ -Unrealized loss (gain) on moneraty items and derivative financial instruments - -0.02 $ - -0.02 $ Reversal of amortization of the retail sales segment in consolidation - -0.13 $ - -0.13 $ Impairment loss (reversal) on assets held for sale - -0.04 $ - 0.55 $ Adjustment to gain on sale of the retail sales segment 0.01 $ - 0.01 $ -Earnings per share before specific items 0.06 $ 0.13 $ 0.09 $ 0.21 $

16
FINANCIAL POSITIONCONSOLIDATED HIGHLIGHTS
Balance Sheet Q2 2008 F 2007(millions $Can, except NBV)
Long Term Debt 161.8 7.4Shareholders' Equity 1,805.2 2,017.5Investments 1,460.7 1,597.8Total Assets 2,267.8 2,336.7Net Book Value per share $ 6.89 $ 7.70

Review ofQ2 2008
Financial ResultsJanuary 10, 2008