Q1 Results 2012
37
Q1 Results 2012 16 May 2012 Hans Peter Ring Chief Financial Officer
Transcript of Q1 Results 2012

Q1 Results 2012 16 May 2012
Hans Peter Ring Chief Financial Officer

2
EADS Q1 Earnings 2012
Safe Harbour Statement
Disclaimer
This presentation includes forward-looking statements. Words such as “anticipates”, “believes”, “estimates”, “expects”, “intends”, “plans”, “projects”,
“may” and similar expressions are used to identify these forward-looking statements. Examples of forward-looking statements include statements
made about strategy, ramp-up and delivery schedules, introduction of new products and services and market expectations, as well as statements
regarding future performance and outlook. By their nature, forward-looking statements involve risk and uncertainty because they relate to future
events and circumstances and there are many factors that could cause actual results and developments to differ materially from those expressed or
implied by these forward-looking statements.
These factors include but are not limited to:
Changes in general economic, political or market conditions, including the cyclical nature of some of EADS’ businesses;
Significant disruptions in air travel (including as a result of terrorist attacks);
Currency exchange rate fluctuations, in particular between the Euro and the U.S. dollar;
The successful execution of internal performance plans, including cost reduction and productivity efforts;
Product performance risks, as well as programme development and management risks;
Customer, supplier and subcontractor performance or contract negotiations, including financing issues;
Competition and consolidation in the aerospace and defence industry;
Significant collective bargaining labour disputes;
The outcome of political and legal processes, including the availability of government financing for certain programmes and the size of defence and
space procurement budgets;
Research and development costs in connection with new products;
Legal, financial and governmental risks related to international transactions;
Legal and investigatory proceedings and other economic, political and technological risks and uncertainties.
As a result, EADS’ actual results may differ materially from the plans, goals and expectations set forth in such forward-looking statements. For a discussion of
factors that could cause future results to differ from such forward-looking statements, see EADS’ “Registration Document” dated 12th April 2012.
Any forward-looking statement contained in this presentation speaks as of the date of this presentation. EADS undertakes no obligation to publicly revise or update
any forward-looking statements in light of new information, future events or otherwise.

Q1 results 2012
Highlights & Key Financials
Divisional Performance
Guidance 2012 & Outlook

4
EADS Q1 Earnings 2012
Q1 HIGHLIGHTS
Positive momentum across businesses:
Increased commercial activity at Airbus and Eurocopter; on track with production ramp-up;
Encouraging order intake at Cassidian and Astrium.
Programme update:
Start of final assembly of first A350 XWB in April 2012; programme remains very challenging as
it progresses to next milestones;
Airbus has defined a permanent fix for the A380 wing rib feet issue, leading to additional
charges of € 158 m in Q1 (treated as one-off);
A400M received initial type certificate, marking a key milestone for first customer delivery early
2013.
Q1 Earnings key messages:
Strong underlying performance; EBIT* before one-off doubles to ca € 480 m;
Significant hedge book improvement;
Net cash position remains robust: Phasing of deliveries and inventory ramp-up leading to a
negative Free Cash Flow.
* Pre-goodwill impairment and exceptionals

5
EADS Q1 Earnings 2012
* Pre-goodwill impairment and exceptionals
** Commercial order intake and order book based on list prices
in € bn
Revenues of which Defence
EBIT* before one-off
Order intake**
Q1 2012 Financial Highlights
Q1 2011
9.9 2.0
0.2
6.3
in € bn
Total Order book** of which Defence
Mar. 2012
526.2 51.9
Dec. 2011
541.0 52.8
Change
-3% -2%
Q1 2012
11.4 2.3
0.5
12.0
Change
+16% +18%
+109%
+92%
Increase in EBIT* before one-off driven by Airbus, Eurocopter and Astrium;
Order intake higher than in Q1 2011 driven by A320neo orders.

6
EADS Q1 Earnings 2012
Q1 2012 EBIT* Before One-off
* Pre-goodwill impairment and exceptionals
in € bn
EBIT* before one-off 2012 % Revenues
One-off impacts:
$ PDP mismatch and balance sheet revaluation
A380 wing rib feet
EBIT* Reported
EADS
Group
0.48
4.2%
0.02
(0.16)
0.34
Airbus
Division
0.32
4.0%
0.02
(0.16)
0.18
0.29
3.8%
0.02
(0.16)
0.15
Airbus Commercial

7
EADS Q1 Earnings 2012
in % of
Revenues € m € m
in % of
Revenues
EBIT*
Self-financed R&D**
EBIT* before R&D
192
650
842
1.9%
6.6%
8.5%
Interest result
Other financial result
Taxes
(47)
(150)
5
(0.5%)
(1.5%)
0.1%
Net income
Net income* before one-off
EPS* before one-off a)
(12)
101
€ 0.12
(0.1%)
1.0%
Q1 2012 Q1 2011
* Pre-goodwill impairment and exceptionals
** IAS 38: € 11m capitalised during Q1 2012; € 23m capitalised during Q1 2011
a) Average number of shares outstanding: 815,957,338 in Q1 2012; 810,699,249 in Q1 2011
Q1 2012 Profit & Loss Highlights
343
726
1,069
3.0%
6.4%
9.4%
(73)
(70)
(55)
(0.6%)
(0.6%)
(0.5%)
133
259
€ 0.32
1.2%
2.3%

8
EADS Q1 Earnings 2012
* Total hedge amount contains $/€ and $/£ designated hedges. A400M related hedges excluded
** Includes collars at their least favourable rates
Currency Hedge Policy
Mark-to-market value = € - 0.7 bn Closing rate @ 1.34 € vs.$
EADS hedge portfolio*, 31st March 2012
($ 80.3 bn), average rates of € 1 = $ 1.36** and £ 1 = $ 1.58
Approximately 50% of EADS’ US$ revenues are naturally hedged by US$ procurement;
In Q1 2012, hedges of $ 4.8 bn* matured at an average hedge rate of € 1 = $ 1.39;
In Q1 2012, new hedge contracts of $ 9.9 bn** were added at an average rate of € 1= $ 1.32**.
Average hedge rates
1.4
0.6
16.7
22.719.5
13.9
7.5
0
5
10
15
20
25
2012 2013 2014 2015 2016+
US$ bn
Collars
Forward contracts
€ vs $*** 1.36 1.37 1.37 1.38 1.34
£ vs $ 1.61 1.57 1.57 1.59 1.57
remaining 9 months

9
EADS Q1 Earnings 2012
* Gross Cash Flow from Operations, excluding working capital change and contribution to plan assets of pension schemes
Free Cash Flow
1,075
(1,853)
65
(460)
(496)
36
(1,238)
in € m
Net cash position at the beginning of the period
Net cash position at the end of the period
Change in capital and non–controlling interests
Change in treasury shares
Contribution to plan assets of pension schemes
Others
10,674
Free Cash Flow*** before customer financing 208 (1,303)
12,172
Q1 2011
11,918
Q1 2012
11,681
568
112
101
(371)
(367)
(4)
309
Gross Cash Flow from Operations*
Change in working capital
of which Customer Financing
Cash used for investing activities**
of which Industrial Capex (additions)
of which Others
Free Cash Flow***
7
(14)
(8)
(40)
67
(6)
(5)
175
*** Excluding contribution to plan assets of pension schemes and change of securities
** Excluding change of securities

10
EADS Q1 Earnings 2012
Q1 results 2012
Highlights & Key Financials
Divisional Performance
Guidance 2012 & Outlook

11
EADS Q1 Earnings 2012
11% LR
89% SA
0% Europe
9% Asia Pacific
* Pre-goodwill impairment and exceptionals
** Capitalised R&D: € 3 m in Q1 2012 and € 9 m in Q1 2011
*** Commercial a/c valued at list prices, units excl. freighter conversions
in € m
Deliveries (units)
Revenues
R&D self-financed**
in % of revenues
EBIT*
in % of revenues
Order book***
in units***
Net orders***
Q1 2012
121 a/c
7,013
525 7.5%
115 1.6%
374,891
Gross Orders
by Programme
Gross Orders
by Region
Q1 2012
119 a/c
6,707
516 7.7%
125 1.9%
353,574
3,434
1 a/c
131 a/c
7,499
587 7.8%
146 1.9%
460,288
4.396
90 a/c
Q1 2011
Q1 2012
3 a/c
434
9 2.1%
1 0.2%
22,487
239
1 a/c
4 a/c
425
0 0%
11 2.6%
21,272
218
5 a/c
Airbus Division (after elimination)
Airbus Commercial Airbus Military
135 a/c
7,909
587 7.4%
183 2.3%
480,322
2% Middle East
54% RoW
x% Tanker
Q1 2011
Q1 2011
30% North America
a) Excluding 5 green aircraft delivered to Airbus Military
b) Excluding 3 green aircraft delivered to Airbus Military
c) 2 A330-200 delivered under operating lease in 2010 and sold down in 2011
5% Leasing
a)
Airbus Division
c)
a) Excluding 1 green aircraft delivered to Airbus Military
12
EADS Q1 Earnings 2012
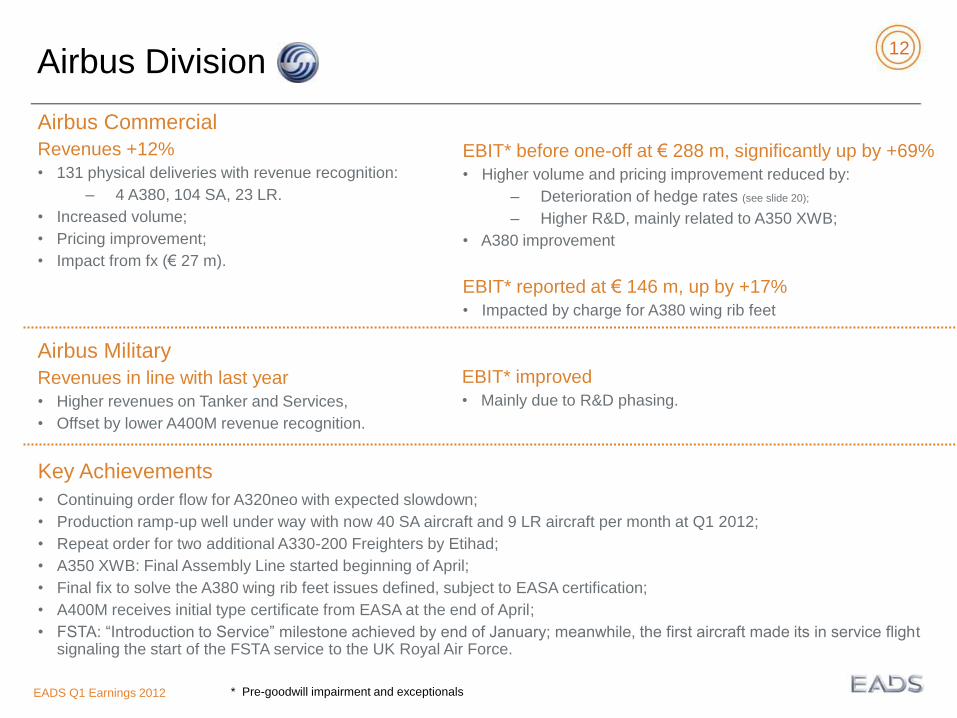
Airbus Commercial
Revenues +12%
• 131 physical deliveries with revenue recognition:
– 4 A380, 104 SA, 23 LR.
• Increased volume;
• Pricing improvement;
• Impact from fx (€ 27 m).
EBIT* before one-off at € 288 m, significantly up by +69%
• Higher volume and pricing improvement reduced by:
– Deterioration of hedge rates (see slide 20);
– Higher R&D, mainly related to A350 XWB;
• A380 improvement
EBIT* reported at € 146 m, up by +17%
• Impacted by charge for A380 wing rib feet
Airbus Military
Revenues in line with last year
• Higher revenues on Tanker and Services,
• Offset by lower A400M revenue recognition.
* Pre-goodwill impairment and exceptionals
EBIT* improved
• Mainly due to R&D phasing.
Airbus Division
Key Achievements
• Continuing order flow for A320neo with expected slowdown;
• Production ramp-up well under way with now 40 SA aircraft and 9 LR aircraft per month at Q1 2012;
• Repeat order for two additional A330-200 Freighters by Etihad;
• A350 XWB: Final Assembly Line started beginning of April;
• Final fix to solve the A380 wing rib feet issues defined, subject to EASA certification;
• A400M receives initial type certificate from EASA at the end of April;
• FSTA: “Introduction to Service” milestone achieved by end of January; meanwhile, the first aircraft made its in service flight signaling the start of the FSTA service to the UK Royal Air Force.

13
EADS Q1 Earnings 2012
in € m
Revenues
R&D self-financed** in % of revenues
EBIT* in % of revenues
Order book
in units
Q1 2011 Q1 2012
823 44
5.3%
31 3.8%
14,506 1,140
1,199 61
5.1%
65 5.4%
13,863 1,097
* Pre-goodwill impairment and exceptionals
** Capitalised R&D: € 5 m in Q1 2012 and € 4 m in Q1 2011
47% Services
53% Programmes
56% Civil
Revenue split
44% Military
Eurocopter
based on Q1 2012 EADS external revenues
Revenues +46%
Strong revenues increase driven by ramp-up of Super Puma
deliveries, increase in repair and overhaul services activity and Vector.
EBIT more than doubled (+110%)
Favourable volume / mix impact and pricing improvement;
Despite higher R&D activity, mainly on Dauphin / X4.
Key highlights
Successful US Heli-Expo 2012 confirms positive market trend and
success of Eurocopter’s product innovation strategy:
191 contracts and commitments signed;
Innovation strategy underlined with roll out of new and
enhanced product range including EC130 T2.
Helibras signed contract to provide spare parts and services for the
50 Brazilian EC725s;
Increase of international footprint: Dauphin flight simulator at the
Eurocopter South East Asia subsidiary, Singapore;
Discussions with German government ongoing; outcome still open.
14
EADS Q1 Earnings 2012
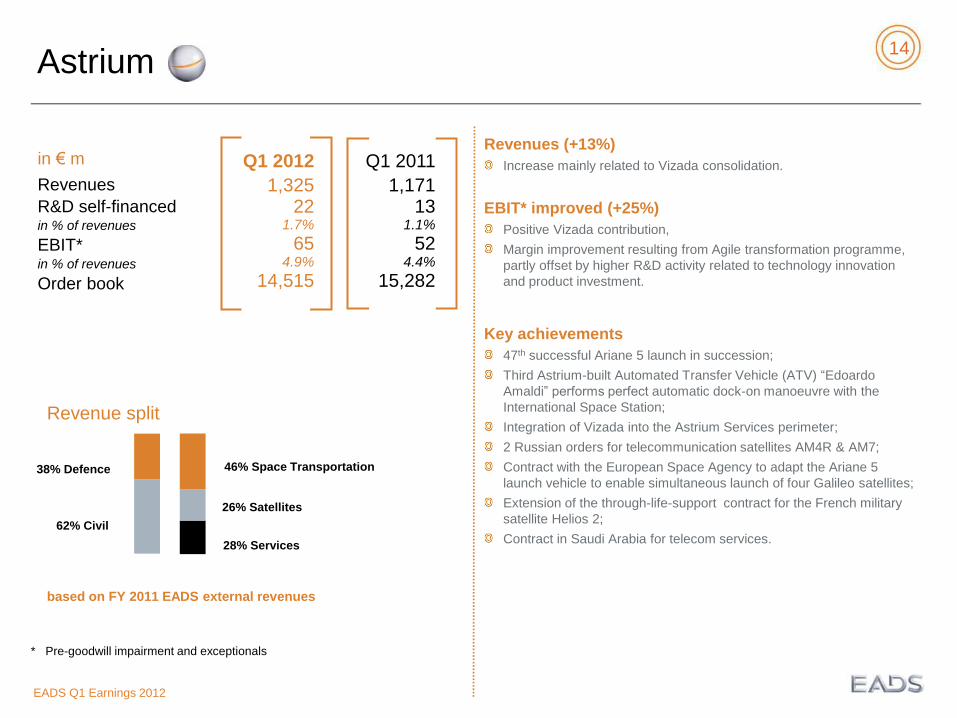
in € m
Revenues
R&D self-financed in % of revenues
EBIT* in % of revenues
Order book
Q1 2011 Q1 2012
1,171 13
1.1%
52 4.4%
15,282
1,325 22
1.7%
65 4.9%
14,515
Astrium
46% Space Transportation
28% Services
62% Civil
Revenue split
38% Defence
based on FY 2011 EADS external revenues
26% Satellites
Revenues (+13%)
Increase mainly related to Vizada consolidation.
EBIT* improved (+25%)
Positive Vizada contribution,
Margin improvement resulting from Agile transformation programme,
partly offset by higher R&D activity related to technology innovation
and product investment.
Key achievements
47th successful Ariane 5 launch in succession;
Third Astrium-built Automated Transfer Vehicle (ATV) “Edoardo
Amaldi” performs perfect automatic dock-on manoeuvre with the
International Space Station;
Integration of Vizada into the Astrium Services perimeter;
2 Russian orders for telecommunication satellites AM4R & AM7;
Contract with the European Space Agency to adapt the Ariane 5
launch vehicle to enable simultaneous launch of four Galileo satellites;
Extension of the through-life-support contract for the French military
satellite Helios 2;
Contract in Saudi Arabia for telecom services.
* Pre-goodwill impairment and exceptionals

15
EADS Q1 Earnings 2012
in € m
Revenues
R&D self-financed in % of revenues
EBIT* in % of revenues
Order book
Q1 2011 Q1 2012
878 53
6.0%
8 0.9%
16,721
925 55
5.9%
8 0.9%
16,178
Cassidian
11% Civil & other customers
Revenue split
89% Defence &
Security 74% Domestic
26% Global
Strong order momentum
Eurofighter Sustainment contract, covering the support of the
Eurofighter fleet over the next 5 years;
Significant export order for MICA missiles in India;
Three year support and maintenance contract for city wide TETRA
network in Beijing.
Revenues +5%
Favourable phasing of Eurofighter volume.
EBIT* in line with last year
Positive volume effects offset by higher non programme related costs
for globalisation and transformation;
Continued high R&D efforts.
Key Achievements
Cassidian and Rheinmetall finalising their agreement to pursue the
latter’s Unmanned Aerial Systems activities together in a separate
entity;
Announcement of creation of a Cyber Security entity, commencing
1st July 2012;
Successful demonstration of technical and operational advantages of
E-Scan radar in simulation study;
Important milestone was reached on the avionics software upgrade
program of the German Air Force Tornado jet fleet.
* Pre-goodwill impairment and exceptionals

16
EADS Q1 Earnings 2012
Revenues
Delivery ramp up of military transport aircraft at EADS North America
and higher ATR deliveries overcompensate lower Sogerma revenues.
EBIT* negative
Negative mix effect at EADS North America;
Temporary unfavorable cost phasing at ATR.
ATR
218 units in backlog compared to 178 a year before;
8 deliveries compared to 6 in Q1 2011.
North America
In March, the US Army took delivery of the 200th Lakota helicopter,
the first production aircraft with the new Security and Support
Battalion mission equipment package.
in € m
Revenues
R&D self-financed in % of revenues
EBIT* in % of revenues
Order book
246 2
0.8%
(3)
2,566
361 4
1.1%
(6) x%
2,805
25% ATR
61% EADS NA
14% Sogerma
40% Civil
Revenue split
60% Defence
Other Businesses
based on Q1 2012 EADS external revenues
Q1 2011 Q1 2012
* Pre-goodwill impairment and exceptionals

17
EADS Q1 Earnings 2012
Q1 results 2012
Highlights & Key Financials
Divisional Performance
Guidance 2012 & Outlook

18
EADS Q1 Earnings 2012
Guidance 2012
2012 guidance is based on €/$ 1.35, as average rate
Airbus Orders & Deliveries: Airbus deliveries around 570 a/c; book to bill > 1.
Revenues:
EADS revenues will grow above 6% in 2012.
EBIT* before one off:
EADS EBIT* before one off should improve significantly thanks to volume increases at Airbus and Eurocopter, better pricing at Airbus and A380 improvement. We expect the EBIT* before one-off to be above € 2.5 bn.
EBIT*/EPS*: – EADS expects 2012 EPS* before one-off to be above € 1.85 (FY 2011: € 1.39);
– Going forward, the EBIT* and EPS* performance of EADS will be dependent on the Group’s ability to execute on its complex programmes such as A400M, A380 and A350 XWB, in line with the commitments made to its customers;
– Reported EBIT* and EPS* also depend on exchange rate fluctuations.
Free Cash Flow: – EADS should continue to generate a positive Free Cash Flow after customer financing and before acquisitions.
* Pre-goodwill impairment and exceptionals

Appendix

20
EADS Q1 Earnings 2012
Revaluation of Airbus Commercial LMC provisions
Deterioration of hedge rates (€: $ 1.37 to 1.39)
Other one-off forex effect including PDP reversal
Compared to Q1 2011
(0.03)
BRIDGE
0
(0.05)
0.02
Forex impact on EBIT* (in € bn)
Q1 2012 Forex EBIT* Impact Bridge
* Pre-goodwill impairment and exceptionals

21
EADS Q1 Earnings 2012
Q1 2012 EBIT* Before One-off by Division
* Pre-goodwill impairment and exceptionals
in € bn
Airbus
Eurocopter
Astrium
Cassidian
Other Businesses
HQ & eliminations
EADS
EBIT* before one-off
0.32
0.07
0.07
0.01
(0.01)
0.02
0.48
One-offs
(0.14)
0
0
0
0
0
(0.14)
Reported EBIT*
0.18
0.07
0.07
0.01
(0.01)
0.02
0.34

22
EADS Q1 Earnings 2012
in € bn
EBIT* before one-off Q1 2011
% Revenues
One off impacts:
$ PDP mismatch and balance sheet revaluation
EBIT* Reported
Q1 2011 EBIT* Before One-off
* Pre-goodwill impairment and exceptionals
Airbus
Division
0.16
2.3%
(0.04)
0.12
EADS
Group
0.23
2.3%
(0.04)
0.19
Airbus
Comm.
0.17
2.5%
(0.04)
0.13

23
EADS Q1 Earnings 2012
Net Income Before One-off
* Pre-goodwill impairment and exceptionals 1 Average number of shares outstanding: 815,957,338 in Q1 2012; 810,699,249 in Q1 2011
Net Income before one-off excludes the following items:
One-offs impacting the EBIT* line (as reported in the EBIT* before one-off)
The Other Financial Result, except for the unwinding of discount on provisions
The tax effect is calculated at 30%
Net Income reported
Net Income*
One-offs in EBIT*
One-offs Financial Result
Tax effect on one-offs (incl. tax one-offs)
Net Income* before one-off
EPS* before one-off 1
133
140
(142)
(29)
52
259
€ 0.32
in € m
Q1 2012 Q1 2011
(12)
(4)
(37)
(113)
45
101
€ 0.12

24
EADS Q1 Earnings 2012
Q1 2011
in % of
Revenues € m € m
Q1 2012
in % of
Revenues
Revenues
self-financed R&D**
EBITDA*
EBIT*
EBIT* before R&D
11,404
726
776
343
1,069
6.4%
6.8%
3.0%
9.4%
9,854
650
589
192
842
6.6%
6.0%
1.9%
8.5%
Net income
EPS***
133
€ 0.16
1.2%
(12)
€ (0.01)
(0.1)%
10,674
12,172 Net Cash position
at the end of the period
Free Cash Flow
* Pre-goodwill impairment and exceptionals
** IAS 38: € 11 m Capitalised during Q1 2012; € 23 m Capitalised during Q1 2011
*** Average number of shares outstanding: 815,957,338 in Q1 2012; 810,699,249 in Q1 2011
(1,238) 309
Q1 2012 Financial Highlights

25
EADS Q1 Earnings 2012
* On 9 February 2007, Daimler reached an agreement with a consortium of private and public-sector
investors through which it effectively reduced its shareholding in EADS by 7.5%, while retaining its
voting rights over the entire 22.5% package of EADS shares at the time of the transaction.
Contractual Partnership
49.92%
SOGEADE
Lagardère
&
French
State
22.25%
Daimler
22.25%*
SEPI
5.42%
Free float
incl. Minor direct holdings:
French State: 0.06% Treasury shares 0.51%
50.08%
Shareholding structure
as at 31st March 2012

26
EADS Q1 Earnings 2012
Expected EADS Average Hedge Rates € vs. $
1.32
1.35
1.36
1.35
1.371.37
1.38
1.371.37
1.39
1.36
1.35 1.35
1.36
1.30
1.35
1.40
Q1 Q2 Q3 Q4 FY
2010 Average FY 2010 2011 Average FY 2011 2012e Average FY 2012e
Average hedge rates
* Q1 2012 actual
*

27
EADS Q1 Earnings 2012
1.4
0.6 0.5
1.5
1.51.0
0.90.4
0.80.3
0.6 0.8
0.5 0.1
(2.9)
(0.9) (0.7)(0.7) (0.2) (1.0)
(1.3) (2.2)(1.1)
(0.2) (0.2) (0.7) (0.6) (0.1)
(0.2)
(0.1) (0.2) (0.2) (0.3)
(0.3)(0.2)
(0.2)
(0.1)
(0.1) (0.1)(0.2) (0.1)
1999 2000 2001 2002 2003 2004 2005 2006 2007 2008 2009 2010 2011 2012
Additions and Disposalsto Airbus customer financing gross exposure in $ bn
Additions Sell Down Amortisation
Airbus Customer Financing
Estimated
Collateral
€ 0.6bn
Gross exposure in $ bn
Gross
Exposure
€ 1.0bn
($ 1.4bn)
Net
Exposure
€ 0.4 bn
Net Exposure fully
provisioned
31st March 2012
Active exposure management
4.3 3.9 3.1 3.8 4.8 4.6 3.8 1.8 1.5 1.5 1.8 1.7 1.4 1.4
-3.5
-2.5
-1.5
-0.5
0.5
1.5
2.5
Net change

28
EADS Q1 Earnings 2012
Customer Financing Exposure
in € m Mar. 2012 Dec.2011
Closing rate € 1 = $ 1.34 $ 1.29
Total Gross exposure 1,031 1,105
of which off-balance sheet 236 267
Estimated value of collateral (574) (627)
Net exposure 457 478
Provision and asset impairment (457) (478)
Net exposure after provision 0 0
100% AIRBUS
Mar. 2012 Dec.2011
78 98
50 56
(66) (86)
12 12
(12) (12)
0 0
50% ATR 100% EC
Mar. 2012 Dec.2011
82 86
28 40
(48) (53)
34 33
(34) (33)
0 0

29
EADS Q1 Earnings 2012
in € m Q1 2012 Q1 2011
EBIT* 343 192
Exceptionals:
Fair value depreciation (10) (11)
Profit before finance cost 333 181
and income taxes
EBIT* Calculation
* Pre-goodwill impairment and exceptionals
30
EADS Q1 Earnings 2012
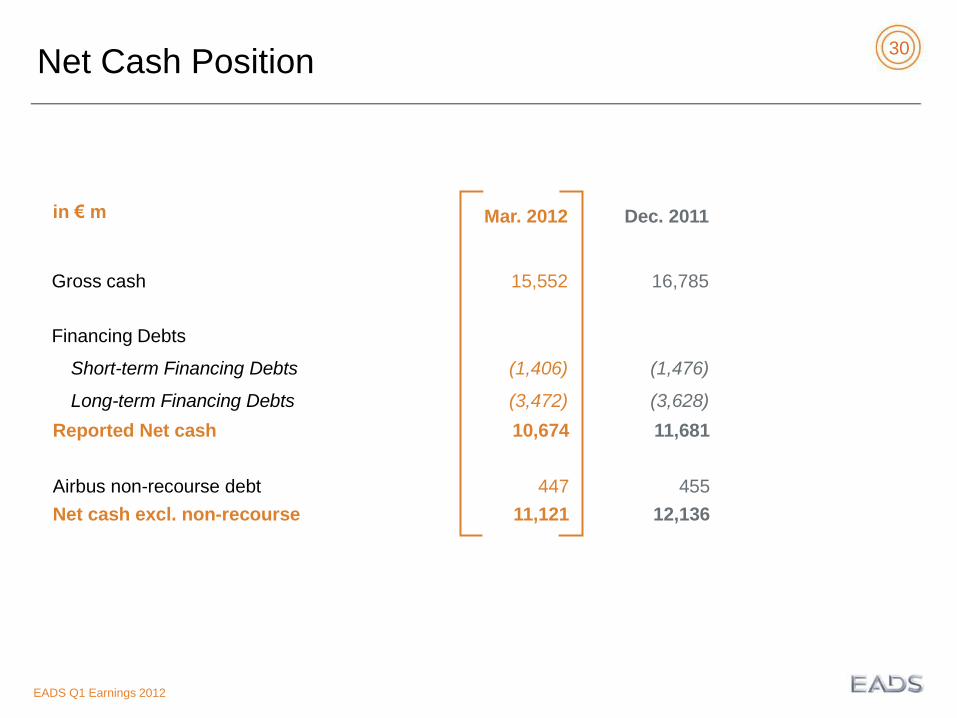
Net Cash Position
in € m Mar. 2012 Dec. 2011
Gross cash 15,552 16,785
Financing Debts
Short-term Financing Debts (1,406) (1,476)
Long-term Financing Debts (3,472) (3,628)
Reported Net cash 10,674 11,681
Airbus non-recourse debt 447 455
Net cash excl. non-recourse 11,121 12,136
31
EADS Q1 Earnings 2012
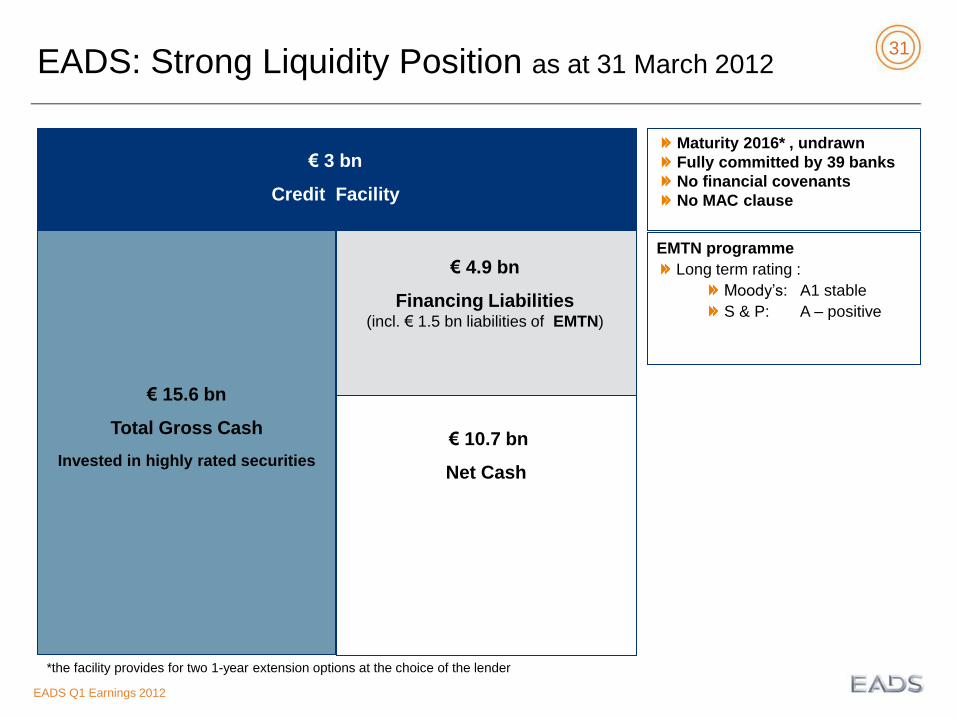
EADS: Strong Liquidity Position as at 31 March 2012
€ 15.6 bn
Total Gross Cash
Maturity 2016* , undrawn
Fully committed by 39 banks
No financial covenants
No MAC clause
€ 10.7 bn
Net Cash
€ 3 bn
Credit Facility
Invested in highly rated securities
€ 4.9 bn
Financing Liabilities (incl. € 1.5 bn liabilities of EMTN)
EMTN programme
Long term rating :
Moody’s: A1 stable
S & P: A – positive
*the facility provides for two 1-year extension options at the choice of the lender

32
EADS Q1 Earnings 2012
Balance Sheet Highlights: Assets
Mar. 2012
45,999 12,734
14,158
4,990
726
7,954
42,731 24,506
4,580
3,018
429
88,730
1.34
in € m
Non-current Assets of which Intangible & Goodwill
of which Property, plant & equipment
of which Investments & Financial assets
of which positive hedge mark-to-market
of which Non-current securities
Current Assets of which Inventory
of which Cash
of which Current securities
of which positive hedge mark-to-market
Total Assets
Closing rate €/$
Dec. 2011
45,455 12,745
14,159
5,055
486
7,229
43,021 22,563
5,284
4,272
404
88,476
1.29

33
EADS Q1 Earnings 2012
in € m
Total Equity of which OCI (Other Comprehensive Income)
of which Non-controlling interests
Total Non-current liabilities of which pensions
of which other provisions
of which financing debts
of which European governments refundable advances
of which Customer advances
of which negative hedge mark-to-market
Total Current liabilities of which pensions
of which other provisions
of which financing debts
of which European gvts refundable advances
of which Customer advances
of which negative hedge mark-to-market
Total Liabilities and Equity
Balance Sheet Highlights: Liabilities
Mar. 2012
10,180 1,284
20
31,238 5,668
3,477
3,472
5,512
9,105
1,407
47,312 193
5,690
1,406
237
25,207
704
88,730
Dec. 2011
8,870 153
20
32,100 5,628
3,497
3,628
5,526
9,256
2,140
47,506 193
5,667
1,476
211
25,006
995
88,476

34
EADS Q1 Earnings 2012
2011 2012 2012
Airbus Division
Eurocopter
Astrium
Cassidian
HQ & others
Total EADS
in € m Q1 H1 9m FY
of which HQ & elim.
of which other BUs
2012
Thereof Airbus Comm.*
Thereof Airbus Military
2012
Quarterly Revenues Breakdown (cumulative)
* Airbus Commercial includes EFW and excludes A400M
7,909
7,499
1,199
1,325
925
46
11,404
(315)
361
425
…
…
…
…
…
…
…
7,013
6,707
823
1,171
878
(31)
9,854
(277)
246
434
2011
33,103
31,159
5,415
4,964
5,803
(157)
49,128
(1,409)
1,252
2011
2,504
2011
15,312
14,464
2,171
2,347
2,133
(27)
21,936
(551)
524
1,112
22,411
21,120
3,458
3,440
3,419
(41)
32,687
(874)
833
1,747
…
…
…
…
…
…
…
…
…
…
…
…
…
…
…
…
…
…
…
…
…
…
…

35
EADS Q1 Earnings 2012
Quarterly EBIT* Breakdown (cumulative)
* Pre goodwill impairment and exceptionals
** Airbus Commercial incl. EFW and excludes A400M
2011 2011
Airbus Division
Eurocopter
Astrium
Cassidian
HQ & others
Total EADS
in € m Q1 H1 9m FY
of which HQ & elim.
of which other BUs
2011 2011
Thereof Airbus Comm.**
Thereof Airbus Military
115
125
31
52
8
(14)
192
(11)
(3)
1
584
543
259
267
331
255
1,696
196
59
49
202
223
94
103
89
75
563
63
12
3
295
306
157
165
170
98
885
78
20
5
2012 2012 2012 2012
183
146
65
65
8
22
343
28
(6)
11
…
…
…
…
…
…
…
…
…
…
…
…
…
…
…
…
…
…
…
…
…
…
…
…
…
…
…
…
…
…

36
EADS Q1 Earnings 2012
Quarterly Order-intake Breakdown (cumulative)
2011 2011
Airbus Division
Eurocopter
Astrium
Cassidian
HQ & others
Total EADS
in € m Q1 H1 9m FY
of which HQ & elim.
of which other BUs
2011 2011
Thereof Airbus Comm.*
Thereof Airbus Military
* Airbus Commercial includes EFW and excludes A400M
117,874
.
4,679
3,514
4,168
792
131,027
(1,233)
2,025
.
117,301
935
3,748
3,647
779
781
821
139
6,268
(255)
394
105
52,394
52,086
1,736
1,701
1,825
443
58,099
(545)
988
319
85,485
85,421
2,760
2,328
2,604
730
93,907
(893)
1,623
408
2012 2012 2012 2012
7,877
7,530
1,248
1,163
1,806
(90)
12,004
(295)
205
372
…
…
…
…
…
…
…
…
…
…
…
…
…
…
…
…
…
…
…
…
…
…
…
…
…
…
…
…
…
…

37
EADS Q1 Earnings 2012
Quarterly Order-book Breakdown (cumulative)
* Airbus Commercial includes EFW and excludes A400M
2011 2011
Airbus Division
Eurocopter
Astrium
Cassidian
HQ & others
Total EADS
in € m Q1 H1 9m FY
of which HQ & elim.
of which other BUs
2011 2011
Thereof Airbus Comm.*
Thereof Airbus Military
374,891
353,574
14,506
15,282
16,721
962
422,362
(1,604)
2,566
22,487
407,094
386,101
14,116
14,967
16,457
1,200
453,834
(1,640)
2,840
22,061
495,513
475,477
13,814
14,666
15,469
1,516
540,978
(1,467)
2,983
21,315
456,788
436,427
13,852
14,687
16,144
1,500
502,971
(1,696)
3,196
21,672
2012 2012 2012 2012
480,322
460,288
13,863
14,515
16,178
1,300
526,178
(1,505)
2,805
21,272
…
…
…
…
…
…
…
…
…
…
…
…
…
…
…
…
…
…
…
…
…
…
…
…
…
…
…
…
…
…