Q1 Office Bulletin 2012 - Property Price Reports 5,000 10,000 15,000 20,000 25,000 30,000 35,000...
8
CBRE © 2012, CBRE www.cbre.ie Q1 2012 Dublin Office OVERALL COMMENTARY In total, 24,097m 2 of office lettings were signed in Dublin in the first three months of 2012. This represents a 51% decrease in letting activity in the capital compared to the same quarter last year and a decline of some 32% compared to the most recent quarter, Q4 2011. Total take-up of only 5,909m 2 was signed in the suburbs in Q1 2012, which represents a decline of more than 50% on both an annual and quarterly measure. The deterioration in the volume of lettings signed in Dublin in the first quarter of the year is not surprising considering the length of time it is taking to conclude negotiations at present and the fact that many corporate occupiers are curtailing their expansion and relocation requirements until such time as the economic climate is more certain. Nevertheless, several office lettings are in negotiations at present and there are a number of outstanding requirements for office accommodation in the capital which is likely to boost take-up in subsequent quarters. Indeed, overall demand for office accommodation in the capital was up 71% quarter-on-quarter as a result of some large requirements that emerged during Q1 2012. Our research indicates that the quantum of office letting activity in the first three months of the year typically accounts for approximately 20% of annual take-up in the market, which suggests that our forecast of 130,000m 2 of letting activity being achieved in Dublin in 2012 is realistic. More than 75% of the office lettings signed in Dublin during Q1 2012 were located in the city centre, with the Dublin 2/4 district accounting for more than half of the city centre letting activity. Large lettings in the Eastpoint development in Dublin 1 to Arvata and Google boosted the dominance of the Dublin 1/3/7 office district in terms of take-up in the first three months of 2012. These two lettings between them accounted for just less than 30% of total letting activity in Dublin in the three month period. The vacancy rate fell slightly in Q1 2012 to 22.9% with approximately 828,000m 2 of office accommodation being officially marketed to let in the Dublin market at the end of the first quarter of this year. An analysis of the Top 10 largest letting transactions in the quarter reveals net absorption of almost 70%. Four of the ten largest lettings in Q1 comprised companies expanding to larger premises; one was a brand new requirement while the remainder were companies relocating to larger premises. There were 3 office investments sold in the capital during Q1, bringing the total investment spend on offices in Dublin during the quarter to €18.5 million, equating to 92% of the total investment spend in the city in the period. Prime rents in the Dublin office market at the end of Q1 2012 were €296 per square metre and are now expected to stabilise at this level although there is expected to be further downward pressure on rents for non- prime buildings over the course of the year. Meanwhile, prime office yields in Dublin are now approximately 7.25%. Dublin Gross Office Take-Up Q1 2010 – Q1 2012 Quick Stats Q1 Hot Topics • Office take-up in Dublin in the first quarter of 2012 reached 24,097m 2 , representing a decline of 51% compared to the same quarter last year • There were 32 individual lettings signed in the quarter with most comprising relatively small transactions • The vacancy rate in the capital stands at 22.9% at the end of Q1 having fallen slightly in the first three months of 2012 • Prime headline quoting rents in Dublin city centre are now approximately €296 per m 2 and are expected to stabilise at this level • More than 75% of lettings signed in Dublin in Q1 2012 were in the city centre • There was a notable 71% increase in demand for new office premises in the capital quarter-on-quarter as a result of a number of new requirements being enacted Change from previous quarter Availability Take-Up Investment Prime Rents Yields Demand Source: CBRE 0 10,000 20,000 30,000 40,000 50,000 60,000 Q1 2010 Q2 2010 Q3 2010 Q4 2010 Q1 2011 Q2 2011 Q3 2011 Q4 2011 Q1 2012 City Centre Suburbs Sq.M.
Transcript of Q1 Office Bulletin 2012 - Property Price Reports 5,000 10,000 15,000 20,000 25,000 30,000 35,000...

CBRE
© 2012, CBRE
www.cbre.ie Q1 2012
Dublin Office
Overall COmmentary In total, 24,097m2 of office lettings were signed in Dublin in the first three months of 2012. This represents a 51% decrease in letting activity in the capital compared to the same quarter last year and a decline of some 32% compared to the most recent quarter, Q4 2011. Total take-up of only 5,909m2 was signed in the suburbs in Q1 2012, which represents a decline of more than 50% on both an annual and quarterly measure. The deterioration in the volume of lettings signed in Dublin in the first quarter of the year is not surprising considering the length of time it is taking to conclude negotiations at present and the fact that many corporate occupiers are curtailing their expansion and relocation requirements until such time as the economic climate is more certain. Nevertheless, several office lettings are in negotiations at present and there are a number of outstanding requirements for office accommodation in the capital which is likely to boost take-up in subsequent quarters. Indeed, overall demand for office accommodation in the capital was up 71% quarter-on-quarter as a result of some large requirements that emerged during Q1 2012.
Our research indicates that the quantum of office letting activity in the first three months of the year typically accounts for approximately 20% of annual take-up in the market, which suggests that our forecast of 130,000m2 of letting activity being achieved in Dublin in 2012 is realistic. More than 75% of the office lettings signed in Dublin during Q1 2012 were located in the city centre, with the Dublin 2/4 district accounting for more than half of the city centre letting activity. Large lettings in the Eastpoint development in Dublin 1 to Arvata and Google boosted the dominance of the Dublin 1/3/7 office district in terms of take-up in the first three months of 2012. These two lettings between them accounted for just less than 30% of total letting activity in Dublin in the three month period.
The vacancy rate fell slightly in Q1 2012 to 22.9% with approximately 828,000m2 of office accommodation being officially marketed to let in the Dublin market at the end of the first quarter of this year. An analysis of the Top 10 largest letting transactions in the quarter reveals net absorption of almost 70%. Four of the ten largest lettings in Q1 comprised companies expanding to larger premises; one was a brand new requirement while the remainder were companies relocating to larger premises.
There were 3 office investments sold in the capital during Q1, bringing the total investment spend on offices in Dublin during the quarter to €18.5 million, equating to 92% of the total investment spend in the city in the period.
Prime rents in the Dublin office market at the end of Q1 2012 were €296 per square metre and are now expected to stabilise at this level although there is expected to be further downward pressure on rents for non-prime buildings over the course of the year. Meanwhile, prime office yields in Dublin are now approximately 7.25%.
Dublin Gross Office take-Up Q1 2010 – Q1 2012
Quick Stats Q1
Hot Topics
• Office take-up in Dublin in the first quarter of 2012 reached 24,097m2, representing a decline of 51% compared to the same quarter last year
• There were 32 individual lettings signed in the quarter with most comprising relatively small transactions
• The vacancy rate in the capital stands at 22.9% at the end of Q1 having fallen slightly in the first three months of 2012
• Prime headline quoting rents in Dublin city centre are now approximately €296 per m2 and are expected to stabilise at this level
• More than 75% of lettings signed in Dublin in Q1 2012 were in the city centre
• There was a notable 71% increase in demand for new office premises in the capital quarter-on-quarter as a result of a number of new requirements being enacted
Change from previous quarter
Availability
Take-Up
Investment
Prime Rents
Yields
Demand
Source: CBRE
0
10,000
20,000
30,000
40,000
50,000
60,000
Q1 2010 Q2 2010 Q3 2010 Q4 2010 Q1 2011 Q2 2011 Q3 2011 Q4 2011 Q1 2012
City Centre Suburbs
Sq.M
.

0
10,000
20,000
30,000
40,000
50,000
60,000
Q1 2007 Q1 2008 Q1 2009 Q1 2010 Q1 2011 Q1 2012
Sq M
-
50,000
100,000
150,000
200,000
250,000
300,000
Dublin 2/4 Dublin 1/3/7 WestSuburbs
Dublin 6/8 IFSC
Sq M
Grade A Secondary In Need of Significant Refurbishment Georgian
SouthSuburbs
NorthSuburbs
Dublin Office availability Q1 2012
37%
17%
28%
14%
4%
Business Services
Financial Services
Computers/Hi-Tech
Manufacturing, Industrial& Energy
Consumer Services & Leisure
Dublin Gross Office take-up by Occupier type Q1 2012
Dublin Q1 Office take-Up 2007-2012
Q1
2012
Page 2
© 2012, CBRE
mar
ketv
iew
Dub
lin O
ffice There were 32 office lettings, extending to 24,097m2
signed in the Dublin office market during Q1 2012. 18,188m2 or 75.5% of overall office take-up in Q1 occurred in the city centre while the suburbs accounted for the remaining 24.5% or 5,909m2 of lettings signed in Dublin in the period.
14 of the 32 lettings signed in Dublin in the first three months of 2012 were to Irish companies accounting for 9,096m2 or 38% of letting activity between them; 11 lettings totalling 9,668m2 were to US companies which accounted for 40% of office take-up in Dublin during Q1 while there were 6 lettings totalling 5,148m2 equating to 21% of Q1 take-up to companies from other jurisdictions. There was only one letting signed in the city to a UK company accounting for 185m2 or 1.0% of take-up in the quarter.
Our research indicates that 32% of the office take-up in Q1 comprised lettings of smaller than 929m2 in size. 12% of the quantum of accommodation let in the period comprised lettings extending to between 929m2 and 1,858m2 in size while 57% of the quantum of office accommodation let occurred in lettings of between 1,858m2 and 4,645m2 in size. There were no lettings of more than 4,645m2 (50,000 sq ft) signed in Dublin in the first quarter of the year. Some of the more significant office lettings signed in Dublin during the period include the letting of 4,088m2 to Arvato at Blocks J and K at Eastpoint Business Park in Dublin 1; the letting of 2,959m2 to Google at Block P at Eastpoint and the letting of 2,539m2 to AIB at Hume House in Dublin 4.
The overall vacancy rate in the capital fell slightly to 22.9% in Q1.
Although there is a complete lack of new office development in Dublin, older office buildings which are being vacated in favour of newer alternatives continue to be added back into the vacant stock. In addition, many companies are attempting to sublet or assign excess accommodation at present and this is maintaining the overall level of availability at relatively high levels despite the underlying level of letting activity. According to our research, there was approximately 828,000m2 of office accommodation being marketed to let in the capital at the end of the first quarter of 2012.
Demand for office space in Dublin rose significantly in Q1 compared to the previous quarter as a result of some new requirements emerging. There was approximately 181,000m2 of outstanding requirements for office accommodation in Dublin at then end of the quarter, with almost 54% expressing a preference to locate in Dublin city centre.
Tenants in the business services sector accounted for the greatest proportion of office lettings signed in Dublin during Q1 2012, accounting for 37% of lettings in the capital in the period. The computers and high tech sector accounted for 28% of letting activity in the period. Tenants in the financial services sector accounted for 17% of lettings signed in Dublin during Q1 while manufacturing, industry and energy tenants accounted for a further 14% of letting activity in Dublin in the period. Interestingly, the public sector and professional companies signed no office lettings in Dublin in the first three months of 2012.

0
5,000
10,000
15,000
20,000
25,000
30,000
35,000
40,000
Q1 2010 Q2 2010 Q3 2010 Q4 2010 Q1 2011 Q2 2011 Q3 2011 Q4 2011 Q1 2012
Sq M
Dublin 1/3/7 Dublin 2/4 Dublin 6/8 IFSC
45%
22%
30%
1% 2%
Business Services
Financial Services
Computers/Hi-Tech
Manufacturing, Industrial& Energy
Consumer Services & Leisure
City Centre take-up Q1 2012 by tenant Category
200
300
400
500
600
700
Q1 2
008
Q2 2
008
Q3 2
008
Q4 2
008
Q1 2
009
Q2 2
009
Q3 2
009
Q4 2
009
Q1 2
010
Q2 2
010
Q3 2
010
Q4 2
010
Q1 2
011
Q2 2
011
Q3 2
011
Q3 2
012
Q4 2
012
Q1 2
012
673
296
Prime Headline Dublin Office rents Q1 2008 – Q1 2012
CIty Centre marKet
Take-up of some 18,188m2 was achieved in Dublin city centre during the first quarter of 2012, compared to 36,332m2 of lettings in this district in same quarter last year. There were 20 individual lettings signed in Dublin city centre in the three month period, 11 of which were located in the Dublin 2/4 district. In quantum terms, just over half of the office take-up signed in Dublin city centre during Q1 2012 was located in the Dublin 2 and Dublin 4 postcodes. Dublin 1/3/7 accounted for over 40% of city centre take-up in the quarter as a result of the two largest office lettings in the city in Q1 being located in Eastpoint in Dublin 1.
At the end of the quarter, the vacancy rate in Dublin city centre stood at 23%. There was approximately 488,000m2 of office accommodation being marketed to let in the city centre at the end of Q1, of which approximately 56% was located in the Dublin 2/4 postcode. Over 60% of all office accommodation being marketed to let in Dublin city centre is classified as Grade A although there are over 155 different instances of vacancy which suggests that most of this accommodation is relatively small.
According to our research, there is demand for just under 100,000m2 of office accommodation in Dublin city centre at the end of Q1 2012. This equates to just less than 54% of total outstanding requirements for office accommodation in the capital.
Business services tenants accounted for 45% of city centre take-up during Q1 2012 with computers/hi-tech occupiers and financial services companies accounting for a further 30% and 22% of city centre letting activity in the period respectively.
Prime quoting headline office rents in Dublin city centre stabilised at €296 per square metre during Q1, although rents in non-prime buildings are likely to continue to come under further pressure.
Q1 2012
Page 3
© 2012, CBRE
City Centre Office take-Up Q1 2010 – Q1 2012
marketv
iew D
ublin O
ffice
Headlines
• The city centre accounted for more than 75% of overall take-up in Dublin in Q1
• The city centre vacancy rate was 23% at the end of the first quarter while the vacancy rate in Dublin 2/4 was 16.8%
• The two largest office lettings in Dublin in Q1 were located in the Dublin 1/3/7 district in the city centre

0
2,000
4,000
6,000
8,000
10,000
12,000
14,000
16,000
18,000
Q1
20
10
Q2
20
10
Q3
20
10
Q4
20
10
Q1
20
11
Q2
20
11
Q3
20
11
Q4
20
11
Q1
20
12
Sq M
North Suburbs South Suburbs West Suburbs
0
5,000
10,000
15,000
20,000
25,000
Q1 2007 Q1 2008 Q1 2009 Q1 2010 Q1 2011 Q1 2012
Sq M
Suburban Q1 Office take-up 2007 - 2012
14%
21%54%
11%
Business Services
Computers/Hi-Tech
Manufacturing, Industrial& Energy
Consumer Services & Leisure
Suburban Office take-up by tenant Category Q1 2012
Suburban Office take-up Q1 2010 – Q1 2012
Q1
2012
Page 4
© 2012, CBRE
mar
ketv
iew
Dub
lin O
ffice SUBUrBan marKet
There were only 5,909m2 of lettings signed in the Dublin suburban office market in Q1 2012, which is a disappointing level of letting activity for this submarket. The south suburbs accounted for 52% of overall suburban office take-up in Dublin in the three month period. The west suburbs accounted for a further 25% of take-up in Q1 while the north suburbs accounted for the remaining 23%.
The most significant lettings signed in the suburbs in the first quarter of the year included the letting of 1,966m2 to Mylan in Newenham House in the north suburbs and the letting of 681m2 at Maple House in the south suburbs to Interaction.
There were 12 office lettings signed in the Dublin suburbs in Q1 2012. Business services tenants accounted for 14% of suburban take-up in Q1, while consumer services tenants accounted for 11% of suburban take-up in the quarter. Manufacturing, industry and energy tenants accounted for more than half of suburban take-up in the period, while computers/hi tech companies accounted for a further 21% of letting activity in the suburbs during Q1. There were no lettings to financial tenants or to public sector tenants in the suburbs in the first three months of 2012.
At the end of Q1 2012, total vacant office stock in the Dublin suburbs stood at approximately 340,000m2. Total vacant stock in the south suburbs stood at almost 147,000m2 in Q1 2012, bringing the vacancy rate there to 14.5%, compared to 14.0% at the end of Q4 2011. The vacancy rate in the suburbs overall also increased slightly quarter-on-quarter to 23.2%.
Demand for suburban office accommodation stood at over 83,000m2 as of the end of Q1 2012, compared to 27,000m2 the previous quarter following a number of large requirements being announced. Prime headline quoting rents for office accommodation in the south suburbs were in the order of €172 per square metre at the end of Q1 compared to €151 per square metre in the north suburbs and €134.50 per square metre in the west suburbs of the city.
Headlines
• Suburban take-up accounted for less than 25% of overall Dublin office letting activity in Q1
• Suburban take-up down more than 50% on a quarterly and annual basis in Q1 2012
• Strong increase in demand for suburban office accommodation quarter-on-quarter

0
500
1,000
1,500
2,000
2,500
3,000
3,500
4,000
4,500
Q2
2002
Q4
2002
Q2
2003
Q4
2003
Q2
2004
Q4
2004
Q2
2005
Q4
2005
Q2
2006
Q4
2006
Q2
2007
Q4
2007
Q2
2008
Q4
2008
Q2
2009
Q4
2009
Q2
2010
Q4
2010
Q2
2011
Q4
2011
(000
's) S
quar
e M
etre
s
Western Europe CEE
160
180
200
220
240
260
280
Dec
-02
Dec
-03
Dec
-04
Dec
-05
Dec
-06
Dec
-07
Dec
-08
Dec
-09
Dec
-10
Dec
-11
200
= Ja
nuar
y 20
00
-15%
-10%
-5%
0%
5%
10%
15%% Change pa Nominal Terms Index
eU Office rent Index Q4 2002 – Q4 2011
0
5
10
15
20
25
30
35
40
45
50
Kyiv
St P
eter
sbur
g
Sofia
Belg
rade
War
saw
Zagr
eb
Buch
ares
t
Brat
isla
va
Dub
lin
Buda
pest
Fran
kfur
t
Mos
cow
Prag
ue
Barc
elon
a
Am
ster
dam
Mad
rid
Mila
n
Dus
seld
orf
Lisb
on
Brus
sels
Ham
burg
Berl
in
Vie
nna
Lond
on C
ity
Mun
ich
Pari
s
Cop
enha
gen
Lond
on W
est
End
%
Development Pipeline to end 2013 Vacancy Rate Q4 2011
european vacancy & Supply Pipelines Q4 2011
eUrOPean OFFICe marKet
Total office take-up across Europe in the last quarter of 2011 was slightly up on the previous quarter and broadly stable on an annual basis. Overall gross take-up for the full year in 2011 was slightly down on the previous year. However, uncertainty about the economic outlook has been contributing to higher levels of caution among corporate occupiers and hindering leasing activity levels.
The availability of office accommodation across Europe continues to contract. The EU-27 vacancy rate dropped to 10.35% during Q4 2011, down from its peak of 10.46% in the first quarter of 2011. Although supply levels seem past their peak in most cities, weak occupier demand means that the absorption of vacant stock could be a very slow process despite completions running close to their historic lows or in the case of Dublin having come to a complete halt. This is also reflected in the uneven pattern of vacancies across different cities.
Prime office rents remain broadly flat across Europe for the third consecutive quarter in Q4. The CBRE EU-27 Office Rent Index grew by only 0.2% on the previous quarter and by only 1.0% year-on-year. Prime rents remained stable in almost all European markets in Q4 2011, while some cities are still seeing or expect to see some further reductions.
The volume of development completions has fallen sharply across Europe with no significant improvement in prospect over the next two years as weaker demand and weak rental growth, combined with limited access to funding continue to restrict speculative development across the region.
Q1 2012
Page 5
© 2012, CBRE
european Office take-Up Q2 2002 – Q4 2011
marketv
iew D
ublin O
ffice
Headlines
• Office take-up across Europe remains broadly stable although occupiers are unsettled by economic uncertainty
• Availability continues to contract across Europe, albeit slowly
• Prime rents broadly flat across Europe for the third consecutive quarter in Q4
• Development completions 45% below their cyclical peak in Western Europe
0.0
0.5
1.0
1.5
2.0
2.5
3.0
3.5
2003 2004 2005 2006 2007 2008 2009 2010 2011 Q1 2012
3.00
3.50
4.00
4.50
5.00
5.50
6.00
6.50
7.00
7.50
8.00
Lond
on -
Cen
tral -
Wes
tZu
rich
Gen
eva
Paris
Ile-
de-F
ranc
eSt
ockh
olm
Mun
ich
Ham
burg
Cop
enha
gen
Fran
kfur
tBe
rlin
Dus
seld
orf
Oslo
Vie
nna
Mila
nLo
ndon
- C
entra
l - C
ityA
mste
rdam
Hel
sink
iRo
me
Barc
elon
aM
adrid
Man
ches
ter
Birm
ingh
amEd
inbu
rgh
Gla
sgow
Brus
sels
War
saw
Prag
ueBu
dape
stD
ublin
Lisb
on
Current Yield Cyclical Low Cyclical High
Prime Office yields Q4 2011 vs High/low of Current Cycle
-20
-15
-10
-5
0
5
Dec
-08
Mar
-09
Jun-
09
Sep-0
9
Dec
-09
Mar
-10
Jun-
10
Sep-1
0
Dec
-10
Mar
-11
Jun-
11
Sep-1
1
Dec
-11
%
Total Returns Capital Value Growth
IPD Irish Capital value & total returns Q4 2008 – Q4 2011
Irish Investment Spend 2003 – Q1 2012
Q1
2012
Page 6
© 2012, CBRE
mar
ketv
iew
Dub
lin O
ffice
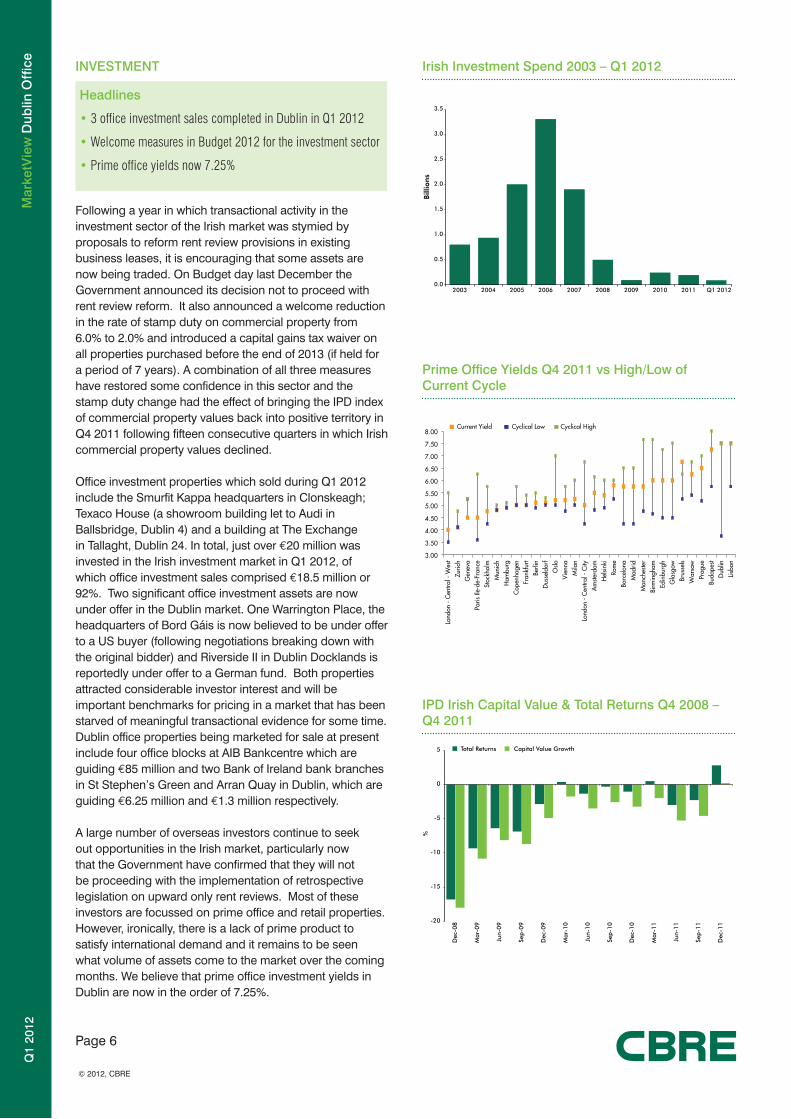
Headlines
• 3 office investment sales completed in Dublin in Q1 2012
• Welcome measures in Budget 2012 for the investment sector
• Prime office yields now 7.25%
InveStment
Following a year in which transactional activity in the investment sector of the Irish market was stymied by proposals to reform rent review provisions in existing business leases, it is encouraging that some assets are now being traded. On Budget day last December the Government announced its decision not to proceed with rent review reform. It also announced a welcome reduction in the rate of stamp duty on commercial property from 6.0% to 2.0% and introduced a capital gains tax waiver on all properties purchased before the end of 2013 (if held for a period of 7 years). A combination of all three measures have restored some confidence in this sector and the stamp duty change had the effect of bringing the IPD index of commercial property values back into positive territory in Q4 2011 following fifteen consecutive quarters in which Irish commercial property values declined.
Office investment properties which sold during Q1 2012 include the Smurfit Kappa headquarters in Clonskeagh; Texaco House (a showroom building let to Audi in Ballsbridge, Dublin 4) and a building at The Exchange in Tallaght, Dublin 24. In total, just over €20 million was invested in the Irish investment market in Q1 2012, of which office investment sales comprised €18.5 million or 92%. Two significant office investment assets are now under offer in the Dublin market. One Warrington Place, the headquarters of Bord Gáis is now believed to be under offer to a US buyer (following negotiations breaking down with the original bidder) and Riverside II in Dublin Docklands is reportedly under offer to a German fund. Both properties attracted considerable investor interest and will be important benchmarks for pricing in a market that has been starved of meaningful transactional evidence for some time. Dublin office properties being marketed for sale at present include four office blocks at AIB Bankcentre which are guiding €85 million and two Bank of Ireland bank branches in St Stephen’s Green and Arran Quay in Dublin, which are guiding €6.25 million and €1.3 million respectively.
A large number of overseas investors continue to seek out opportunities in the Irish market, particularly now that the Government have confirmed that they will not be proceeding with the implementation of retrospective legislation on upward only rent reviews. Most of these investors are focussed on prime office and retail properties. However, ironically, there is a lack of prime product to satisfy international demand and it remains to be seen what volume of assets come to the market over the coming months. We believe that prime office investment yields in Dublin are now in the order of 7.25%.
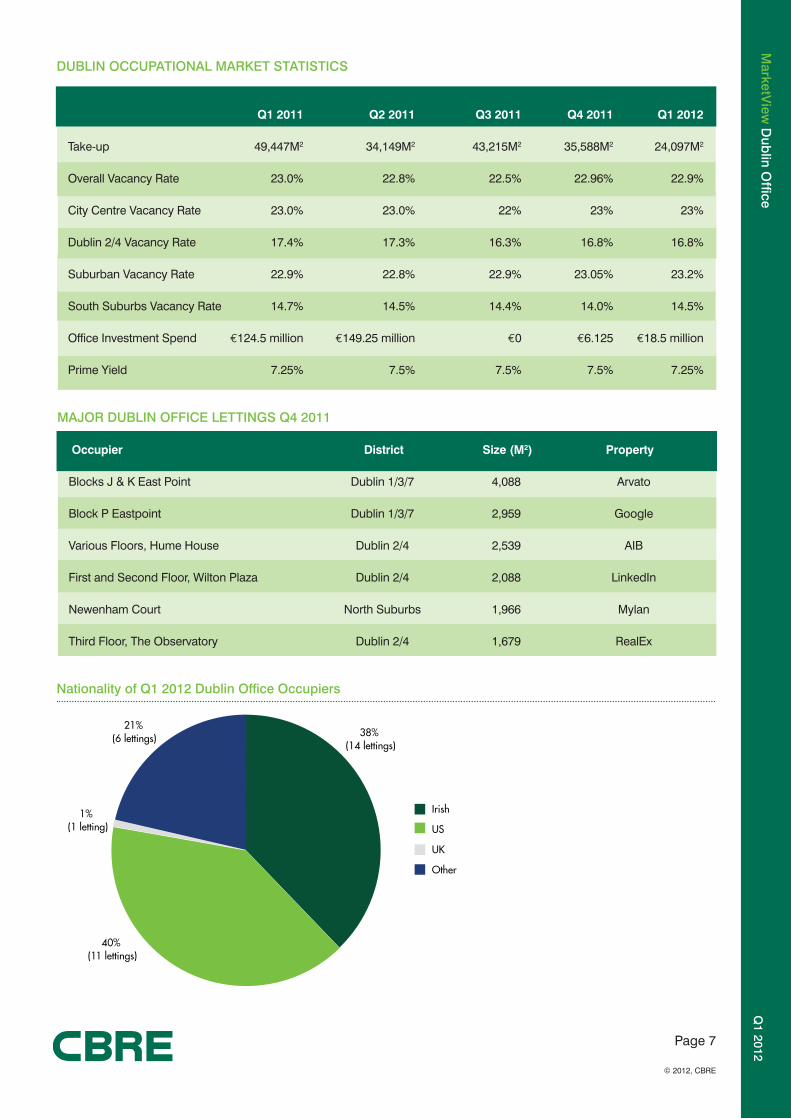
nationality of Q1 2012 Dublin Office Occupiers
21%(6 lettings)
1%(1 letting)
40%(11 lettings)
38%(14 lettings)
Irish
US
UK
Other
Q1 2012
Page 7
© 2012, CBRE
marketv
iew D
ublin O
ffice
DUBlIn OCCUPatIOnal marKet StatIStICS
Q1 2011 Q2 2011 Q3 2011 Q4 2011 Q1 2012
Take-up 49,447M2 34,149M2 43,215M2 35,588M2 24,097M2
Overall Vacancy Rate 23.0% 22.8% 22.5% 22.96% 22.9%
City Centre Vacancy Rate 23.0% 23.0% 22% 23% 23%
Dublin 2/4 Vacancy Rate 17.4% 17.3% 16.3% 16.8% 16.8%
Suburban Vacancy Rate 22.9% 22.8% 22.9% 23.05% 23.2%
South Suburbs Vacancy Rate 14.7% 14.5% 14.4% 14.0% 14.5%
Office Investment Spend €124.5 million €149.25 million €0 €6.125 €18.5 million
Prime Yield 7.25% 7.5% 7.5% 7.5% 7.25%
maJOr DUBlIn OFFICe lettInGS Q4 2011
Occupier District Size (M2) Property
Blocks J & K East Point Dublin 1/3/7 4,088 Arvato
Block P Eastpoint Dublin 1/3/7 2,959 Google
Various Floors, Hume House Dublin 2/4 2,539 AIB
First and Second Floor, Wilton Plaza Dublin 2/4 2,088 LinkedIn
Newenham Court North Suburbs 1,966 Mylan
Third Floor, The Observatory Dublin 2/4 1,679 RealEx

DISClaImer 2012 CBre
Information herein has been obtained from sources believed reliable. While we do not doubt its accuracy, we have not verified it and make no guarantee, warranty or representation about it. It is your responsibility to independently confirm its accuracy and completeness. Any projections, opinions, assumptions or estimates used are for example only and do not represent the current or future performance of the market.
This information is designed exclusively for use by CBRE clients, and cannot be reproduced without prior written permission of CBRE Ireland.
Managing DiRECtoRGuy Hollis
tEnant aDViSoRY SERViCES Paddy ConlonSarah Ward
oFFiCE agEnCYWillie DowlingAlan MoranPaddy Cormican
DEVELoPMEnt ConSULtanCYWesley Rothwell
CBREBurlington RoadDublin 4Irelandt: +353 1 618 5500
Marie Hunt Executive Director e: [email protected]
Elaine Linnane Database Managere: [email protected]
For more information regarding the MarketView, please contact:
CBre Dublin research
Suzanne Barrett Associate Director e: [email protected]
Q1
2012
Page 8
© 2012, CBRE
mar
ketv
iew
Dub
lin O
ffice
WE KNOW OFFICES FROM TOP TO BOTTOM
NO ONE KNOWS OFFICES QUITE LIKE
www.cbre.ie
To access market leading advice, talk to CBRE office agency today.