Q1 FY22 Earnings Slides - netapp.com
38
© 2021 NetApp, Inc. All rights reserved. Q1 FY22 Earnings Results August 25, 2021
Transcript of Q1 FY22 Earnings Slides - netapp.com

© 2021 NetApp, Inc. All rights reserved.
Q1 FY22 Earnings ResultsAugust 25, 2021

This presentation contains forward-looking statements and projections about our strategy, products and services, shareholder returns and our future results, performance or achievements, financial and otherwise. These statements and projections reflect management's current expectations, estimates and assumptions based on the information currently available to us and are not guarantees of future performance.
Actual results may differ materially from our statements or projections for a variety of reasons, including, without limitation, general global political, macroeconomic and market conditions, including the impact of the COVID-19 pandemic, changes in U.S. government spending, revenue seasonality and matters specific to our business, such as the impact of the COVID-19 pandemic on the company’s business operations, financial performance and results of operations, our ability to expand our total available market and grow our portfolio of products, customer demand for and acceptance of our products and services, our ability to successfully execute new business models, our ability to successfully execute on our data fabric strategy to generate profitable growth and stockholder return and our ability to manage our gross profit margins. These and other equally important factors that may affect our future results are described in reports and documents we file from time to time with the SEC, including the factors described under the section titled “Risk Factors” in our most recent filings on Form 10-K and Form 10-Q available at www.sec.gov. The forward-looking statements made in these presentations are being made as of the time and date of the live presentation. If these presentations are reviewed after the time and date of the live presentation, even if subsequently made available by us, on our website or otherwise, these presentations may not contain current or accurate information. Except as required by law, we disclaim any obligation to update or revise any forward-looking statement based on new information, future events or otherwise.
This presentation includes non-GAAP financial measures. Reconciliations of these measures to the comparable GAAP measures are available in the appendix to this presentation.
NetApp’s Investor Relations website at https://investors.netapp.com/investor-relations contains a significant amount of information about NetApp, including financial and other information for investors. NetApp encourages investors to visit that website from time to time as information is updated and new information is posted. The content of NetApp’s website is not incorporated by reference into this presentation, and any references to NetApp’s website are intended to be inactive textual references only.
© 2021 NetApp, Inc. All rights reserved.
Safe harbor

We are a global cloud-led,data-centric software company
that gives organizations everywhere the freedom to put data to work in the
applications that elevate their business
© 2021 NetApp, Inc. All rights reserved.

Cloudstorage
Compute operations
Cloudcontrols
Cloud servicesand analytics
Objectstorage
Converged and hybrid cloud infrastructure
Flash andhybrid storage
Protectionand security
Enterprisesolutions
© 2021 NetApp, Inc. All rights reserved.
Our solutions address crucial workloads in the cloud and on premises
Bring the simplicity and flexibility of cloud to the enterprise data center
Bring enterprise data services to the public cloud
AI anddata lakes
Enterpriseworkloads
Data protection
Virtualization/Container
Cloudoperations
Costoptimization
• Data-centric software specialist
• Trusted by the world’s leading organizations
• Unique partnerships with the biggest public clouds
• Differentiated data fabric strategy
• Strong business model
• Proven track record of turning market transitions into competitive advantage
© 2021 NetApp, Inc. All rights reserved.
Strategic approach with focused execution for growth
Aligned to customer imperatives
Strong business model
Technology and innovation leadership
Building on a strong foundation

© 2021 NetApp, Inc. All rights reserved.
Market leaders across diverse industries rely on NetApp
Media
Financialservices
10
9
Healthcare
Aerospace and defense
Oil and gas
10
10
9
Life science
Construction
Telcos
10
5
10
Hi-tech
Retailers
Automotive
10
10
9
Software and IT
Businessservices
Insurance
10
9
8 10
10
8
Manufacturers
Transportation
Consumerproduct
X of the top 10 companies in their industries use NetApp
Source: NetApp Market Intelligence, December 2020; includes software, systems, and cloud services customers.

© 2021 NetApp, Inc. All rights reserved.
Software leadership
Cloud-led, data-centric software company building on a rich
legacy of software innovation
Trusted relationships
Partnerships with the world’s leading enterprises and public clouds
Uniquely positioned
Well positioned to capture transitions in large and
growing markets
Shareholdervalue
Disciplined OPEX management while investing for growth with
sustained capital returns
Software franchise
Software and cloud focused business model drives
recurring revenue
Focused execution
Grow storage software and systems to gain share and scale
cloud services
© 2021 NetApp, Inc. All rights reserved.
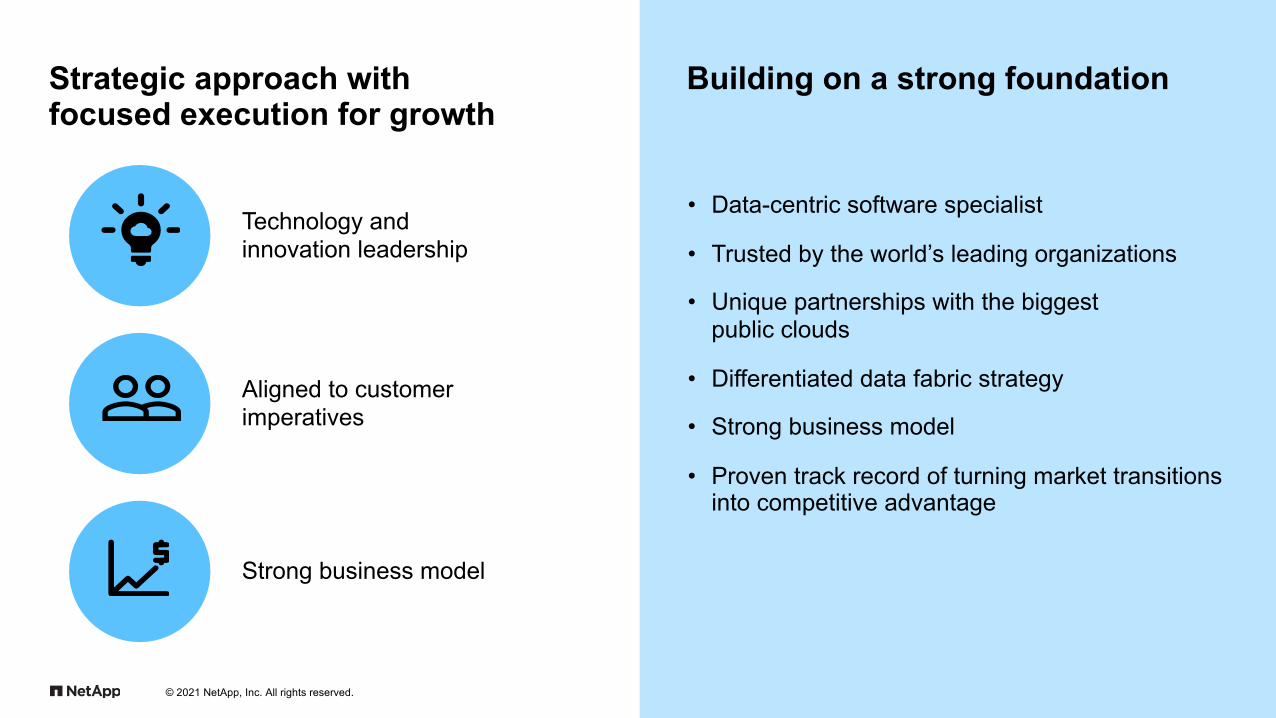
Results highlights
• Delivered a strong start to FY22 with double digit billings and revenue growth driven by broad-based strength
• Continued strength and momentum with All-Flash Arrays and Public Cloud services
• Introduced significant innovation across Hybrid Cloud and Public Cloud portfolios
• Advanced Keystone Flex Subscription, our Storage-as-a-Service offering, to further simplify hybrid cloud consumption and operations
• Recognized by Microsoft as the Global Customer Experience Partner of the Year and US SAP on Azure Partner of the Year

© 2021 NetApp, Inc. All rights reserved.
Q1 FY22 summary
Q1 guidance (as of June 2, 2021)
Q1 actual
Billings* $1.38B+20.2% y/y
Revenue $1.37B – $1.47B $1.46B+11.9% y/y ✅
Non-GAAP gross margin ~ 68% 69.3%+130 bps y/y ✅
Non-GAAP operating margin 19% – 20% 23.0%+670 bps y/y ✅
Non-GAAP EPS $0.89 – $0.97 $1.15+57.5% y/y ✅
Non-GAAP FCF margin 13.1%
Capital returns* $212M*Billings is a Non-GAAP measure. Refer to appendix for details on these Non-GAAP measures and a reconciliation between Non-GAAP and GAAP numbers. Capital returns are the sum of cash dividends and share repurchases.

© 2021 NetApp, Inc. All rights reserved.
Billings
$1.1B
$1.5B$1.6B
$1.7B
$1.4B
Q1 FY21 Q2 FY21 Q3 FY21 Q4 FY21 Q1 FY22
Billings
20% Y/Y
Billings is a Non-GAAP measure. Refer to appendix for details and a reconciliation between Non-GAAP and GAAP numbers.

© 2021 NetApp, Inc. All rights reserved.
Revenues
Q1 FY21 Q2 FY21 Q3 FY21 Q4 FY21 Q1 FY22
$1.3B
$1.5B$1.6B
$1.4B
12% Y/Y
$1.5B
Services revenue Product revenue

© 2021 NetApp, Inc. All rights reserved.
Non-GAAP gross margin
Non-GAAP gross margin dollars Non-GAAP gross margin
$886M$948M
$990M$1,046M $1,010M
Q1 FY21 Q2 FY21 Q3 FY21 Q4 FY21 Q1 FY22
68.0%
66.9%67.3% 67.3%
69.3%
Q1 FY21 Q2 FY21 Q3 FY21 Q4 FY21 Q1 FY22
Refer to appendix for a reconciliation between Non-GAAP and GAAP numbers

© 2021 NetApp, Inc. All rights reserved.
Segment revenue and gross margin
Hybrid Cloud Public Cloud
Segment revenue Segment gross marginIn the first quarter of fiscal 2022, the company introduced two segments for financial reporting purposes: Hybrid Cloud and Public Cloud. A reconciliation of segment gross profit, which does not include stock-based compensation or amortization of intangibles, to consolidated gross profit in included in the appendix.
$1,272M$1,369M
$1,415M$1,489M
$1,379M
Q1 FY21 Q2 FY21 Q3 FY21 Q4 FY21 Q1 FY22
$31M
$47M
$55M
$66M
$79M
Q1 FY21 Q2 FY21 Q3 FY21 Q4 FY21 Q1 FY22
58.1%
66.0%
69.1%71.2% 70.9%
68.2%67.0% 67.3% 67.1%
69.2%
© 2021 NetApp, Inc. All rights reserved.
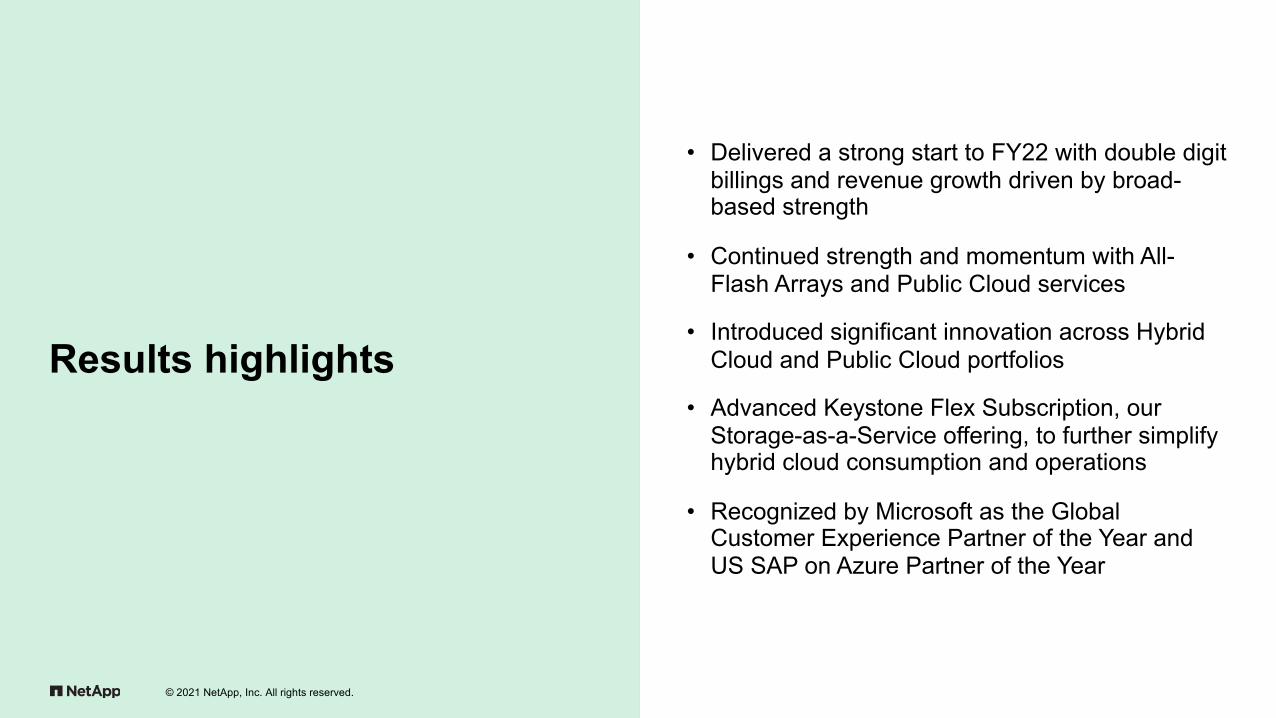
All flash array annualized revenue run rate
$2.3B$2.5B
$2.6B$2.9B $2.8B
Q1 FY21 Q2 FY21 Q3 FY21 Q4 FY21 Q1 FY22
All flash array annualized revenue run rate
23% Y/Y
AFA annualized net revenue run rate is determined by products and services revenue for the current period, multiplied by 4

© 2021 NetApp, Inc. All rights reserved.
Public Cloud ARR
$178M$216M
$237M
$301M
$337M
Q1 FY21 Q2 FY21 Q4 FY21 Q1 FY22Q3 FY21
Public Cloud ARR
89% Y/Y
Public cloud annualized revenue run-rate is calculated as the annualized value of all Public Cloud customer commitments with the assumption that any commitment expiring during the next 12 months will be renewed with its existing term
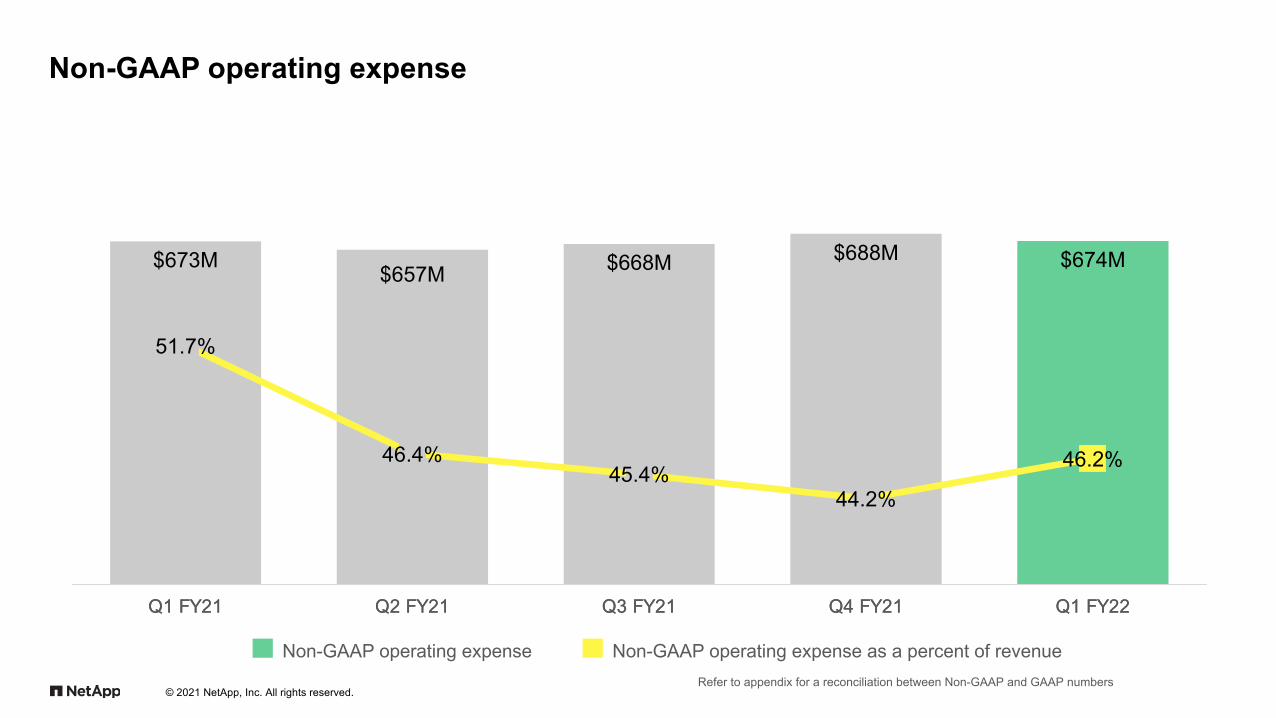
Non-GAAP operating expense
© 2021 NetApp, Inc. All rights reserved.
Non-GAAP operating expense Non-GAAP operating expense as a percent of revenueRefer to appendix for a reconciliation between Non-GAAP and GAAP numbers
$673M $657M $668M $688M $674M
Q1 FY21 Q2 FY21 Q3 FY21 Q4 FY21 Q1 FY22
51.7%
46.4%45.4%
44.2%
46.2%
Q1 FY21 Q2 FY21 Q3 FY21 Q4 FY21 Q1 FY22
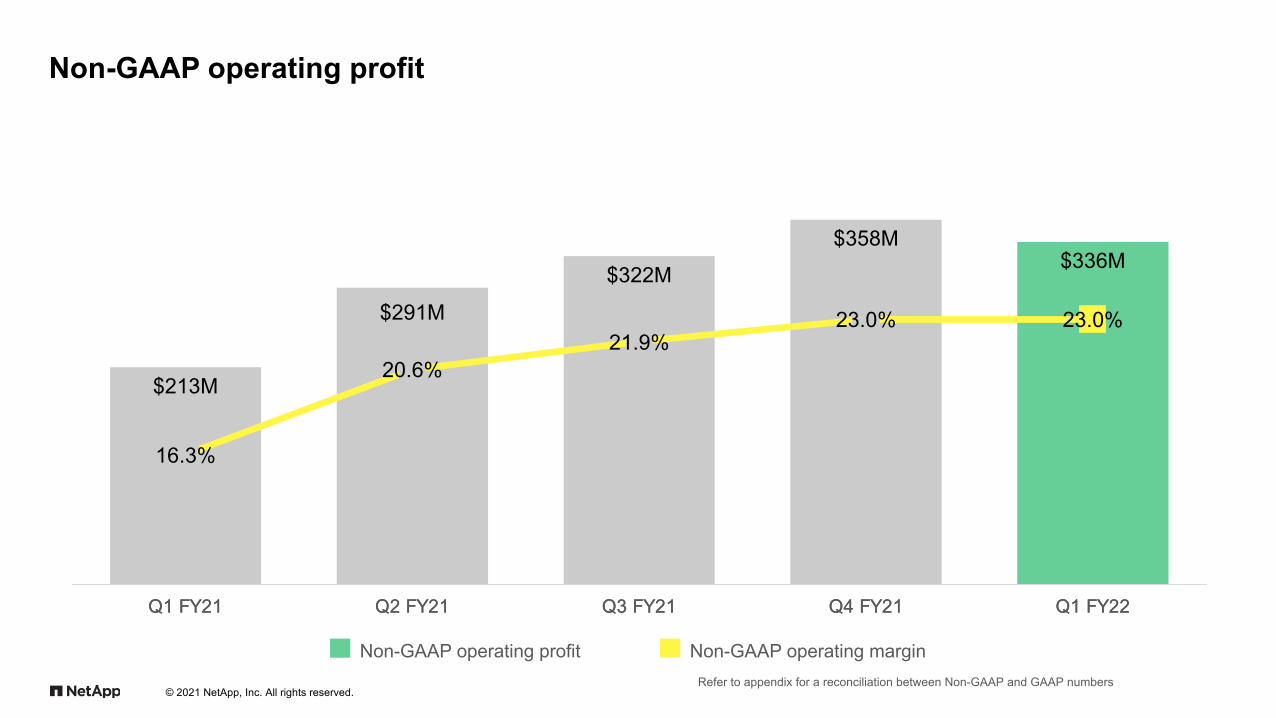
Non-GAAP operating profit
© 2021 NetApp, Inc. All rights reserved.
Non-GAAP operating profit Non-GAAP operating marginRefer to appendix for a reconciliation between Non-GAAP and GAAP numbers
$213M
$291M
$322M
$358M$336M
Q1 FY21 Q2 FY21 Q3 FY21 Q4 FY21 Q1 FY22
16.3%
20.6%21.9%
23.0% 23.0%
Q1 FY21 Q2 FY21 Q3 FY21 Q4 FY21 Q1 FY22

© 2021 NetApp, Inc. All rights reserved.
Non-GAAP earnings per share
$0.73
$1.05$1.10
$1.17 $1.15
Q1 FY21 Q2 FY21 Q3 FY21 Q4 FY21 Q1 FY22
58% Y/Y
Non-GAAP earnings per shareRefer to appendix for a reconciliation between Non-GAAP and GAAP numbers
© 2021 NetApp, Inc. All rights reserved.
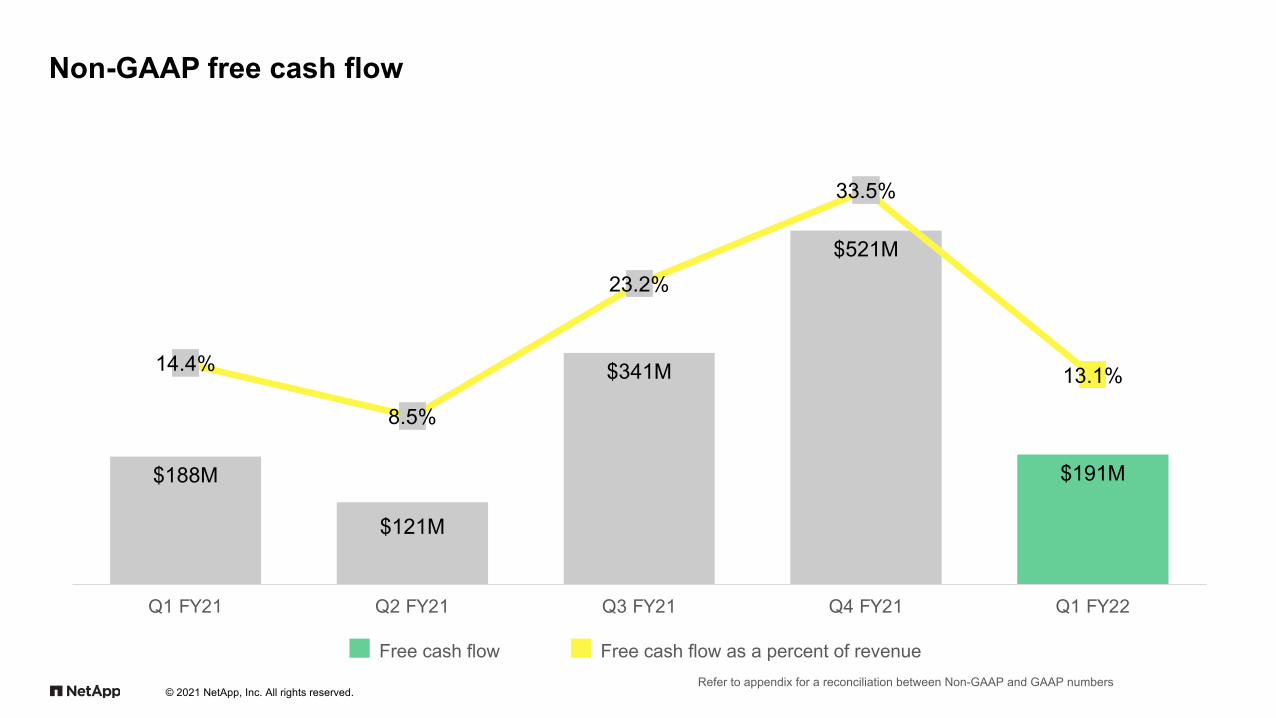
Non-GAAP free cash flow
Free cash flow Free cash flow as a percent of revenue
$188M
$121M
$341M
$521M
$191M
Q1 FY21 Q2 FY21 Q3 FY21 Q4 FY21 Q1 FY22
14.4%
8.5%
23.2%
33.5%
13.1%
Refer to appendix for a reconciliation between Non-GAAP and GAAP numbers

Deferred revenue
© 2021 NetApp, Inc. All rights reserved.
Deferred revenue balance Deferred revenue y/y growth
$3.6B $3.7B$3.8B
$4.0B $3.9B
Q1 FY21 Q2 FY21 Q3 FY21 Q4 FY21 Q1 FY22
3.1%
5.3%
7.1%8.2% 7.8%
Q1 FY21 Q2 FY21 Q3 FY21 Q4 FY21 Q1 FY22
© 2021 NetApp, Inc. All rights reserved.
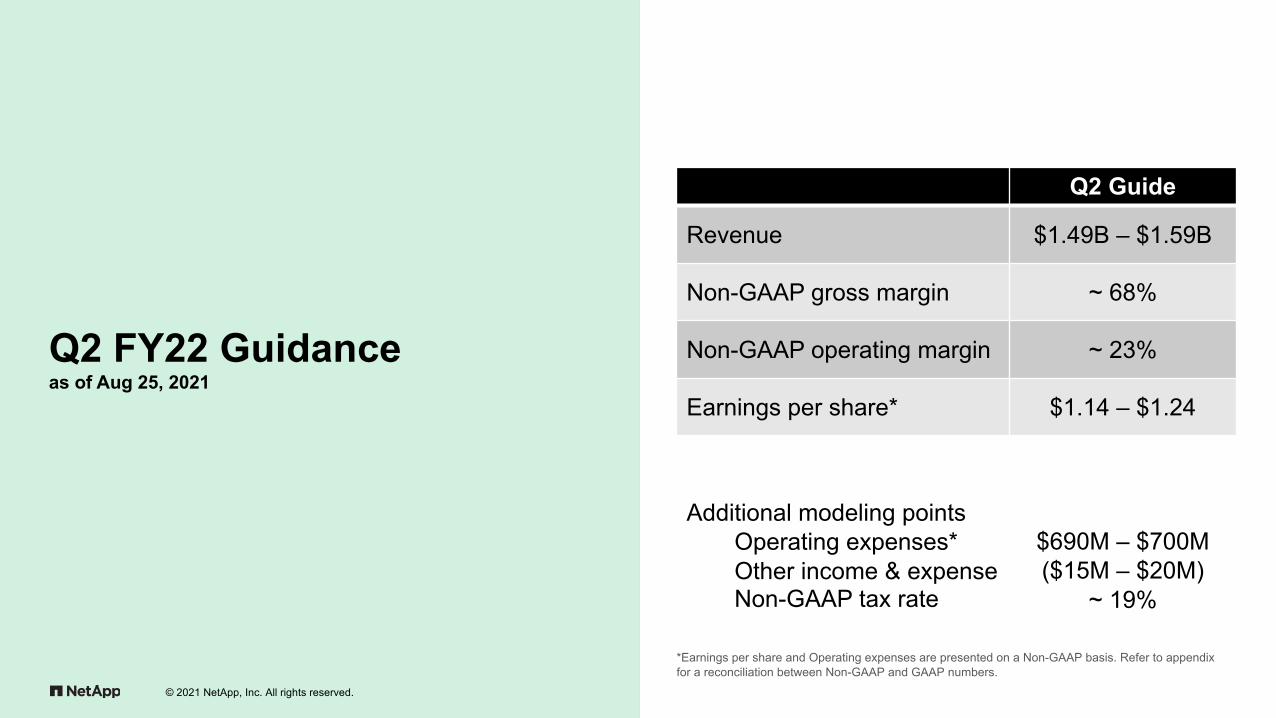
Q2 Guide
Revenue $1.49B – $1.59B
Non-GAAP gross margin ~ 68%
Non-GAAP operating margin ~ 23%
Earnings per share* $1.14 – $1.24
Additional modeling pointsOperating expenses*Other income & expenseNon-GAAP tax rate
$690M – $700M($15M – $20M)
~ 19%
Q2 FY22 Guidanceas of Aug 25, 2021
*Earnings per share and Operating expenses are presented on a Non-GAAP basis. Refer to appendix for a reconciliation between Non-GAAP and GAAP numbers.

© 2021 NetApp, Inc. All rights reserved.
FY22 Guide
Revenue + 8% – 9% y/y
Non-GAAP gross margin ~ 68%
Non-GAAP operating margin 23% – 24%
Earnings per share* $4.85 – $5.05
Additional modeling pointsPublic Cloud ARROperating expenses*Other income & expenseNon-GAAP tax rate
$450M – $500M$2.75B – $2.80B($60M – $65M)
~ 19%
Updated FY22 Guidanceas of Aug 25, 2021
*Earnings per share and operating expenses are presented on a Non-GAAP basis. Refer to appendixfor a reconciliation between Non-GAAP and GAAP numbers.

© 2021 NetApp, Inc. All rights reserved.
Appendix: Supplementary Tables and Non-GAAP to GAAP Reconciliations & Explanations
© 2021 NetApp, Inc. All rights reserved.
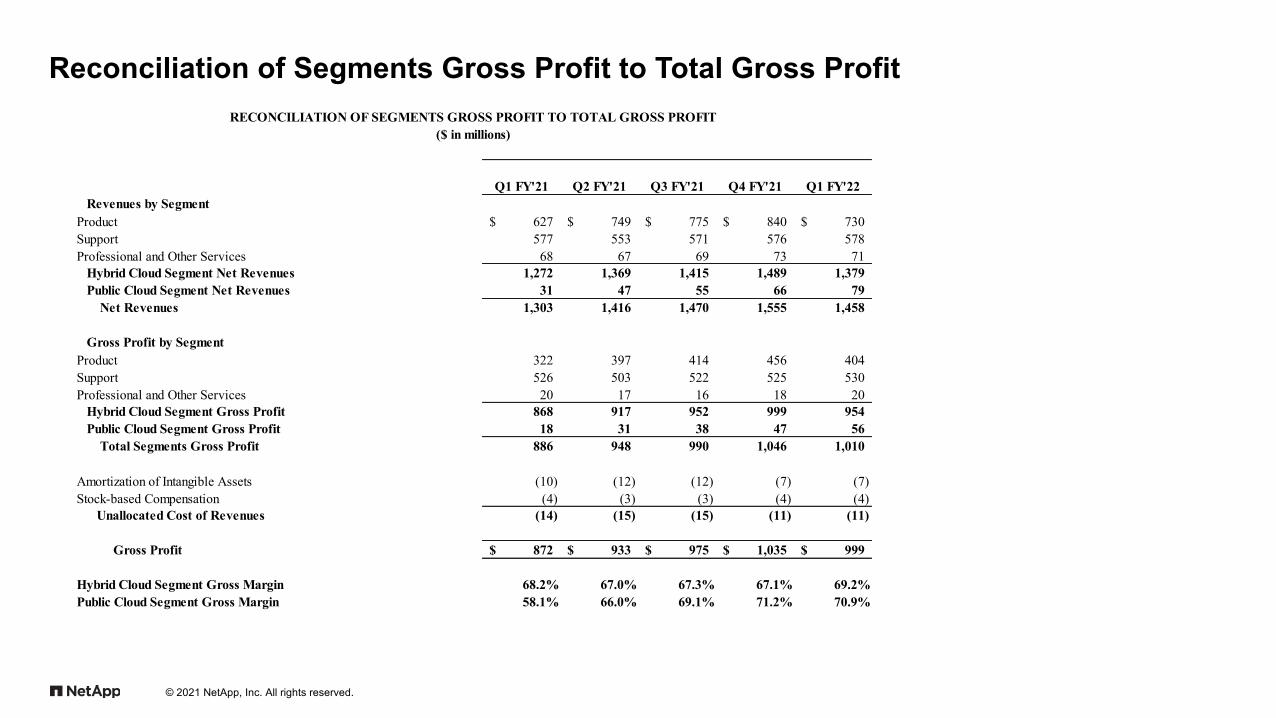
Reconciliation of Segments Gross Profit to Total Gross Profit
Q1 FY'21 Q2 FY'21 Q3 FY'21 Q4 FY'21 Q1 FY'22Revenues by Segment
Product 627$ 749$ 775$ 840$ 730$ Support 577 553 571 576 578 Professional and Other Services 68 67 69 73 71 Hybrid Cloud Segment Net Revenues 1,272 1,369 1,415 1,489 1,379 Public Cloud Segment Net Revenues 31 47 55 66 79 Net Revenues 1,303 1,416 1,470 1,555 1,458
Gross Profit by SegmentProduct 322 397 414 456 404 Support 526 503 522 525 530 Professional and Other Services 20 17 16 18 20 Hybrid Cloud Segment Gross Profit 868 917 952 999 954 Public Cloud Segment Gross Profit 18 31 38 47 56 Total Segments Gross Profit 886 948 990 1,046 1,010
Amortization of Intangible Assets (10) (12) (12) (7) (7) Stock-based Compensation (4) (3) (3) (4) (4) Unallocated Cost of Revenues (14) (15) (15) (11) (11)
Gross Profit 872$ 933$ 975$ 1,035$ 999$
Hybrid Cloud Segment Gross Margin 68.2% 67.0% 67.3% 67.1% 69.2%Public Cloud Segment Gross Margin 58.1% 66.0% 69.1% 71.2% 70.9%
($ in millions)RECONCILIATION OF SEGMENTS GROSS PROFIT TO TOTAL GROSS PROFIT
Dollar-based net revenue retention rate (DBNRR) for cloud services is a Non-GAAP metric calculated by dividing the approximate total revenue from our cloud customer base at the end of a period (“Cloud Current Period revenue”) by the approximate revenue of the same group of customers at the beginning of that 12-month period. Cloud Current Period revenue includes existing customer renewals and expansion, is net of existing customer contraction and churn, and excludes new customers. Amounts used in the calculation of DBNRR differ from revenues recognized in accordance with US GAAP as they are derived from contract values prior to the reallocation of total contract value across all performance obligations based on relative standalone selling price, as required by ASC 606.
© 2021 NetApp, Inc. All rights reserved.
Dollar-based net revenue retention rate for cloud services (Non-GAAP)
© 2021 NetApp, Inc. All rights reserved.
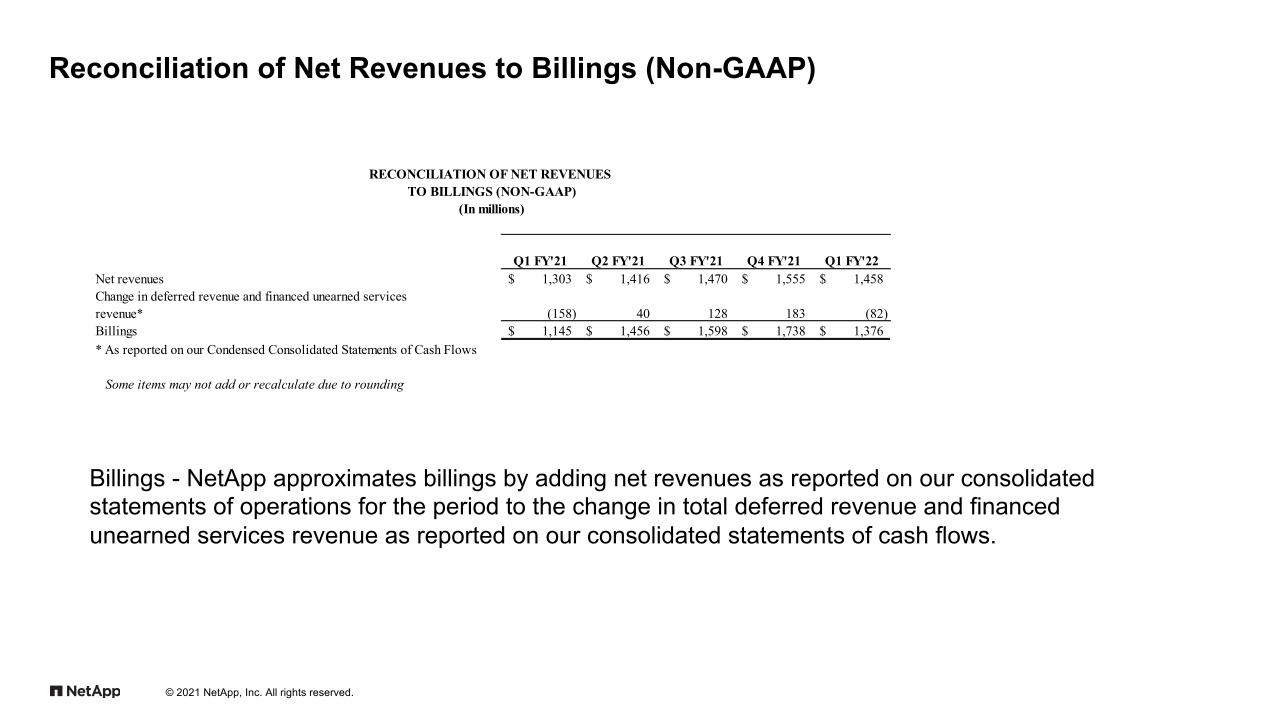
Reconciliation of Net Revenues to Billings (Non-GAAP)
Billings - NetApp approximates billings by adding net revenues as reported on our consolidated statements of operations for the period to the change in total deferred revenue and financed unearned services revenue as reported on our consolidated statements of cash flows.
Q1 FY'21 Q2 FY'21 Q3 FY'21 Q4 FY'21 Q1 FY'22Net revenues 1,303$ 1,416$ 1,470$ 1,555$ 1,458$ Change in deferred revenue and financed unearned services revenue* (158) 40 128 183 (82) Billings 1,145$ 1,456$ 1,598$ 1,738$ 1,376$ * As reported on our Condensed Consolidated Statements of Cash Flows
Some items may not add or recalculate due to rounding
RECONCILIATION OF NET REVENUES TO BILLINGS (NON-GAAP)
(In millions)

© 2021 NetApp, Inc. All rights reserved.
Reconciliation of Non-GAAP to GAAP Gross Profit and Gross Margin
Q1 FY'21 Q2 FY'21 Q3 FY'21 Q4 FY'21 Q1 FY'22NET REVENUES 1,303$ 1,416$ 1,470$ 1,555$ 1,458$
GROSS PROFIT 872$ 933$ 975$ 1,035$ 999$ Adjustments:
Amortization of intangible assets 10 12 12 7 7 Stock-based compensation 4 3 3 4 4
NON-GAAP GROSS PROFIT 886$ 948$ 990$ 1,046$ 1,010$
Gross margin-GAAP 66.9% 65.9% 66.3% 66.6% 68.5%Adjustments 1.1% 1.1% 1.0% 0.7% 0.8%
Gross margin-Non-GAAP 68.0% 66.9% 67.3% 67.3% 69.3%
RECONCILIATION OF NON-GAAP TO GAAPGROSS PROFIT AND GROSS MARGIN
($ in millions)
© 2021 NetApp, Inc. All rights reserved.
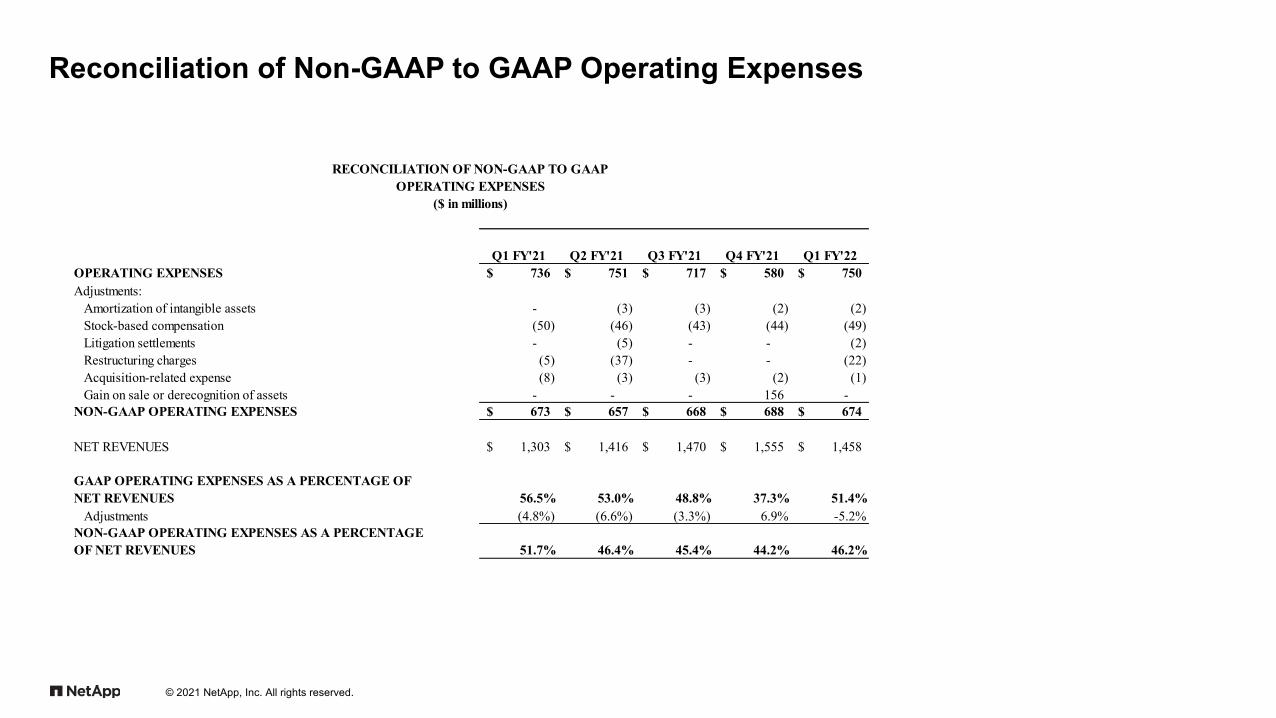
Reconciliation of Non-GAAP to GAAP Operating Expenses
Q1 FY'21 Q2 FY'21 Q3 FY'21 Q4 FY'21 Q1 FY'22OPERATING EXPENSES 736$ 751$ 717$ 580$ 750$ Adjustments:
Amortization of intangible assets - (3) (3) (2) (2) Stock-based compensation (50) (46) (43) (44) (49) Litigation settlements - (5) - - (2) Restructuring charges (5) (37) - - (22) Acquisition-related expense (8) (3) (3) (2) (1) Gain on sale or derecognition of assets - - - 156 -
NON-GAAP OPERATING EXPENSES 673$ 657$ 668$ 688$ 674$
NET REVENUES 1,303$ 1,416$ 1,470$ 1,555$ 1,458$
GAAP OPERATING EXPENSES AS A PERCENTAGE OF NET REVENUES 56.5% 53.0% 48.8% 37.3% 51.4%
Adjustments (4.8%) (6.6%) (3.3%) 6.9% -5.2%NON-GAAP OPERATING EXPENSES AS A PERCENTAGE OF NET REVENUES 51.7% 46.4% 45.4% 44.2% 46.2%
RECONCILIATION OF NON-GAAP TO GAAPOPERATING EXPENSES
($ in millions)

© 2021 NetApp, Inc. All rights reserved.
Reconciliation of Non-GAAP to GAAP Income from Operations
Q1 FY'21 Q2 FY'21 Q3 FY'21 Q4 FY'21 Q1 FY'22INCOME FROM OPERATIONS 136$ 182$ 258$ 455$ 249$ Adjustments:
Amortization of intangible assets 10 15 15 9 9 Stock-based compensation 54 49 46 48 53 Asset impairment - - - - - Litigation settlements - 5 - - 2 COVID-19 charges - - - - - Restructuring charges 5 37 - - 22 Acquisition-related expense 8 3 3 2 1 Gain on sale or derecognition of assets - - - (156) -
NON-GAAP INCOME FROM OPERATIONS 213$ 291$ 322$ 358$ 336$
NET REVENUES 1,303$ 1,416$ 1,470$ 1,555$ 1,458$
GAAP INCOME FROM OPERATIONS AS A PERCENTAGE OF NET REVENUES 10.4% 12.9% 17.6% 29.3% 17.1%
Adjustments 5.9% 7.7% 4.4% -6.2% 6.0%NON-GAAP INCOME FROM OPERATIONS AS A PERCENTAGE OF NET REVENUES 16.3% 20.6% 21.9% 23.0% 23.0%
RECONCILIATION OF NON-GAAP TO GAAPINCOME FROM OPERATIONS
($ in millions)

© 2021 NetApp, Inc. All rights reserved.
Reconciliation of Non-GAAP to GAAP Net Income per Share
Q1 FY'21 Q2 FY'21 Q3 FY'21 Q4 FY'21 Q1 FY'22NET INCOME PER SHARE 0.35$ 0.61$ 0.80$ 1.46$ 0.88$ Adjustments:
Amortization of intangible assets 0.05 0.07 0.07 0.04 0.04 Stock-based compensation 0.24 0.22 0.20 0.21 0.23 Litigation settlements - 0.02 - - 0.01 Restructuring charges 0.02 0.17 - - 0.10 Acquisition-related expense 0.04 0.01 0.01 0.01 0.00 Gain on sale or derecognition of assets - - - (0.68) - Debt extinguishment costs 0.06 - - - - Gain on sale of equity investment - (0.03) - - - Income tax effects (0.07) (0.04) (0.06) 0.08 (0.11) Income tax expenses from integration of acquired companies 0.05 0.02 0.07 0.06 -
NON-GAAP NET INCOME PER SHARE 0.73$ 1.05$ 1.10$ 1.17$ 1.15$
Diluted Shares 229
Note: GAAP and Non-GAAP Net Income Per Share were computed using the Diluted number of shares Some items may not add or recalculate due to rounding
RECONCILIATION OF NON-GAAP TO GAAPNET INCOME PER SHARE

© 2021 NetApp, Inc. All rights reserved.
Reconciliation of Net Cash Provided by (Used In) Operating Activities to Free Cash Flow (Non-GAAP)
Free cash flow is calculated as net cash provided by operating activities less purchases of property and equipment.
Q1 FY'21 Q2 FY'21 Q3 FY'21 Q4 FY'21 Q1 FY'22Net cash provided by (used in) operating activities 240$ 161$ 373$ 559$ 242$ Purchases of property and equipment (52) (40) (32) (38) (51) Free cash flow 188$ 121$ 341$ 521$ 191$
NET REVENUES 1,303$ 1,416$ 1,470$ 1,555$ 1,458$
FREE CASH FLOWS AS A PERCENTAGE OF NET REVENUES 14.4% 8.5% 23.2% 33.5% 13.1%
RECONCILIATION OF NET CASH PROVIDED BY (USED IN) OPERATING ACTIVITIESTO FREE CASH FLOW (NON-GAAP)
(In millions)

© 2021 NetApp, Inc. All rights reserved.
Reconciliation of Non-GAAP Guidance to GAAP - Second Quarter Fiscal 2022
Second Quarter Fiscal 2022
Gross Margin - Non-GAAP Guidance ~68%Adjustment:
Cost of revenues adjustments (1)%Gross Margin - GAAP Guidance ~67%
Second Quarter Fiscal 2022(In millions)
Operating Expenses - Non-GAAP Guidance $690 - $700Adjustments:
Amortization of intangibles $2Stock-based compensation expense $54
Operating Expenses - GAAP Guidance $746 - $756
Second Quarter Fiscal 2022
Operating Margin - Non-GAAP Guidance ~23%Adjustments:
Amortization of intangible assets (1)%Stock-based compensation expense (4)%
Operating Margin - GAAP Guidance ~19%
NETAPP, INC.RECONCILIATION OF NON-GAAP GUIDANCE TO GAAP
SECOND QUARTER FISCAL 2022(Unaudited)

© 2021 NetApp, Inc. All rights reserved.
Reconciliation of Non-GAAP Guidance to GAAP - Second Quarter Fiscal 2022, continued
Second Quarter Fiscal 2022
Net Income Per Share - Non-GAAP Guidance $1.14 - $1.24Adjustments:
Amortization of intangible assets ($0.04)Stock-based compensation expense ($0.25)Income tax effects $0.03
Net Income Per Share - GAAP Guidance $0.88 - $0.98
Second Quarter Fiscal 2022
Effective Tax Rate - Non-GAAP Guidance ~19%Adjustment:
Income tax effects 2%Effective Tax Rate - GAAP Guidance ~21%
SECOND QUARTER FISCAL 2021(Unaudited)
NETAPP, INC.RECONCILIATION OF NON-GAAP GUIDANCE TO GAAP

© 2021 NetApp, Inc. All rights reserved.
Reconciliation of Non-GAAP Guidance to GAAP - Fiscal 2022
Fiscal 2022
Gross Margin - Non-GAAP Guidance ~68%Adjustment:
Cost of revenues adjustments (1)%Gross Margin - GAAP Guidance ~67%
Fiscal 2022(In millions)
Operating Expenses - Non-GAAP Guidance $2,750 - $2,800Adjustments:
Amortization of intangibles $9Stock-based compensation expense $209
Operating Expenses - GAAP Guidance $2,968 - $3,018
Fiscal 2022
Operating Margin - Non-GAAP Guidance 23% - 24%Adjustments:
Amortization of intangible assets (1)%Stock-based compensation expense (4)%
Operating Margin - GAAP Guidance 18% - 19%
NETAPP, INC.RECONCILIATION OF NON-GAAP GUIDANCE TO GAAP
FISCAL 2022(Unaudited)

© 2021 NetApp, Inc. All rights reserved.
Reconciliation of Non-GAAP Guidance to GAAP - Quarter Fiscal 2022, continued
Fiscal 2022
Net Income Per Share - Non-GAAP Guidance $4.85 - $5.05Adjustments:
Amortization of intangible assets ($0.16)Stock-based compensation expense ($0.98)Income tax effects $0.12
Net Income Per Share - GAAP Guidance $3.83 - $4.03
Fiscal 2022
Effective Tax Rate - Non-GAAP Guidance ~19%Adjustment:
Income tax effects 2%Effective Tax Rate - GAAP Guidance ~21%
FISCAL 2022(Unaudited)
NETAPP, INC.RECONCILIATION OF NON-GAAP GUIDANCE TO GAAP

© 2021 NetApp, Inc. All rights reserved.
Reconciliation of Non-GAAP Guidance to GAAP - First Quarter Fiscal 2022
First Quarter Fiscal 2022
Gross Margin - Non-GAAP Guidance ~68%Adjustment:
Cost of revenues adjustments (1)%Gross Margin - GAAP Guidance ~67%
First Quarter Fiscal 2022(In millions)
Operating Expenses - Non-GAAP Guidance $680 - $690Adjustments:
Amortization of intangibles $2Stock-based compensation expense $44
Operating Expenses - GAAP Guidance $726 - $736
First Quarter Fiscal 2022
Operating Margin - Non-GAAP Guidance 19% - 20%Adjustments:
Amortization of intangible assets (1)%Stock-based compensation expense (3)%
Operating Margin - GAAP Guidance 15% - 16%
NETAPP, INC.RECONCILIATION OF NON-GAAP GUIDANCE TO GAAP
FIRST QUARTER FISCAL 2022(Unaudited)

© 2021 NetApp, Inc. All rights reserved.
Reconciliation of Non-GAAP Guidance to GAAP - First Quarter Fiscal 2022, continued
First Quarter Fiscal 2022
Net Income Per Share - Non-GAAP Guidance $0.89 - $0.97Adjustments:
Amortization of intangible assets ($0.04)Stock-based compensation expense ($0.20)Income tax effects $0.04
Net Income Per Share - GAAP Guidance $0.69 - $0.77
First Quarter Fiscal 2022
Effective Tax Rate - Non-GAAP Guidance ~19%Adjustment:
Income tax effects 1%Effective Tax Rate - GAAP Guidance ~20%
RECONCILIATION OF NON-GAAP GUIDANCE TO GAAPFIRST QUARTER FISCAL 2022
(Unaudited)
NETAPP, INC.

© 2021 NetApp, Inc. All rights reserved.
NetApp unlocks the best of cloud