
Q1 FY2018 Results - Phoenix Ltd.thephoenixmills.com/PMLQ1FY18ResultsPresentation.pdf · that could...
78
Transcript of Q1 FY2018 Results - Phoenix Ltd.thephoenixmills.com/PMLQ1FY18ResultsPresentation.pdf · that could...
Q1 FY2018 Results

Disclaimer
Certain statements in this communication may be ‘forward looking statements’ within the meaning of applicable
laws and regulations. These forward-looking statements involve a number of risks, uncertainties and other factors
that could cause actual results to differ materially from those suggested by the forward-looking statements.
Important developments that could affect the Company’s operations include changes in the industry structure,
significant changes in political and economic environment in India and overseas, tax laws, import duties, litigation
and labour relations.
The Phoenix Mills Ltd. (PML) will not be in any way responsible for any action taken based on such statements and
undertakes no obligation to publicly update these forward-looking statements to reflect subsequent events or
circumstances.
2
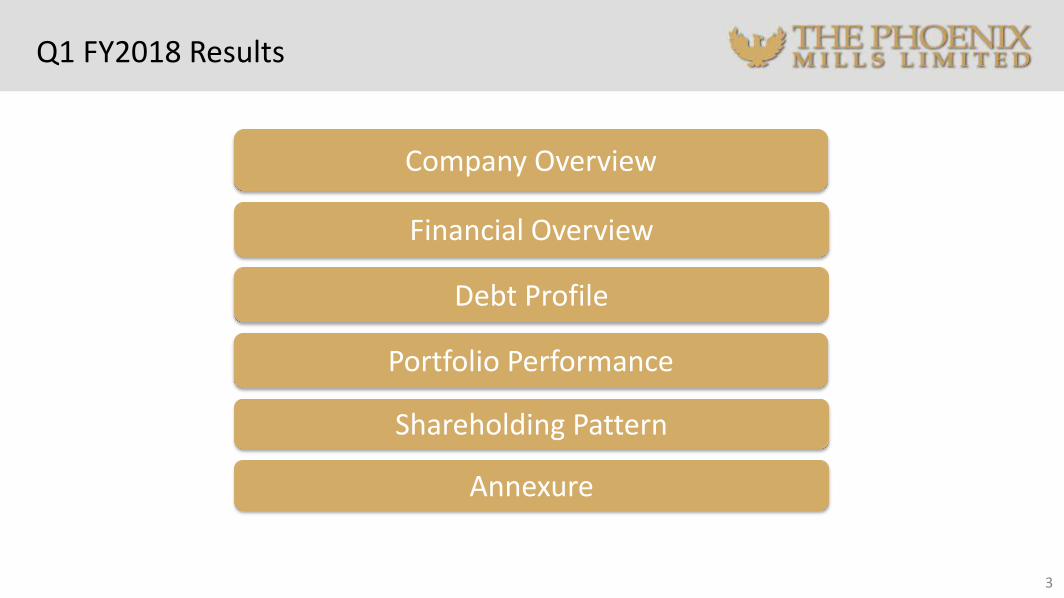
Q1 FY2018 Results
Portfolio Performance
Shareholding Pattern
Company Overview
3
Debt Profile
Financial Overview
Annexure
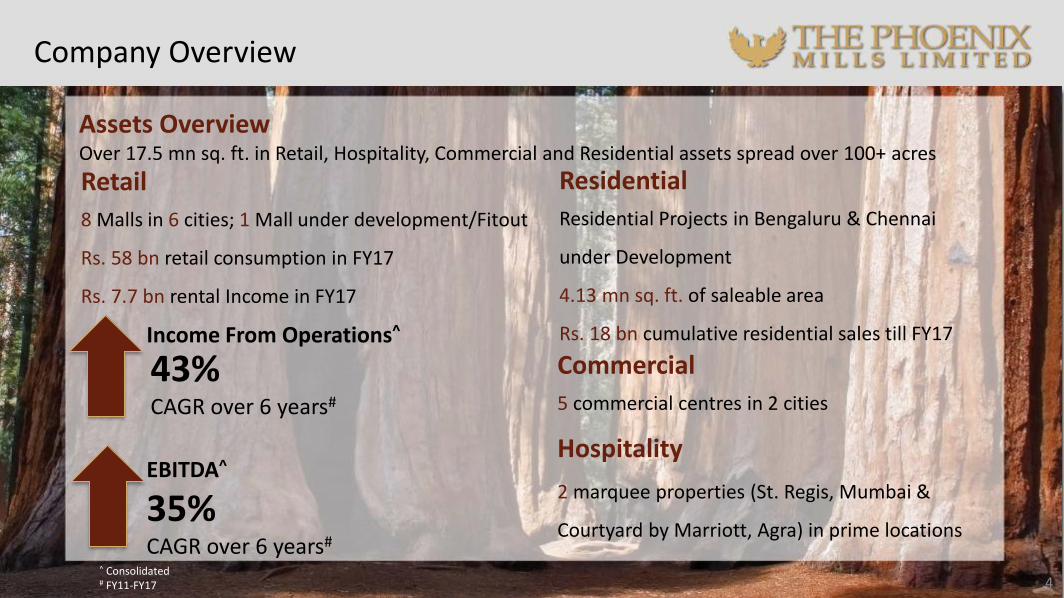
Company Overview
4
Assets OverviewOver 17.5 mn sq. ft. in Retail, Hospitality, Commercial and Residential assets spread over 100+ acres
Retail
8 Malls in 6 cities; 1 Mall under development/Fitout
Rs. 58 bn retail consumption in FY17
Rs. 7.7 bn rental Income in FY17
Residential
Residential Projects in Bengaluru & Chennai
under Development
4.13 mn sq. ft. of saleable area
Rs. 18 bn cumulative residential sales till FY17
Commercial
5 commercial centres in 2 cities
Hospitality
2 marquee properties (St. Regis, Mumbai &
Courtyard by Marriott, Agra) in prime locations
Income From Operations^
43%CAGR over 6 years#
EBITDA^
35%CAGR over 6 years#
^ Consolidated# FY11-FY17

Key Execution Milestones
5
One of the oldest business groups in India with a strong track record of execution and delivery with history spanning over 100 years
Started by the Ruia family
Began operations as a textile
company on 21 acres land in
Lower Parel, Mumbai
Opened Phoenix MarketCity,
Pune
Opened Courtyard by
Marriott, Agra
Launched Kessaku, Luxury
Residential Development in
Bangalore
Opened Phoenix MarketCity,
Mumbai
Opened Phoenix MarketCity,
Bangalore
Commissioned Palladium
Hotel, Mumbai
1999 2002 Q1 20151905 Q1 2014Q4 2012 Q1 2013Q4 2011Q2 20112007 20091986 Q1 2012 Q3 20122001 Q3 2011
Successfully raised INR 13 bn
through a QIP and preferential
issue
Announced the development of
Market Cities in Mumbai, Pune,
Bangalore and Chennai
Built the first multi-
storied residential luxury
tower, Phoenix Towers
Opened a Luxury mall,
The Palladium, at
Mumbai
Opened High Street
Phoenix mall
Opened Phoenix
MarketCity, Chennai
Launched Chennai Residential,
Development, The Crest
Launched Phoenix Paragon Plaza,
Mumbai Commercial Development
Launched Commercial
development Art Guild
House in Kurla, Mumbai
Big Bazaar Started
Operations at High
Street Phoenix
Launched Fountainhead,
Residential development in
Pune
Launched One Bangalore
West, Residential
Development in Bangalore
Opened Phoenix House and
Phoenix Center with 350,000 sq.ft
of Office space
Note – Year denotes calendar year
Q3 2015
Successfully raised INR 2.83 bn
through a QIP in July 2015
Palladium hotel rebranded
as The St .Regis, Mumbai
Acquired controlling stake in
Gangetic Hotels, Agra
Q2 2017
Announced Strategic
Retail Platform with
CPPIB for development of
Greenfield & Brownfield
retail-led assets in India

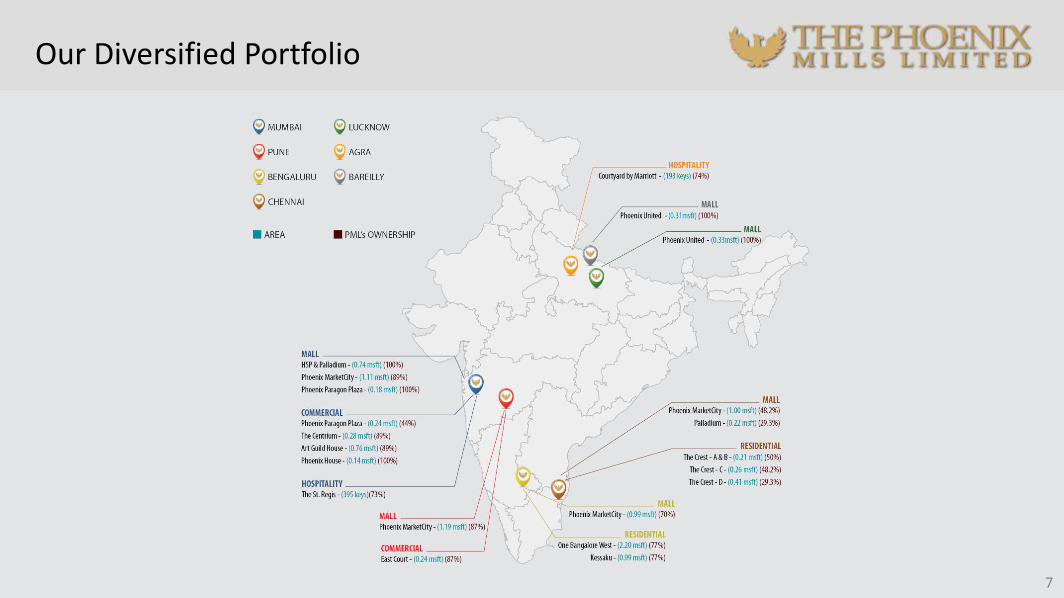
Our Diversified Portfolio
MALL PORTFOLIO (5.85 MSF)
HSP & Palladium Mumbai 0.74
Phoenix MarketCity Chennai 1.00
Phoenix MarketCity Pune 1.19
Phoenix MarketCity Bengaluru 1.00
Phoenix MarketCity Mumbai 1.11
Phoenix United Lucknow 0.33
Phoenix United Bareilly 0.31
Phoenix Paragon Plaza
Mumbai 0.18
MALLS UNDER FIT-OUT(0.22 MSF)
Palladium @ Chennai 0.22
MATURE RESIDENTIAL PORTFOLIO (4.13 MSF)
One Bangalore West
Bengaluru
2.20
Kessaku 0.99
The CrestChennai
0.94
MATURE OFFICE PORTFOLIO (1.67 MSF)
Phoenix Paragon Plaza Mumbai 0.24
The Centrium Mumbai 0.28
East Court Pune 0.25
Art Guild House Mumbai 0.76
Phoenix House Mumbai 0.14
HOTEL PORTFOLIO(588 KEYS)
The St. Regis Mumbai 395
Courtyard by Marriot Agra 193
@ Completed – Awaiting OC 6
Our Diversified Portfolio
7
Q1 FY2018 Results
Portfolio Performance
8
Debt Profile
Financial Overview
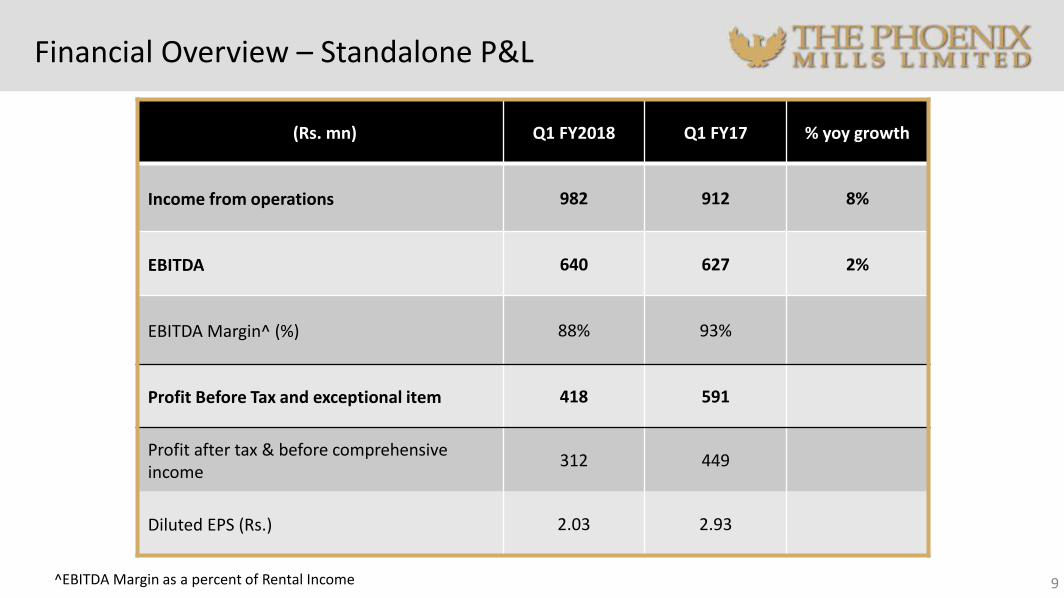
Financial Overview – Standalone P&L
(Rs. mn) Q1 FY2018 Q1 FY17 % yoy growth
Income from operations 982 912 8%
EBITDA 640 627 2%
EBITDA Margin^ (%) 88% 93%
Profit Before Tax and exceptional item 418 591
Profit after tax & before comprehensive income
312 449
Diluted EPS (Rs.) 2.03 2.93
9^EBITDA Margin as a percent of Rental Income
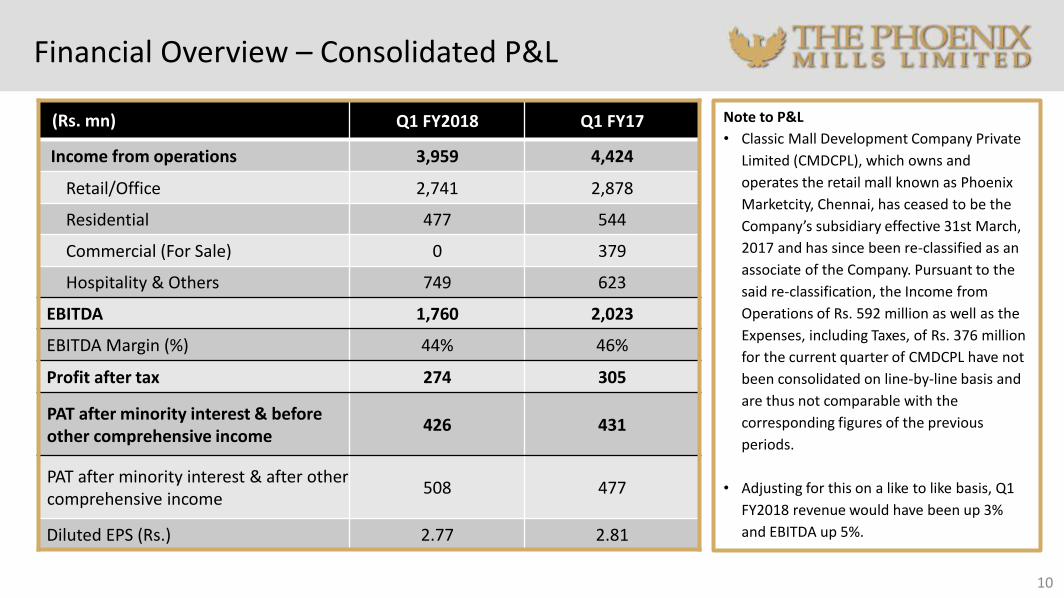
Financial Overview – Consolidated P&L
10
(Rs. mn) Q1 FY2018 Q1 FY17
Income from operations 3,959 4,424
Retail/Office 2,741 2,878
Residential 477 544
Commercial (For Sale) 0 379
Hospitality & Others 749 623
EBITDA 1,760 2,023
EBITDA Margin (%) 44% 46%
Profit after tax 274 305
PAT after minority interest & before other comprehensive income
426 431
PAT after minority interest & after other comprehensive income
508 477
Diluted EPS (Rs.) 2.77 2.81
Note to P&L
• Classic Mall Development Company Private
Limited (CMDCPL), which owns and
operates the retail mall known as Phoenix
Marketcity, Chennai, has ceased to be the
Company’s subsidiary effective 31st March,
2017 and has since been re-classified as an
associate of the Company. Pursuant to the
said re-classification, the Income from
Operations of Rs. 592 million as well as the
Expenses, including Taxes, of Rs. 376 million
for the current quarter of CMDCPL have not
been consolidated on line-by-line basis and
are thus not comparable with the
corresponding figures of the previous
periods.
• Adjusting for this on a like to like basis, Q1
FY2018 revenue would have been up 3%
and EBITDA up 5%.
Q1 FY2018 – Financial Key Highlights
11
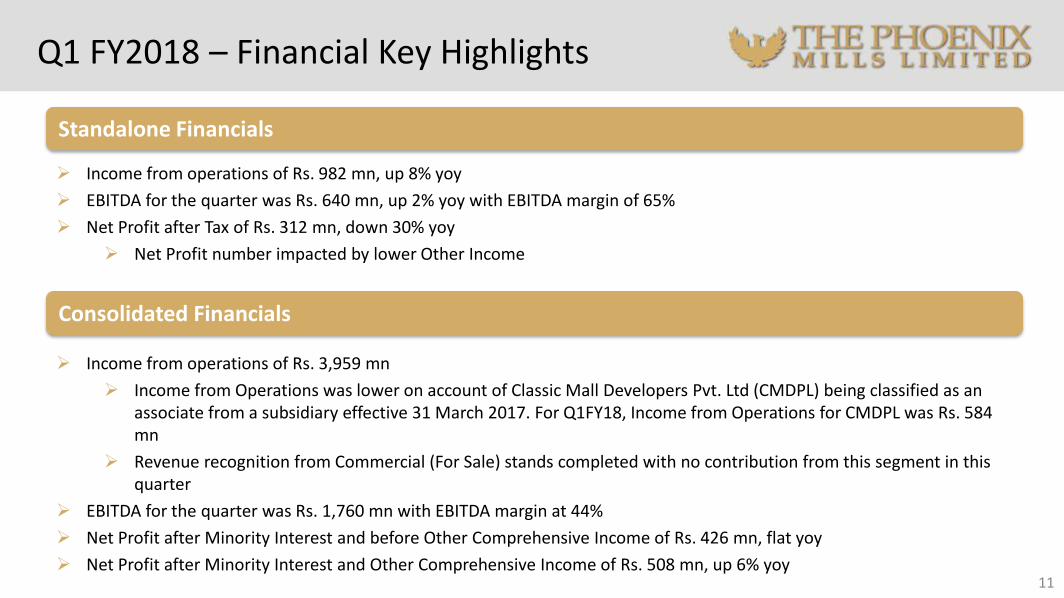
Income from operations of Rs. 982 mn, up 8% yoy
EBITDA for the quarter was Rs. 640 mn, up 2% yoy with EBITDA margin of 65%
Net Profit after Tax of Rs. 312 mn, down 30% yoy
Net Profit number impacted by lower Other Income
Standalone Financials
Consolidated Financials
Income from operations of Rs. 3,959 mn
Income from Operations was lower on account of Classic Mall Developers Pvt. Ltd (CMDPL) being classified as an associate from a subsidiary effective 31 March 2017. For Q1FY18, Income from Operations for CMDPL was Rs. 584 mn
Revenue recognition from Commercial (For Sale) stands completed with no contribution from this segment in this quarter
EBITDA for the quarter was Rs. 1,760 mn with EBITDA margin at 44%
Net Profit after Minority Interest and before Other Comprehensive Income of Rs. 426 mn, flat yoy
Net Profit after Minority Interest and Other Comprehensive Income of Rs. 508 mn, up 6% yoy
Consolidated Debt Profile
12
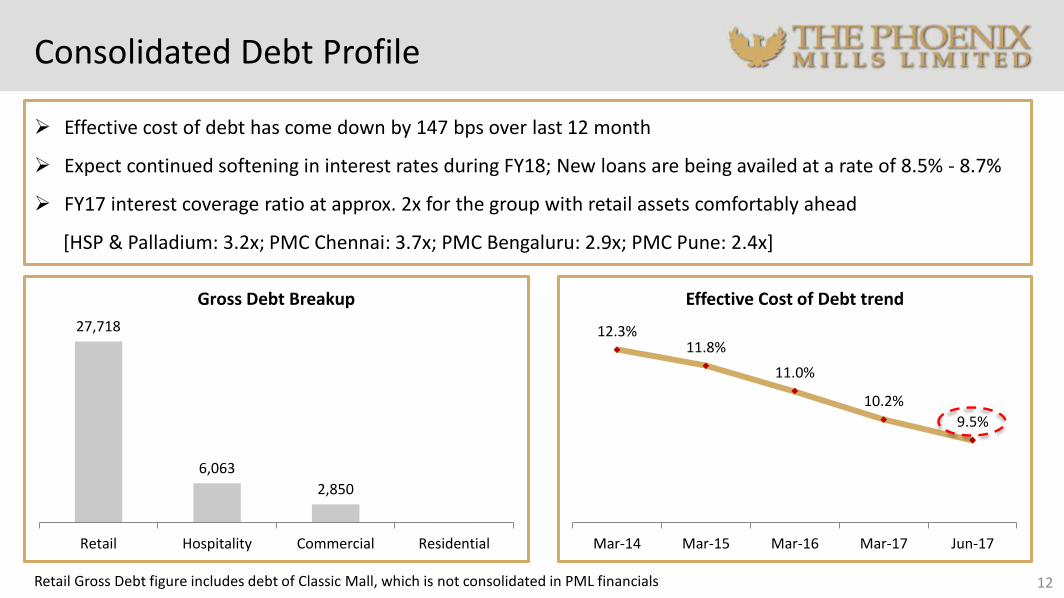
Effective cost of debt has come down by 147 bps over last 12 month
Expect continued softening in interest rates during FY18; New loans are being availed at a rate of 8.5% - 8.7%
FY17 interest coverage ratio at approx. 2x for the group with retail assets comfortably ahead
[HSP & Palladium: 3.2x; PMC Chennai: 3.7x; PMC Bengaluru: 2.9x; PMC Pune: 2.4x]
12.3%11.8%
11.0%
10.2%
9.5%
Mar-14 Mar-15 Mar-16 Mar-17 Jun-17
Effective Cost of Debt trend
27,718
6,063
2,850
Retail Hospitality Commercial Residential
Gross Debt Breakup
Retail Gross Debt figure includes debt of Classic Mall, which is not consolidated in PML financials

Consolidated Debt Profile
13
Asset Type SPV Asset Name Q1 FY2018 Debt (Rs. mn)
Retail & Mixed-Use
PML Standalone High Street Phoenix, Mumbai 6,351
Classic Mall DevelopmentPhoenix MarketCity, Chennai
4,125The Crest C
Vamona DevelopersPhoenix MarketCity, Pune
5,197East Court
Island Star Mall DevelopersPhoenix MarketCity, Bengaluru
4,380OberHaus
Offbeat DevelopersPhoenix MarketCity, Kurla
7,700Art Guild House Centrium
Blackwood Developers Phoenix United, Bareilly 811
UPAL Developers Phoenix United, Lucknow 905
Graceworks Realty & Leisure Phoenix Paragon Plaza 1,100
HotelPallazzio Hotels & Leisure The St. Regis, Mumbai 6,063
Gangetic Hotels Courtyard by Marriott, Agra 0Total 36,631
The Retail Portfolio
14
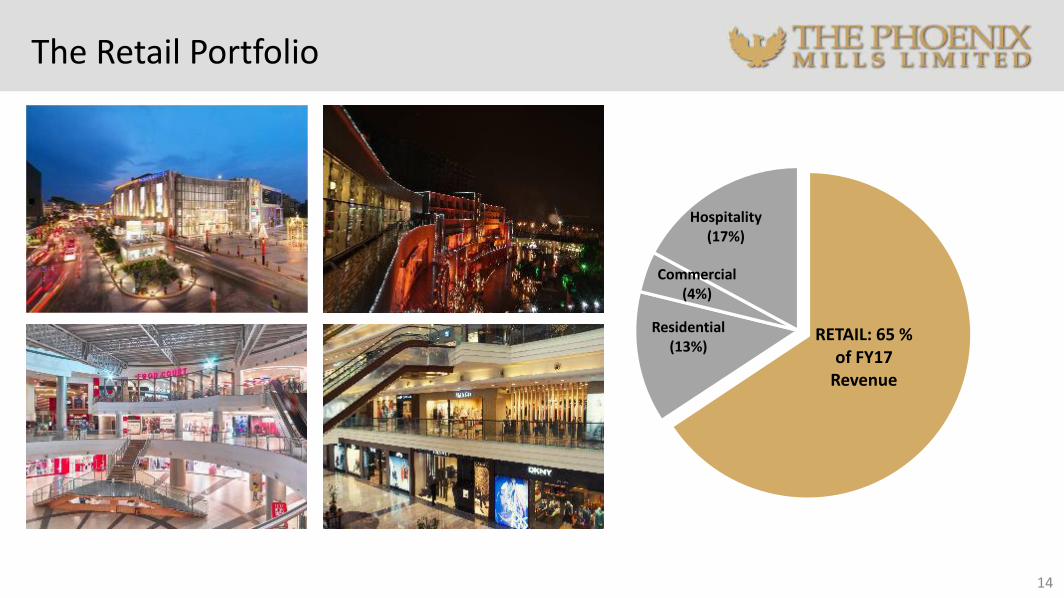
RETAIL: 65 % of FY17
Revenue
Residential (13%)
Commercial (4%)
Hospitality (17%)
Operational Update – Retail Portfolio
15
HSP & Palladium
Phoenix MarketCity Phoenix United Palladium##
Mumbai Bengaluru Chennai Mumbai Pune Bareilly Lucknow Chennai
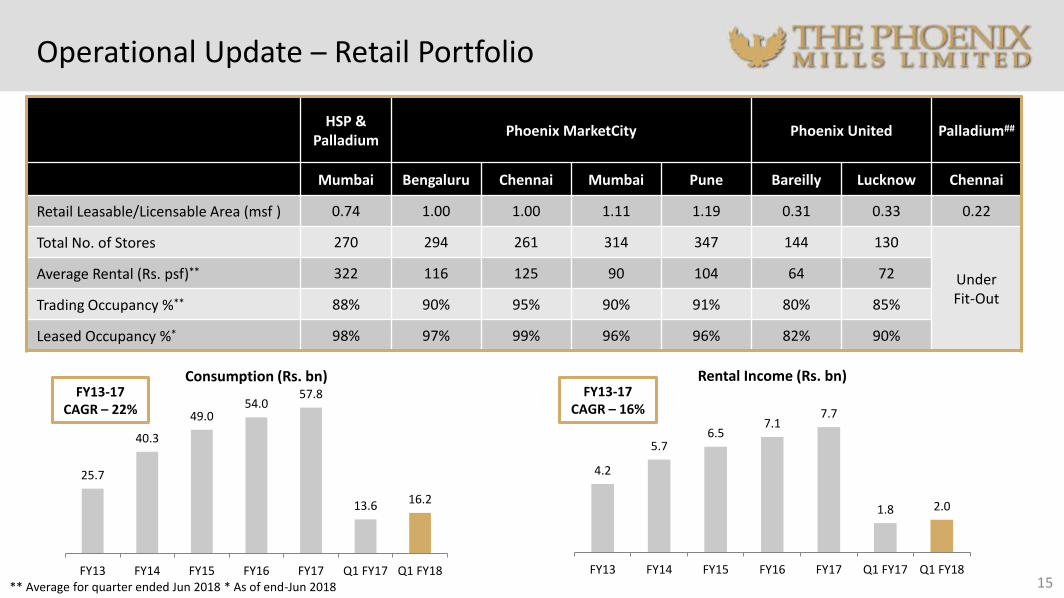
Retail Leasable/Licensable Area (msf ) 0.74 1.00 1.00 1.11 1.19 0.31 0.33 0.22
Total No. of Stores 270 294 261 314 347 144 130
Under Fit-Out
Average Rental (Rs. psf)** 322 116 125 90 104 64 72
Trading Occupancy %** 88% 90% 95% 90% 91% 80% 85%
Leased Occupancy %* 98% 97% 99% 96% 96% 82% 90%
25.7
40.3
49.054.0
57.8
13.6 16.2
FY13 FY14 FY15 FY16 FY17 Q1 FY17 Q1 FY18
Consumption (Rs. bn)
4.2
5.76.5
7.17.7
1.8 2.0
FY13 FY14 FY15 FY16 FY17 Q1 FY17 Q1 FY18
Rental Income (Rs. bn)
** Average for quarter ended Jun 2018 * As of end-Jun 2018
FY13-17 CAGR – 22%
FY13-17 CAGR – 16%
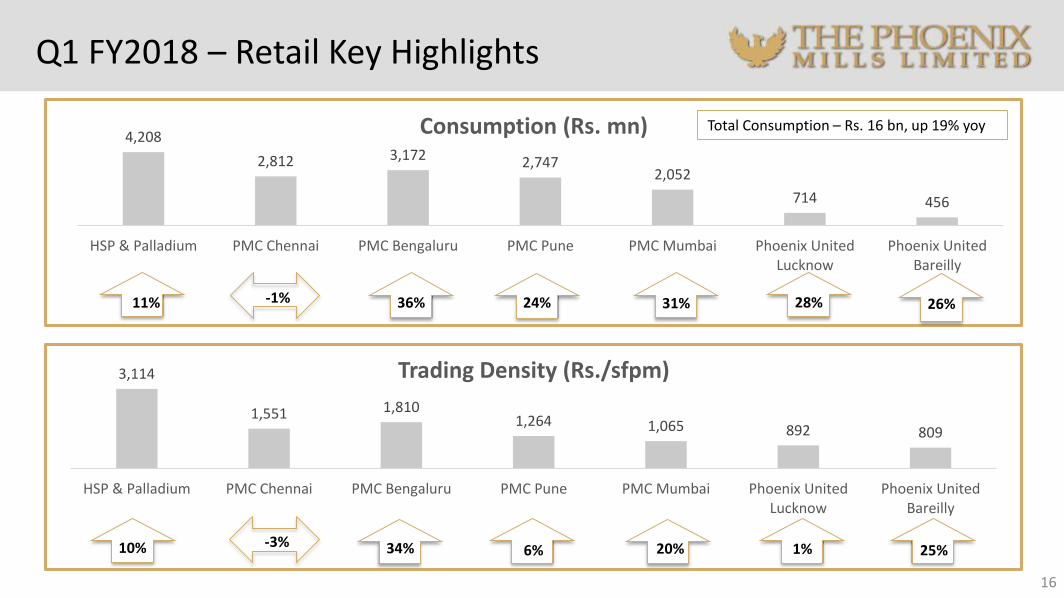
4,208
2,812 3,172 2,7472,052
714 456
HSP & Palladium PMC Chennai PMC Bengaluru PMC Pune PMC Mumbai Phoenix UnitedLucknow
Phoenix UnitedBareilly
Consumption (Rs. mn)
Q1 FY2018 – Retail Key Highlights
16
Total Consumption – Rs. 16 bn, up 19% yoy
11% 36% 24% 31% 28% 26%
3,114
1,551 1,8101,264 1,065 892 809
HSP & Palladium PMC Chennai PMC Bengaluru PMC Pune PMC Mumbai Phoenix UnitedLucknow
Phoenix UnitedBareilly
Trading Density (Rs./sfpm)
10% 34% 6% 20% 1% 25%
-1%
-3%

730
343 313 338 266
65 48
HSP & Palladium PMC Chennai PMC Bengaluru PMC Pune PMC Mumbai Phoenix UnitedLucknow
Phoenix UnitedBareilly
Rental Income (Rs. mn) Total Rental Income – Rs. 2.1 bn, up 17% yoy
Q1 FY2018 – Retail Key Highlights
17
8% 24% 28%8% 28% 13%9% 16%
640
379 319 308 24351 38
HSP & Palladium PMC Chennai PMC Bengaluru PMC Pune PMC Mumbai Phoenix UnitedLucknow
Phoenix UnitedBareilly*
Mall EBITDA (Rs. mn) Total Mall EBITDA – Rs. 2.0 bn, up 18% yoy
2% 28% 25% 45% 9% 11%15%
Please Note that PMC Chennai is not consolidated in PML financials. *Major Area in Bareilly Mall is under refurbishment.

Q1 FY2018 – Retail Key Highlights
18
HSP & Palladium
Q1FY18 consumption at Rs. 4,208 mn, up 11% yoy
Trading Density at Rs. 3,114 psf pm, UP 10% YOY
Q1 FY18 rental rate of Rs. 322 psf pm, up 7% yoy
PMC Pune
PMC Mumbai
Rental Income in Q1FY18 of Rs. 338 mn, up 28% yoy
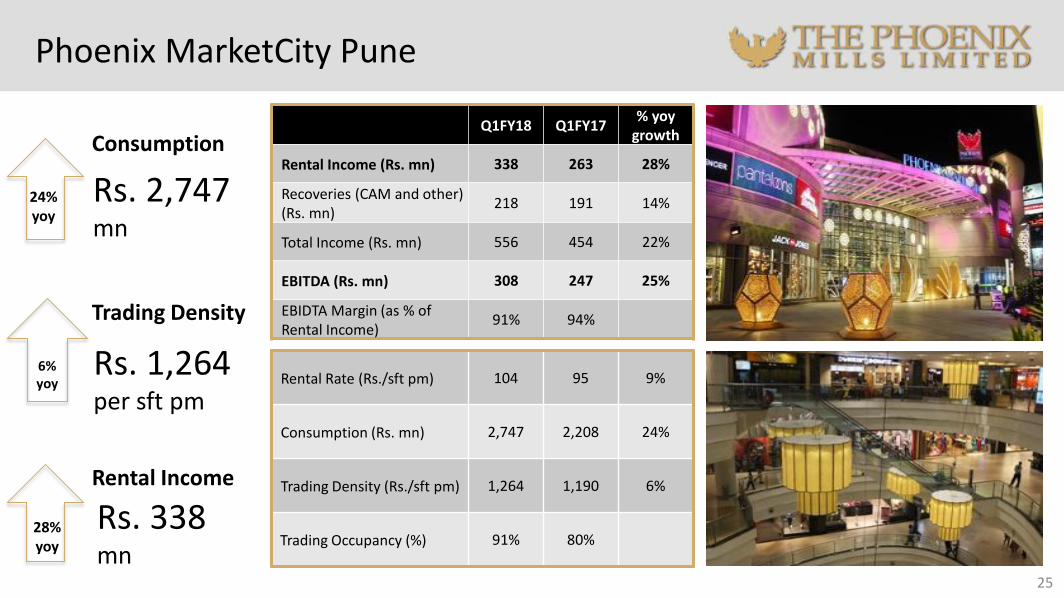
Strong Consumption at Rs. 2,747 mn for Q1 FY18, up 24% yoy
EBITDA for the quarter at Rs. 308 mn, up 25% yoy
Consumption in Q1 FY18 of Rs. 2,052 mn, up 31% yoy
Trading density up 20% yoy in Q1 FY18 at Rs 1,065 psf pm
Strong EBITDA Rs. 243 mn, up 45% yoy; EBITDA margin at 91%
Q1 FY18 consumption at Rs. 19 bn, up 19% yoy
Rental Income for Q1FY18 came in at Rs. 2.1 bn with an EBITDA of Rs. 2.0 bn
Q1 FY18 EBITDA is at Rs. 379 mn, up 15% yoy
Rental rate for the quarter at Rs. 125 psf pm, up 6% yoy
Retail Portfolio
PMC Bengaluru
PMC Chennai
Consumption growth remains strong in PMC Bengaluru in Q1 FY18, up 36% yoy
Q1 FY18 Rental income up 24% yoy; Rental Rate at Rs. 116 psf pm, up 18% yoy
High Street Phoenix & Palladium Mall
19
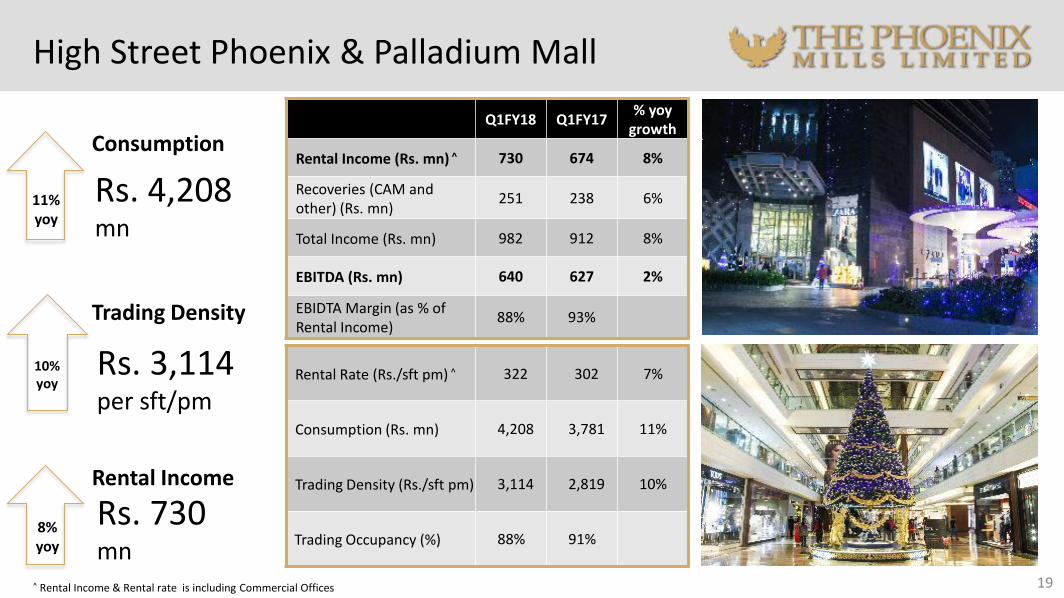
Q1FY18 Q1FY17 % yoy
growth
Rental Income (Rs. mn) ^ 730 674 8%
Recoveries (CAM and other) (Rs. mn)
251 238 6%
Total Income (Rs. mn) 982 912 8%
EBITDA (Rs. mn) 640 627 2%
EBIDTA Margin (as % of Rental Income)
88% 93%
Rental Rate (Rs./sft pm) ^ 322 302 7%
Consumption (Rs. mn) 4,208 3,781 11%
Trading Density (Rs./sft pm) 3,114 2,819 10%
Trading Occupancy (%) 88% 91%
^ Rental Income & Rental rate is including Commercial Offices
Consumption
Rs. 4,208mn
Trading Density
Rs. 3,114 per sft/pm
Rental Income
Rs. 730mn
11%yoy
10%yoy
8%yoy

20
674 702752
709 730
Q1 FY17 Q2 FY17 Q3 FY17 Q4 FY17 Q1 FY18
Rental Income (Rs. mn)
3,781 4,0244,524
3,934 4,208
Q1 FY17 Q2 FY17 Q3 FY17 Q4 FY17 Q1 FY18
Consumption (Rs. mn) Consumption of Rs. 4,208 Mn in Q1 FY2018, Up
11% yoy
Rental Income of Rs. 322 Mn, Up 7% yoy
Trading occupancy lower yoy by 3 pps as approx.
50,000 sft. of area, earlier occupied by Pantaloons,
is currently under refurbishment
New Brands includeSelectedMasabaMobile Store
Major Marketing Events• World Music day celebrations• Desert Garden Festival • Mod’Art Fashion Show• Wadali Brothers performed
Live in Concert
High Street Phoenix & Palladium Mall
Phoenix MarketCity Chennai
21
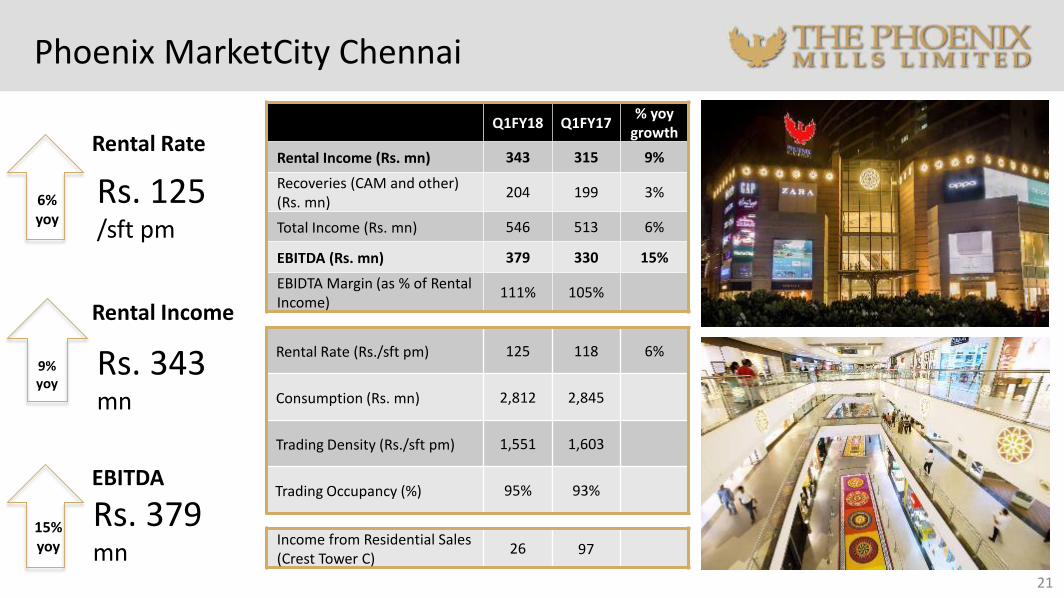
Q1FY18 Q1FY17 % yoy
growth
Rental Income (Rs. mn) 343 315 9%
Recoveries (CAM and other) (Rs. mn)
204 199 3%
Total Income (Rs. mn) 546 513 6%
EBITDA (Rs. mn) 379 330 15%
EBIDTA Margin (as % of Rental Income)
111% 105%
Rental Rate (Rs./sft pm) 125 118 6%
Consumption (Rs. mn) 2,812 2,845
Trading Density (Rs./sft pm) 1,551 1,603
Trading Occupancy (%) 95% 93%
Income from Residential Sales (Crest Tower C)
26 97
Rental Rate
Rs. 125 /sft pm
Rental Income
Rs. 343mn
EBITDA
Rs. 379 mn
6%yoy
9%yoy
15%yoy
22
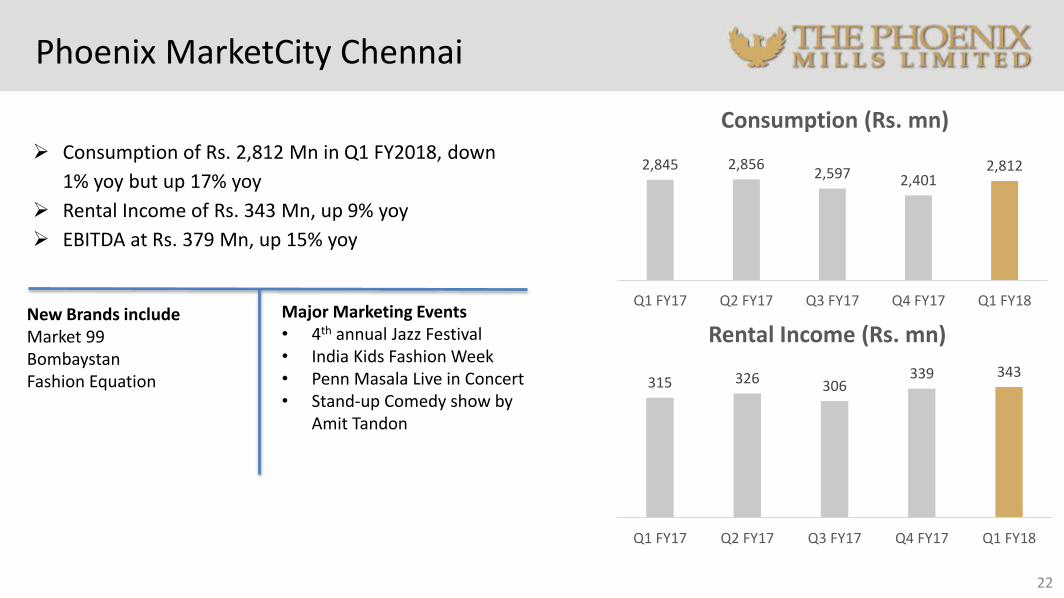
315 326 306339 343
Q1 FY17 Q2 FY17 Q3 FY17 Q4 FY17 Q1 FY18
Rental Income (Rs. mn)
2,845 2,8562,597 2,401
2,812
Q1 FY17 Q2 FY17 Q3 FY17 Q4 FY17 Q1 FY18
Consumption (Rs. mn)
Consumption of Rs. 2,812 Mn in Q1 FY2018, down
1% yoy but up 17% yoy
Rental Income of Rs. 343 Mn, up 9% yoy
EBITDA at Rs. 379 Mn, up 15% yoy
New Brands includeMarket 99BombaystanFashion Equation
Major Marketing Events• 4th annual Jazz Festival• India Kids Fashion Week• Penn Masala Live in Concert• Stand-up Comedy show by
Amit Tandon
Phoenix MarketCity Chennai

Phoenix MarketCity Bengaluru
23
Q1FY18 Q1FY17 % yoy
growth
Rental Income (Rs. mn) 313 252 24%
Recoveries (CAM and other) (Rs. mn)
165 151 9%
Total Income (Rs. mn) 478 403 18%
EBITDA (Rs. mn) 319 249 28%
EBIDTA Margin (as % of Rental Income)
102% 99%
Rental Rate (Rs./sft pm) 116 98 18%
Consumption (Rs. mn) 3,172 2,332 36%
Trading Density (Rs./sft pm) 1,810 1,350 34%
Trading Occupancy (%) 90% 87%
Consumption
Rs. 3,172 mn
Trading Density
Rs. 1,810 per sft pm
Rental Income
Rs. 313mn
36%yoy
34%yoy
24%yoy

24
252 263292 283
313
Q1 FY17 Q2 FY17 Q3 FY17 Q4 FY17 Q1 FY18
Rental Income (Rs. mn)
2,332 2,3982,918
2,554
3,172
Q1 FY17 Q2 FY17 Q3 FY17 Q4 FY17 Q1 FY18
Consumption (Rs. mn)
Consumption of Rs. 3,172 Mn in Q1 FY2018, up 36%
yoy
Rental Income of Rs. 313 Mn, up 24% yoy
New Brands includeUnited Colors of BenettonBar BarMont BlancShizu sanTuk TukHimalaya Opticals
Major Marketing Events• Artisan Bazaarshowcasing
handmade crafts• Aneesh Vidyashankar live in
concert• World Yoga Day celebrations• Brew*B*Q festival• India Superbike Festival
Phoenix MarketCity Bengaluru
Phoenix MarketCity Pune
25
Q1FY18 Q1FY17% yoy
growth
Rental Income (Rs. mn) 338 263 28%
Recoveries (CAM and other) (Rs. mn)
218 191 14%
Total Income (Rs. mn) 556 454 22%
EBITDA (Rs. mn) 308 247 25%
EBIDTA Margin (as % of Rental Income)
91% 94%
Rental Rate (Rs./sft pm) 104 95 9%
Consumption (Rs. mn) 2,747 2,208 24%
Trading Density (Rs./sft pm) 1,264 1,190 6%
Trading Occupancy (%) 91% 80%
Consumption
Rs. 2,747mn
Trading Density
Rs. 1,264per sft pm
Rental Income
Rs. 338mn
24%yoy
6%yoy
28%yoy

26
263 284324 330 338
Q1 FY17 Q2 FY17 Q3 FY17 Q4 FY17 Q1 FY18
Rental Income (Rs. mn)
2,208 2,188
2,8122,422
2,747
Q1 FY17 Q2 FY17 Q3 FY17 Q4 FY17 Q1 FY18
Consumption (Rs. mn)
Consumption of Rs. 2,747 Mn in Q1 FY2018, up 24%
yoy
Rental Income of Rs. 338 Mn, up 28% yoy
New Brands includeMarket 99DoodlersMochi212 JuniorArrow SportsReebok
Major Marketing Events• World Music Day celebrations• UB40 Live in Concert• Mika Singh performed Live• Amit Trivedi Live in Concert• Wadali Brothers performed
Live in Concert
Phoenix MarketCity Pune

27
Q1FY18 Q1FY17 % yoy
growth
Rental Income (Rs. mn) 266 230 16%
Recoveries (CAM and other) (Rs. mn)
144 145
Total Income (Rs. mn) 410 375 9%
EBITDA (Rs. mn) 243 167 45%
EBIDTA Margin (as % of Rental Income)
91% 73%
Rental Rate (Rs./sft pm) 90 84 8%
Consumption (Rs. mn) 2,052 1,565 31%
Trading Density (Rs./sft pm) 1,065 884 20%
Trading Occupancy (%) 90% 84%
Income from Commercial Sales (AGH, Centrium)
0 374
Phoenix MarketCity Mumbai
Consumption
Rs. 2,052 mn
Trading Density
Rs. 1,065per sft pm
EBITDA
Rs. 263mn
31%yoy
20%yoy
57%yoy

28
230 230 232 235266
Q1 FY17 Q2 FY17 Q3 FY17 Q4 FY17 Q1 FY18
Rental Income (Rs. mn)
1,565 1,6781,929 1,784
2,052
Q1 FY17 Q2 FY17 Q3 FY17 Q4 FY17 Q1 FY18
Consumption (Rs. mn)
Consumption of Rs. 2,052 Mn in Q1 FY2018, up 31%
yoy
Rental Income of Rs. 266 Mn, up 15% yoy
New Brands includeSelectedOppo MobilesSpanMahuvaChaayosFossil
Major Marketing Events• Mika Singh Live in Concert• UB40 Live I Concert• Auto Mall 2017• Penn Masala Live in Concert• India Dance Week Launch &
Auditions
Phoenix MarketCity Mumbai

Renewal Schedule (% of total leasable area)
29
8%3%
7%
FY18 FY19 FY20
PMC Bengaluru
9% 10% 7%
FY18 FY19 FY20
PMC Mumbai
13%18%
23%
FY18 FY19 FY20
HSP & Palladium
4%
15% 13%
FY18 FY19 FY20
PMC Pune
46%
5% 2%
FY18 FY19 FY20
PMC Chennai
Renewal/re-leasing done in FY17
40% of leasable area in PMC Mumbai
45% of leasable area in PMC Bengaluru
21% of leasable area in HSP & Palladium
Upcoming major renewals in next 3 years
54% of leasable area at HSP & Palladium
53% of leasable area at PMC Chennai
54% of leasable area for renewal over next 3 years
18% of leasable area for renewal over next 3 years
53% of leasable area for renewal over next 3 years
26% of leasable area for renewal over next 3 years
32% of leasable area for renewal over next 3 years

Retail (65%)
RESIDENTIAL: 13% of FY17
Revenue
Commercial (4%)
Hospitality (17%)
The Residential Portfolio
KESSAKU - BENGALURU
30
ONE BANGALORE WEST - BENGALURU
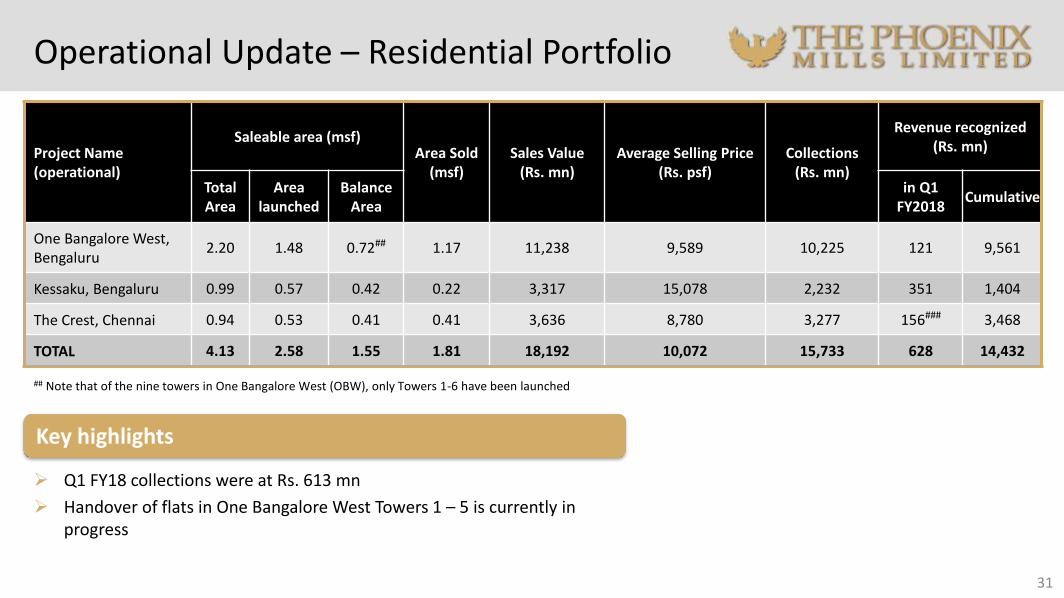
Operational Update – Residential Portfolio
## Note that of the nine towers in One Bangalore West (OBW), only Towers 1-6 have been launched
31
Project Name (operational)
Saleable area (msf)Area Sold
(msf) Sales Value
(Rs. mn) Average Selling Price
(Rs. psf)Collections
(Rs. mn)
Revenue recognized (Rs. mn)
Total Area
Area launched
Balance Area
in Q1 FY2018
Cumulative
One Bangalore West, Bengaluru
2.20 1.48 0.72## 1.17 11,238 9,589 10,225 121 9,561
Kessaku, Bengaluru 0.99 0.57 0.42 0.22 3,317 15,078 2,232 351 1,404
The Crest, Chennai 0.94 0.53 0.41 0.41 3,636 8,780 3,277 156### 3,468
TOTAL 4.13 2.58 1.55 1.81 18,192 10,072 15,733 628 14,432
Q1 FY18 collections were at Rs. 613 mn
Handover of flats in One Bangalore West Towers 1 – 5 is currently in progress
Key highlights
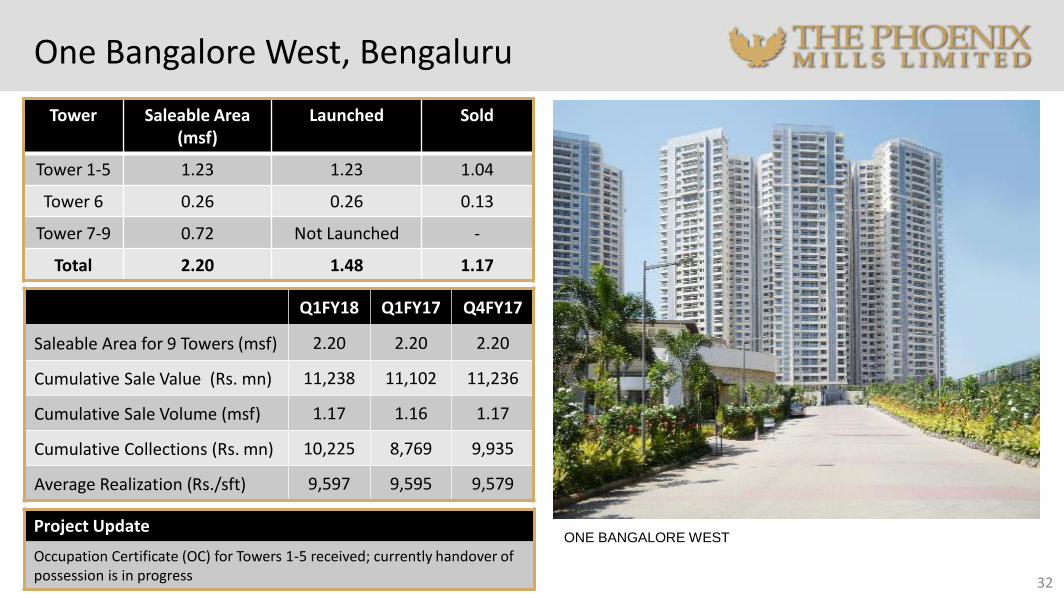
One Bangalore West, Bengaluru
32
Q1FY18 Q1FY17 Q4FY17
Saleable Area for 9 Towers (msf) 2.20 2.20 2.20
Cumulative Sale Value (Rs. mn) 11,238 11,102 11,236
Cumulative Sale Volume (msf) 1.17 1.16 1.17
Cumulative Collections (Rs. mn) 10,225 8,769 9,935
Average Realization (Rs./sft) 9,597 9,595 9,579
ONE BANGALORE WESTProject Update
Occupation Certificate (OC) for Towers 1-5 received; currently handover of possession is in progress
Tower Saleable Area (msf)
Launched Sold
Tower 1-5 1.23 1.23 1.04
Tower 6 0.26 0.26 0.13
Tower 7-9 0.72 Not Launched -
Total 2.20 1.48 1.17

One Bangalore West, Bengaluru
33
CLUBHOUSE INTERIOR OUTDOOR POOL

Kessaku, Bengaluru
34KESSAKU
Q1FY18 Q1FY17 Q4FY17
Saleable Area (msf) 0.99 0.99 0.99
Cumulative Sale Value (Rs. mn)
3,317 3,173 3,193
Cumulative Sale Volume (msf)
0.22 0.21 0.21
Cumulative Collections (Rs. mn)
2,232 1,245 1,975
Average Realization (Rs./sft) 15,078 14,835 15,378
SORA -18th floor slab complete, NIWA -17th floor shuttering WIP, MIZU – 15th
Floor concreting done, FAIA & ZEFA – 16th floor Shuttering WIP
Project Update
SORA, NIWA, MIZU, FAIA & ZEFA – Structure completed up to the 31st slab; Terrace roof work in progress

Kessaku, Bengaluru
35Kessaku Elevation Terrace Structure Work in Progress

The Crest, Chennai - Towers A, B and C
Note: Crest Towers A and B are a part of a separate subsidiary, Classic Housing Projects Pvt Ltd., while Crest Tower C forms a part of Classic Mall Development Co. Pvt. Ltd.
CR
ES
T T
OW
ER
S A
& B
CR
ES
T T
OW
ER
C
36
Q1FY18 Q1FY17 Q4FY17
Saleable Area (msf) 0.53 0.53 0.53
Cumulative Sale Value (Rs. mn)
3,636 3,434 3,464
Cumulative Sale Volume (msf) 0.41 0.39 0.40
Cumulative Collections (Rs. mn)
3,277 2,875 3,209
Average Realization (Rs./sft) 8,780 8,738 8,656
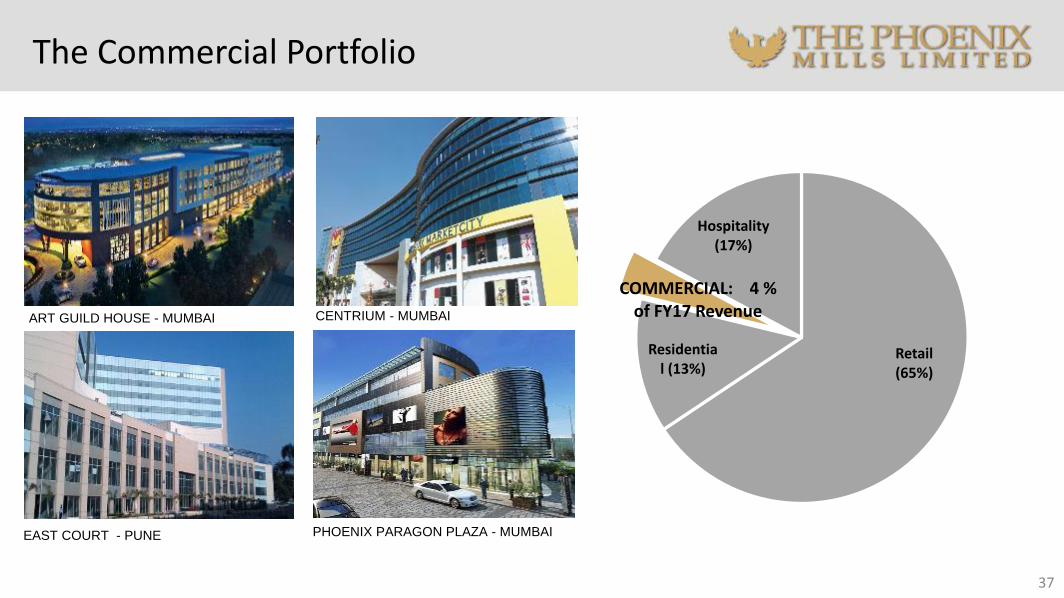
The Commercial Portfolio
ART GUILD HOUSE - MUMBAI
EAST COURT - PUNE
CENTRIUM - MUMBAI
PHOENIX PARAGON PLAZA - MUMBAI
37
Retail (65%)
Residential (13%)
COMMERCIAL: 4 % of FY17 Revenue
Hospitality (17%)

Operational Update – Commercial Portfolio
38
Project Name
Total Area (msf)
Area Sold (msf)
Net Leasable
Area (msf)
Area Leased (msf)
Average Rate
(Rs./sq.ft)
Phoenix House
0.14 - 0.14 0.13 110^
Centrium 0.28 0.18 0.10#
0.07 91
Art Guild House
0.76 0.21@
0.55@
0.35 93
Phoenix Paragon Plaza
0.24 0.05 0.19 0.12 100
Total 1.42 0.45 0.98 0.65 97
@Total Area sold is 0.38 msf out of which PML owns 0.17 msf – this area is also counted in area available for lease^Rental Income from Phoenix House is part of Standalone results #Area owned by PML
AGH reported Rental Income of Rs. 40 Mn for Q1 FY2018
64% of available leasable area in AGH has been leased

Art Guild House, Mumbai
INTERIOR SHOT - ART GUILD HOUSE LOBBY 1
39
INTERIOR SHOT - ART GUILD HOUSE LOBBY 2
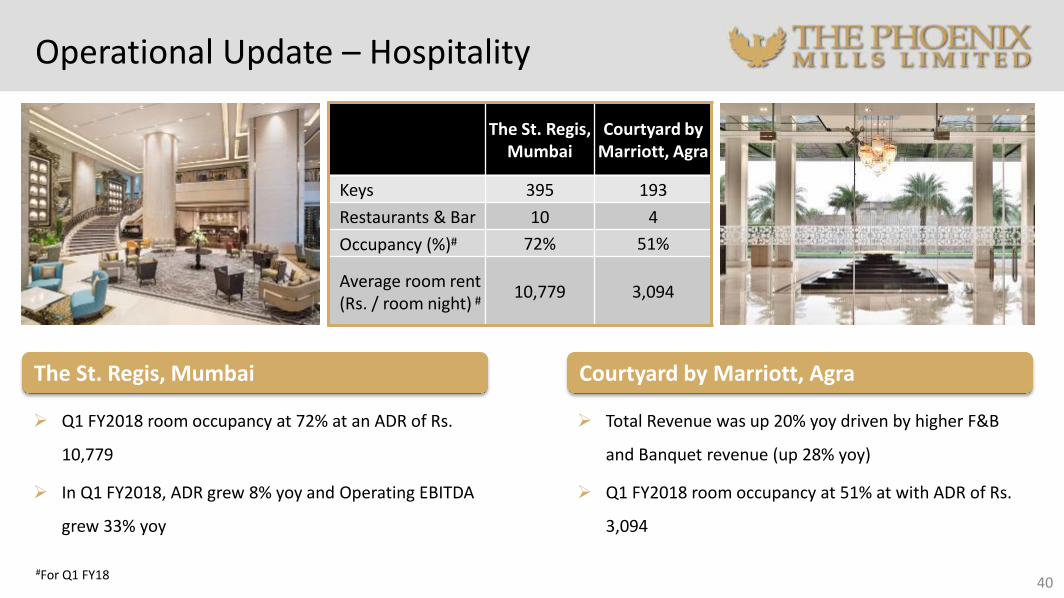
Operational Update – Hospitality
#For Q1 FY1840
The St. Regis, Mumbai
Courtyard by Marriott, Agra
Keys 395 193
Restaurants & Bar 10 4
Occupancy (%)# 72% 51%
Average room rent (Rs. / room night) #
10,779 3,094
The St. Regis, Mumbai
Q1 FY2018 room occupancy at 72% at an ADR of Rs.
10,779
In Q1 FY2018, ADR grew 8% yoy and Operating EBITDA
grew 33% yoy
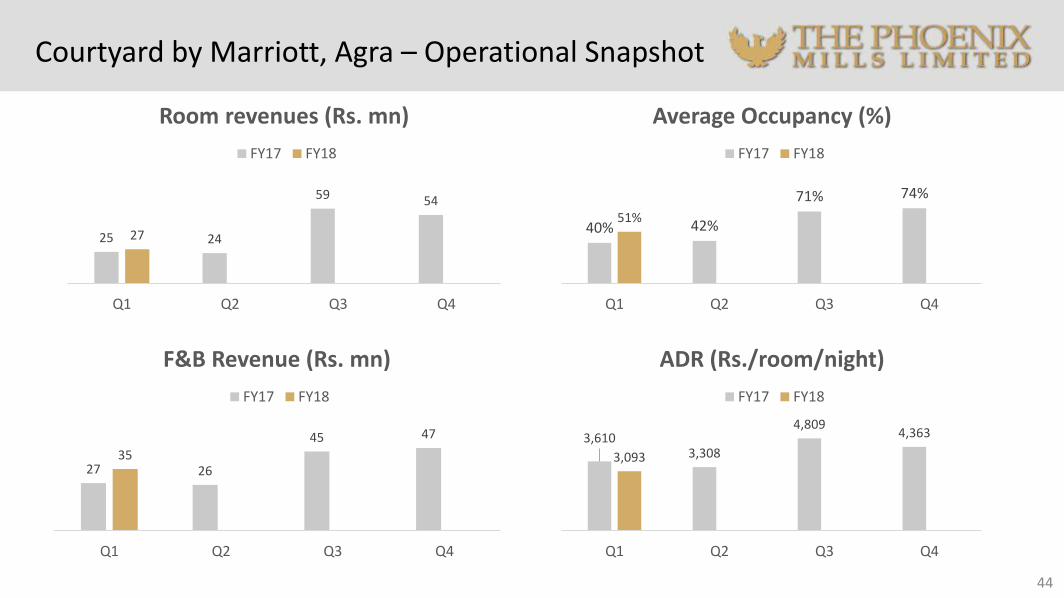
Courtyard by Marriott, Agra
Total Revenue was up 20% yoy driven by higher F&B
and Banquet revenue (up 28% yoy)
Q1 FY2018 room occupancy at 51% at with ADR of Rs.
3,094
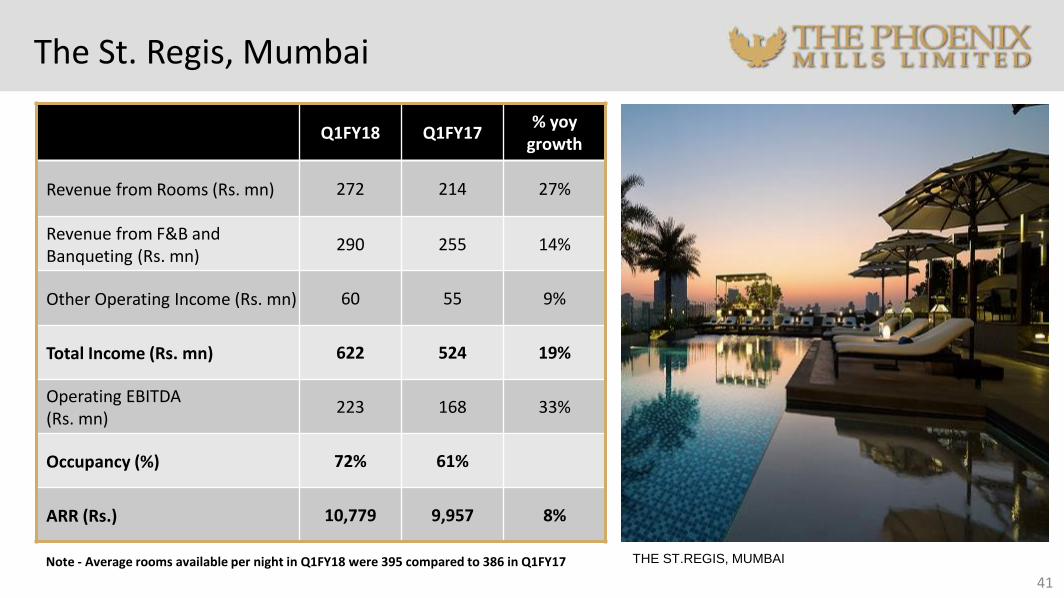
The St. Regis, Mumbai
41
THE ST.REGIS, MUMBAI
Q1FY18 Q1FY17 % yoy
growth
Revenue from Rooms (Rs. mn) 272 214 27%
Revenue from F&B and Banqueting (Rs. mn)
290 255 14%
Other Operating Income (Rs. mn) 60 55 9%
Total Income (Rs. mn) 622 524 19%
Operating EBITDA(Rs. mn)
223 168 33%
Occupancy (%) 72% 61%
ARR (Rs.) 10,779 9,957 8%
Note - Average rooms available per night in Q1FY18 were 395 compared to 386 in Q1FY17
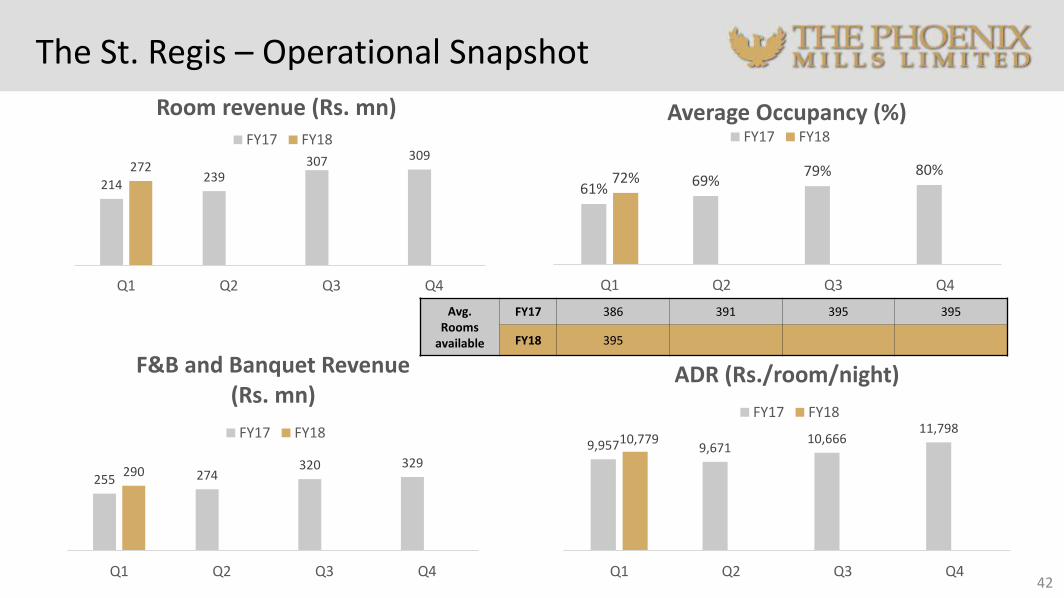
The St. Regis – Operational Snapshot
42
214239
307 309272
Q1 Q2 Q3 Q4
Room revenue (Rs. mn)FY17 FY18
255 274320 329
290
Q1 Q2 Q3 Q4
F&B and Banquet Revenue (Rs. mn)
FY17 FY18
61% 69%79% 80%72%
Q1 Q2 Q3 Q4
Average Occupancy (%)FY17 FY18
9,957 9,67110,666
11,79810,779
Q1 Q2 Q3 Q4
ADR (Rs./room/night)
FY17 FY18
Avg. Rooms
available
FY17 386 391 395 395
FY18 395
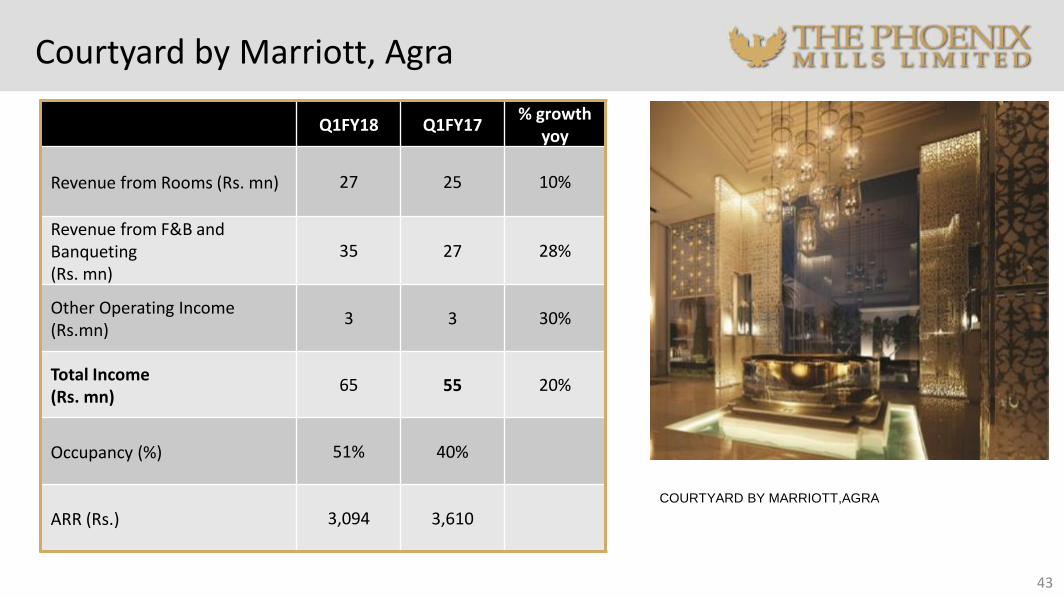
Courtyard by Marriott, Agra
43
COURTYARD BY MARRIOTT,AGRA
Q1FY18 Q1FY17% growth
yoy
Revenue from Rooms (Rs. mn) 27 25 10%
Revenue from F&B and Banqueting (Rs. mn)
35 27 28%
Other Operating Income(Rs.mn)
3 3 30%
Total Income (Rs. mn)
65 55 20%
Occupancy (%) 51% 40%
ARR (Rs.) 3,094 3,610
44
Courtyard by Marriott, Agra – Operational Snapshot
27 26
45 47
35
Q1 Q2 Q3 Q4
F&B Revenue (Rs. mn)
FY17 FY18
25 24
59 54
27
Q1 Q2 Q3 Q4
Room revenues (Rs. mn)
FY17 FY18
40% 42%
71% 74%
51%
Q1 Q2 Q3 Q4
Average Occupancy (%)
FY17 FY18
3,6103,308
4,8094,363
3,093
Q1 Q2 Q3 Q4
ADR (Rs./room/night)
FY17 FY18

Q1 FY2018 Results
Shareholding Pattern
45
Annexure

Shareholding Pattern – June 2017
Key Institutional Investors % Shareholding
Nordea Bank 10.16%
Fidelity Investment Trust 5.02%
Schroder 1.98%
TIAA-CREF Funds 1.77%
Mondrian 1.37%
Reliance Capital 1.31%
Van Eck 1.25%
Alpine 0.82%
UTI 0.74%
LO Funds 0.65%
Robeco 0.53%
UNISUPER 0.50%
Shareholding Pattern
46
62.86%
29.52%
3.24%2.46%
1.93%
Promoters FII DII Public Other Corporate Bodies

Our Portfolio*
47
The Phoenix Mills Ltd.Promoters62.9%
Public37.1%
HSP & Palladium, Mumbai0.90 msf
100%
Phoenix MarketCity4.44 msf
Pune 1.13 msf86.6%#
Bengaluru0.98 msf
70%
Mumbai1.11 msf89%#, &
Chennai 1.00 msf48.2%#
Chennai Ph II0.22 msf
29.3%
Phoenix United
0.64 msf
Lucknow0.33 msf
100%
Bareilly0.31 msf
100%
Pune0.88msf
East Court
0.25 msf86.6%#
Fountainhead
Phase I0.35 msf36.8%#, &
Fountainhead
Phase II0.28 msf36.8%#, &
Bengaluru4.22msf
OberHaus
1.02 msf70%
OBW & Kessaku3.20 msf100%@
Mumbai1.49 msf
Centrium0.28 msf89%#, &
Art Guild House
0.76 msf89%#, &
Phoenix Paragon
Plaza0.45 msf
43.8%
Chennai0.88 msf
Crest C0.26 msf
48.2%#
Crest A & B0.21 msf
50.0%
Crest D0.41 msf
29.3%
The St. Regis,
Mumbai395 Keys73.0%^,
Courtyard by
Marriott, Agra
193 Keys100%
Retail: Build & Lease Residential & Commercial: Build & Sale/Lease Hospitality: Build & Operate
^ PML’s current shareholding is 100% which would dilute to 58.5% upon conversion of CCD; SPA in place to increase shareholding to 73.0%
* as on August 10, 2017
# SPA signed with MPC to purchase their stake
& SPA signed with IL&FS to purchase their stake
@shares are held by Phoenix and its group companies

Annexure
Commercial Portfolio
Hotels & Restaurants Portfolio
48
Residential Portfolio
Retail Portfolio
49
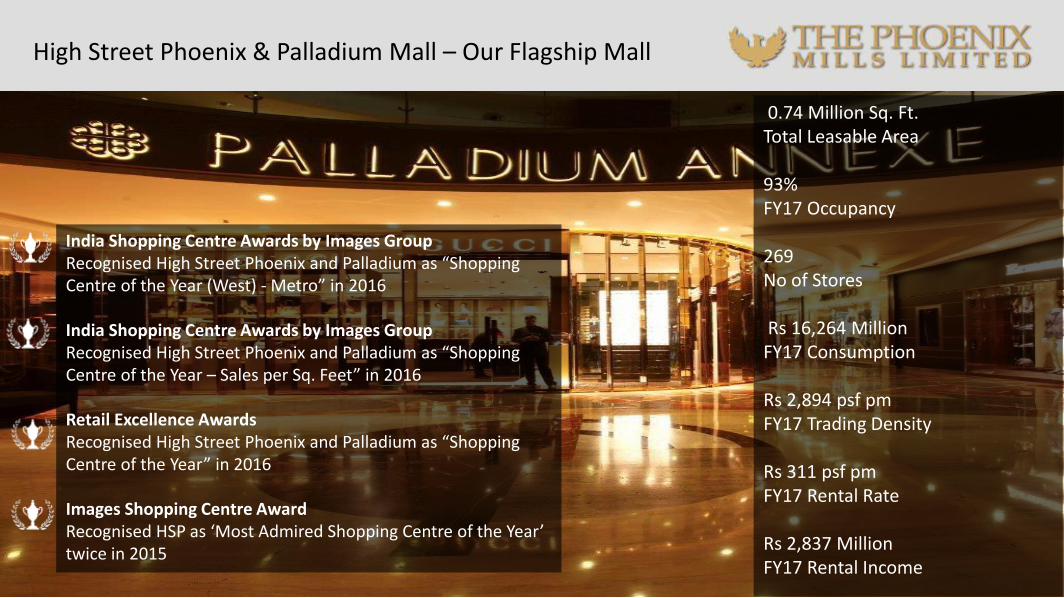
High Street Phoenix & Palladium Mall – Our Flagship Mall
50
0.74 Million Sq. Ft.Total Leasable Area
93%FY17 Occupancy
269No of Stores
Rs 16,264 MillionFY17 Consumption
Rs 2,894 psf pmFY17 Trading Density
Rs 311 psf pmFY17 Rental Rate
Rs 2,837 MillionFY17 Rental Income
India Shopping Centre Awards by Images GroupRecognised High Street Phoenix and Palladium as “Shopping Centre of the Year (West) - Metro” in 2016
India Shopping Centre Awards by Images GroupRecognised High Street Phoenix and Palladium as “Shopping Centre of the Year – Sales per Sq. Feet” in 2016
Retail Excellence Awards Recognised High Street Phoenix and Palladium as “Shopping Centre of the Year” in 2016
Images Shopping Centre AwardRecognised HSP as ‘Most Admired Shopping Centre of the Year’ twice in 2015

51
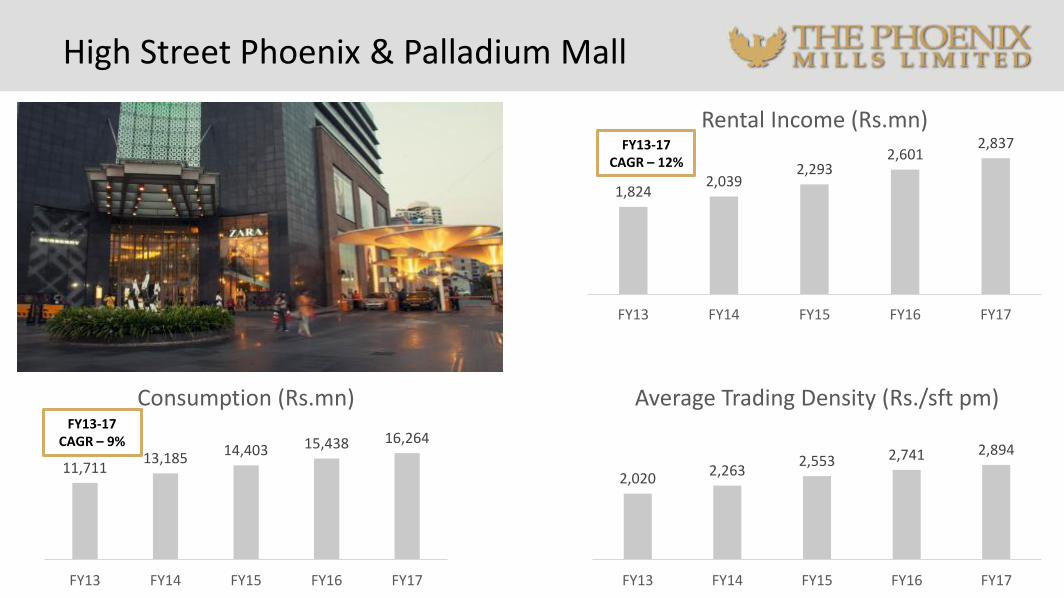
High Street Phoenix & Palladium Mall

High Street Phoenix & Palladium Mall – Housing Global Brands
52
53
1,8242,039
2,2932,601
2,837
FY13 FY14 FY15 FY16 FY17
Rental Income (Rs.mn)
11,71113,185 14,403 15,438 16,264
FY13 FY14 FY15 FY16 FY17
Consumption (Rs.mn)
2,020 2,2632,553 2,741 2,894
FY13 FY14 FY15 FY16 FY17
Average Trading Density (Rs./sft pm)FY13-17
CAGR – 9%
FY13-17 CAGR – 12%
High Street Phoenix & Palladium Mall
54
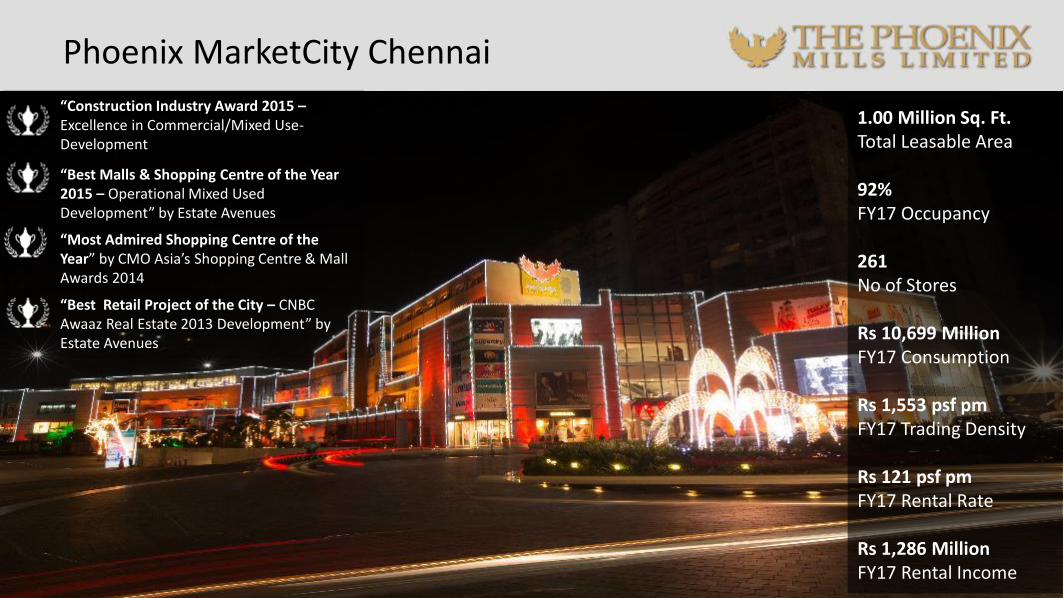
“Best Malls & Shopping Centre of the Year 2015 – Operational Mixed Used Development” by Estate Avenues
“Most Admired Shopping Centre of the Year” by CMO Asia’s Shopping Centre & Mall Awards 2014
“Best Retail Project of the City – CNBC Awaaz Real Estate 2013 Development” by Estate Avenues
“Construction Industry Award 2015 –Excellence in Commercial/Mixed Use-Development
1.00 Million Sq. Ft.Total Leasable Area
92%FY17 Occupancy
261No of Stores
Rs 10,699 MillionFY17 Consumption
Rs 1,553 psf pmFY17 Trading Density
Rs 121 psf pmFY17 Rental Rate
Rs 1,286 MillionFY17 Rental Income
Phoenix MarketCity Chennai
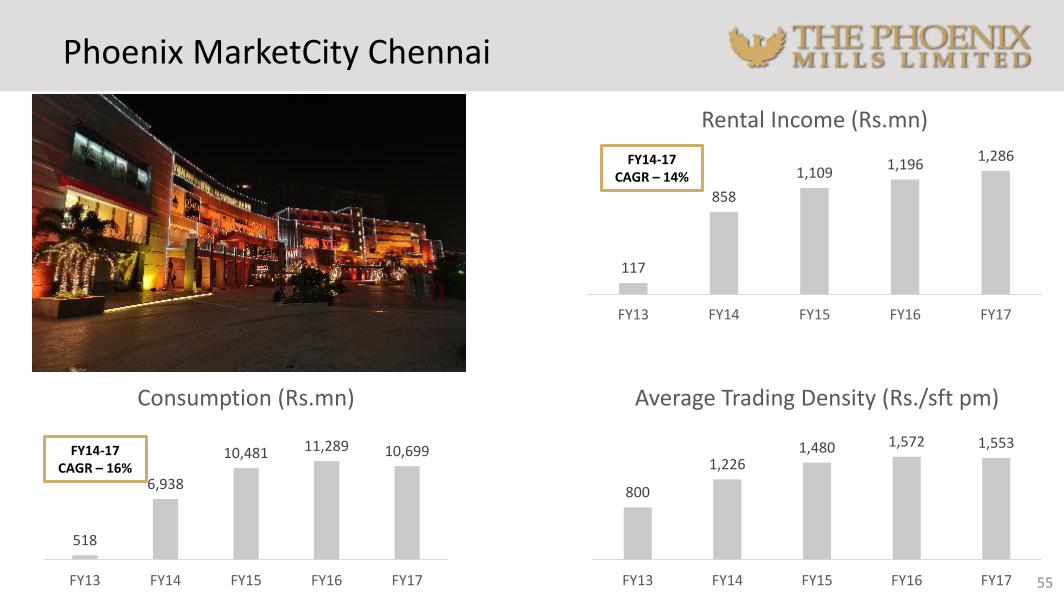
117
858
1,1091,196
1,286
FY13 FY14 FY15 FY16 FY17
Rental Income (Rs.mn)
55
518
6,938
10,481 11,289 10,699
FY13 FY14 FY15 FY16 FY17
Consumption (Rs.mn)
800
1,2261,480 1,572 1,553
FY13 FY14 FY15 FY16 FY17
Average Trading Density (Rs./sft pm)
FY14-17 CAGR – 16%
FY14-17 CAGR – 14%
Phoenix MarketCity Chennai

56
0.99 Million Sq. Ft.Total Leasable Area
90%FY17 Occupancy
296No of Stores
Rs 10,200 MillionFY17 Consumption
Rs 1,444 psf pmFY17 Trading Density
Rs 102 psf pmFY17 Rental Rate
Rs 1,090 MillionFY17 Rental Income
Asia Shopping Centre & Mall Awards 2014 – Most admired marketing campaign of the year
CNBC Awaaz Real Estate Awards 2013 – Best retail project of the city –PMC Bengaluru
Phoenix MarketCity Bengaluru

Phoenix MarketCity Bengaluru
603768
876958
1,090
FY13 FY14 FY15 FY16 FY17
Rental Income (Rs.mn)
57
3,832
6,5737,753
8,85910,200
FY13 FY14 FY15 FY16 FY17
Consumption (Rs.mn)
745975
1,1311,287
1,444
FY13 FY14 FY15 FY16 FY17
Average Trading Density (Rs./sft pm)
FY13-17 CAGR – 16%
FY13-17 CAGR – 28%

58
Most Admired Shopping Centre West ,
Non Metro – Images Shopping Centre
Award 2016
Images Shopping Centre Award (ISCA)
for the Most Admired Shopping Centre
2014
Shopping Centre of the year at the CMO
Asia Retail Excellence Award 2014
Images Most Admired Shopping Centre
of the Year” at Images Shopping Centre
Awards 2013
“IMAGES Most Admired Shopping Centre
Marketing & Promotions Of The Year” at
Images Shopping Centre Awards 2013
Best retail project in Pune at the CNBC
AWAAZ Real Estate Awards 2012
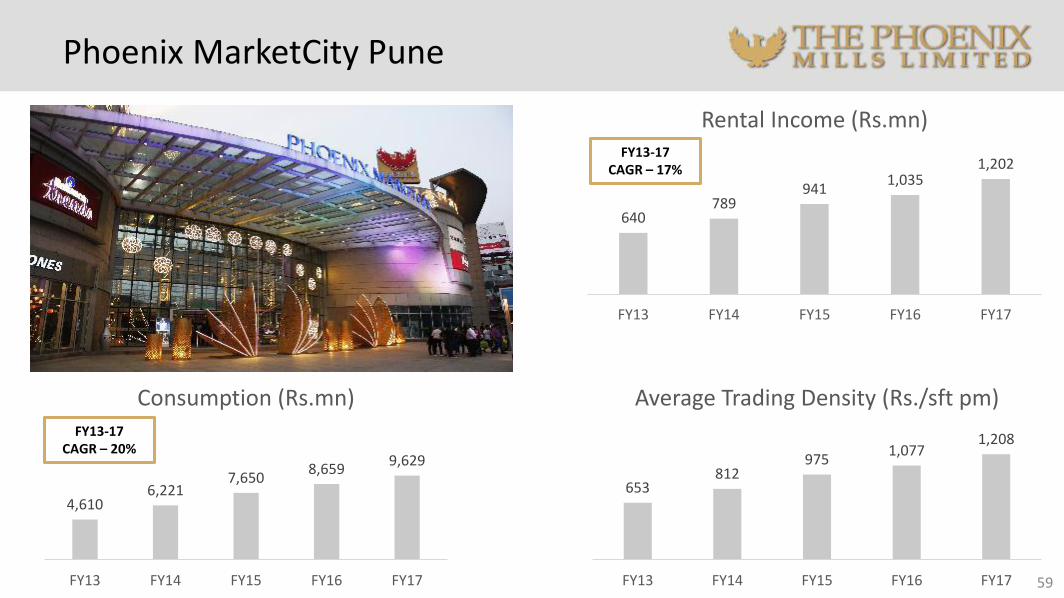
1.19 Million Sq. Ft.Total Leasable Area
89%FY17 Occupancy
341No of Stores
Rs 9,629 MillionFY17 Consumption
Rs 1,208 psf pmFY17 Trading Density
Rs 99 psf pmFY17 Rental Rate
Rs 1,202 MillionFY17 Rental Income
Phoenix MarketCity Pune
Phoenix MarketCity Pune
640789
9411,035
1,202
FY13 FY14 FY15 FY16 FY17
Rental Income (Rs.mn)
59
4,6106,221
7,6508,659
9,629
FY13 FY14 FY15 FY16 FY17
Consumption (Rs.mn)
653812
9751,077
1,208
FY13 FY14 FY15 FY16 FY17
Average Trading Density (Rs./sft pm)
FY13-17 CAGR – 17%
FY13-17 CAGR – 20%

60
“India’s best existing neighbourhood shoppingmall 2013-14” awarded by Estate Avenues
“Best Thematic decoration” by Asia ShoppingCentre & Mall Awards , awarded by CMO Asia
1.11 Million Sq. Ft.Total Leasable Area
87%FY17 Occupancy
317No of Stores
Rs 6,957 MillionFY17 Consumption
Rs 942 psf pmFY17 Trading Density
Rs 81 psf pmFY17 Rental Rate
Rs 926 MillionFY17 Rental Income
Phoenix MarketCity Mumbai

Phoenix MarketCity Mumbai
750
934 991 954 926
FY13 FY14 FY15 FY16 FY17
Rental Income (Rs.mn)
61
2,818
4,4605,480 5,957
6,957
FY13 FY14 FY15 FY16 FY17
Consumption (Rs.mn)
454586
705797
942
FY13 FY14 FY15 FY16 FY17
Average Trading Density (Rs./sft pm)
FY13-17 CAGR – 5%
FY13-17 CAGR – 25%

Retail Portfolio – Snapshot62
Consumption (Rs. mn) Rental Income (Rs. mn)Average Trading Density
(Rs./sft pm)
FY13 FY14 FY15 FY16 FY17 FY13 FY14 FY15 FY16 FY17 FY13 FY14 FY15 FY16 FY17
HSP & Palladium 11,711 13,185 14,403 15,438 16,264 1,824 2,039 2,293 2,601 2,839 2,020 2,263 2,553 2,741 2,894
PMC, Chennai 518 6,938 10,481 11,289 10,699 117 858 1,109 1,196 1,286 800 1,226 1,480 1,572 1,553
PMC, Bengaluru 3,832 6,573 7,753 8,859 10,200 603 768 876 958 1,090 745 975 1,131 1,287 1,444
PMC, Pune 4,610 6,221 7,650 8,659 9,629 640 789 941 1,035 1,202 653 812 975 1,077 1,208
PMC, Mumbai 2,818 4,460 5,480 5,957 6,957 750 934 991 954 926 454 586 705 797 942
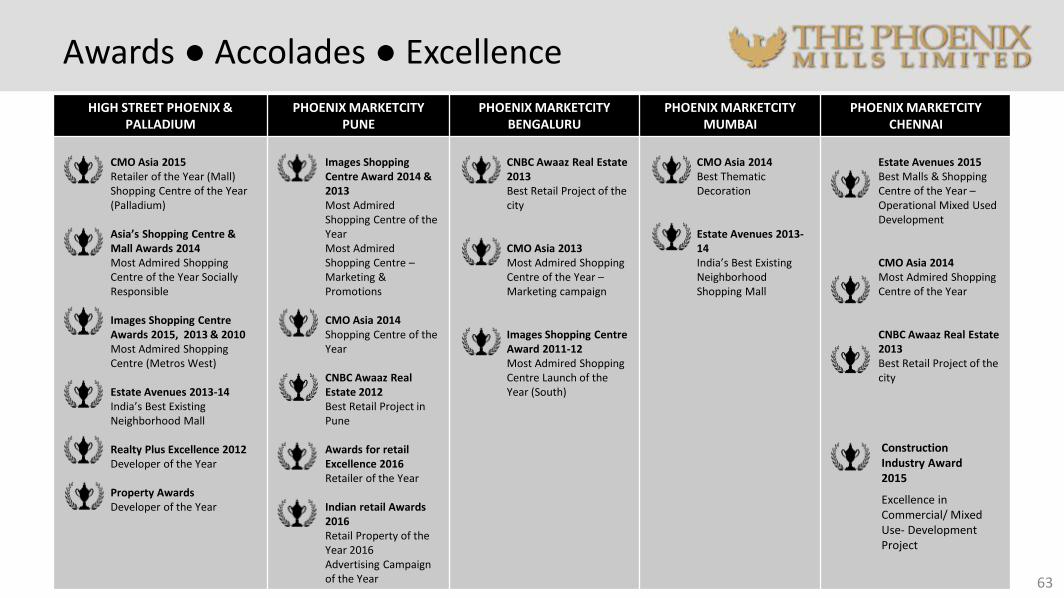
Awards ● Accolades ● Excellence
63
HIGH STREET PHOENIX & PALLADIUM
PHOENIX MARKETCITY PUNE
PHOENIX MARKETCITY BENGALURU
PHOENIX MARKETCITY MUMBAI
PHOENIX MARKETCITY CHENNAI
CMO Asia 2015Retailer of the Year (Mall)Shopping Centre of the Year (Palladium)
Asia’s Shopping Centre & Mall Awards 2014Most Admired Shopping Centre of the Year Socially Responsible
Images Shopping Centre Awards 2015, 2013 & 2010Most Admired Shopping Centre (Metros West)
Estate Avenues 2013-14India’s Best Existing Neighborhood Mall
Realty Plus Excellence 2012Developer of the Year
Property AwardsDeveloper of the Year
Images Shopping Centre Award 2014 & 2013Most Admired Shopping Centre of the YearMost Admired Shopping Centre –Marketing & Promotions
CMO Asia 2014Shopping Centre of the Year
CNBC Awaaz Real Estate 2012Best Retail Project in Pune
Awards for retail Excellence 2016Retailer of the Year
Indian retail Awards 2016Retail Property of the Year 2016Advertising Campaign of the Year
CNBC Awaaz Real Estate 2013Best Retail Project of the city
CMO Asia 2013Most Admired Shopping Centre of the Year –Marketing campaign
Images Shopping Centre Award 2011-12Most Admired Shopping Centre Launch of the Year (South)
CMO Asia 2014Best Thematic Decoration
Estate Avenues 2013-14India’s Best Existing Neighborhood Shopping Mall
Estate Avenues 2015Best Malls & Shopping Centre of the Year –Operational Mixed Used Development
CMO Asia 2014Most Admired Shopping Centre of the Year
CNBC Awaaz Real Estate 2013Best Retail Project of the city
Excellence in Commercial/ Mixed Use- Development Project
Construction Industry Award 2015

64

Project Name LocationNo. of towers
Saleable area (msf)
Commencement of planning
Launch dateExpected Date of
completion
Rajajinagar,Bengaluru
9 2.20 Q2 2011Phase I – Q3 2012Phase II – Q4 2014
Phase I (Towers 1-5)2016
Phase II Towers 6Q3 2018
Towers 7-9 – Under Planning
Rajajinagar,Bengaluru
5 0.99 Q3 2013 Q1 2015 Q2 2018
Whitefield,Bengaluru
2 1.02 Under planning Under Planning Under Planning
Nagar Road, Pune
2 0.35 Under Planning Under Planning Under Planning
Velachery, Chennai
4 0.94 2009
Tower A, B & C – Q3 2011
Tower D – Under Planning
ConstructionCompleted. Awaiting
Occupation Certificate
TOTAL 5.51
Overview of Key Mature Residential Projects
Key Residential Projects Ongoing / Planned
65
Note – Year denotes calendar year

Awards ● Accolades ● Excellence
66
ONE BANGALORE WEST KESSAKU FOUNTAINHEAD
Asia Pacific Property Awards 2013Developer Website
7th Estate Awards 2014(Franchise India & ET NOW)Regional Project of the Year – South
Asia Pacific Property Awards 2015Architecture Multiple ResidenceResidential High-rise Development
3rd Asian CEF Awards 2014The Residential Project of the Year –Towers
7th Estate Awards 2014(Franchise India & ET NOW)Project of the Year – National
Asia Pacific Property Awards 2015Development MarketingResidential Property Interior (Show Home)
Designomics Awards 2014Integrated Design Project / Marketing StrategyDirect Response – Brochures / Catalogue
3rd Asia CEF Awards 2014The Residential Project of the Year –Residential Buildings
Asia Pacific Property Awards 2015Apartment/CondominiumDeveloper WebsiteDevelopment MarketingResidential Interior (Show Home)
Designomics Awards 2014Integrated Design Project / Marketing StrategyDirect Response – Brochures / Catalogue
Estate Award 2015
Best Marketer of the year 2015
Best Marketer of the year 2015
Estate Award 2015
Estate Award 2015Best Marketer of the year 2015
CNBC-AWAAZ Real Estate Awards 15-16
Best Residential Project in Bengaluru City (Luxury)

67

Project name Location Total area
(msf) Expected Date of
Completion
Phoenix House Lower Parel, Mumbai 0.13 Completed
Centrium Kurla, Mumbai 0.28 Completed
East Court Viman Nagar, Pune 0.25 Completed
Paragon Plaza Kurla, Mumbai 0.24 Completed
Art Guild House Kurla, Mumbai 0.76 Completed
West Court * Viman Nagar, Pune 0.28 -
TOTAL 1.92
Commercial Portfolio – Building an Annuity Business
* Planned Project
68

69

Hospitality
70
The St. Regis,
Mumbai
Courtyard by Marriott
Agra
Year of Establishment 2012 2015
Total Rooms 395 193
Restaurants & Bar 10 4

The St. Regis, Mumbai
71
9,574
8,105 8,1999,284
10,594
FY13 FY14 FY15 FY16 FY17
ARR (Rs.)
54%46%
67%72% 72%
FY13 FY14 FY15 FY16 FY17
Occupancy (%)
WEDDING SETUP AT THE ST.REGIS, MUMBAI
LIVING ROOM INSIDE THE SUITE AT THE ST.REGIS, MUMBAI

Restaurants & Banquets
LI BAI
Restaurants atThe St. Regis,
Type
Piano Lounge & Bar Lobby Lounge
Seven KitchensAll Day, Global
Cuisine
The Sahib Room & Kipling Bar
Indian
By the Mekong Asian
Luna Gusta European
Luna Nuda Eclectic Bar
EXO Night Club
YUUKA by Ting Yen Modern Japanese
Zenith Party Suite Private Party Suite
ASILOAl Fresco Roof Top
Bar
72
Banquets at The St. Regis (42,500 SQ.FT)
8th Floor Banquets
Banquets I – Pallazzio
Banquets II – Imperial Hall
Banquets III – Alhambra
Grand Hall - Pre-function Area
Grand Cru Salon – Party Room
9th Floor Banquets
Grand Ball Room
Bridal Room
Pre-function Area
Open air panoramic Terrace GardenBANQUETS
of revenue contributed by
F&B and banquets
68403
7671,253 1,343
94
481
951
1,210 1,177
FY13 FY14 FY15 FY16 FY17
Rooms & Others F&B and Banquet
Restaurants at Courtyard by Marriott
MoMo Café
MoMo to Go
Anise
MoMo To You
47%
Banquets at Courtyard by Marriott
The Grand Ballroom
Crystal Ballroom
Jasper
Emerald
Amethyst
Jade

Awards and Accolades
2014Times Food & Nightlife Awards
• Seven Kitchens: Winner of Best All Day
Restaurant (South Mumbai, Fine Dining• By the Mekong: Winner of Best Thai Restaurant
(Newcomer, South Mumbai, Fine Dining)• Li Bai: Winner of Best Bar
(South Mumbai)
TripAdvisorCertificate of Excellence 2014
Condé Nast Readers’ Travel Awards 2014Favorite New Leisure Hotel in India(Runners Up)
YUUKA by Ting Yen
73
2015Times Food & Nightlife Awards
The Sahib Room & Kipling Bar: Winner of Best Indian (Noteworthy Newcomer South Mumbai, Fine Dining)
Yuuka: Winner of Best Japanese (Noteworthy Newcomer South Mumbai, Fine Dining)
Booking.comAward of Excellence 2014, Preferred Hotel
ClearTripAward of Excellence 2014
THE SAHIB ROOM & KIPLING BAR
2016Times Food & Nightlife Awards
The Sahib Room & Kipling Bar: Winner of Best Indian Restaurant
EXO: Winner of Best Nightclub
LI BAI – Winner of Best BarBy the Mekong – Winner of the best Thai restaurantBooking.comAward of Excellence 2014, Preferred Hotel
TTJ Award Jury Choice award, 2016 for Innovative Edge in creating luxury experiences in India
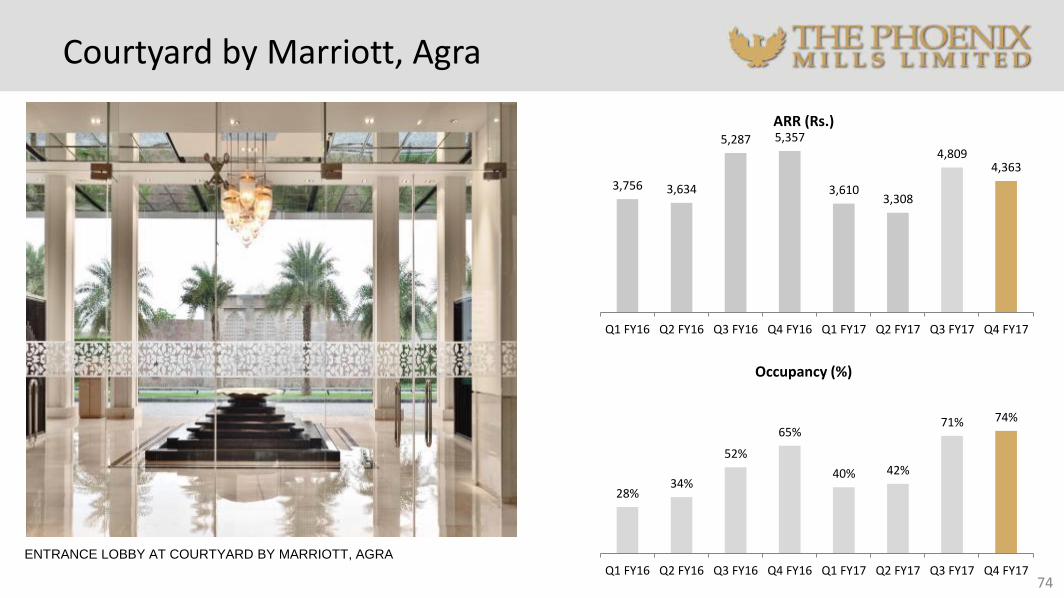
Courtyard by Marriott, Agra
74
3,756 3,634
5,287 5,357
3,6103,308
4,8094,363
Q1 FY16 Q2 FY16 Q3 FY16 Q4 FY16 Q1 FY17 Q2 FY17 Q3 FY17 Q4 FY17
ARR (Rs.)
28%34%
52%
65%
40% 42%
71% 74%
Q1 FY16 Q2 FY16 Q3 FY16 Q4 FY16 Q1 FY17 Q2 FY17 Q3 FY17 Q4 FY17
Occupancy (%)
ENTRANCE LOBBY AT COURTYARD BY MARRIOTT, AGRA

Restaurants – F&B Concept
• 7 Food & Beverage Concepts/ brands rolled out across 13 stores (2 are under fit-outs)• Potential for more rollouts with opportunities across all Phoenix malls at initial stage• Adds to Phoenix malls leisure and entertainment bouquet, creating a larger consumption center• Scalable model that can be replicated on a Pan India basis at other malls & stand alone locations
75
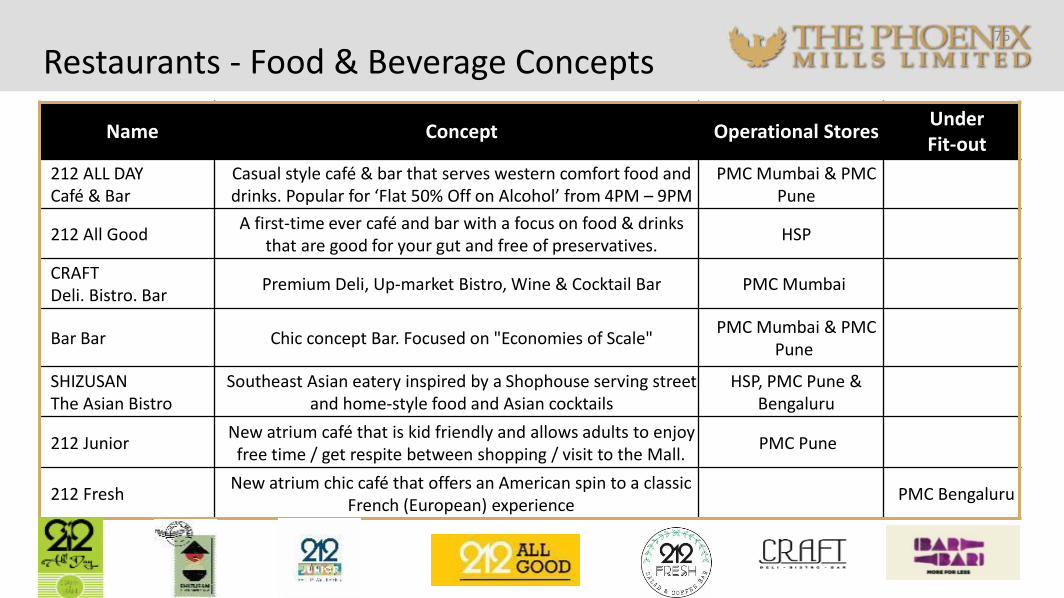
Restaurants - Food & Beverage Concepts76
Name Concept Operational StoresUnder Fit-out
212 ALL DAYCafé & Bar
Casual style café & bar that serves western comfort food and drinks. Popular for ‘Flat 50% Off on Alcohol’ from 4PM – 9PM
PMC Mumbai & PMC Pune
212 All GoodA first-time ever café and bar with a focus on food & drinks
that are good for your gut and free of preservatives.HSP
CRAFTDeli. Bistro. Bar
Premium Deli, Up-market Bistro, Wine & Cocktail Bar PMC Mumbai
Bar Bar Chic concept Bar. Focused on "Economies of Scale"PMC Mumbai & PMC
Pune
SHIZUSANThe Asian Bistro
Southeast Asian eatery inspired by a Shophouse serving street and home-style food and Asian cocktails
HSP, PMC Pune & Bengaluru
212 JuniorNew atrium café that is kid friendly and allows adults to enjoy
free time / get respite between shopping / visit to the Mall. PMC Pune
212 FreshNew atrium chic café that offers an American spin to a classic
French (European) experiencePMC Bengaluru

Thank You!
77
For more information on the Company, its projects and services please log on to
www.thephoenixmills.comor contact:
Varun Parwal
Contact: +91 22 30016737
Email: [email protected]
Advait Phatarfod
Contact: +91 22 30016804
Email: [email protected]
Pawan Saxena
Contact: +91 22 30016849
Email: [email protected]