Q1 2017 Investor Presentation - Dubai Investments · 22 Years of Building Businesses and Creating...
40
Dubai Investments PJSC Q1 2017 Investor Presentation
Transcript of Q1 2017 Investor Presentation - Dubai Investments · 22 Years of Building Businesses and Creating...

Dubai Investments PJSCQ1 2017 Investor Presentation

Content
2
Page 3 Management Summary
Page 11 Q1 2017 Financial Highlights
Page 23 Outlook & Guidance
Page 27 Portfolio Information
Page 40 Disclaimer – Forward Looking Statements

Management Summary

62%18%
[PERCE
NTAGE
]
Real Estate
Manufacturing
& Contracting
Investments
Largest Listed Investment Company on DFM with Market Cap. of c. AED 10 Bn
4
Dubai Investments Overview – Total Assets of over AED 16 billion with 17,500 shareholders
� DI was established in 1995 as an onshore investment company;paid-in capital of approx. AED 4 billion
� An incubator of industrial and manufacturing businesses into the
country, DI has an active management of a diversified portfolio ofover 40 subsidiary companies with more than 3,800 employees
� Operates in real estate, manufacturing, contracting andinvestment businesses:
— Undertakes real estate projects – development/leasable assets
— Manufactures and sells materials used in construction projects
— Executes construction contracts
— Produces and distributes pharmaceuticals, aluminum, extruded
products and laboratory furniture
— Invests in new ventures and initial public offers, bonds, fundsand equities
� Long-term play on infrastructure growth and industrialdevelopment that generates attractive shareholder returns through
market cycles
A Consistently Growing Asset Base (in AED Bn)
Strictly Private & Confidential
Source: DI Management
Business Segments by Assets (Q1 2017)
Shareholders
[VALU
E]6.1%
5.1%
77.3%
Investment
Corporation of
DubaiHassan Al
Fardan Group
Mohamed Saif
Darwish Ahmed
Al KetbiPublic
AED
16.8 bn
13.2 13.5 14.2 14.5 14.7 14.8 15.0 15.3 15.6 15.7 16.1 16.1 16.8
1Q14
2Q14
3Q14
4Q14
1Q15
2Q15
3Q15
4Q15
1Q16
2Q16
3Q16
4Q16
1Q17

22 Years of Building Businesses and Creating Shareholder Value
5
Al Mal Capital
1996
Marmum
1997
Emirates Building Systems
Emirates Glass
Dubai Investments Park
Globalpharma
Masharie
1998
Lumiglass
2003
Dubai Real Estate Investments
2006
Emirates Float Glass
Al Taif
2007
Techsource
2008
Emirates Insolaire
2013
EMICOOL
2002
Properties Investment
Palisades Development
2015
1999
2016
2000 DFM Listing
1995
Masharie (-40%)
Marmum
Technical & International Rubber
Globalpharma (-66%)
Metrofile
Al Arif Contracting, Anchor Allied, Inter-Chemi, Stromek, Power Factor
2009
2010
2008
2015
2014
2016
EXITS
INVESTMENTS
KCH Healthcare
MODUL
2016
Mirdif Hills
United Sales Partners
Long-term investment approach in building underlying value of investees – provide the necessary strategic direction along
with growth capital; Exit businesses which have matured - enhance shareholder value through the capital gains
Strictly Private & Confidential

6
Significantly Outperformed both DFM Index and Real Estate Index
DI has been enhancing shareholder returns
Strictly Private & Confidential
0
100
200
300
400
500
600
Jan-13 May-13 Sep-13 Jan-14 May-14 Sep-14 Jan-15 May-15 Sep-15 Jan-16 May-16 Sep-16 Jan-17 May-17
Dubai Investments DFM Index DFM Real Estate Index
189%
98%
8%
Divestment of 51% stake in Anchor Allied
Factory Ltd
Acquisition of 51% Undisclosed Real
Estate
Acquisition of 59.66% Stake in Al Mal
Capital PSC
Divestment of DII subsidiary Marmum Dairy Farm and its
distribution arm United Sales Partners
Acquisition of Emirates Float
Glass
Divestment of 66% in
Globalpharma Divestment of 51% stake un Techno rubber & International
Rubber (for Each)
Exchange Dubai Financial Market
Symbol DFM:DIC
ISIN AED000601016
Sector Investments & Financial Services
Issued capital AED 4,049,452,642,000
Auditors KPMG
2016 Dividend 12% Cash and 5% Bonus shares

Board of Directors
7
Chairman – Suhail Bin Fares Al MazruiSuhail Bin Fares Al Mazrui holds a University Degree in Petroleum Engineering.
He has a wide experience in Petroleum Engineering and executive experience in
the Oil Industry. He is the former CEO of Abu Dhabi National Oil Company
(ADNOC) as well as the ex-CEO and Chairman of Aabar. He is presently a
Member on the Board of Abu Dhabi Securities Exchange. Mr. Al Mazrui has
been on the Board of Directors of Dubai Investments PJSC since its inception in
1995 and Chairman since 2010
Director – Mohamed Saif Darwhish Ahmed Al KetbiMohamed Al Ketbi has a degree in Business Administration majoring in Business
Management. His area of expertise is in Investments & Projects, Business
Development, Real Estate and the Hospitality Sectors. He is currently the Vice
Chairman of Danat El Emarat Women & Children’s Hospital Project and a Board
Member of Tasweek Real Estate Company and Board member of AHI-Carrier
FZC. Mr.Mohamed Saif Darwish Ahmed Al Ketbi has been a member of the
Board of Directors of Dubai Investments PJSC since 2010
Managing Director & CEO – Khalid Jassim Bin KalbanKhalid Kalban has a degree in Business Management from U.S.A. and also
majored in management at the Metropolitan State College, U.S.A. His extensive
experience covers the industrial, financial, investment and real estate sectors.
He currently holds many important positions including, Managing Director and
Chief Executive Officer of Dubai Investments PJSC since 1998, member of the
Board of Directors of National General Insurance PJSC and Thuraya
Telecommunication Company. Presently he is also the Chairman of Union
Properties PJSC
Director – Ali Fardan Al FardanAli Fardan is a Bachelor of Science in Management and Information System. He
has been involved with Real Estate Management, Property Investments, Capital
Investment Management and Hospitality Management. Mr. Ali Al Fardan is the
Vice Chairman of Al Fardan Group, Dubai, CEO of First Investor LLC, Managing
Director of Al Fardan Real Estate etc. He is on the Board of Directors of Union
Properties PJSC as well as Commercial Bank of Dubai. Mr. Ali Fardan Al Fardan
joined the Board of Directors of Dubai Investments PJSC in 2002
Director – Hussain Mahyoob Sultan Al JunaidyHussain Mahyoob Sultan is a Bachelor of Science in Civil Engineering as well as
a Chartered Civil Engineer. He is also a graduate of the School of Business,
University of Pittsburg, USA. In the past he has been the Chairman and CEO of
a number of companies in the oil and gas industry. He was also the ex-founder
and Group CEO of Emirates National Oil Company (ENOC). Mr. Al Junaidy has
been on the Board of Dubai Investments PJSC since its inception in 1995 and
Vice Chairman since 2010
Director – H.E. Abdulrahman Ghanem A. Al MutaiweeH.E. Abdulrahman Ghanem A. Al Mutaiwee is a high-ranking diplomat and has
held senior management positions in various ministries and government
establishments.
He has also served as the Ambassador of the UAE to the Court of St. James
and Iceland. He is currently the Director in the Ministry of Foreign Affairs and
International Cooperation. He holds a Bachelor’s Degree in Economics from
Cairo University and Diploma in Banking and Financial Studies from New York.
Director – Mr. Khaled Mohammad Al KamdaKhaled Al Kamda has over three decades of senior management experience
across a number of sectors including airlines, private equity and banking. He
holds a Bachelor’s Degree in Electrical Engineering from Florida Institute of
Technology, USA and a Management Degree from Cranfield School of
Management, England.

Diversified Portfolio of Assets, with a Focus on Real Estate
8
Total AssetsAED 16.8 BNAs at 31st March 2017
Amounts in AED
10.5billion
57.5%
REAL ESTATEIncome generation from
sales and leasing
3.3billion22.2%
INVESTMENTSEquity & Fixed Income Funds
and Minority Investments
3.1billion20.3%
MANUFACTURING & CONTRACTING
Private Equity
AL TAIF
INVESTMENTS
2.9%
DUBAI INVESTMENTSREAL ESTATE COMPANY
33.3%
PROPERTIESINVESTMENTS
8.9%
GLASS
6.4%
MASHARIE
5.2%
DUBAI INVESTMENTS
INDUSTRIES
4.4%
EMICOOL
2.8%
*Percentages highlighted above relate to Q1 2017 total assets
TREASURYPORTFOLIO
& OTHER
17.7%
AL MAL CAPITAL
3.3%
5,631m
3,515m
939m
479m
DUBAI INVESTMENTSPARK DEV. COMPANY
53.3%
1,065m 874m 743m 473m
556m
2,960m

Q1 2017 INCOME
9
TOTAL AREA
23million m2
NET LEASE
AREA
17million m2
LEASED
98%
COMMERCIAL
8%
LEASED PLOTS
~1,000
INDUSTRIAL
60%
186AED million
RESIDENTIAL
32%
Flagship asset: Dubai Investments Park - a “City within a City”
10
� Investment in a broad range of industrial companies - greenfield to mature
businesses
� Real estate & investment portfolio designed to perform through market cycles and
generate a steady and sustainable cash flow stream
� Launch healthcare and education sector funds
Diversification
� Target minimum ROE of 10%
� Strong focus on attractive dividend payout and total shareholder returnReturn Focused
� Synergistic investment portfolio across industry value chains
� Replicable business models to build scale (e.g. DIP) within the GCC/MENA regionSynergy & Scale
� Prudent approach to balance sheet and portfolio risk management
� Maintain healthy cash position
� Slowly increase leverage to increase overall returnsRisk Management
Management Strategy: Generate Sustainable Cash Flows to Maximize Shareholder Returns

Q1 2017 - Financial Highlights

12
� Total income reach AED 697.2 million backed by continued growth in rental income as well asgain in fair valuation gain of investment properties
� Total assets of approx. AED16.8 billion with healthy cash balanceGroup Result
� Mirdif Hills Project in Dubai, total project value of approximately AED 3 billion� Expansion of Green Community West project (Phase 3) in DIP
� Fujairah Business Centre by Al Taif Investment with a total project value of AED 700 million� Mixed-use Riyadh Investments Park in Saudi Arabia
Real Estate Projects
� Growth in rental income by 8% in Q1 2016 (compared to Q1 2015), driven by increase in rentalincome at DIP – new companies being set-up and increase in sub-lease income
� Scale down of non-profitable businesses reduced income manufacturing and contracting sectorsmoderately
Portfolio
� Focus on education and healthcare sectorsDiversification
Key Messages – Q1 2017

13
EBITDA
149.8AED million
NET PROFIT
288.9AED million
EPS
0.07AED per share
TOTAL INCOME
697.2AED million
TOTAL EXPENSES
(452.8)AED million
TOTAL ASSETS
16.8AED billion
CASH
1.5AED billion
TOTAL LIABILITES
4.6AED billion
DEBT / EQUITY
15.5%
ROE
10%
Q1 2017 – Financial Performance at a glance

14
Income and earnings (AED m)
Q1 17 Q1 16 q-o-q (%)
Total income 697.2 714.7 (2.4%)
Total expenses (Direct Operating Costs, S.G.&A, Finance Expenses) (452.8) (447.8) (1.1)%
Profit for the period 275.5 291.6 (5.5%)
Attributable profit 288.9 297.5 (2.9%)
EBITDA 149.8 324.9* (53.9%)
EPS (AED) 0.07 0.07 -
ROE % 10% 10.8% -0.8%
ROA % 6.9% 7.6% -11.9%
Q1 2017 – Key Performance Indicators
*Includes gin on disposal of subsidiaries – Marmum Dairy and United Sales Partners – AED 186.6 mn

15
714.7657
814.3 865.0
697.2
Q1 2016 Q2 2016 Q3 2016 Q4 2016 Q1 2017
Total Income (AED m)
207.0 217.2 230.1 220.4 224.0
0
50
100
150
200
250
Q1 2016 Q2 2016 Q3 2016 Q4 2016 Q1 2017
… of which Rental Income (AED m)
423.1 445.7 474.1 501.4421.7
Q1 2016 Q2 2016 Q3 2016 Q4 2016 Q1 2017
Total Expenses (AED m)
297.5
218.4
334.4368.0
289.0
Q1 2016 Q2 2016 Q3 2016 Q4 2016 Q1 2017
Attributable Profit (AED m)
Income Evolution by Quarter

Total Income Bridge (AED m)
16
715
(16)
17
(11) (1) (1)
3 1
175 2 0
([VALUE])
697
Q1 2016 Sale of goods Rentalincome
Contractrevenue
Sale ofproperties
Loss on fairvaluation
Gain/(loss) onsale of
investments
Gain on saleof investment
properties
Gain on fairvaluation ofinvestmentproperties
Dividendincome
Share ofprofit from
equityaccountedinvestees
Gain ondisposal ofsubsidiaries
Q1 2017
Q1 2017 Total Income Movement Year-on-Year

Rental income (AED m)
17
130122
141 134143
151
173
145
165
187 188199
207217
230220 224
121109
124115
123139
154
130
150164 159 162
172183 190
180 186
Q12013
Q22013
Q32013
Q42013
Q12014
Q22014
Q32014
Q42014
Q12015
Q22015
Q32015
Q42015
Q12016
Q22016
Q32016
Q42016
Q12017
Total Rental Income DIP Income
Continued Strong Growth in Rental Income

18
Total Assets (AED bn) Total Liabilities & Equity (AED bn)
9.710.9 11.1
5.85.2
5.7
31-Mar-16 31-Dec-16 31-Mar-17
Non-current assets Current assets
11.0 11.4 11.7
2.6 2.52.7
1.6 1.71.9
31-Mar-16 31-Dec-16 31-Mar-17
Shareholders' equity Current liabilties Non-current liabilities
Balance Sheet Development

19
Total Assets Growth (AED bn)
8.9 9.0 9.0 8.8 9.0 9.1 9.3 9.7 9.7 10.5 10.9 10.9 11.1
4.3 4.5 5.2 5.7 5.7 5.6 5.7 5.6 5.85.2 5.2 5.2 5.7
1Q 14 2Q 14 3Q 14 4Q 14 1Q 15 2Q 15 3Q 15 4Q 15 1Q 16 2Q 16 3Q 16 4Q 16 Q1 17
Total non-current assets Total current assets
DIC has maintained a disciplined approach to Asset Growth

20
Total Non-Current Assets (AED m)
[VALUE]
([VALUE])
0 154 0 3
([VALUE])
1 37
([VALUE])
28
[VALUE]
Dec-16 PP&E Goodwill &intangibles
Investmentproperties
Investments atfair value
Equityaccountedinvestees
Rentreceivable
Finance leasereceivable
Inventories Tradereceivables
Due fromrelated parties
& otherreceivables
Q1 2017
Balance Sheet Development since 31st December 2016

21
Total Current Assets (AED m)
5,213
75 59 77 70 183
5,676
Dec-16 Inventories Investments at fair value Trade receivables Due from related parties& other receivables
Cash Q1 2017
Balance Sheet Development since 31st December 2016

22
2.12.3
2.22.0
2.22.1
2.82.7
2.52.6 2.6
2.82.7
2.9 2.92.8
3.1
1Q13
2Q13
3Q13
4Q13
1Q14
2Q14
3Q14
4Q14
1Q15
2Q15
3Q15
4Q15
1Q16
2Q16
3Q16
4Q16
Q117
Total Debt (AED bn)
23.4%
25.7%
24.1%
20.9%
22.4%
20.9%
27.5%
25.7%
23.2%
24.4%
23.9%
24.6%
23.8%
25.9%
24.9%
23.5%
26.8%
1Q13
2Q13
3Q13
4Q13
1Q14
2Q14
3Q14
4Q14
1Q15
2Q15
3Q15
4Q15
1Q16
2Q16
3Q16
4Q16
Q117
Debt/equity (%)
Low Leverage Structure

Outlook & Guidance

24
� Continue to generate sustainable growth backed by recurring cash flow streams
with a high single to low double digit growth in net profitability Total Income & Net Profit
� Target: ROE of 10%ROE
� Diversify geographical footprint with expansion into Saudi Arabia and potentially
Africa
� Acquire income generating real estate assets to augment recurring cash flow
streams
� Launch investment funds of AED 1 bn each to focus on healthcare and education
Expansion
� Listing of subsidiaries (Emicool) to enhance shareholder value
� Maintain attractive dividend return profile for shareholders
Shareholder Returns
Outlook and Guidance for FY 2017

Financial Calendar
Upcoming Events:
08 March 2017 Board Meeting for finalization of FY 2016 Financials
10 April 2017 Annual General Meeting
30 April 2017 Board Meeting for finalization of Q1 2017 Financials
25

Investor Relations Contact
26
Mushtaq Masood
Group Chief Financial Officer
Dubai Investments PJSC
PO Box 28171
Dubai, UAE
Phone +971 4 8122 400
Email [email protected]
www.dubaiinvestments.com
Maher Rabah
Investor Relations
Dubai Investments PJSC
PO Box 28171
Dubai, UAE
Phone +971 4 8122 400
Email [email protected]
www.dubaiinvestments.com

Portfolio Information

28
Business Overview
Dubai Investments Park (DIP) is a self-containedmixed-use industrial, commercial and residential
complex.
Spread over a total area of 2,300 hectares, DIP isbased on a pioneering concept of creating a “city within
a city”.
Includes schools, medical centers, retail complexes,hotels and restaurants, offices and showrooms.
Major Industries
Building Materials, Printing, Food & Beverages,
Construction, Furniture, Pharmaceuticals, Plastic,Textile, Power & Utilities, Oil & Gas.
Ownership
100% Dubai Investments
Dubai Investments Park – Industrial and Commercial
29
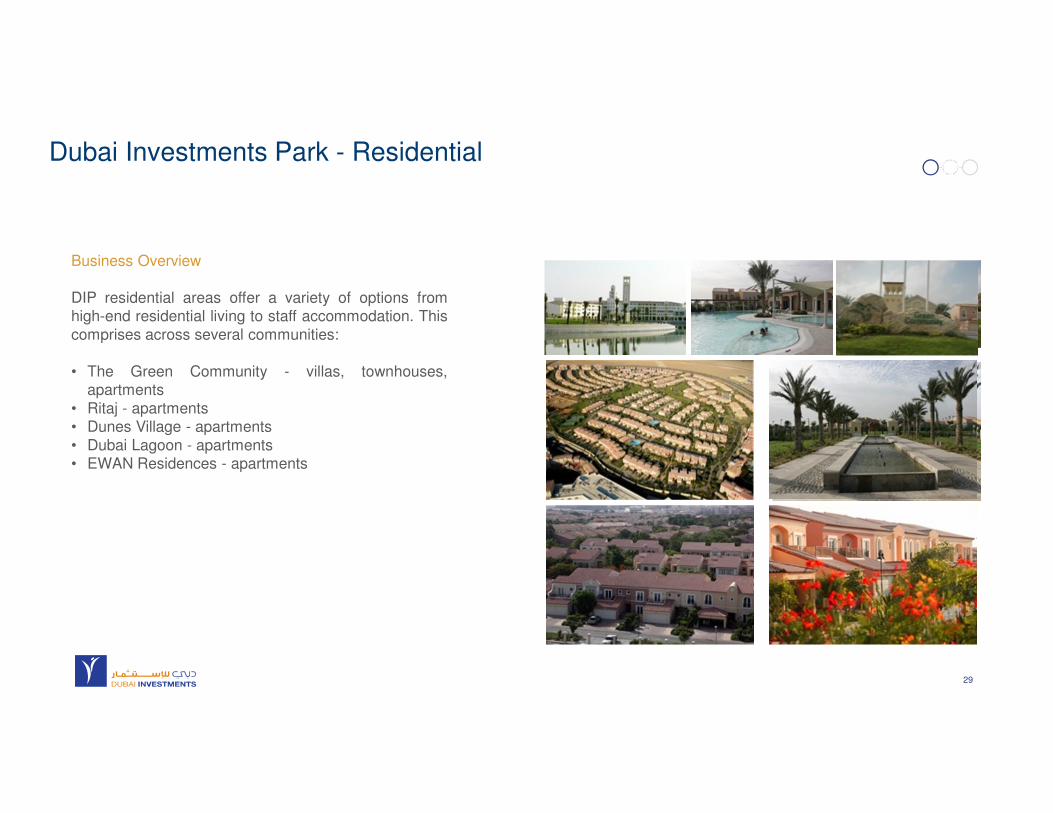
Business Overview
DIP residential areas offer a variety of options fromhigh-end residential living to staff accommodation. This
comprises across several communities:
• The Green Community - villas, townhouses,apartments
• Ritaj - apartments• Dunes Village - apartments
• Dubai Lagoon - apartments• EWAN Residences - apartments
Dubai Investments Park - Residential

30
Business Overview
Properties Investments is involved in investment in,and development of, real estate properties and has
developed prestigious residential and recreationalprojects such as the Green Community and Courtyard
Marriott in DIP. Properties Investments was formed in2002.
Properties Investment is currently working on
development of Green Community Phase 3 in DubaiInvestments Park. The project comprises of 210
townhouses, duplex apartments and retail facilities andis expected to be handed over by Q4-2017.
Ownership
70% Dubai Investments
30% Union Properties
Properties Investment

31
Ritaj residential community
Location: Dubai Investments Park
Size: 2.58 million square feet
Objects: 11 residential blocks
1,343 studio apartments447 one bedroom apartments
194 two bedroom apartments40 three bedroom apartments
The low rise community also offers shops, cafes, restaurants,
supermarket, nursery, medical center, pharmacy and mosque.
Dubai Investments Real Estate Company - Ritaj

32
Mirdif Hills is a 3.9 million sqft mixed-use residential, commercial, hotel and retail project under development
Development Overview
• Mushrif Park, Mirdif, Dubai• Freehold plot 949,999 sqft
• 993 residential apartments and 66 servicedapartments
• 4-star hotel (116 rooms + 60 hotelapartments)
• Hospital (completion expected by 2017)
Dubai Investments Real Estate Company – Mirdif Hills

33
Business Overview
Currently working to develop an AED 460 million mixed-usecommercial and residential project in Fujairah
Partnership between Dubai Investments and Government of
Fujairah
Business Overview
60% Dubai Investments40% Government of Fujairah
Al Taif Investment

34
Indoor and outdoor lighting
(JV with Philips)
Interior decoration and turnkey projects
Switchgear and electrical equipment
Laboratory and hospitalfurniture systems
Business Overview
Investments in medium and large-sized companiesoperating in construction materials, contracting, interior
design and related activities.
Ownership
75.58% Dubai Investments
Aluminum design, manufacturing and
installation
Driving school specialized for
commercial licenses
Stainless steel products
Aluminum extrusions for construction and
industrial sector
Aluminum sheet production
Masharie

35
Manufacturing of Pharmaceuticals
Software development and IT consulting
Business Overview
DII is the greenfield investment arm of Dubai Investmentsacross diversified industry sectors
• Acquired 26.75% stake in King’s College Hospital
Healthcare LLC - total project value is AED 700million,
• Acquired 30% stake in Emirates Aluminium RollingLLC in KIZAD, Abu Dhabi – total project value is AED
440 million• Acquired 90% in MODUL University Dubai
• Divested 100% of Marmum Dairy Farm and UnitedSales Partners in 2016
• Divested 66% stake in Global Pharma to Sanofi in2015
Ownership
100% Dubai Investments
Polystyrene insulation board materials
Oilseed crushing facility for vegetable oil
Overhead lifting solutions and maintenance
Steel structure manufacturing
Dubai Investments Industries
36
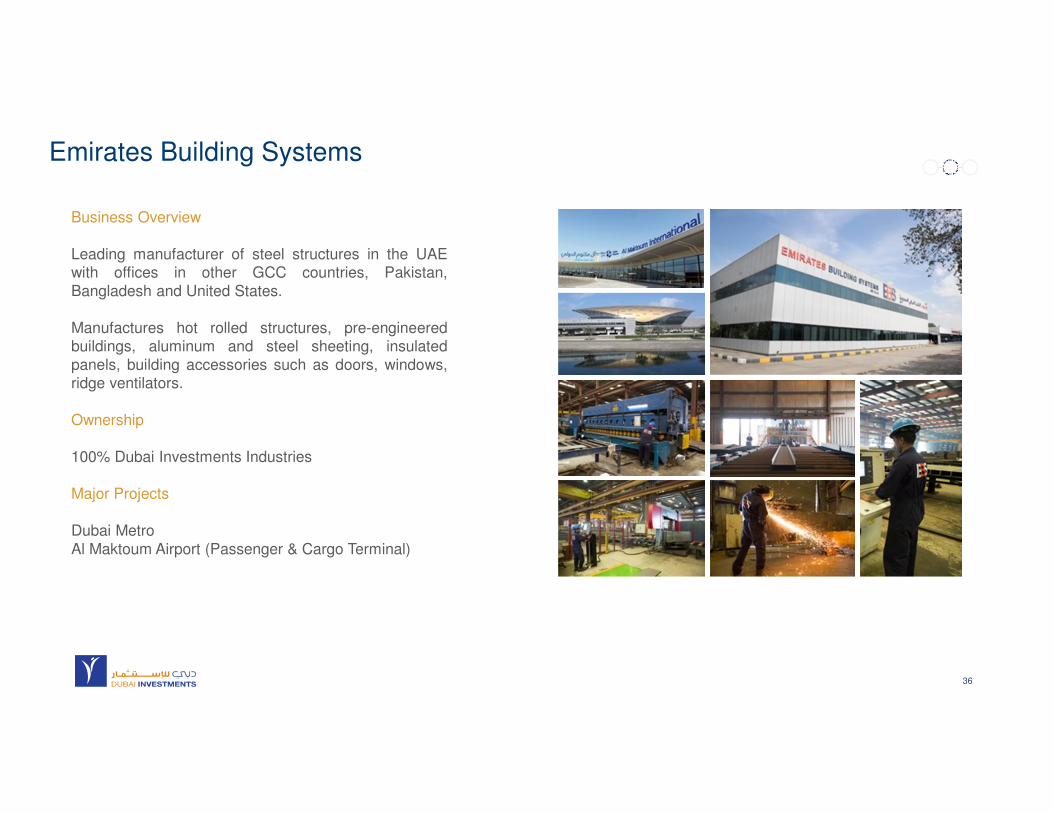
Business Overview
Leading manufacturer of steel structures in the UAEwith offices in other GCC countries, Pakistan,
Bangladesh and United States.
Manufactures hot rolled structures, pre-engineeredbuildings, aluminum and steel sheeting, insulated
panels, building accessories such as doors, windows,ridge ventilators.
Ownership
100% Dubai Investments Industries
Major Projects
Dubai Metro
Al Maktoum Airport (Passenger & Cargo Terminal)
Emirates Building Systems

37
Business Overview
Premium quality glass solutions from float glassmanufacturing of high end architectural glass and float
laminated glass
Five subsidiaries:
Emirates Float Glass UAE’s largest float glass facility with
capacity of 600t of glass per day
Emirates Glass Architectural glass
Saudi American Glass Architectural glass
Lumiglass Bullet resistant and special glass
Emirates Insolaire Colored solar glass and panels
Ownership
100% Dubai Investments
Glass LLC

38
Business Overview
Emicool is a B2B and B2C district cooling company thatprovides clean, efficient and innovative solutions to a
number of communities in the UAE.
Established in 2003 as joint venture between DubaiInvestments and Union Properties.
Ownership
50% Dubai Investments50% Union Properties
Emicool

39
Business Overview
Al Mal Capital, founded in 2005, is a diversified, multi-lineinvestment banking firm headquartered in Dubai. Licensed
and regulated by the UAE Central Bank, Al Mal Capitaloffers a wide range of investment products spread across
its business lines of investment banking, brokerage andasset management.
Dubai Investments acquired majority stake in Al Mal Capital
in 2015
Dubai Investments announced in June 2016 to launch twoAED 1 billion funds in cooperation with Al Mal Capital in the
healthcare and education sectors.
Ownership64.76% Dubai Investments
Corporate advisory
Capital markets
Asset Management
Direct Investments
Al Mal Capital

40
This presentation has been prepared solely for informational purposes. The presentation may contain forward looking statements, which reflect our beliefs or currentexpectations and assumptions regarding the future of the business, future plans and strategies, projections, anticipated events and trends, the economy and otherfuture conditions. Forward looking statements are neither historical facts nor assurances of future performance and can generally be identified by terminologyincluding "anticipate”, "aspire", "believe", "estimate", "expect", "forecast", "project", “outlook’, “guidance”, "strategy", "target", "trend", "future", "likely", "may", "should","will", "intend", "plan", "goal", "objective", "seek", “roadmap”, and other words of similar meaning or similar expressions.
By their nature, forward looking information and statements are subject to known and unknown uncertainties, risks and changes in circumstances that are difficult topredict and not in our control. Our actual results of operational and financial conditions may differ materially from that or those indicated in the forward lookingstatements. You should not place undue reliance on any of these forward looking statements.
Important factors that could cause our actual results of operational and financial conditions to differ materially from those indicated in the forward looking statementsinclude, among others: our ability to maintain adequate revenue levels and cost control; economic and financial conditions in the global markets and regional marketsin which we operate, including volatility in interest rates, commodity and equity prices and the value of assets; the implementation of our strategic initiatives, includingour ability to effectively manage the redeployment of our balance sheet and the expansion of our strategic businesses; the reliability of our risk management policies,procedures and methods; continued volatility in the capital or credit markets; developments and changes in laws and regulations, including increased regulation of thefinancial services industry through legislative action and revised rules and standards applied by the regulators.
Any forward looking statement made by the Company in the presentation is based only on information currently available to us and speaks only as to the date onwhich this presentation is made. Past performance is not a reliable indication of future performance. We make no representations or warranties as to the accuracy, orcompleteness of the information and shall not have any liability for any representations, express or implied, regarding the information contained in, or for anyomissions from, the information included in this presentation. We undertake no obligation to publicly update any forward looking statement whether as a result of newinformation, future developments or otherwise. The information contained in the presentation is prepared to assist prospective investors in making their ownevaluation of information about the Company.
Disclaimer – Forward Looking Statements