Q1 2015 Quarterly Project Tracking Report 2015 quarterly project tracking... · Q1 2015 Project...
22
First Quarterly Project Tracking Report 2015 January 2015
-
Upload
phungthien -
Category
Documents
-
view
215 -
download
0
Transcript of Q1 2015 Quarterly Project Tracking Report 2015 quarterly project tracking... · Q1 2015 Project...
First Quarter ly Project Tracking Report 2015
January2015
SouthwestPowerPool,Inc.
Q12015ProjectTrackingReport 1
TableofContents
Executive Summary .....................................................................................................................................2
NTC Project Summary ................................................................................................................................4
NTC Issuance ...................................................................................................................................6
NTC Withdraw .................................................................................................................................7
Completed Projects ..........................................................................................................................7
Project Status Summary .................................................................................................................12
Balanced Portfolio ........................................................................................................................................13
Priority Projects ...........................................................................................................................................15
Out-of-Bandwidth Projects .........................................................................................................................17
Responsiveness Report ................................................................................................................................19
Appendix I ....................................................................................................................................................21
SouthwestPowerPool,Inc.
Q12015ProjectTrackingReport 2
ExecutiveSummary
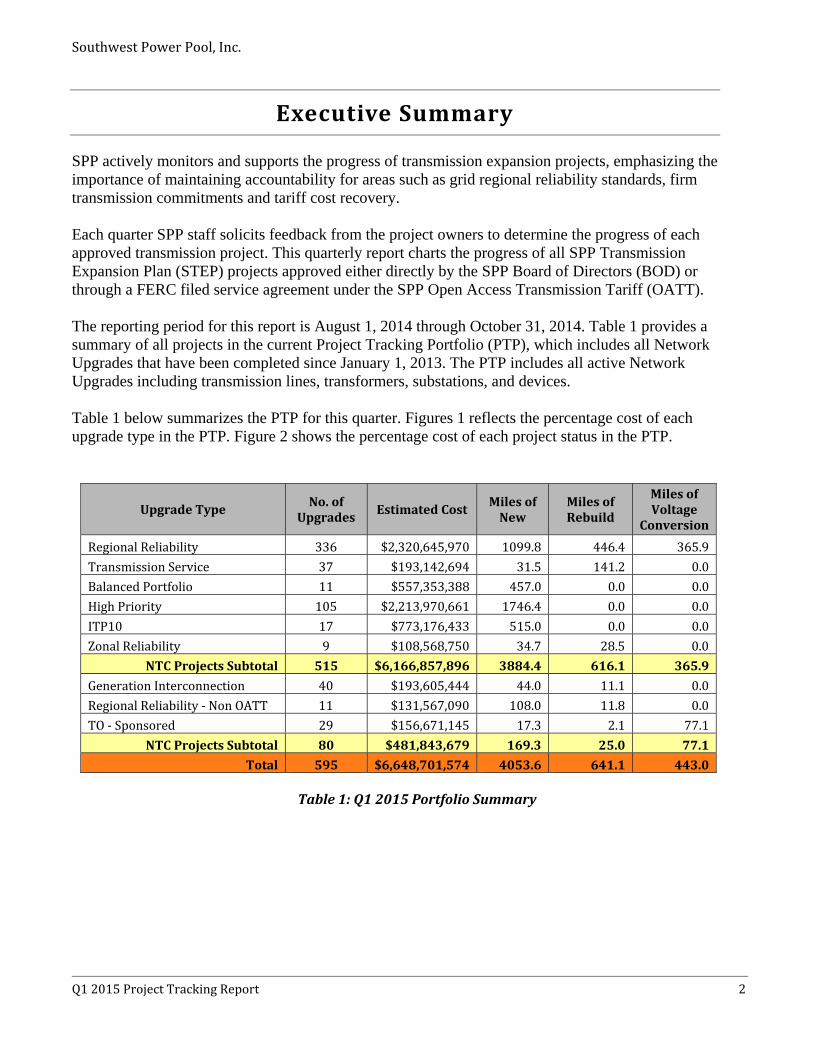
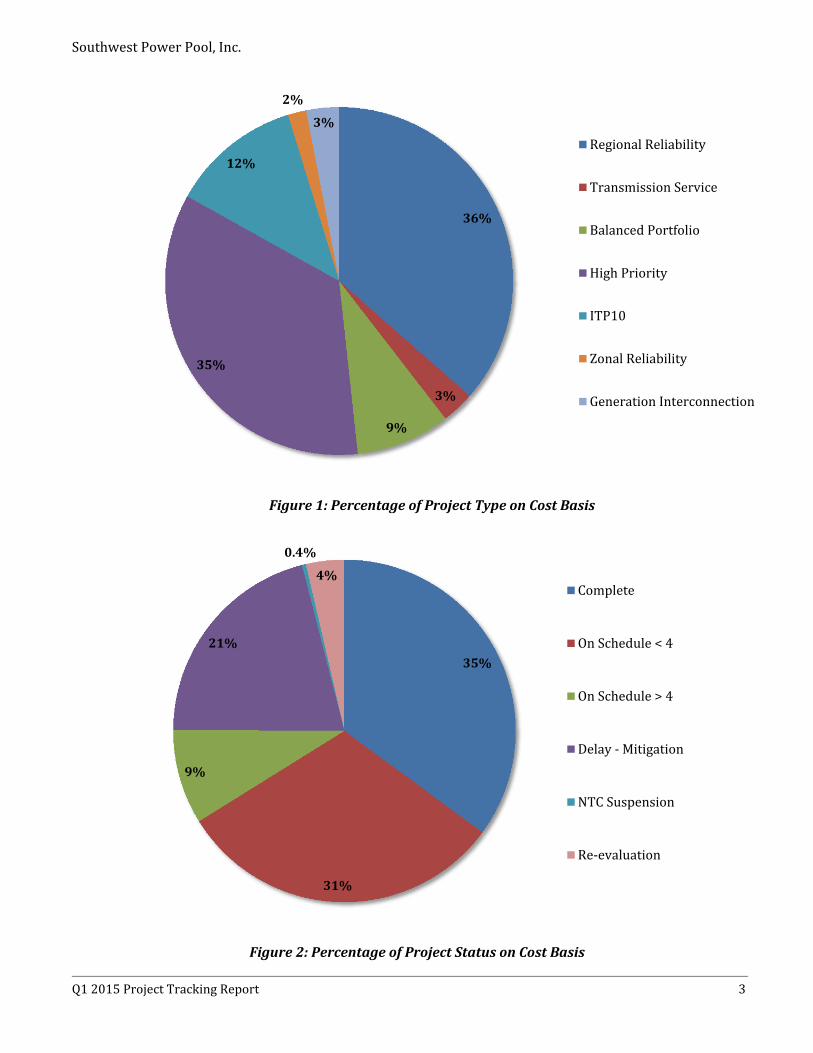
SPP actively monitors and supports the progress of transmission expansion projects, emphasizing the importance of maintaining accountability for areas such as grid regional reliability standards, firm transmission commitments and tariff cost recovery. Each quarter SPP staff solicits feedback from the project owners to determine the progress of each approved transmission project. This quarterly report charts the progress of all SPP Transmission Expansion Plan (STEP) projects approved either directly by the SPP Board of Directors (BOD) or through a FERC filed service agreement under the SPP Open Access Transmission Tariff (OATT). The reporting period for this report is August 1, 2014 through October 31, 2014. Table 1 provides a summary of all projects in the current Project Tracking Portfolio (PTP), which includes all Network Upgrades that have been completed since January 1, 2013. The PTP includes all active Network Upgrades including transmission lines, transformers, substations, and devices. Table 1 below summarizes the PTP for this quarter. Figures 1 reflects the percentage cost of each upgrade type in the PTP. Figure 2 shows the percentage cost of each project status in the PTP.
UpgradeTypeNo.of
UpgradesEstimatedCost
MilesofNew
MilesofRebuild
MilesofVoltage
Conversion
RegionalReliability 336 $2,320,645,970 1099.8 446.4 365.9
TransmissionService 37 $193,142,694 31.5 141.2 0.0
BalancedPortfolio 11 $557,353,388 457.0 0.0 0.0
HighPriority 105 $2,213,970,661 1746.4 0.0 0.0
ITP10 17 $773,176,433 515.0 0.0 0.0
ZonalReliability 9 $108,568,750 34.7 28.5 0.0
NTCProjectsSubtotal 515 $6,166,857,896 3884.4 616.1 365.9
GenerationInterconnection 40 $193,605,444 44.0 11.1 0.0
RegionalReliability‐NonOATT 11 $131,567,090 108.0 11.8 0.0
TO‐Sponsored 29 $156,671,145 17.3 2.1 77.1
NTCProjectsSubtotal 80 $481,843,679 169.3 25.0 77.1
Total 595 $6,648,701,574 4053.6 641.1 443.0
Table1:Q12015PortfolioSummary
SouthwestPowerPool,Inc.
Q12015ProjectTrackingReport 3
Figure1:PercentageofProjectTypeonCostBasis
36%
3%
9%
35%
12%
2%
3%
RegionalReliability
TransmissionService
BalancedPortfolio
HighPriority
ITP10
ZonalReliability
GenerationInterconnection
Figure2:PercentageofProjectStatusonCostBasis
35%
31%
9%
21%
0.4%
4%Complete
OnSchedule<4
OnSchedule>4
Delay‐Mitigation
NTCSuspension
Re‐evaluation
SouthwestPowerPool,Inc.
Q12015ProjectTrackingReport 4
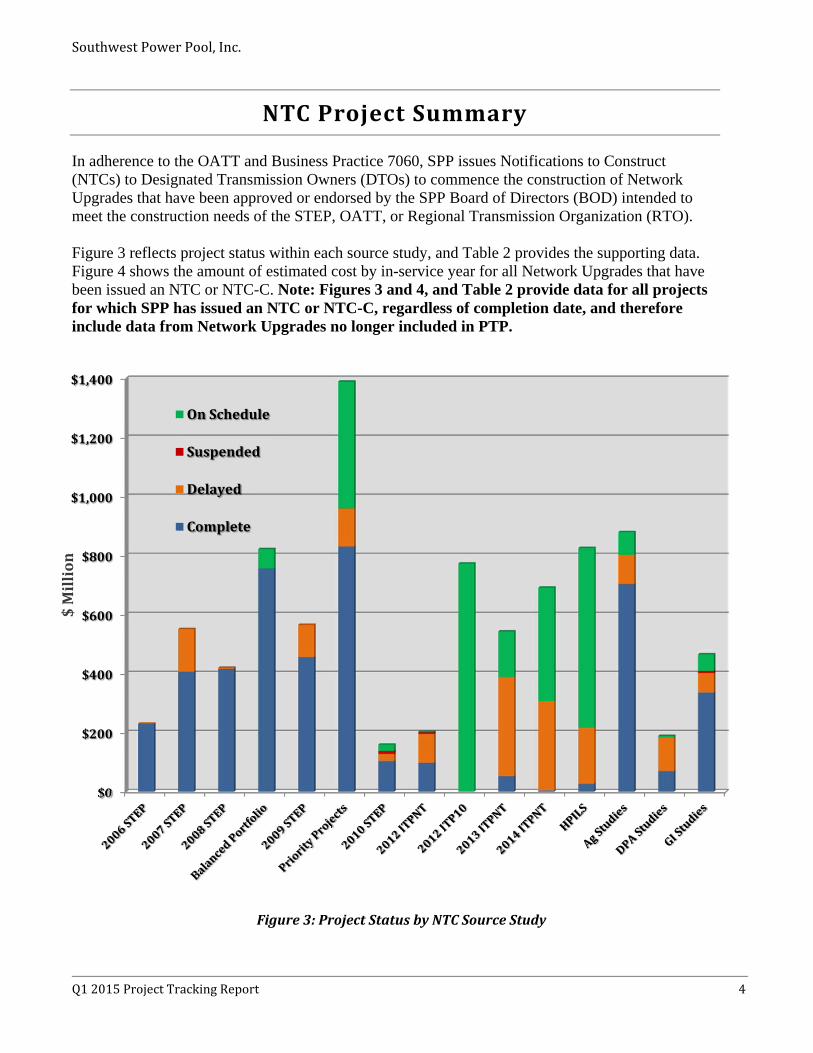
NTCProjectSummary
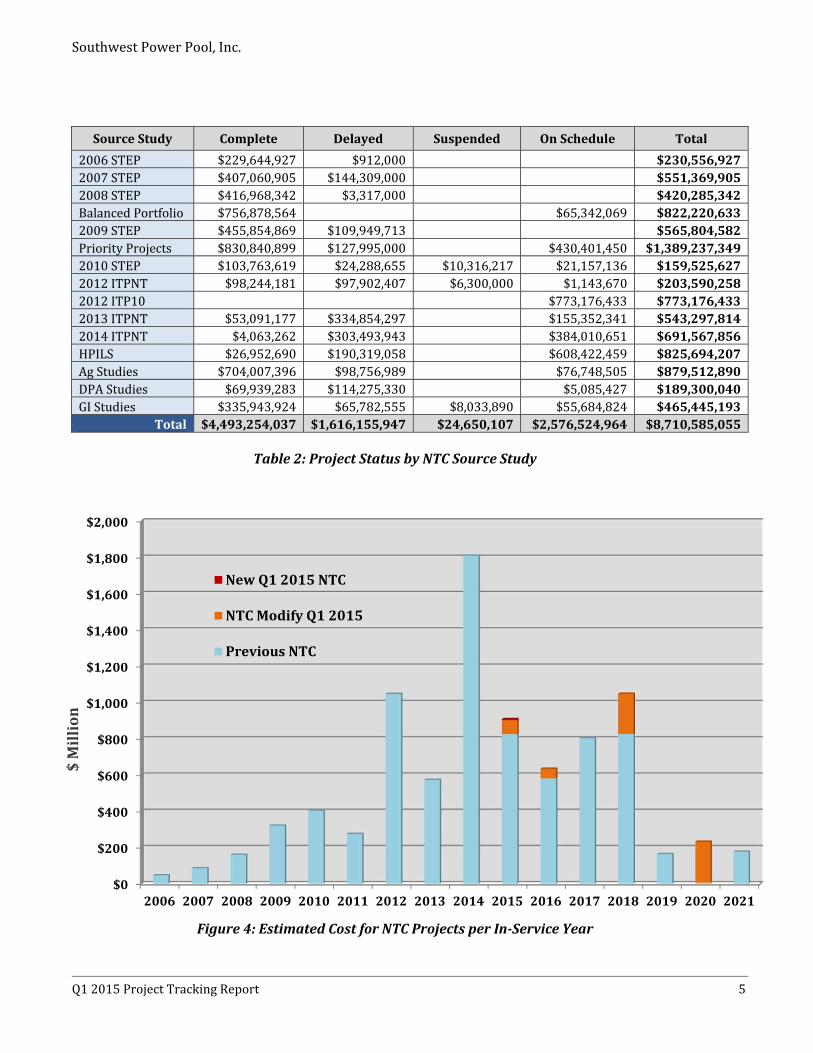
In adherence to the OATT and Business Practice 7060, SPP issues Notifications to Construct (NTCs) to Designated Transmission Owners (DTOs) to commence the construction of Network Upgrades that have been approved or endorsed by the SPP Board of Directors (BOD) intended to meet the construction needs of the STEP, OATT, or Regional Transmission Organization (RTO). Figure 3 reflects project status within each source study, and Table 2 provides the supporting data. Figure 4 shows the amount of estimated cost by in-service year for all Network Upgrades that have been issued an NTC or NTC-C. Note: Figures 3 and 4, and Table 2 provide data for all projects for which SPP has issued an NTC or NTC-C, regardless of completion date, and therefore include data from Network Upgrades no longer included in PTP.
Figure3:ProjectStatusbyNTCSourceStudy
$0
$200
$400
$600
$800
$1,000
$1,200
$1,400
OnSchedule
Suspended
Delayed
Complete
$Million
SouthwestPowerPool,Inc.
Q12015ProjectTrackingReport 5
SourceStudy Complete Delayed Suspended OnSchedule Total
2006STEP $229,644,927 $912,000 $230,556,9272007STEP $407,060,905 $144,309,000 $551,369,9052008STEP $416,968,342 $3,317,000 $420,285,342BalancedPortfolio $756,878,564 $65,342,069 $822,220,6332009STEP $455,854,869 $109,949,713 $565,804,582PriorityProjects $830,840,899 $127,995,000 $430,401,450 $1,389,237,3492010STEP $103,763,619 $24,288,655 $10,316,217 $21,157,136 $159,525,6272012ITPNT $98,244,181 $97,902,407 $6,300,000 $1,143,670 $203,590,2582012ITP10 $773,176,433 $773,176,4332013ITPNT $53,091,177 $334,854,297 $155,352,341 $543,297,8142014ITPNT $4,063,262 $303,493,943 $384,010,651 $691,567,856HPILS $26,952,690 $190,319,058 $608,422,459 $825,694,207AgStudies $704,007,396 $98,756,989 $76,748,505 $879,512,890DPAStudies $69,939,283 $114,275,330 $5,085,427 $189,300,040GIStudies $335,943,924 $65,782,555 $8,033,890 $55,684,824 $465,445,193
Total $4,493,254,037 $1,616,155,947 $24,650,107 $2,576,524,964 $8,710,585,055
Table2:ProjectStatusbyNTCSourceStudy
Figure4:EstimatedCostforNTCProjectsperIn‐ServiceYear
$0
$200
$400
$600
$800
$1,000
$1,200
$1,400
$1,600
$1,800
$2,000
2006 2007 2008 2009 2010 2011 2012 2013 2014 2015 2016 2017 2018 2019 2020 2021
NewQ12015NTC
NTCModifyQ12015
PreviousNTC
$Million
SouthwestPowerPool,Inc.
Q12015ProjectTrackingReport 6
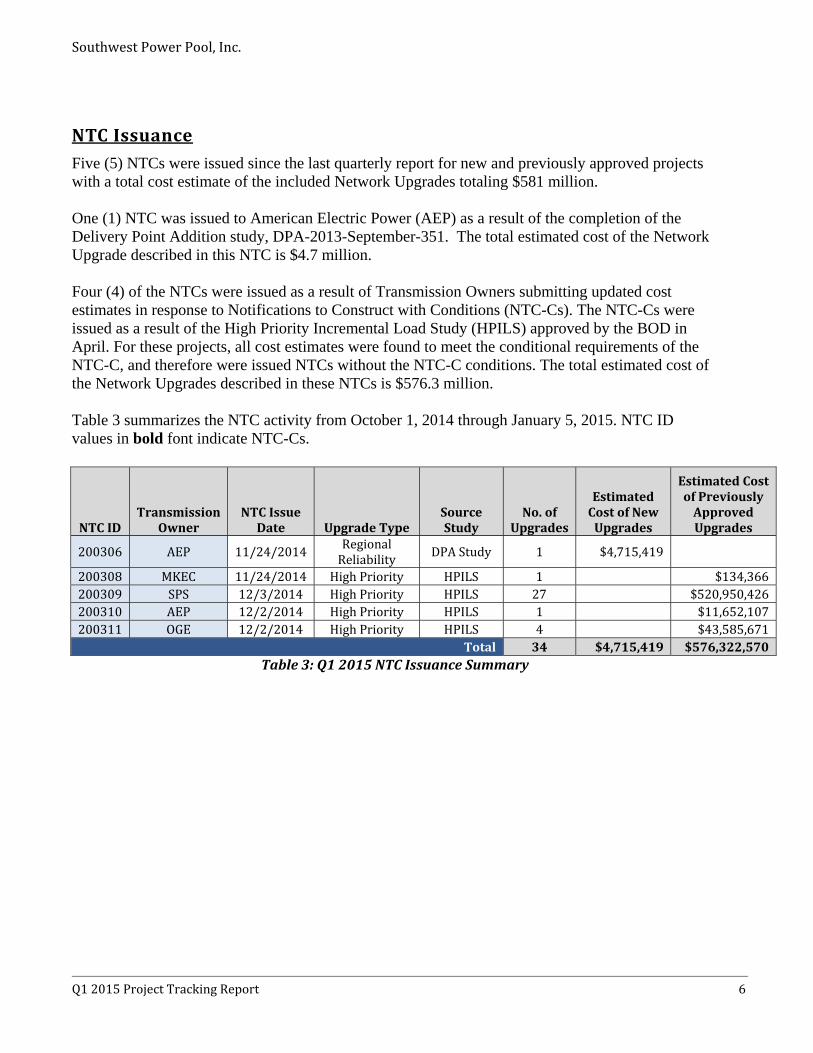
NTCIssuanceFive (5) NTCs were issued since the last quarterly report for new and previously approved projects with a total cost estimate of the included Network Upgrades totaling $581 million. One (1) NTC was issued to American Electric Power (AEP) as a result of the completion of the Delivery Point Addition study, DPA-2013-September-351. The total estimated cost of the Network Upgrade described in this NTC is $4.7 million. Four (4) of the NTCs were issued as a result of Transmission Owners submitting updated cost estimates in response to Notifications to Construct with Conditions (NTC-Cs). The NTC-Cs were issued as a result of the High Priority Incremental Load Study (HPILS) approved by the BOD in April. For these projects, all cost estimates were found to meet the conditional requirements of the NTC-C, and therefore were issued NTCs without the NTC-C conditions. The total estimated cost of the Network Upgrades described in these NTCs is $576.3 million. Table 3 summarizes the NTC activity from October 1, 2014 through January 5, 2015. NTC ID values in bold font indicate NTC-Cs.
NTCIDTransmission
OwnerNTCIssueDate UpgradeType
SourceStudy
No.ofUpgrades
EstimatedCostofNewUpgrades
EstimatedCostofPreviouslyApprovedUpgrades
200306 AEP 11/24/2014RegionalReliability DPAStudy 1 $4,715,419
200308 MKEC 11/24/2014 HighPriority HPILS 1 $134,366200309 SPS 12/3/2014 HighPriority HPILS 27 $520,950,426200310 AEP 12/2/2014 HighPriority HPILS 1 $11,652,107200311 OGE 12/2/2014 HighPriority HPILS 4 $43,585,671
Total 34 $4,715,419 $576,322,570Table3:Q12015NTCIssuanceSummary
SouthwestPowerPool,Inc.
Q12015ProjectTrackingReport 7
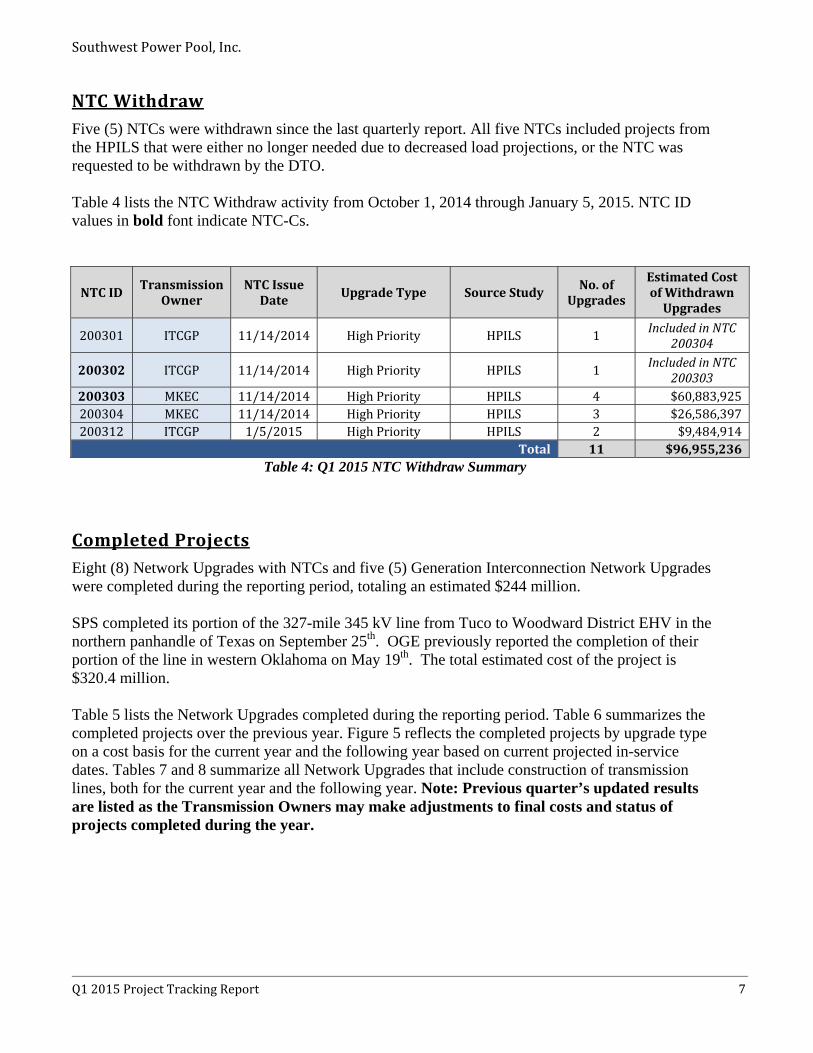
NTCWithdrawFive (5) NTCs were withdrawn since the last quarterly report. All five NTCs included projects from the HPILS that were either no longer needed due to decreased load projections, or the NTC was requested to be withdrawn by the DTO. Table 4 lists the NTC Withdraw activity from October 1, 2014 through January 5, 2015. NTC ID values in bold font indicate NTC-Cs.
NTCIDTransmission
OwnerNTCIssueDate UpgradeType SourceStudy
No.ofUpgrades
EstimatedCostofWithdrawnUpgrades
200301 ITCGP 11/14/2014 HighPriority HPILS 1 IncludedinNTC200304
200302 ITCGP 11/14/2014 HighPriority HPILS 1IncludedinNTC
200303200303 MKEC 11/14/2014 HighPriority HPILS 4 $60,883,925200304 MKEC 11/14/2014 HighPriority HPILS 3 $26,586,397200312 ITCGP 1/5/2015 HighPriority HPILS 2 $9,484,914
Total 11 $96,955,236Table 4: Q1 2015 NTC Withdraw Summary
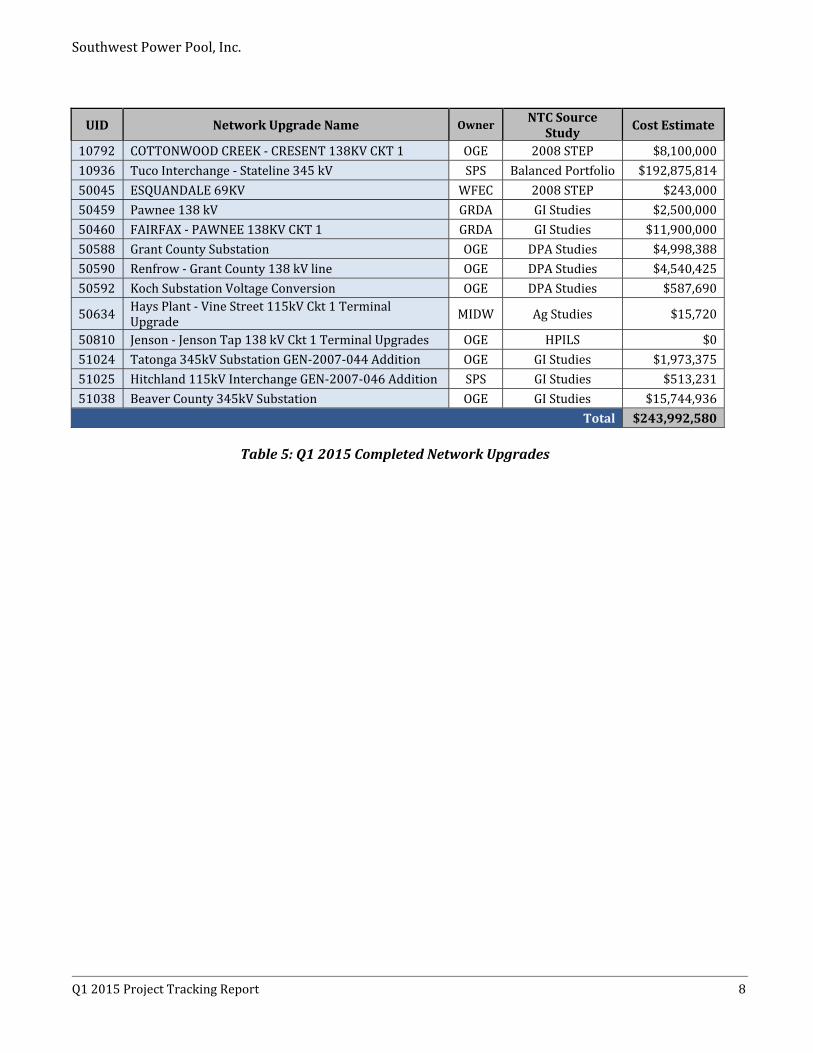
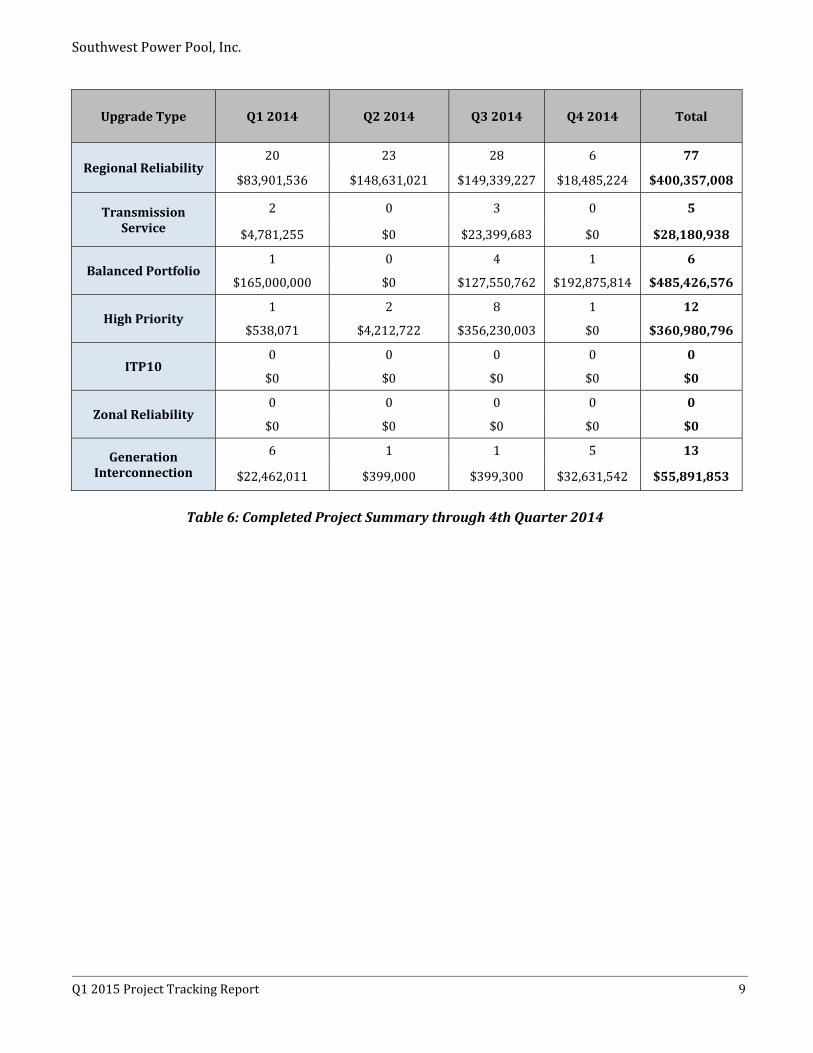
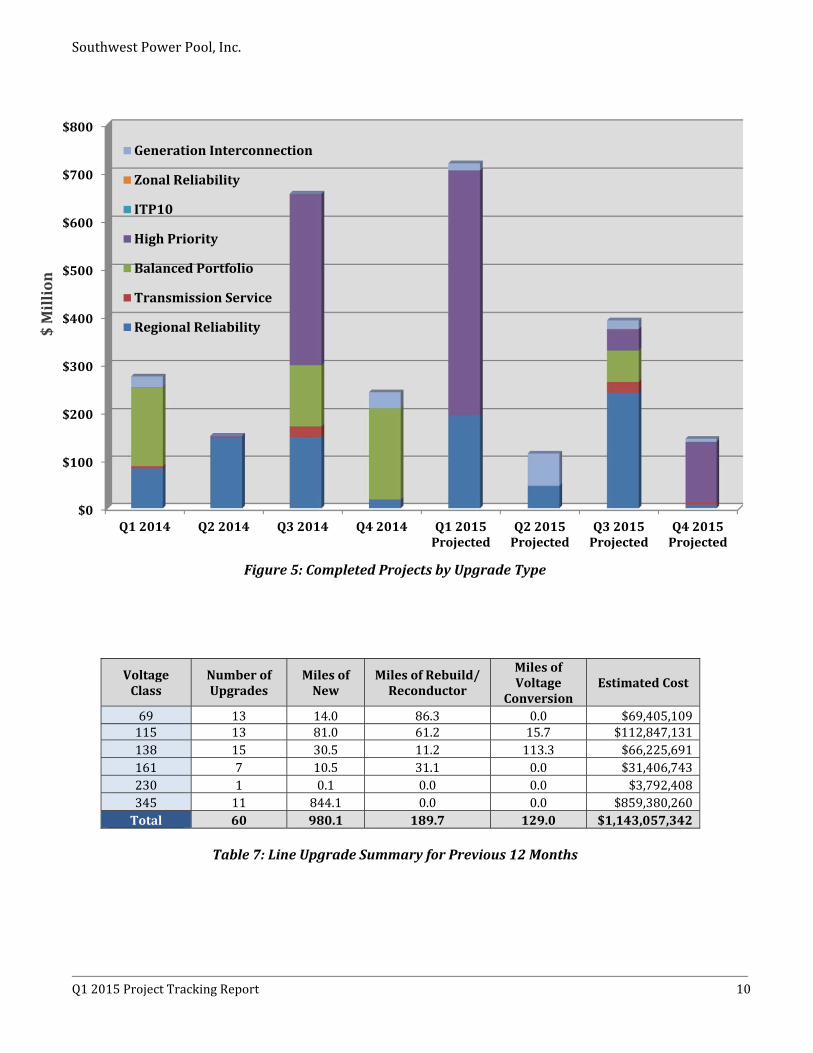
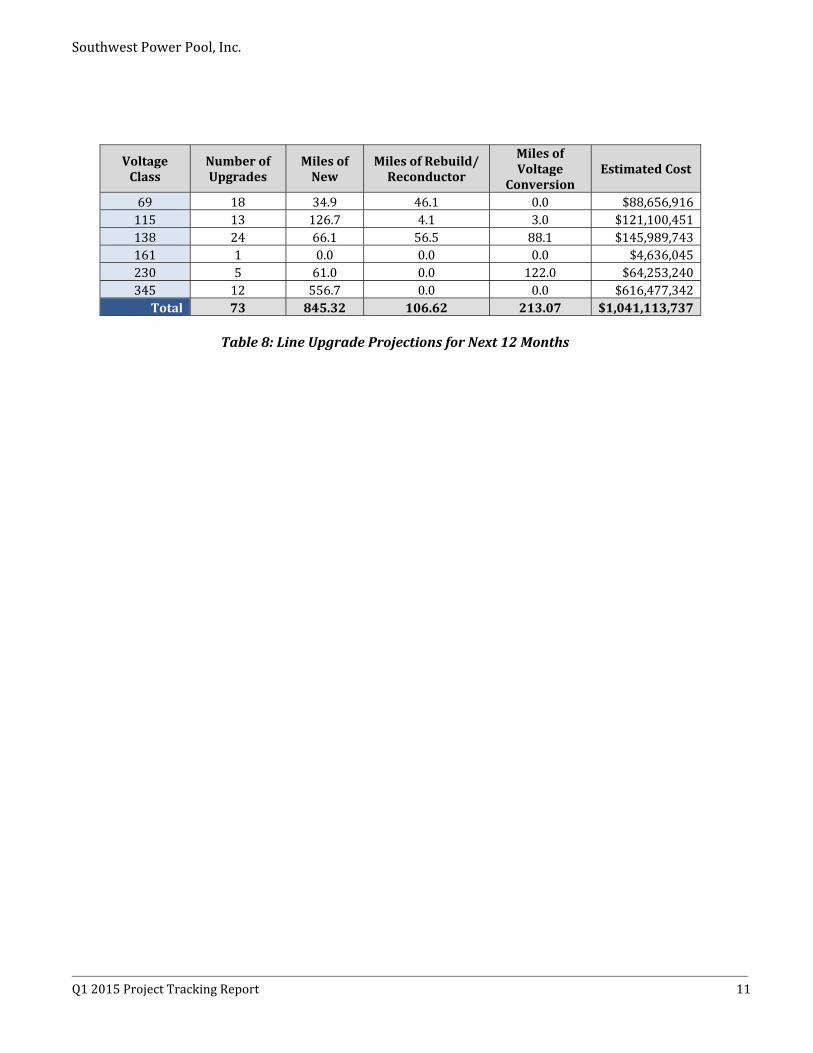
CompletedProjectsEight (8) Network Upgrades with NTCs and five (5) Generation Interconnection Network Upgrades were completed during the reporting period, totaling an estimated $244 million. SPS completed its portion of the 327-mile 345 kV line from Tuco to Woodward District EHV in the northern panhandle of Texas on September 25th. OGE previously reported the completion of their portion of the line in western Oklahoma on May 19th. The total estimated cost of the project is $320.4 million. Table 5 lists the Network Upgrades completed during the reporting period. Table 6 summarizes the completed projects over the previous year. Figure 5 reflects the completed projects by upgrade type on a cost basis for the current year and the following year based on current projected in-service dates. Tables 7 and 8 summarize all Network Upgrades that include construction of transmission lines, both for the current year and the following year. Note: Previous quarter’s updated results are listed as the Transmission Owners may make adjustments to final costs and status of projects completed during the year.
SouthwestPowerPool,Inc.
Q12015ProjectTrackingReport 8
UID NetworkUpgradeName OwnerNTCSource
StudyCostEstimate
10792 COTTONWOODCREEK‐CRESENT138KVCKT1 OGE 2008STEP $8,100,000
10936 TucoInterchange‐Stateline345kV SPS BalancedPortfolio $192,875,814
50045 ESQUANDALE69KV WFEC 2008STEP $243,000
50459 Pawnee138kV GRDA GIStudies $2,500,000
50460 FAIRFAX‐PAWNEE138KVCKT1 GRDA GIStudies $11,900,000
50588 GrantCountySubstation OGE DPAStudies $4,998,388
50590 Renfrow‐GrantCounty138kVline OGE DPAStudies $4,540,425
50592 KochSubstationVoltageConversion OGE DPAStudies $587,690
50634HaysPlant‐VineStreet115kVCkt1TerminalUpgrade MIDW AgStudies $15,720
50810 Jenson‐JensonTap138kVCkt1TerminalUpgrades OGE HPILS $0
51024 Tatonga345kVSubstationGEN‐2007‐044Addition OGE GIStudies $1,973,375
51025 Hitchland115kVInterchangeGEN‐2007‐046Addition SPS GIStudies $513,231
51038 BeaverCounty345kVSubstation OGE GIStudies $15,744,936
Total $243,992,580
Table5:Q12015CompletedNetworkUpgrades
SouthwestPowerPool,Inc.
Q12015ProjectTrackingReport 9
UpgradeType Q12014 Q22014 Q32014 Q42014 Total
RegionalReliability20 23 28 6 77
$83,901,536 $148,631,021 $149,339,227 $18,485,224 $400,357,008
TransmissionService
2 0 3 0 5
$4,781,255 $0 $23,399,683 $0 $28,180,938
BalancedPortfolio1 0 4 1 6
$165,000,000 $0 $127,550,762 $192,875,814 $485,426,576
HighPriority1 2 8 1 12
$538,071 $4,212,722 $356,230,003 $0 $360,980,796
ITP100 0 0 0 0
$0 $0 $0 $0 $0
ZonalReliability0 0 0 0 0
$0 $0 $0 $0 $0
GenerationInterconnection
6 1 1 5 13
$22,462,011 $399,000 $399,300 $32,631,542 $55,891,853
Table6:CompletedProjectSummarythrough4thQuarter2014
SouthwestPowerPool,Inc.
Q12015ProjectTrackingReport 10
VoltageClass
NumberofUpgrades
MilesofNew
MilesofRebuild/Reconductor
MilesofVoltage
ConversionEstimatedCost
69 13 14.0 86.3 0.0 $69,405,109115 13 81.0 61.2 15.7 $112,847,131138 15 30.5 11.2 113.3 $66,225,691161 7 10.5 31.1 0.0 $31,406,743230 1 0.1 0.0 0.0 $3,792,408345 11 844.1 0.0 0.0 $859,380,260Total 60 980.1 189.7 129.0 $1,143,057,342
Table7:LineUpgradeSummaryforPrevious12Months
Figure5:CompletedProjectsbyUpgradeType
$0
$100
$200
$300
$400
$500
$600
$700
$800
Q12014 Q22014 Q32014 Q42014 Q12015Projected
Q22015Projected
Q32015Projected
Q42015Projected
GenerationInterconnection
ZonalReliability
ITP10
HighPriority
BalancedPortfolio
TransmissionService
RegionalReliability$Million
SouthwestPowerPool,Inc.
Q12015ProjectTrackingReport 11
VoltageClass
NumberofUpgrades
MilesofNew
MilesofRebuild/Reconductor
MilesofVoltage
ConversionEstimatedCost
69 18 34.9 46.1 0.0 $88,656,916115 13 126.7 4.1 3.0 $121,100,451138 24 66.1 56.5 88.1 $145,989,743161 1 0.0 0.0 0.0 $4,636,045230 5 61.0 0.0 122.0 $64,253,240345 12 556.7 0.0 0.0 $616,477,342Total 73 845.32 106.62 213.07 $1,041,113,737
Table8:LineUpgradeProjectionsforNext12Months
SouthwestPowerPool,Inc.
Q12015ProjectTrackingReport 12
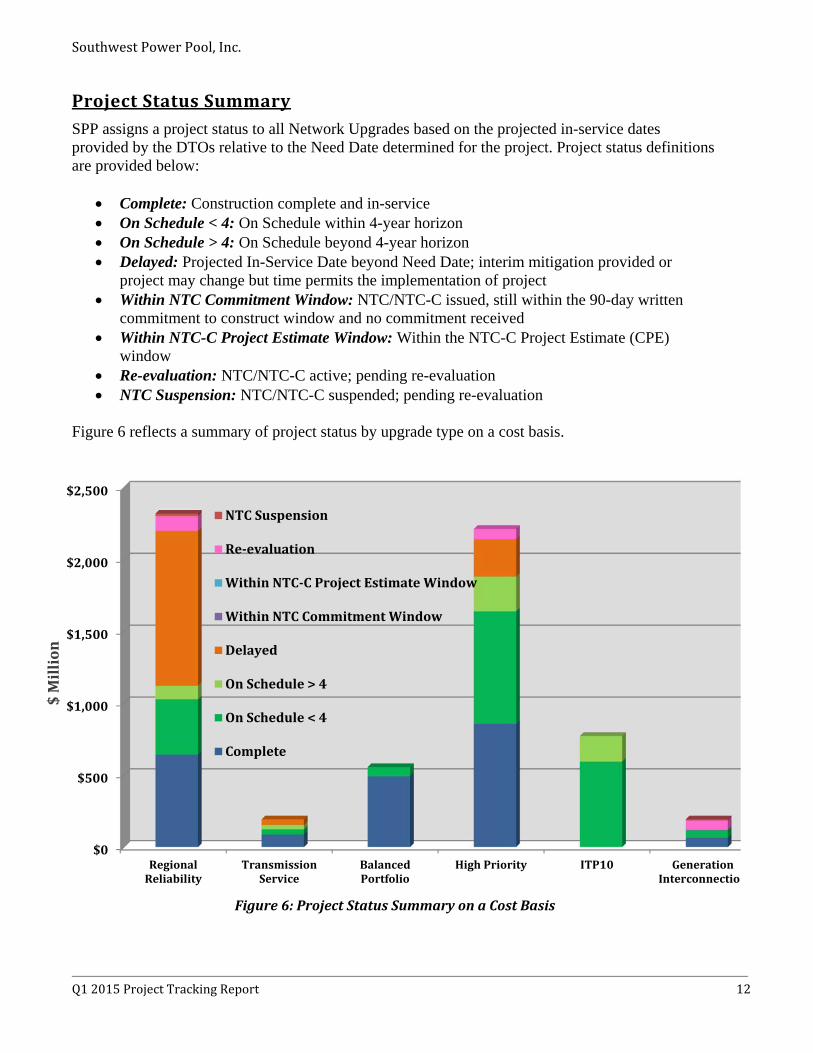
ProjectStatusSummarySPP assigns a project status to all Network Upgrades based on the projected in-service dates provided by the DTOs relative to the Need Date determined for the project. Project status definitions are provided below:
Complete: Construction complete and in-service On Schedule < 4: On Schedule within 4-year horizon On Schedule > 4: On Schedule beyond 4-year horizon Delayed: Projected In-Service Date beyond Need Date; interim mitigation provided or
project may change but time permits the implementation of project Within NTC Commitment Window: NTC/NTC-C issued, still within the 90-day written
commitment to construct window and no commitment received Within NTC-C Project Estimate Window: Within the NTC-C Project Estimate (CPE)
window Re-evaluation: NTC/NTC-C active; pending re-evaluation NTC Suspension: NTC/NTC-C suspended; pending re-evaluation
Figure 6 reflects a summary of project status by upgrade type on a cost basis.
Figure6:ProjectStatusSummaryonaCostBasis
$0
$500
$1,000
$1,500
$2,000
$2,500
RegionalReliability
TransmissionService
BalancedPortfolio
HighPriority ITP10 GenerationInterconnection
NTCSuspension
Re‐evaluation
WithinNTC‐CProjectEstimateWindow
WithinNTCCommitmentWindow
Delayed
OnSchedule>4
OnSchedule<4
Complete
$Million
SouthwestPowerPool,Inc.
Q12015ProjectTrackingReport 13
BalancedPortfolio
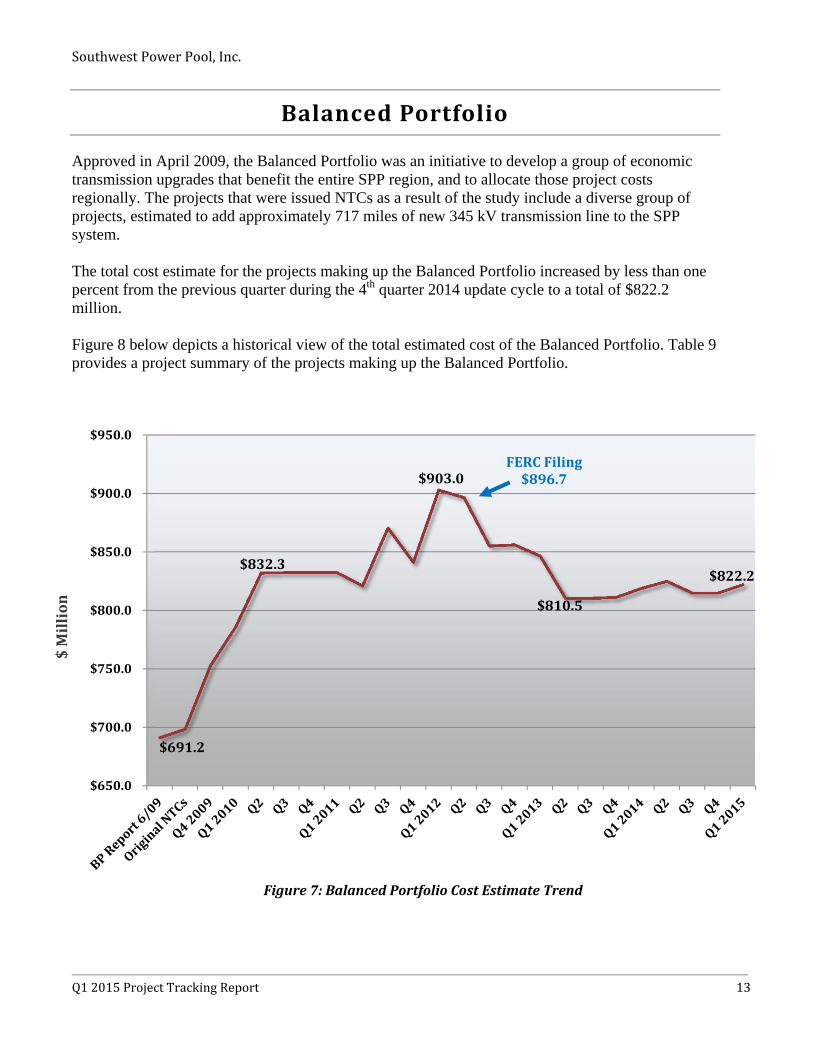
Approved in April 2009, the Balanced Portfolio was an initiative to develop a group of economic transmission upgrades that benefit the entire SPP region, and to allocate those project costs regionally. The projects that were issued NTCs as a result of the study include a diverse group of projects, estimated to add approximately 717 miles of new 345 kV transmission line to the SPP system. The total cost estimate for the projects making up the Balanced Portfolio increased by less than one percent from the previous quarter during the 4th quarter 2014 update cycle to a total of $822.2 million. Figure 8 below depicts a historical view of the total estimated cost of the Balanced Portfolio. Table 9 provides a project summary of the projects making up the Balanced Portfolio.
$Million
Figure7:BalancedPortfolioCostEstimateTrend
$691.2
$832.3
$903.0
$810.5
$822.2
$650.0
$700.0
$750.0
$800.0
$850.0
$900.0
$950.0
FERCFiling$896.7
SouthwestPowerPool,Inc.
Q12015ProjectTrackingReport 14
ProjectID(s)
ProjectOwner(s)
ProjectNameEst.LineLength
BPReportEstimates(6/2009)
Q42014CostEstimates
Q12015CostEstimates
Variance%
705/709 WFEC/OGEGracemontSubstation345kV N/A $8,000,000 $14,921,070 $15,091,100 1.1%
707/708 ITCGP/NPPDSpearville‐PostRock‐Axtell345kV
223.0 $236,557,015 $203,559,673 $203,776,145 0.1%
698/699 OGE/GRDA Sooner‐Cleveland345kV
36.0 $33,530,000 $49,718,139 $49,718,139 0.0%
702 KCPLSwissvale‐StilwellTap345kV N/A $2,000,000 $2,866,604 $2,866,604 0.0%
700 OGESeminole‐Muskogee345kV
100.0 $129,000,000 $165,000,000 $165,000,000 0.0%
701/704 SPS/OGE Tuco–Woodward345kV
327.0 $227,727,500 $313,627,516 $320,426,576 2.2%
703 TSMOIatan–Nashua345kV 31.0 $54,444,000 $65,342,070 $65,342,069 0.0%
Total 717.0 $691,258,515 $815,035,072 $822,220,633 0.9%
Table9:BalancedPortfolioSummary
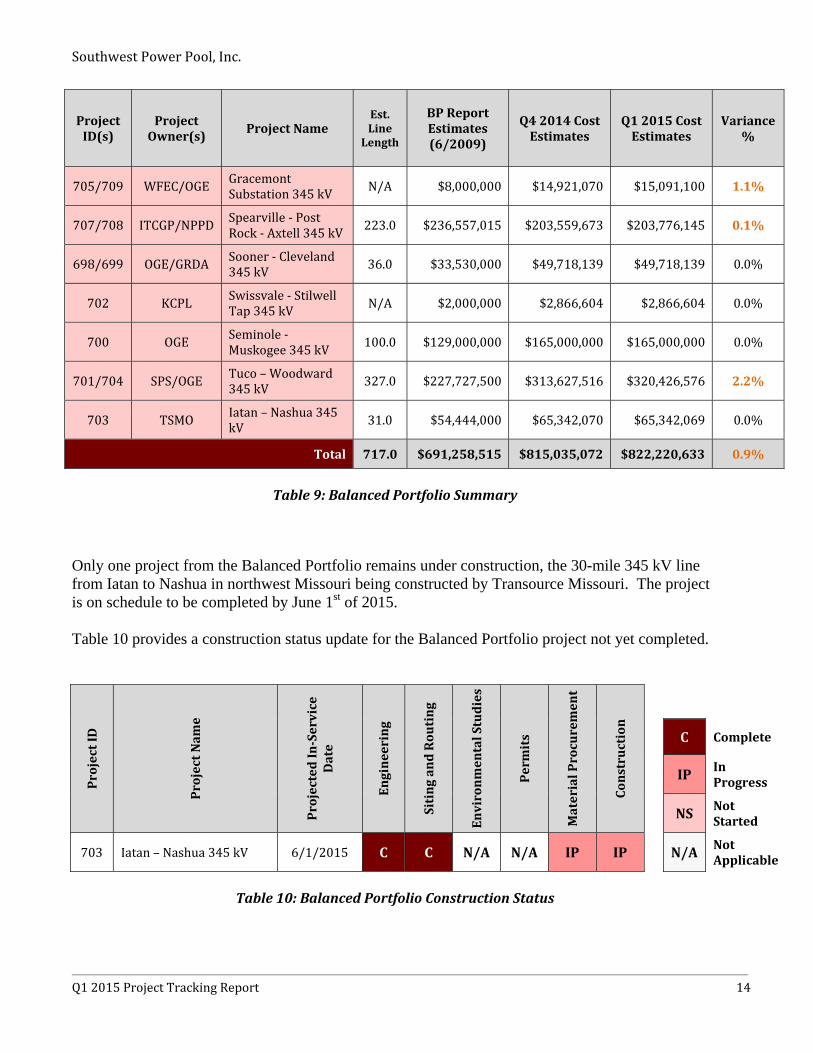
Only one project from the Balanced Portfolio remains under construction, the 30-mile 345 kV line from Iatan to Nashua in northwest Missouri being constructed by Transource Missouri. The project is on schedule to be completed by June 1st of 2015. Table 10 provides a construction status update for the Balanced Portfolio project not yet completed.
ProjectID
ProjectNam
e
ProjectedIn‐Service
Date
Engineering
SitingandRouting
EnvironmentalStudies
Permits
MaterialProcurement
Construction
C Complete
IP In
Progress
NS Not
Started
703 Iatan–Nashua345kV 6/1/2015 C C N/A N/A IP IP N/A NotApplicable
Table10:BalancedPortfolioConstructionStatus
SouthwestPowerPool,Inc.
Q12015ProjectTrackingReport 15
PriorityProjects
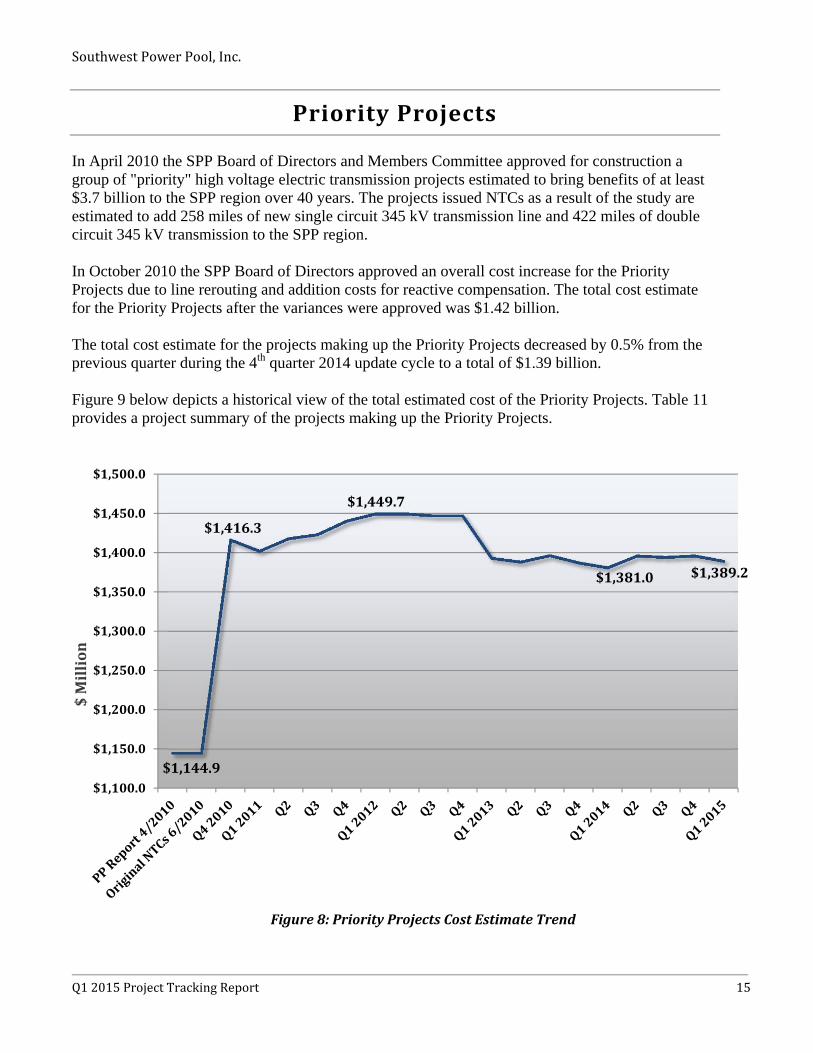
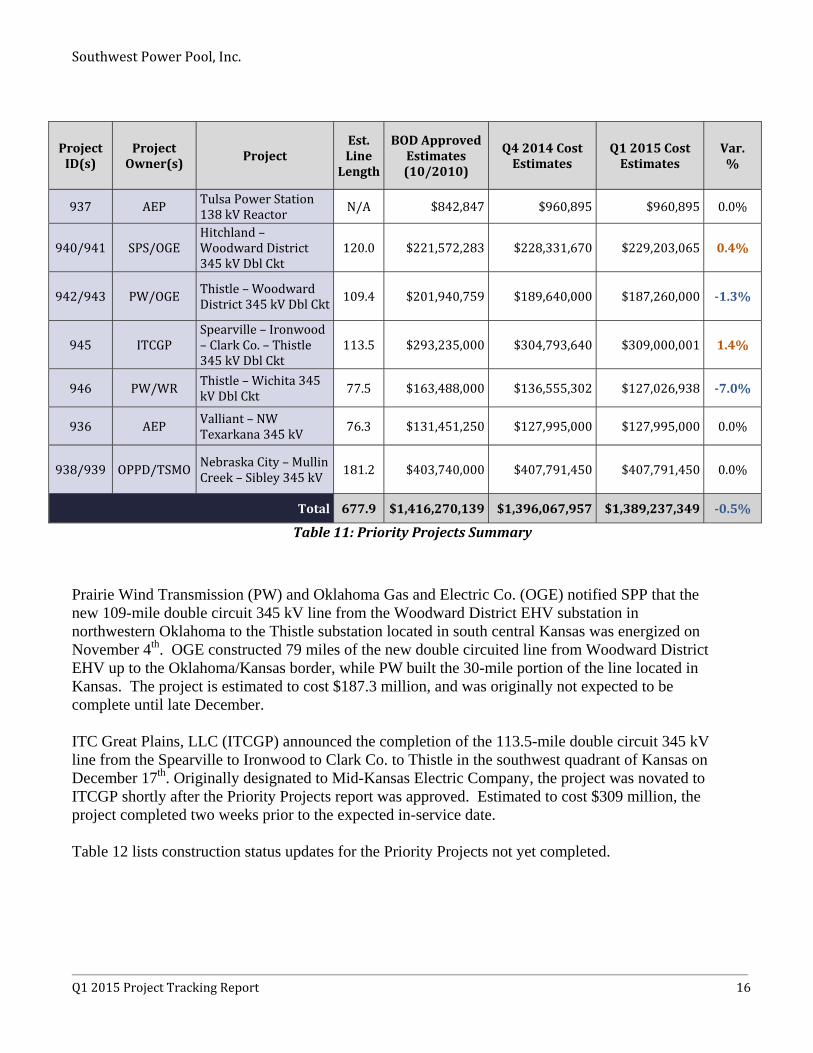
In April 2010 the SPP Board of Directors and Members Committee approved for construction a group of "priority" high voltage electric transmission projects estimated to bring benefits of at least $3.7 billion to the SPP region over 40 years. The projects issued NTCs as a result of the study are estimated to add 258 miles of new single circuit 345 kV transmission line and 422 miles of double circuit 345 kV transmission to the SPP region. In October 2010 the SPP Board of Directors approved an overall cost increase for the Priority Projects due to line rerouting and addition costs for reactive compensation. The total cost estimate for the Priority Projects after the variances were approved was $1.42 billion. The total cost estimate for the projects making up the Priority Projects decreased by 0.5% from the previous quarter during the 4th quarter 2014 update cycle to a total of $1.39 billion. Figure 9 below depicts a historical view of the total estimated cost of the Priority Projects. Table 11 provides a project summary of the projects making up the Priority Projects.
Figure8:PriorityProjectsCostEstimateTrend
$1,144.9
$1,416.3
$1,449.7
$1,381.0 $1,389.2
$1,100.0
$1,150.0
$1,200.0
$1,250.0
$1,300.0
$1,350.0
$1,400.0
$1,450.0
$1,500.0
$Million
SouthwestPowerPool,Inc.
Q12015ProjectTrackingReport 16
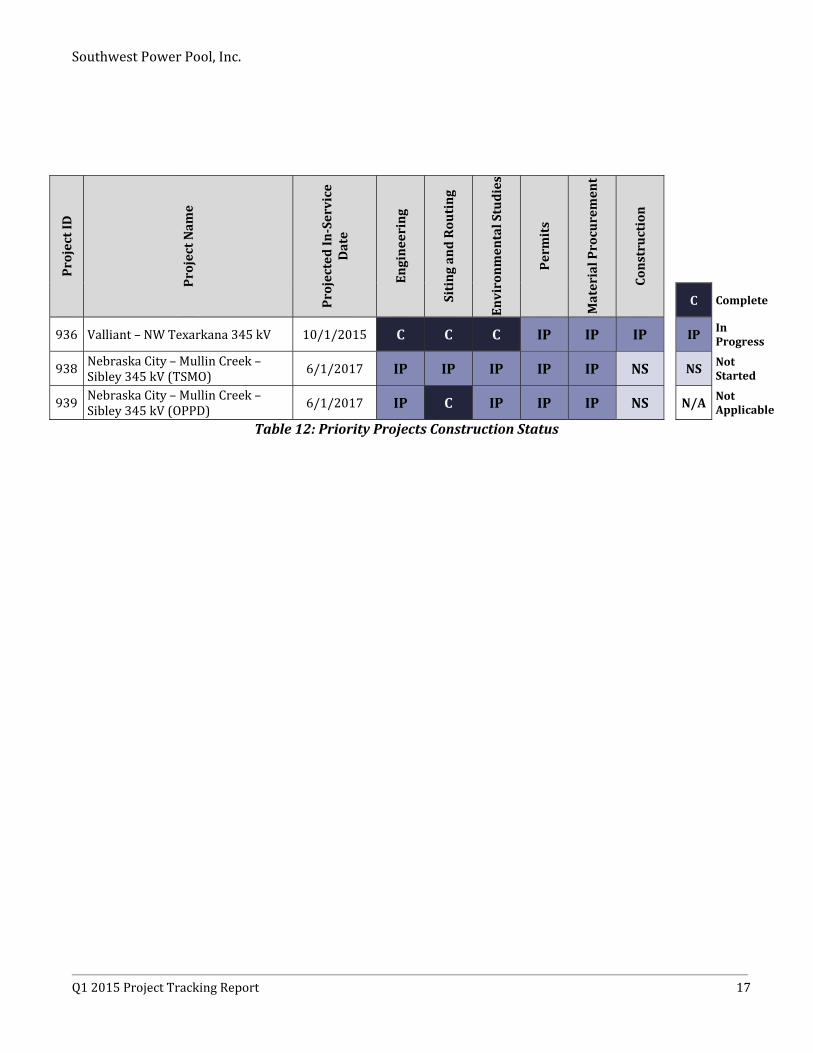
Prairie Wind Transmission (PW) and Oklahoma Gas and Electric Co. (OGE) notified SPP that the new 109-mile double circuit 345 kV line from the Woodward District EHV substation in northwestern Oklahoma to the Thistle substation located in south central Kansas was energized on November 4th. OGE constructed 79 miles of the new double circuited line from Woodward District EHV up to the Oklahoma/Kansas border, while PW built the 30-mile portion of the line located in Kansas. The project is estimated to cost $187.3 million, and was originally not expected to be complete until late December. ITC Great Plains, LLC (ITCGP) announced the completion of the 113.5-mile double circuit 345 kV line from the Spearville to Ironwood to Clark Co. to Thistle in the southwest quadrant of Kansas on December 17th. Originally designated to Mid-Kansas Electric Company, the project was novated to ITCGP shortly after the Priority Projects report was approved. Estimated to cost $309 million, the project completed two weeks prior to the expected in-service date. Table 12 lists construction status updates for the Priority Projects not yet completed.
ProjectID(s)
ProjectOwner(s) Project
Est.LineLength
BODApprovedEstimates(10/2010)
Q42014CostEstimates
Q12015CostEstimates
Var.%
937 AEP TulsaPowerStation138kVReactor
N/A $842,847 $960,895 $960,895 0.0%
940/941 SPS/OGEHitchland–WoodwardDistrict345kVDblCkt
120.0 $221,572,283 $228,331,670 $229,203,065 0.4%
942/943 PW/OGE Thistle–WoodwardDistrict345kVDblCkt
109.4 $201,940,759 $189,640,000 $187,260,000 ‐1.3%
945 ITCGPSpearville–Ironwood–ClarkCo.–Thistle345kVDblCkt
113.5 $293,235,000 $304,793,640 $309,000,001 1.4%
946 PW/WRThistle–Wichita345kVDblCkt 77.5 $163,488,000 $136,555,302 $127,026,938 ‐7.0%
936 AEP Valliant–NWTexarkana345kV
76.3 $131,451,250 $127,995,000 $127,995,000 0.0%
938/939 OPPD/TSMONebraskaCity–MullinCreek–Sibley345kV
181.2 $403,740,000 $407,791,450 $407,791,450 0.0%
Total 677.9 $1,416,270,139 $1,396,067,957 $1,389,237,349 ‐0.5%
Table11:PriorityProjectsSummary
SouthwestPowerPool,Inc.
Q12015ProjectTrackingReport 17
ProjectID
ProjectNam
e
ProjectedIn‐Service
Date
Engineering
SitingandRouting
EnvironmentalStudies
Permits
MaterialProcurement
Construction
C Complete
936 Valliant–NWTexarkana345kV 10/1/2015 C C C IP IP IP IP InProgress
938 NebraskaCity–MullinCreek–Sibley345kV(TSMO)
6/1/2017 IP IP IP IP IP NS NS NotStarted
939NebraskaCity–MullinCreek–Sibley345kV(OPPD) 6/1/2017 IP C IP IP IP NS
N/A Not
Applicable
Table12:PriorityProjectsConstructionStatus
SouthwestPowerPool,Inc.
Q12015ProjectTrackingReport 18
Out‐of‐BandwidthProjects
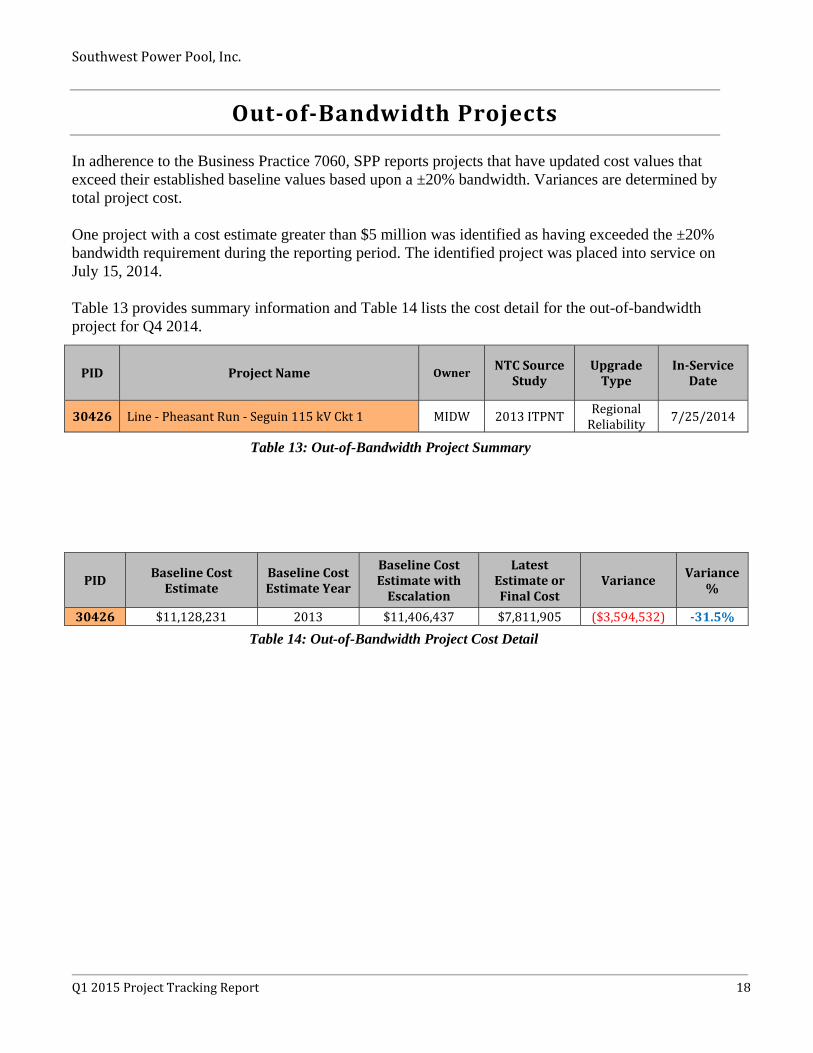
In adherence to the Business Practice 7060, SPP reports projects that have updated cost values that exceed their established baseline values based upon a ±20% bandwidth. Variances are determined by total project cost. One project with a cost estimate greater than $5 million was identified as having exceeded the ±20% bandwidth requirement during the reporting period. The identified project was placed into service on July 15, 2014. Table 13 provides summary information and Table 14 lists the cost detail for the out-of-bandwidth project for Q4 2014.
PID ProjectName Owner NTCSourceStudy
UpgradeType
In‐ServiceDate
30426 Line‐PheasantRun‐Seguin115kVCkt1 MIDW 2013ITPNTRegionalReliability
7/25/2014
Table 13: Out-of-Bandwidth Project Summary
Table 14: Out-of-Bandwidth Project Cost Detail
PID BaselineCostEstimate
BaselineCostEstimateYear
BaselineCostEstimatewithEscalation
LatestEstimateorFinalCost
Variance Variance%
30426 $11,128,231 2013 $11,406,437 $7,811,905 ($3,594,532) ‐31.5%
SouthwestPowerPool,Inc.
Q12015ProjectTrackingReport 19
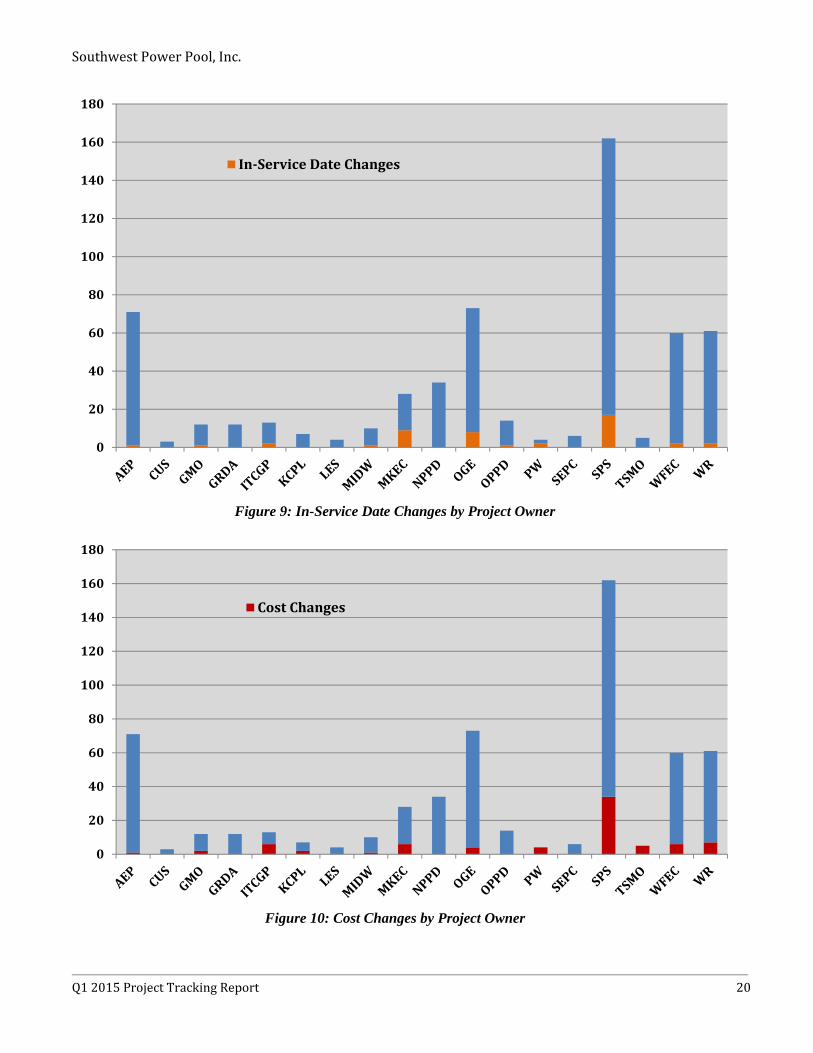
ResponsivenessReport
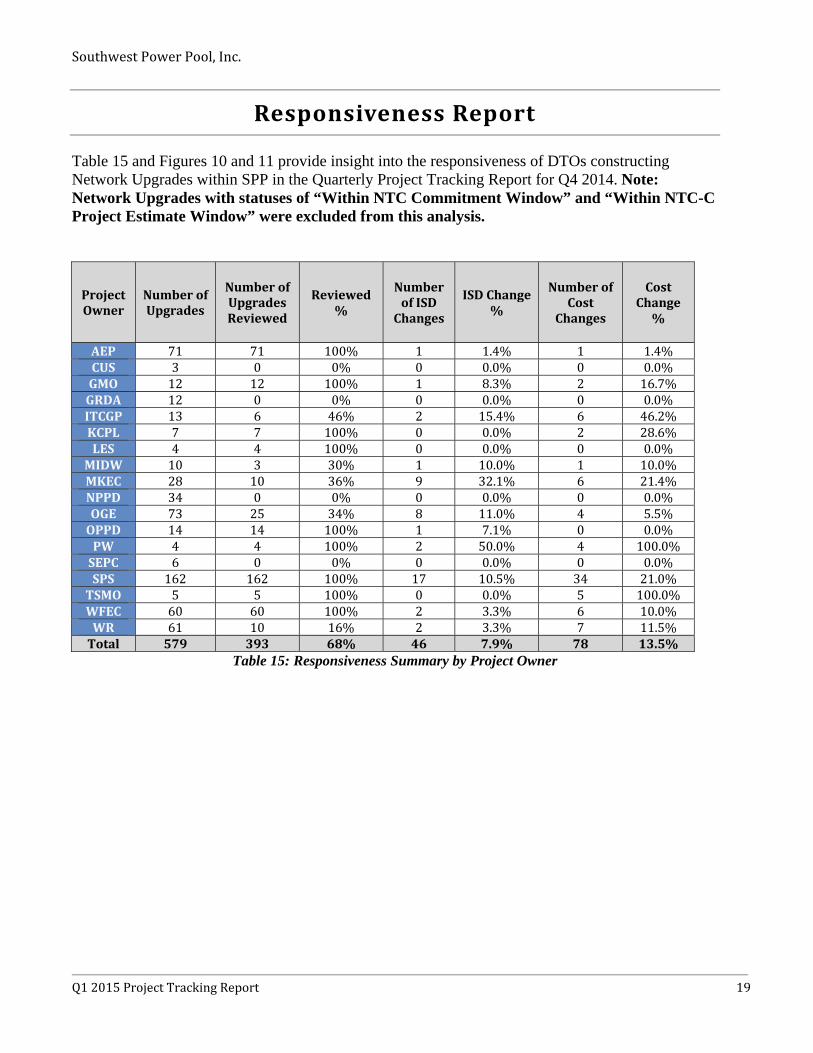
Table 15 and Figures 10 and 11 provide insight into the responsiveness of DTOs constructing Network Upgrades within SPP in the Quarterly Project Tracking Report for Q4 2014. Note: Network Upgrades with statuses of “Within NTC Commitment Window” and “Within NTC-C Project Estimate Window” were excluded from this analysis.
ProjectOwner
NumberofUpgrades
NumberofUpgradesReviewed
Reviewed%
NumberofISDChanges
ISDChange%
NumberofCost
Changes
CostChange%
AEP 71 71 100% 1 1.4% 1 1.4%CUS 3 0 0% 0 0.0% 0 0.0%GMO 12 12 100% 1 8.3% 2 16.7%GRDA 12 0 0% 0 0.0% 0 0.0%ITCGP 13 6 46% 2 15.4% 6 46.2%KCPL 7 7 100% 0 0.0% 2 28.6%LES 4 4 100% 0 0.0% 0 0.0%MIDW 10 3 30% 1 10.0% 1 10.0%MKEC 28 10 36% 9 32.1% 6 21.4%NPPD 34 0 0% 0 0.0% 0 0.0%OGE 73 25 34% 8 11.0% 4 5.5%OPPD 14 14 100% 1 7.1% 0 0.0%PW 4 4 100% 2 50.0% 4 100.0%SEPC 6 0 0% 0 0.0% 0 0.0%SPS 162 162 100% 17 10.5% 34 21.0%TSMO 5 5 100% 0 0.0% 5 100.0%WFEC 60 60 100% 2 3.3% 6 10.0%WR 61 10 16% 2 3.3% 7 11.5%Total 579 393 68% 46 7.9% 78 13.5%
Table 15: Responsiveness Summary by Project Owner
SouthwestPowerPool,Inc.
Q12015ProjectTrackingReport 20
Figure 9: In-Service Date Changes by Project Owner
Figure 10: Cost Changes by Project Owner
0
20
40
60
80
100
120
140
160
180
In‐ServiceDateChanges
0
20
40
60
80
100
120
140
160
180
CostChanges

SouthwestPowerPool,Inc.
Q12015ProjectTrackingReport 21
AppendixI
See accompanying list of Network Upgrades