Q1 2005 Results - Airbuscompany.airbus.com/dam/assets/airbusgroup/int/en/investor...• Low R&D...
15
1 1 • Place for • Date of presentation, place Earnings conference call – 9th May 2005 Q1 2005 Results 1 Hans Peter Ring Chief Financial Officer 2 Certain of the statements contained in this document are not historical facts but rather are statements of future expectations and other forward-looking statements that are based on management‘s beliefs. These statements reflect the Company‘s views and assumptions as of the date of the statements and involve known and unknown risk and uncertainties that could cause actual results, performance or events to differ materially from those expressed or implied in such statements. When used in this document, words such as “anticipate ”, “believe ”, “estimate ”, “expect ”, “may ”, “intend ”, “plan to ” and “project ” are intended to identify forward-looking statements. Such forward-looking statements include, without limitation, projections for improvements in process and operations, new business opportunities, revenues and revenues growth, operating margin growth, cash flow, deliveries, launches, compliance with delivery schedules, performance against Company targets, new products, current and future markets for the Company products and other trend projections. This forward looking information is based upon a number of assumptions including without limitation: · Assumption regarding demand · Current and future markets for the Company‘s products and services · Internal performance including the ability to successfully integrate EADS‘ activities to control costs and maintain quality · Customer financing · Customer, supplier and subcontractor performance or contract negotiations · Favourable outcomes of certain pending sales campaigns Forward looking statements are subject to uncertainty and actual future results and trends may differ materially depending on variety of factors including without limitation: · General economic and labour conditions, including in particular economic conditions in Europe and North America, · Legal, financial and governmental risk related to international transactions · The Cyclical nature of some of the Company‘s businesses · Volatility of the market for certain products and services · Product performance risks · Collective bargaining labour disputes · Factors that result in significant and prolonged disruption to air travel world-wide · The outcome of political and legal processes, including uncertainty regarding government funding of certain programs · Consolidation among competitors in the aerospace industry · The cost of developing, and the commercial success of new products · Exchange rate and interest rate spread fluctuations between the Euro and the U.S. dollar and other currencies · Legal proceeding and other economic, political and technological risk and uncertainties Additional information regarding these factors is contained in the Company‘s “document de référence ” dated 19th April 2005. The Company disclaims any intention or obligation to update these forward-looking statements. Consequently the Company is not responsible for any consequencies from using any of the below statements. Safe Harbor Statement 2
Transcript of Q1 2005 Results - Airbuscompany.airbus.com/dam/assets/airbusgroup/int/en/investor...• Low R&D...

1
1• Place for• Date of presentation, placeEarnings conference call – 9th May 2005
Q1 2005 Results
1
Hans Peter RingChief Financial Officer
2
Certain of the statements contained in this document are not historical facts but rather are statements of future expectations and otherforward-looking statements that are based on management‘s beliefs. These statements reflect the Company‘s views and assumptionsas of the date of the statements and involve known and unknown risk and uncertainties that could cause actual results, performance orevents to differ materially from those expressed or implied in such statements.
When used in this document, words such as “anticipate ”, “believe ”, “estimate ”, “expect ”, “may ”, “intend ”, “plan to ” and “project ” areintended to identify forward-looking statements. Such forward-looking statements include, without limitation, projections forimprovements in process and operations, new business opportunities, revenues and revenues growth, operating margin growth, cashflow, deliveries, launches, compliance with delivery schedules, performance against Company targets, new products, current andfuture markets for the Company products and other trend projections.
This forward looking information is based upon a number of assumptions including without limitation:· Assumption regarding demand· Current and future markets for the Company‘s products and services· Internal performance including the ability to successfully integrate EADS‘ activities to control costs and maintain quality· Customer financing· Customer, supplier and subcontractor performance or contract negotiations· Favourable outcomes of certain pending sales campaigns
Forward looking statements are subject to uncertainty and actual future results and trends may differ materially depending on varietyof factors including without limitation:· General economic and labour conditions, including in particular economic conditions in Europe and North America,· Legal, financial and governmental risk related to international transactions· The Cyclical nature of some of the Company‘s businesses· Volatility of the market for certain products and services· Product performance risks· Collective bargaining labour disputes· Factors that result in significant and prolonged disruption to air travel world-wide· The outcome of political and legal processes, including uncertainty regarding government funding of certain programs· Consolidation among competitors in the aerospace industry· The cost of developing, and the commercial success of new products· Exchange rate and interest rate spread fluctuations between the Euro and the U.S. dollar and other currencies· Legal proceeding and other economic, political and technological risk and uncertainties
Additional information regarding these factors is contained in the Company‘s “document de référence ” dated 19th April 2005.The Company disclaims any intention or obligation to update these forward-looking statements. Consequently the Company is not responsible for any consequencies from using any of the below statements.
Safe Harbor Statement
2
2
3
Content
3
Group overview
2005 guidance
Operating performance by division
Financials
4
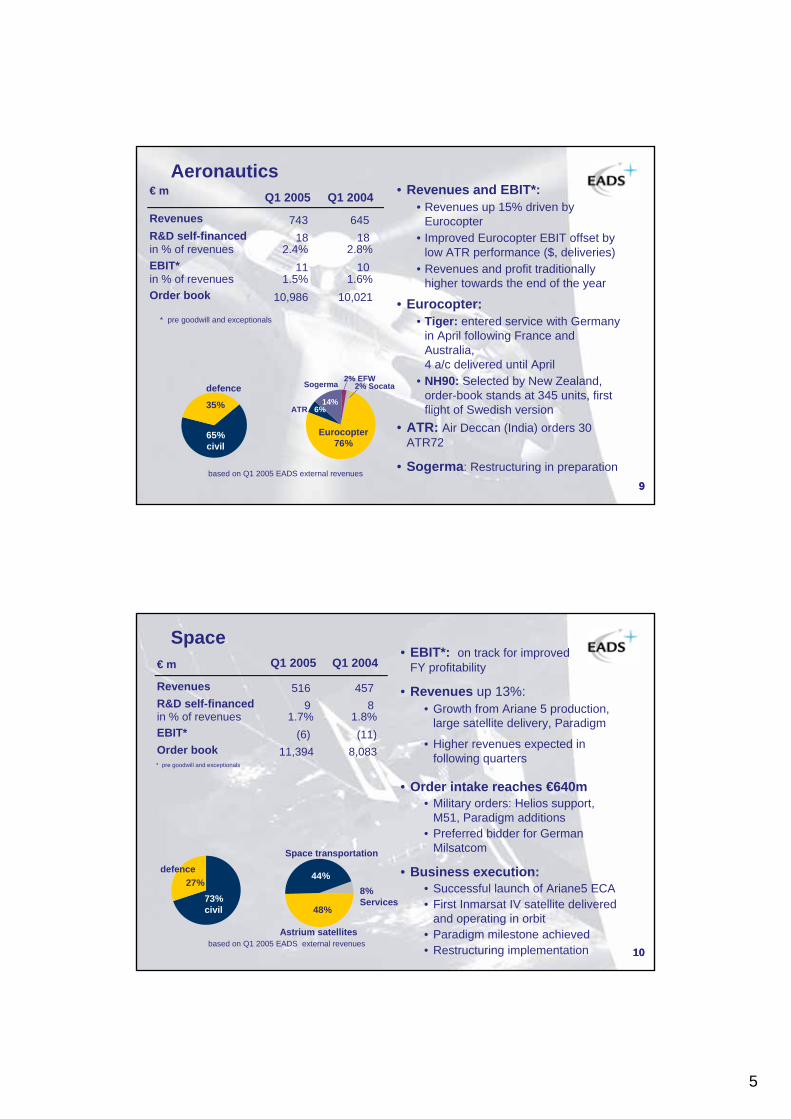
Q1 2005: Sustaining Growth
• Confirming FY 2005 targets• Airbus:
– Leadership in deliveries (55% market share) and orders – Profitability improving with higher volume.
• Defence businesses:– Order-book delivery : A400M production start and export
opportunities, Tiger enters service,…– Extend product range : FSTA preferred bidder status, German go-
ahead for MEADS, Preferred bidder for German Milsatcom– Expand outside home countries : NH90 for New Zealand, Information
and Control System for the Netherlands,…
• Space: On track for profitable Growth.
• Net Cash Position +7%, Strong growth in EBIT* and Net Income
* pre goodwill and exceptionals 4

3
5
Q1 2005 Financial Highlights
* pre goodwill and exceptionals
** excl. investments in medium term securities and consolidation changes
in m€
Revenues
EBIT*FCF before cust. financing**Net IncomeNew orders
in bn€ March 2005Net Cash positionTotal Order book
of which Defence
4.3 € bn Dec. 2004
4.1 € bn
Q1 2005 Q1 2004
49.1 € bn 184.3 € bn 190.4 € bn
49.7 € bn
Of which Defence
3,411 € m 49 € m
419 € m 198 € m
6,031 € m 1,083 € m
7,005 € m
704 € m
8,907 € m 328 € m
657 € m 1,258 € m
change
+7 %
+1 %+3 %
+ 161 %
+569 % 68 %
+232 %
+16% +16 %
6
Content
6
Group overview
2005 guidance
Operating performance by division
Financials

4
7
Airbus
* pre goodwill and exceptionals** capitalised R&D: € 52m in Q1 2005 and € 0 in Q1 2004*** incl. A400M
€ m
DeliveriesRevenuesR&D self-financed**in % of revenuesEBIT*in % of revenuesOrder book***in units, excl. A400M
87 674,989 4,126
345 463 6.9% 11.2%628 224
12.6% 5.4%141,143 140,911
1,531 1,397
Q1 2005 Q1 2004
7
• Revenues up 21% reflect 20 additional A320 family deliveriesand CTA reversal, partly offset by weaker US$ spot rate
• EBIT* margin 12.6%, EBIT up 180%• Reflects volume impact• Low R&D expense in Q1, A380 freighter
not ramping-up yet• Route06 benefits• Hedge rate stable from Q1 2004,
stronger than 2005 exp. average
• A380 maiden flight on 27th April 2005
• Global development:• New Management for Airbus Japan
• Customer financing: Stable exposure
Order intake:• Stronger order-intake, but Q1 2004 had
been very low (12 orders)• 123 gross orders, incl. 60 A320 by Air
Asia; 66% market share• UPS, CASGC commit to the A380,
which totals 154 firm orders and commitments
8
MTA
86% defence
based on Q1 2005 EADS external revenues
* pre goodwill and exceptionals
€ m
Revenues 108 101 R&D self-financed 5 7 in % of revenues 4.6% 6.9%EBIT* (6) (8)
Order book 19,850 19,980
Q1 2004Q1 2005
8
• Revenues and EBIT*:• Roughly stable• Higher revenues and profit
towards the end of the year• No A400M sales recognition milestone
• A400M: • Production started (first metal cut)• Negotiations with Export customers,
South Africa joins A400M programme, • Tanker:
• FSTA preferred bidder status on Feb. 28• US Tanker preparation underway
• Medium-light aircraft:• Brazil: 12 C295 + P3 Orion FITS
upgrade signed in April for €0.6 bn.• Opportunity for US Future Cargo Aircraft
5
9
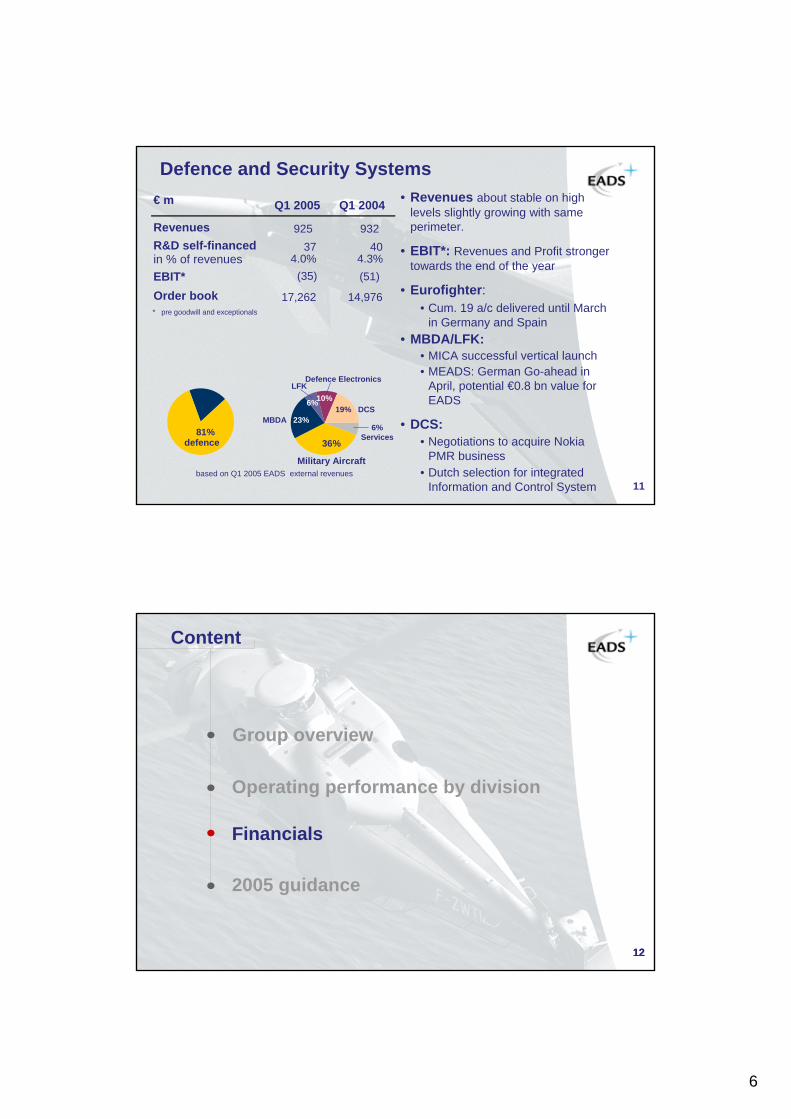
Aeronautics
defence
35%
65%civil
Eurocopter76%
Sogerma
14%
2% Socata2% EFW
ATR 6%
based on Q1 2005 EADS external revenues
* pre goodwill and exceptionals
€ m
Revenues 743 645 R&D self-financed 18 18 in % of revenues 2.4% 2.8%EBIT* 11 10 in % of revenues 1.5% 1.6%Order book 10,986 10,021
Q1 2004Q1 2005
9
• Revenues and EBIT*:• Revenues up 15% driven by
Eurocopter• Improved Eurocopter EBIT offset by
low ATR performance ($, deliveries)• Revenues and profit traditionally
higher towards the end of the year
• Eurocopter:• Tiger: entered service with Germany
in April following France and Australia, 4 a/c delivered until April
• NH90: Selected by New Zealand, order-book stands at 345 units, first flight of Swedish version
• ATR: Air Deccan (India) orders 30 ATR72
• Sogerma: Restructuring in preparation
10
Space
44%
48%
Astrium satellites
Space transportation
27%73% civil
defence
8% Services
€ m
Revenues 516 457 R&D self-financed 9 8 in % of revenues 1.7% 1.8%EBIT* (6) (11)Order book 11,394 8,083* pre goodwill and exceptionals
Q1 2004Q1 2005
10
• EBIT*: on track for improvedFY profitability
• Revenues up 13%: • Growth from Ariane 5 production,
large satellite delivery, Paradigm
• Higher revenues expected in following quarters
• Order intake reaches €640m• Military orders: Helios support,
M51, Paradigm additions• Preferred bidder for German
Milsatcom
• Business execution:• Successful launch of Ariane5 ECA• First Inmarsat IV satellite delivered
and operating in orbit• Paradigm milestone achieved• Restructuring implementationbased on Q1 2005 EADS external revenues
6
11
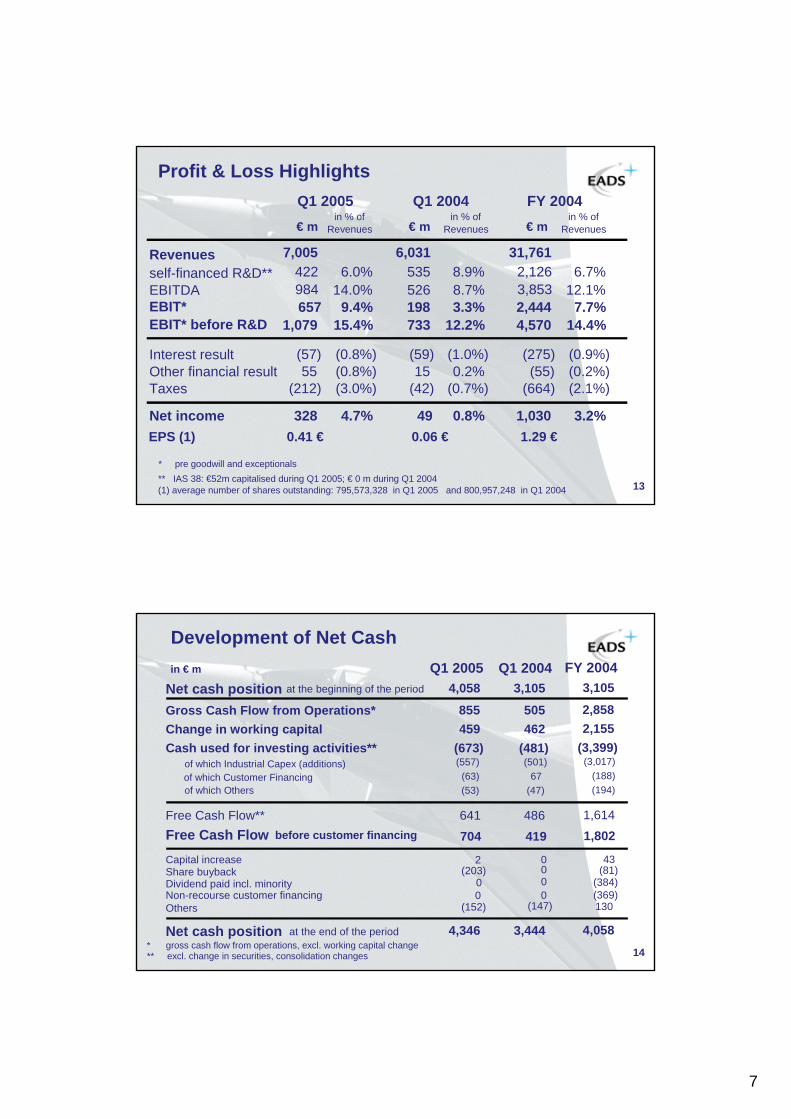
Defence and Security Systems
81%defence 36%
Military Aircraft
LFK
6%19% DCS
Defence Electronics
10%
MBDA 23%6%
Services
€ m
Revenues 925 932 R&D self-financed 37 40in % of revenues 4.0% 4.3%EBIT* (35) (51)
Order book 17,262 14,976* pre goodwill and exceptionals
Q1 2005 Q1 2004 • Revenues about stable on high levels slightly growing with same perimeter.
• EBIT*: Revenues and Profit stronger towards the end of the year
• Eurofighter:• Cum. 19 a/c delivered until March
in Germany and Spain• MBDA/LFK:
• MICA successful vertical launch• MEADS: German Go-ahead in
April, potential €0.8 bn value for EADS
• DCS:• Negotiations to acquire Nokia
PMR business• Dutch selection for integrated
Information and Control Systembased on Q1 2005 EADS external revenues
12
Content
12
2005 guidance
Operating performance by division
Financials
Group overview
7
13
Profit & Loss Highlights
* pre goodwill and exceptionals
€ min % of
Revenues € min % of
Revenues
Revenues 7,005 6,031 self-financed R&D** 422 6.0% 535 8.9% EBITDA 984 14.0% 526 8.7% EBIT* 657 9.4% 198 3.3% EBIT* before R&D 1,079 15.4% 733 12.2%
Interest result (57) (0.8%) (59) (1.0%)Other financial result 55 (0.8%) 15 0.2% Taxes (212) (3.0%) (42) (0.7%)
Net income 328 4.7% 0.8%
Q1 2004Q1 2005
49 EPS (1) 0.06 €0.41 €
** IAS 38: €52m capitalised during Q1 2005; € 0 m during Q1 2004 (1) average number of shares outstanding: 795,573,328 in Q1 2005 and 800,957,248 in Q1 2004
€ min % of
Revenues
31,761 2,126 6.7% 3,853 12.1%2,444 7.7% 4,570 14.4%
(275) (0.9%)(55) (0.2%)
(664) (2.1%)
1,030 3.2%
FY 2004
1.29 €
14
Development of Net Cashin € m Q1 2005
Net cash position at the beginning of the period 4,058 3,105
Gross Cash Flow from Operations* 855 505 Change in working capital 459 462 Cash used for investing activities** (673) (481)
of which Industrial Capex (additions) (557) (501)of which Customer Financing (63) 67 of which Others (53) (47)
Free Cash Flow** 641 486 Free Cash Flow before customer financing 419
Dividend paid incl. minority 0
Net cash position at the end of the period 4,346 3,444 * gross cash flow from operations, excl. working capital change** excl. change in securities, consolidation changes
Q1 2004
704
0
Capital increase 2 0
FY 20043,105
2,858 2,155
(3,399)(3,017)
(188) (194)
1,614
(384)
4,058
1,802
43
Others (152) (147)Non-recourse customer financing 0 0
130 (369)
Share buyback (203) 0 (81)

8
15
9.011.4
7.5 6.75.0
1.3 0.402468
1012
2005 2006 2007 2008 2009 2010 2011
US$ bn
Hedge Policy
EADS hedge portfolio, 31st March 2005($ 41.3 bn), average rate €1 = $1.06
€ vs $ 1.07 1.08 1.03 1.03 1.09 1.04 1.13£ vs $ 1.52 1.50 1.48 1.52 1.59 1.61 1.60
Marked-to-market value = € 7.2 bn
• App. half EADS US$ revenues naturally hedged by US$ procurement• Net exposure expected around $12 bn (including $11 bn for Airbus) in 2005
9-month
16
Content
16
Operating performance by division
Group overview
2005 guidance
Financials
9
17
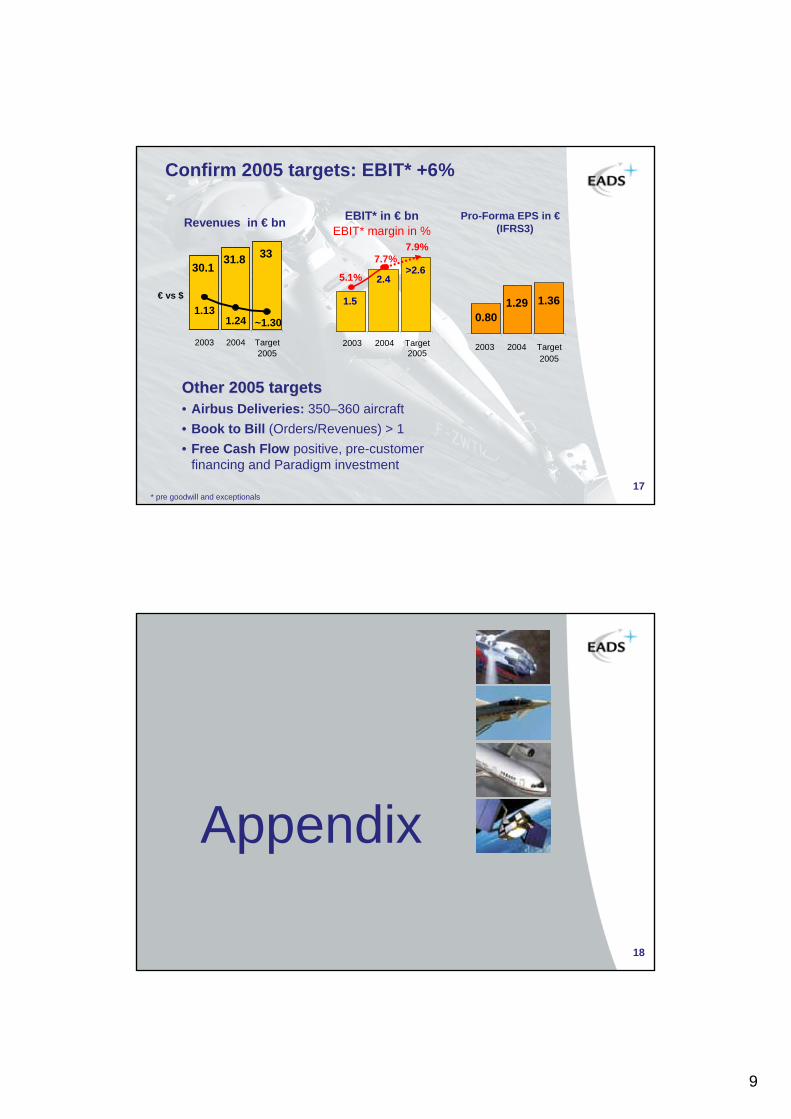
Confirm 2005 targets: EBIT* +6%
Other 2005 targetsOther 2005 targets• Airbus Deliveries: 350–360 aircraft• Book to Bill (Orders/Revenues) > 1• Free Cash Flow positive, pre-customer
financing and Paradigm investment
* pre goodwill and exceptionals
Revenues in € bn EBIT* in € bn EBIT* margin in %
Pro-Forma EPS in € (IFRS3)
2.4>2.6
1.5
5.1%
7.7%
2003 2004 Target2005
7.9%3331.830.1
~1.301.241.13
2003 2004 Target2005
0.801.29 1.36
2003 2004 Target2005
€ vs $
18• Place for• Date of presentation, place
Appendix
18

10
19
Estimated Collateral
€ 2.1 bn
Additions and Disposalsto Airbus customer financing gross exposure in $ bn
1.2 1.4 1.51.0
(0.7)
(2.9)
(0.2)
(0.1)
0.3
1.5
0.50.6
(0.7) (0.7) (0.9) (0.3)
(1.0) (0.1) (0.2)
(0.2)
(0.3)
(0.3) (0.2) (0.2)
-3.5
-2.5
-1.5
-0.5
0.5
1.5
2.5
1998 1999 2000 2001 2002 2003 2004 Q1 2005
Additions Sell Down Amortization
-3.5
-2.5
-1.5
-0.5
0.5
1.5
2.5
Net change
Airbus Customer Financing
Gross exposure ($bn)• Reduction since 2004 reflects market recovery• Allocated over 224 aircraft
Active exposure management
Gross
Exposure
€ 3.5 bn
($ 4.5 bn)
Net Exposure€ 1.4 bn
Net Exposure fully provisioned
March 31, 2005
19
6.1 4.3 3.9 3.1 3.8 4.8 4.6 4.5
20
Balance Sheet Highlightsin € m
Assetsof which Goodwillof which cash & equivalents, securitiesof which positive hedge mark-to-market
Total Equityof which OCI (Other Comprehensive Income)
Total Liabilitiesof which pensionsof which negative hedge mark-to-marketof which other provisionsof which deferred tax liabilities & deferred incomeof which financial debtsof which European gvts refundable advances
Total liabilities and EquityClosing rate €/$
of which Minority interests
Dec. 2004
58,267 9,460 9,184
19,343
38,924 3,947
6,1255,126
58,267
8,948
181 4,267
1.36
6,086
5,119
2,370
58,1659,4639,7567,341
18,5295,256
39,636 3,999
184 4,292 5,597 5,410 5,461
58,165 1.30
March 2005
2,249
11
21
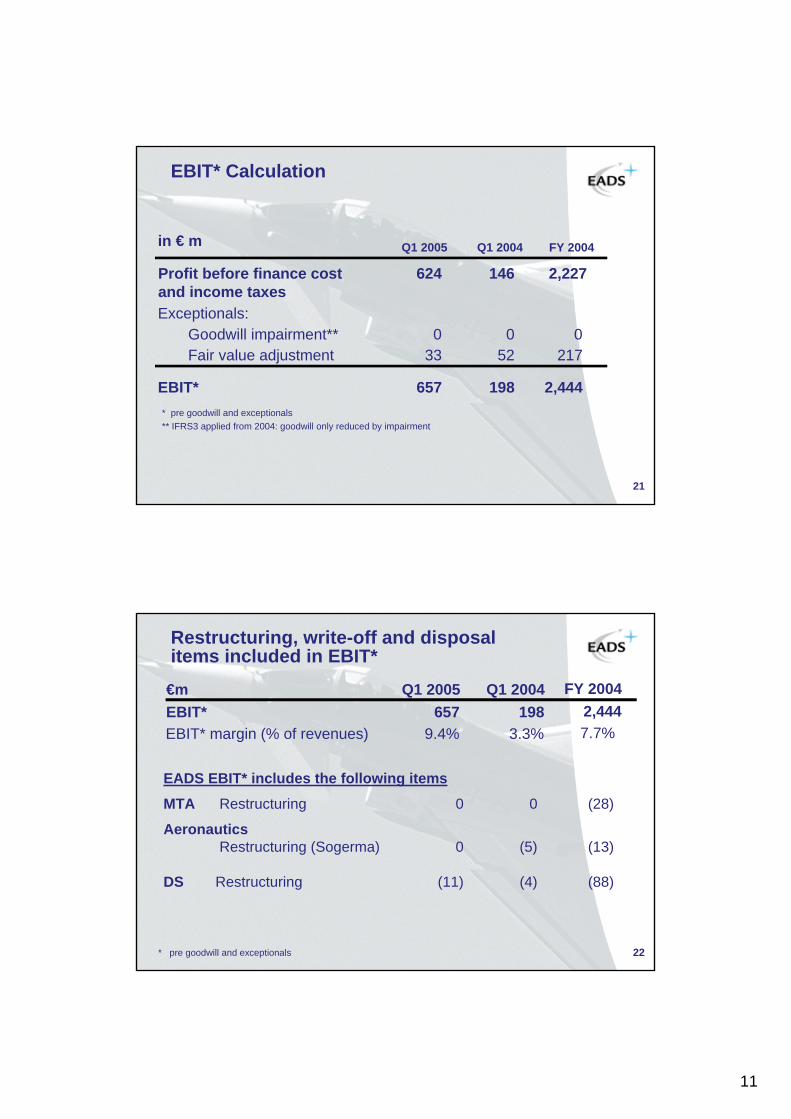
EBIT* Calculation
* pre goodwill and exceptionals** IFRS3 applied from 2004: goodwill only reduced by impairment
in € m
Profit before finance cost and income taxes
624 146
Exceptionals:Goodwill impairment** 0 0 Fair value adjustment 33 52
EBIT* 657 198
Q1 2004Q1 2005
2,227
0 217
2,444
FY 2004
22* pre goodwill and exceptionals
Restructuring, write-off and disposal items included in EBIT*
EADS EBIT* includes the following items
MTA Restructuring 0 0 (28)
AeronauticsRestructuring (Sogerma) 0 (5) (13)
DS Restructuring (11) (4) (88)
€m Q1 2005 Q1 2004EBIT* 657 198EBIT* margin (% of revenues) 9.4% 3.3%
FY 20042,4447.7%

12
23
Net Cash Position
in m€Gross cash 8,445 Financial Debts (5,001)
Reported Net cash 3,444non-recourse debt 757Net cash excl. non-recourse 4,201Main minority impact* (54) Airbus 20% non-recourse debt (151)Net cash position net of minority and non-recourse 3,996
* Mostly 20% in Airbus debt and 12.5% in MBDA cash
March 2005 March 20049,756
(4,540)
4,3461,0935,439(299)(219)
4,921
Dec. 20049,184
4,058988
5,046(201)(198)
4,647
Long-term Financial Debts (4,406)(870)Short-term Financial Debts (720)
24
Net Income pre-exceptionals
* pre goodwill and exceptionals; the term “exceptionals” refers to such items as amortization expenses of fair value adjustments relating to the EADS merger, the Airbus creation and the formation of MBDA.
Average number of shares outstanding: 795,573,328 in Q1 2005 and 800,957,248 in Q1 2004
in € m
Net Income 328 49 EPS 0.06 €
Exceptionals:Depreciation of Fair value adjustment 33 52 Related Tax impact (11) (19)Related Minorities portion (3) (5)
Net Income* 347 77 EPS* 0.10 €0.44 €
March 2005 March 2004
0.41 €
Goodwill impairment 0 0
1,030
217 (78)(17)
1,1521.44 €
Dec. 2004
1.29 €
0

13
25
A380: Maiden Flight, 27th April 2005 Self-financed R&D charged in P&L by year in EUR m
384
819983
1,8412,096 2,189
422
1,082
189
2,126
0
500
1000
1500
2000
2500
FY2001 FY 2002 FY2003 FY 2004 Q1 2005A380 R&D EADS total R&D
Capex by year in EUR m incl. Capitalised R&D
300
910
2,213
2,672
271
1,176 1,3241,592
557
0
1000
2000
3000
FY2001 FY2002 FY2003 FY2004 Q1 2005A380 Capex EADS Industrial Capex*
3,017
* excluding leased aircraft (2001: 604 €m; 2002: 101 €m; 2003: 279 € m; 2004: 656 €m; Q1 2005: 29€m)
CumulativeA380 R&D
= 3.5 €bn
CumulativeA380 Capex
= 4.0 €bn
26
all figures in € m March Dec.2005 2004
closing rate € - $ 1.30 1.36
100% AIRBUSTotal Gross exposure 3,489 3,348
of which off-balance sheet 567 604Estimated value of collateral (2,098) (1,916)Net exposure 1,391 1,432Provision and asset impairment (1,391) (1,432)AIRBUS Net exposure after provision 0 0
50% ATRTotal Gross exposure 347 333
of which off-balance sheet 42 46Estimate value of collateral (313) (300)Net exposure 34 33Provision (34) (33)ATR Net exposure after provision 0 0
Customer Financing Exposure
14
27
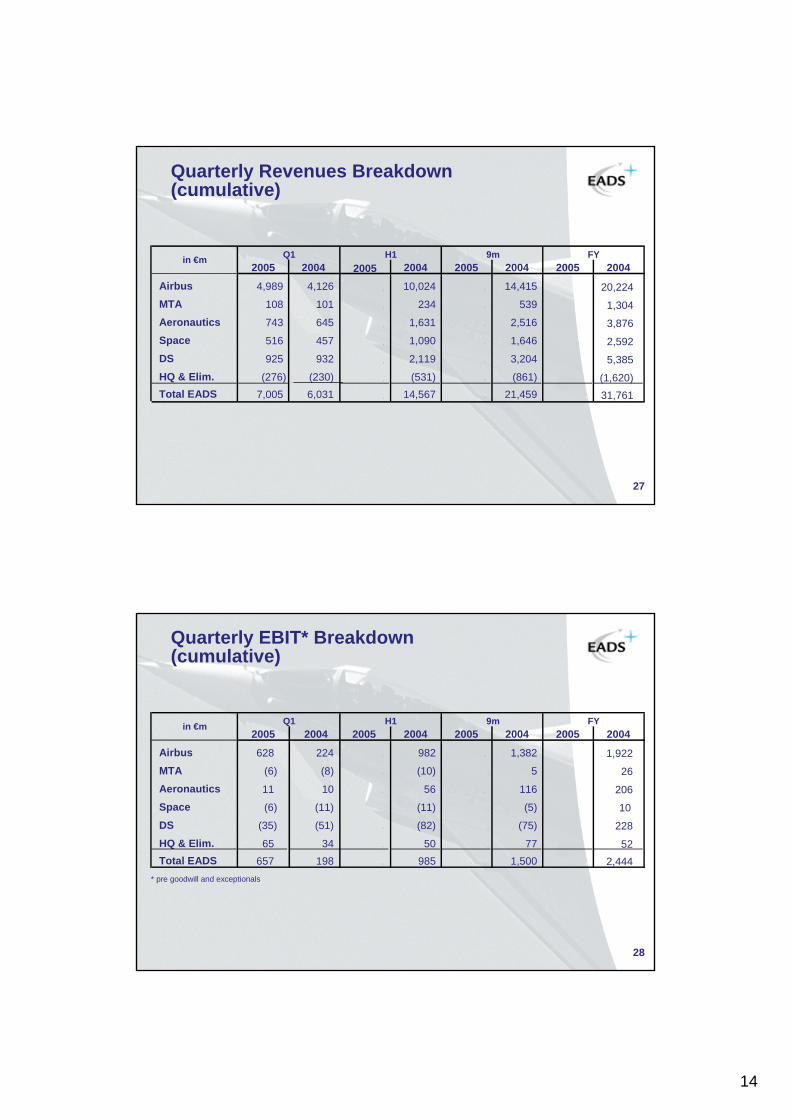
Quarterly Revenues Breakdown (cumulative)
20042005 2004 2005 2004 2005 20042005Airbus 4,126 4,989 10,024 . 14,415 . . MTA 101 108 234 . 539 . . Aeronautics 645 743 1,631 . 2,516 . . Space 457 516 1,090 . 1,646 . . DS 932 925 2,119 . 3,204 . . HQ & Elim. (230) (276) (531) . (861) .. Total EADS 6,031 7,005 14,567 . 21,459 . .
in €m Q1 H1 9m FY
20,224
1,304
3,876
2,592
5,385
(1,620) 31,761
28
Quarterly EBIT* Breakdown(cumulative)
* pre goodwill and exceptionals
20042005 2004 2005 2004 2005 20042005
Airbus 224 628 982 . 1,382 . .
MTA (8) (6) (10) . 5 ..
Aeronautics 10 11 56 . 116 ..
Space (11) (6) (11) . (5) ..
DS (51) (35) (82) . (75) ..
HQ & Elim. 34 65 50 . 77 . . Total EADS 198 657 985 . 1,500 . .
Q1 H1in €m 9m FY
1,922
26
206
10
228
52 2,444

15
29
Quarterly Order-intake Breakdown (cumulative )
20042005 2004 2005 2004 2005 20042005
Airbus 1,068 6,654 6,158 . 10,547 . .
MTA 100 59 165 . 342 . .
Aeronautics 843 893 1,669 . 3,168 . .
Space 238 640 3,905 . 4,289 . .
DS 1,359 935 2,057 . 2,975 . .
HQ & Elim. (197) (274) (496) . (718) ..Total EADS 3,411 8,907 13,458 . 20,603 . .
9mH1 FYin €m Q1
25,816
1,176
4,339
5,658
8,457
(1,329) 44,117
30
Quarterly Order-book Breakdown
20042005 2004 2005 2004 2005 20042005
Airbus 140,911 141,143 139,655 . 138,747 . .
MTA 19,980 19,850 19,904 . 19,738 ..
Aeronautics 10,021 10,986 9,991 . 10,656 . .
Space 8,083 11,394 10,992 . 10,921 . .
DS 14,976 17,262 14,542 . 14,508 . .
HQ & Elim. (15,212) (10,224) (15,140) . (14,887) . .Total EADS 178,759 190,411 179,944 . 179,683 . .
June Dec.Sept.in €m March
136,022
19,897
10,171
11,311
17,276
(10,389) 184,288