
Q-T Interval in Childrencirc.ahajournals.org/content/circulationaha/1/6/1329.full.pdf · Q-T...
10
The Q-T Interval in Normal Infants and Children By MARIANO M. ALIMURUNG, M.D., LESTER G. JOSEPH, M.I)., ERNEST CRAIGE, M.1)., ANI) BENEDICT F. MASSELL, M.D. Because of renewed clinical interest in the Q-T interval and because of a( need of normal values for an accompanying investigation in rheumatic fever, the Q-T was studlied in 517 normal infants and children from birth to 13 years of age. A mean K of 0.404 for Bazett's formula and of 0.378 for Ashman and Hull's formula was obtained. With Bazett's curve approximating the data more closely, a Bazett's scattergrami of the normal Q-T at varying heart rates was constructed. Although no difference in K value was noted between the sexes, significant (lifferences were observed in certain age groups. A SURVEY of the literature reveals that changes in the Q-T interval of the elec- trocardiogram have been mentioned in a variety of clinical conditions. Q-T prolonga- tion has been observed in hypertension,1 heart failure,2 spasmophilia,3 hypocalc emia,4 hypo- potassemia,5 rheumatic carditis,6 diphtheria,7 quinidine intoxication,8 nephritis,9 and cretin- ism.10 The Q-T has been used as an aid in differentiating pericardial effusion with heart failure from acute cardiac dilatation and fail- ure, being prolonged in the latter condition.1' It has also been found to be a good index of myocardial improvement during digitalis ther- apy, 12 13 since the Q-T interval often regresses towards normal even before significant reduc- tion in heart size occurs. This observation led to the concept that the Q-T reversal is evidence .of the direct beneficial action of digitalis on the myocardium and not simply of diminution in heart size.'4 Similarly, others have felt that the Q-T interval is a more sensitive index of the state of the myocardium following exercise than is the heart rate.15 Abnormal shortening of the Q-T interval has received less study. It has been reported in hyperparathyroidism'6 and also as evidence of digitalis intoxication.'7 Although several workers1' 1' have not found From the Children's Hospital and House of the Glood Samaritan, Children's Medical Center, Boston, Mlass. This study- was supported in part by, a research grant from The Helen Hayl Whitney Foundation. One of the authors (M.M.A.) was aided by a Fellowship from Santo Tomras University, Manila, Philippines, and one (E.C.) by a Fellowship from the National Heart Institute, IT. S. Public Health Service. 1329 the Q-T interval of much clinical value, it is evi- dent that there is a renewed and increasing interest in its clinical applications. This has been particularly true, recently, in rheumatic carditis'0 21 and in electrolyte disturbances. 24 Obviously, the accuracy of these observations depends upon the knowledge of the normal values of the Q-T interval not only at, varying heart rates but also in relation to age and sex. Several studies have been done on the elec- trocardiograms of normal infants and chillren, but only a few included the Q-T interval. Bazett,25 in his original paper in 1920, reported only 5 cases in infancy. In 1937, Hafkesbring, Drawe, and Ashman 21 published their measure- ments in 100 normal children. Then, in a more extensive study in 1942, Ashman'7 included these same 100 and added 126 more, making a total of 226 children studied. However, he ad- mitted that he did not have enough cases in infancy. Later reports by Savilhati28 and 'Mann- heimer29 were based on 165 and 118 healthy children, respectively. Only a few infants were included in these two reports. The only ex- tensive study of the subject in infancy is that of Nadrai,30 who analyzed the electrocardio- grams of 50 premature, 100 newborn, and 250 older infants. This study, however, fails to present the situation in the remaining years of childhood. A more complete study, which would include both infancy and childhood and which would be done by the same observers, seemed es- pecially warranted in view of the renewed in- terest in the clinical applications of the Q-T interval in pediatric practice; the present study was therefore undertaken. For an additional by guest on June 2, 2018 http://circ.ahajournals.org/ Downloaded from
Transcript of Q-T Interval in Childrencirc.ahajournals.org/content/circulationaha/1/6/1329.full.pdf · Q-T...
The Q-T Interval in Normal Infants and ChildrenBy MARIANO M. ALIMURUNG, M.D., LESTER G. JOSEPH, M.I)., ERNEST CRAIGE, M.1)., ANI)
BENEDICT F. MASSELL, M.D.
Because of renewed clinical interest in the Q-T interval and because of a( need of normal valuesfor an accompanying investigation in rheumatic fever, the Q-T was studlied in 517 normal infantsand children from birth to 13 years of age. A mean K of 0.404 for Bazett's formula and of 0.378for Ashman and Hull's formula was obtained. With Bazett's curve approximating the data moreclosely, a Bazett's scattergrami of the normal Q-T at varying heart rates was constructed. Althoughno difference in K value was noted between the sexes, significant (lifferences were observed in certainage groups.
A SURVEY of the literature reveals thatchanges in the Q-T interval of the elec-trocardiogram have been mentioned in
a variety of clinical conditions. Q-T prolonga-tion has been observed in hypertension,1 heartfailure,2 spasmophilia,3 hypocalc emia,4 hypo-potassemia,5 rheumatic carditis,6 diphtheria,7quinidine intoxication,8 nephritis,9 and cretin-ism.10 The Q-T has been used as an aid indifferentiating pericardial effusion with heartfailure from acute cardiac dilatation and fail-ure, being prolonged in the latter condition.1'It has also been found to be a good index ofmyocardial improvement during digitalis ther-apy, 12 13 since the Q-T interval often regressestowards normal even before significant reduc-tion in heart size occurs. This observation ledto the concept that the Q-T reversal is evidence.of the direct beneficial action of digitalis on themyocardium and not simply of diminution inheart size.'4 Similarly, others have felt that theQ-T interval is a more sensitive index of thestate of the myocardium following exercise thanis the heart rate.15Abnormal shortening of the Q-T interval has
received less study. It has been reported inhyperparathyroidism'6 and also as evidence ofdigitalis intoxication.'7
Although several workers1' 1' have not found
From the Children's Hospital and House of theGlood Samaritan, Children's Medical Center, Boston,Mlass.
This study- was supported in part by, a researchgrant from The Helen Hayl Whitney Foundation. Oneof the authors (M.M.A.) was aided by a Fellowshipfrom Santo Tomras University, Manila, Philippines,and one (E.C.) by a Fellowship from the NationalHeart Institute, IT. S. Public Health Service.
1329
the Q-T interval of much clinical value, it is evi-dent that there is a renewed and increasinginterest in its clinical applications. This hasbeen particularly true, recently, in rheumaticcarditis'0 21 and in electrolyte disturbances. 24Obviously, the accuracy of these observationsdepends upon the knowledge of the normalvalues of the Q-T interval not only at, varyingheart rates but also in relation to age and sex.
Several studies have been done on the elec-trocardiograms of normal infants and chillren,but only a few included the Q-T interval.Bazett,25 in his original paper in 1920, reportedonly 5 cases in infancy. In 1937, Hafkesbring,Drawe, and Ashman 21 published their measure-ments in 100 normal children. Then, in a moreextensive study in 1942, Ashman'7 includedthese same 100 and added 126 more, making atotal of 226 children studied. However, he ad-mitted that he did not have enough cases ininfancy. Later reports by Savilhati28 and 'Mann-heimer29 were based on 165 and 118 healthychildren, respectively. Only a few infants wereincluded in these two reports. The only ex-tensive study of the subject in infancy is thatof Nadrai,30 who analyzed the electrocardio-grams of 50 premature, 100 newborn, and 250older infants. This study, however, fails topresent the situation in the remaining yearsof childhood.A more complete study, which would include
both infancy and childhood and which wouldbe done by the same observers, seemed es-pecially warranted in view of the renewed in-terest in the clinical applications of the Q-Tinterval in pediatric practice; the present studywas therefore undertaken. For an additional
by guest on June 2, 2018http://circ.ahajournals.org/
Dow
nloaded from
Q-T INTERVAL IN NORMAL INFANTS AND CHILDREN
and more specific purpose, it was carried outto provide normal values for an accompanyinginvestigation of the Q-T in rheumatic fever.'
CLINICAL MATERIAL AND METHODThis study is based on the electrocardiograms of
517 normal infants and children seen at the BostonLying-In Hospital, the Department of Maternal andChild Health of the Harvard School of PublicHealth, and the Children's Hospital of Boston. The
.50-
.48-
.46-B BAZETT'S FORMULA: O-T
.44- A ASHMAN'S FORMULA: Q-T
.42-
.40-
W0 .38 -
z
.36-J> .34 -
tr 51W Az .32 -z
_30ji4.< 62
F7 .30-4 3
more accurate measurements. By means of this de-vice the electrocardiogram was projected on whitepaper and magnified at least ten times its actual size.In this way, the difficulty often met in the deteriminti-tion of the start of the Q wave as well as the end ofthe T wave was lessened appreciably. Measurementswere thus obtained to the nearest 0.005 second. As arule, no less than three cardiac cycles were analyzedand from these measurements the average Q-T andthe average cycle length, R-R interval, were thenderived. In instances showing significant sinus ar-
CYCLE LENGTHS (IN SEC.)
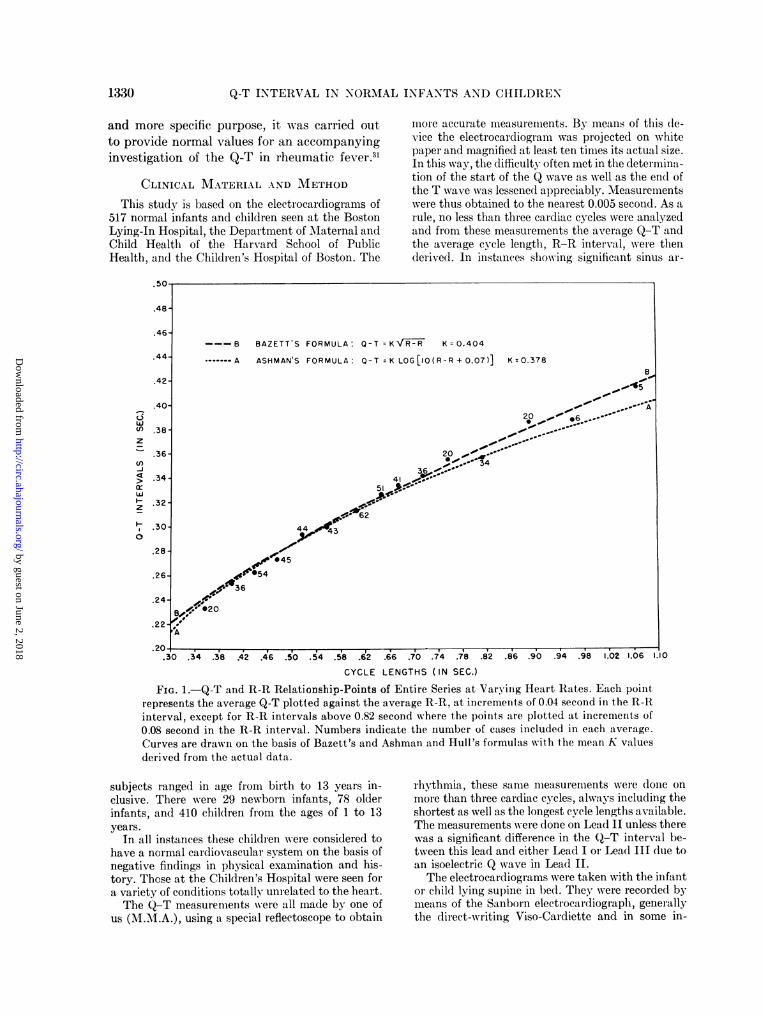
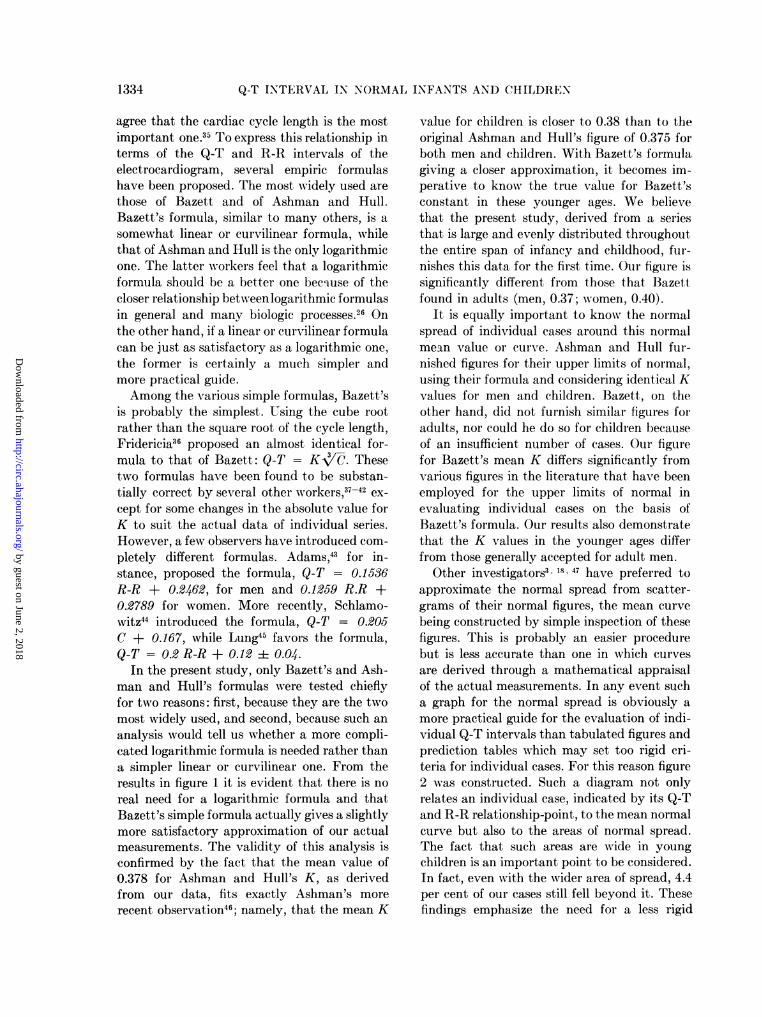
FIG. 1. Q-T and R-R Relationship-Points of Entire Series at Varying Heart Rates. Each pointrepresents the average Q-T plotted against the average R-R, at increments of 0.04 second in the R-Rinterval, except for R-R intervals above 0.82 second where the points are plotted at increments of0.08 second in the R-R interval. Numbers indicate the number of cases included in each average.Curves are drawn on the basis of Bazett's and Ashman and Hull's formulas with the mean K valuesderived from the actual data.
subjects ranged in age from birth to 13 years in-clusive. There were 29 newborn infants, 78 olderinfants, and 410 children from the ages of 1 to 13years.
In all instances these children were considered tohave a normal cardiovascular system on the basis ofnegative findings in physical examination and his-tory. These at the Children's Hospital were seen fora variety of conditions totally unrelated to the heart.The Q-T measurements were all made by one of
us (M.M.A.), using a special reflectoscope to obtain
rhythmia, these same measurements were done onmore than three cardiac cycles, always including theshortest as well as the longest cycle lengths available.The measurements were done on Lead II unless therewas a significant difference in the Q-T interval be-tween this lead and either Lead I ot Lead III due toan isoelectric Q wave in Lead II.The electrocardiograms were taken with the infant
or child lying supine in bed. They were recorded bymeans of the Sanborn electrocardiograph, generallythe direct-writing Viso-Cardiette and in some in-
1330
by guest on June 2, 2018http://circ.ahajournals.org/
Dow
nloaded from
ALIMURUNG, JOSEPH, CRAIGE, AND MASSELL,
stances the photographic Instomatic Cardiette. Thatboth types of electrocardiographs give essentiallyidentical records and can thus be jointly included ina common study has been recently demonstrated.32
RESULTSThe 517 cases were divided into groups ac-
cording to their cycle lengths, as measured bythe R-R interval. Except for those with an R-Rinterval greater than 0.82 second, the subjectswere grouped together within an increment of
.50-
.48- BAZETT'S CURVE WITH MEAN K
.46- BAZETT'S CURVE WITH MEAN K (C
....... BAZETT'S CURVE WITH MEAN K ((.44-
.42-
.40-
WU) .38-z
.36-_)C .34_>~~~~~~~~~
h 32-
.30- ,010~~~~~~~~~~~~~~~~~~~~~0
.22- , o ,
.20- ,.doll. ,
.30 .34 .38 .42 .46 .50 .54 .58 .62 .0
CYCLE L
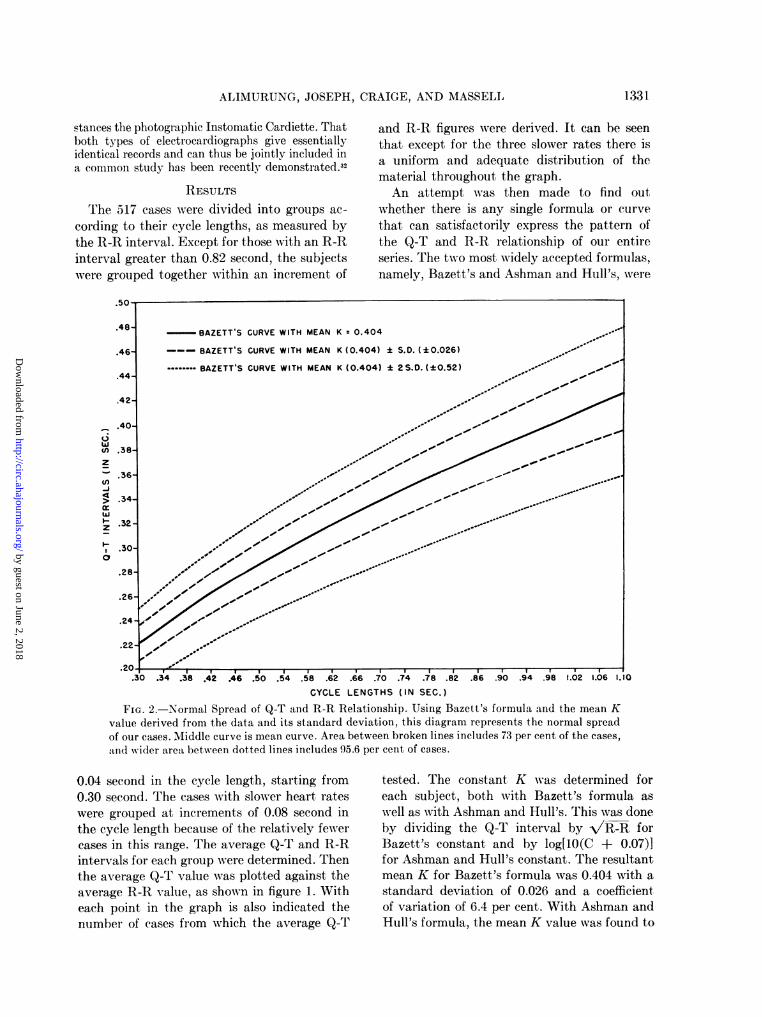
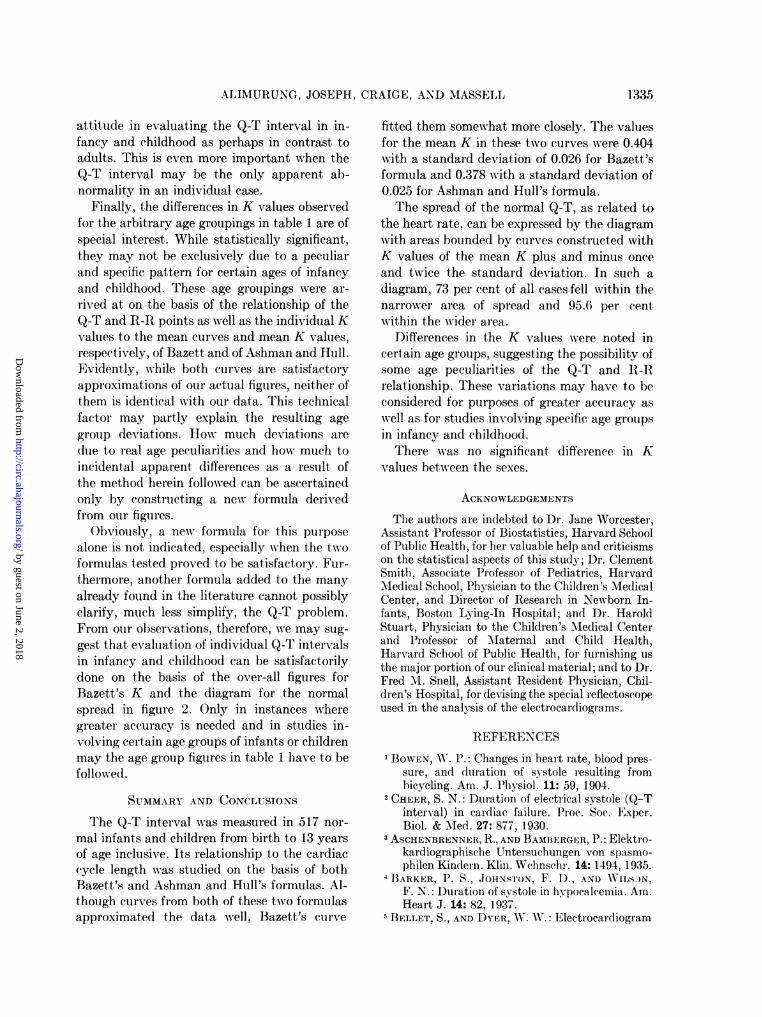
FIG. 2. Normal Spread of Q-T and R-R Revalue derived from the data and its standard dof our cases. Middle curve is mean curve. Area band wider area between dotted lines includes 95
0.04 second in the cycle length, starting from0.30 second. The cases with slower heart rateswere grouped at increments of 0.08 second inthe cycle length because of the relatively fewercases in this range. The average Q-T and R-Rintervals for each group were determined. Thenthe average Q-T value was plotted against theaverage R-R value, as shown in figure 1. Witheach point in the graph is also indicated thenumber of cases from which the average Q-T
and R-R figures were derived. It can be seenthat except for the three slower rates there isa uniform and adequate distribution of thematerial throughout the graph.An attempt was then made to find out
whether there is any single formula or curvethat can satisfactorily express the pattern ofthe Q-T and R-R relationship of our entireseries. The two most widely accepted formulas,namely, Bazett's and Ashman and Hull's, were
.66 .70 .74 .78 .82 .86 .90 .94 .98 1.02 1.06 1.
ENGTHS (IN SEC.)
flationship. Using Bazett's formula and the mean Kleviation, this diagram represents the normal spreadDetween broken lines includes 73 per cent of the cases,1.6 per cent of cases.
tested. The constant K was determined foreach subject, both with Bazett's formula aswell as with Ashman and Hull's. This was doneby dividing the Q-T interval by V/R-R forBazett's constant and by log[1O(C + 0.07)]for Ashman and Hull's constant. The resultantmean K for Bazett's formula was 0.404 with astandard deviation of 0.026 and a coefficientof variation of 6.4 per cent. With Ashman andHull's formula, the mean K value was found to
1331-
by guest on June 2, 2018http://circ.ahajournals.org/
Dow
nloaded from
Q-T INTERVAL IN NORMAL INFANTS AND CHILDREN
be 0.378 with a standard deviation of 0.025and a coefficient of variation of 6.6 per cent.Curves were then constructed, using the meanK values for each formula. It is evident thatboth curves (fig. 1) approximated satisfactorilythe average points, although Bazett's curvefitted them somewhat more closely than Ash-man and Hull's curve.With the values for Bazett's formula as de-
rived from our data, the normal spread of the
150-
140
130 - (BAZETT) K
120 (ASHMAN) K
110
100
90n
U)4 80
ILA0 70 Is
m 60
z a
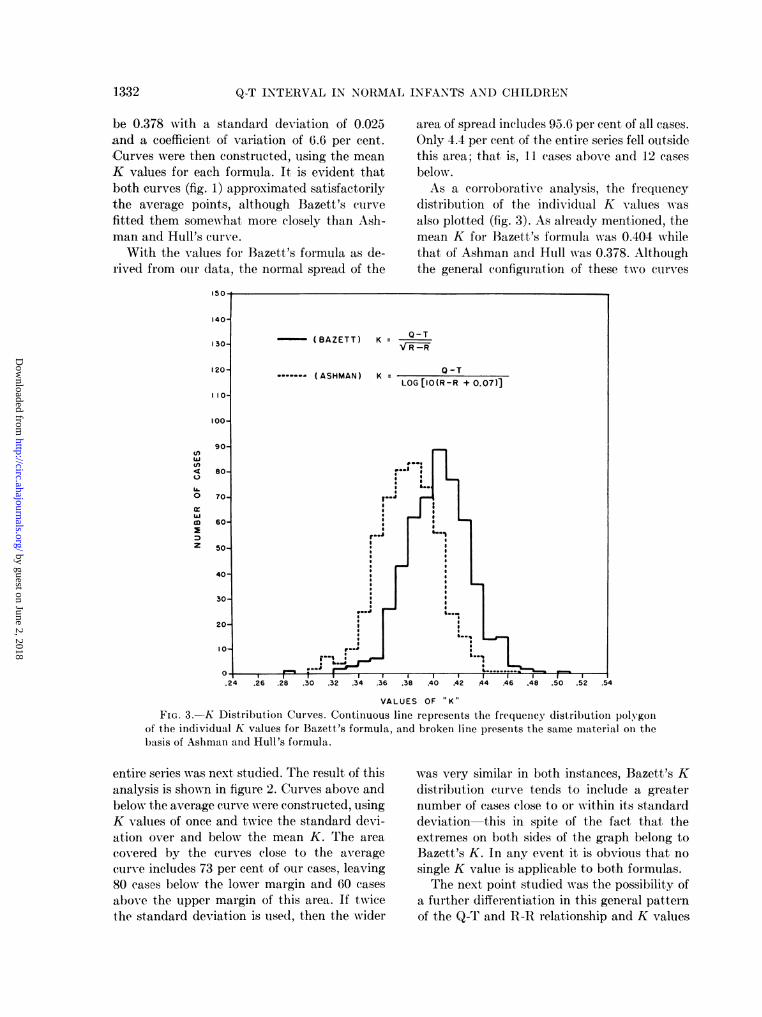
area of spread includes 95.6 per cent of all cases.Only 4.4 per cent of the entire series fell outsidethis area; that is, 11 cases above and 12 casesbelow.As a corroborative analysis, the frequency
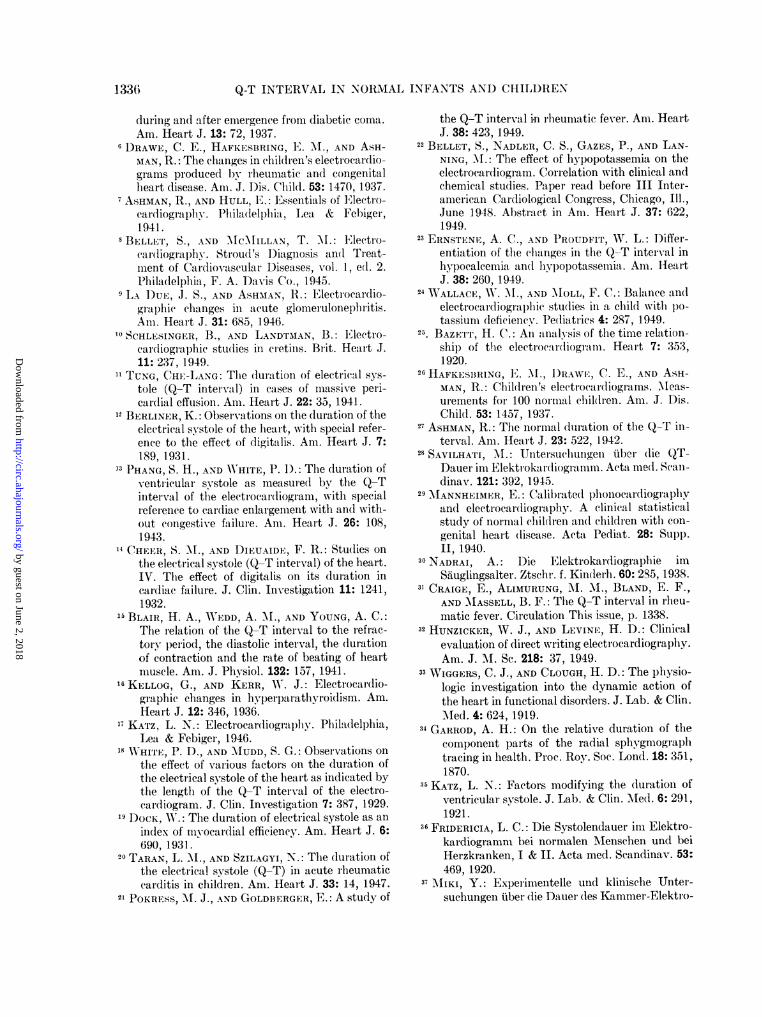
distribution of the individual K values wasalso plotted (fig. 3). As already mentioned, themean K for Bazett's formula was 0.404 whilethat of Ashman and Hull was 0.378. Althoughthe general configuration of these two curves
VALUES OF K"
FIG. 3.-K Distribution Curves. Continuous line represents the frequency distribution polygonof the individual K values for Bazett's formula, and broken line presents the same material on thebasis of Ashman and Hull's formula.
entire series was next studied. The result of thisanalysis is shown in figure 2. Curves above andbelow the average curve were constructed, usingK values of once and twice the standard devi-ation over and below the mean K. The areacovered by the curves close to the averagecurve includes 73 per cent of our cases, leaving80 cases below the lower margin and 60 casesabove the upper margin of this area. If twicethe standard deviation is used, then the wider
was very similar in both instances, Bazett's Kdistribution curve tends to include a greaternumber of cases close to or within its standarddeviation this in spite of the fact that theextremes on both sides of the graph belong toBazett's K. In any event it is obvious that nosingle K value is applicable to both formulas.The next point studied was the possibility of
a further differentiation in this general patternof the Q-T and R-R relationship and K values
1332
by guest on June 2, 2018http://circ.ahajournals.org/
Dow
nloaded from

ALIMURUNG, JOSEPH, CRAIGE, AND -MASSELL1
through the various ages of infancy and child-hood. By plotting the individual Q-T and R-Rpoints along the mean curves according to bothBazett's and Ashman and Hull's formulas, itwas found that a certain distribution patternwas consistently followed by individuals withina given age group, but that these age groupsdiffered from each other: in some the Q-T andR-R relationship-points uniformly fell close to,in others below, and in still others above themean curves. The individual K values werethen compared to the mean K values in bothformulas. Again, the same age group patternwas observed. Table 1 illustrates these resultson the basis of the study of the individual Kvalues as related to the mean K, followingB3azett's formula. The other tables and figuresshowing this entire set of analyses are not
TABLE 1.-Bazell's K in Different Age Groups
all figures but also from the mean figures for thevarious age groups. There is an almost equaldistribution of eases between the sexes in ourseries in the total number as well as in thedifferent age groups.As far as individual cases are concerned, 8
had Q-T intervals longer than 0.40 second, 2 ofwhich Awere 0.44 second. These cases Awere fotundin the older ages wvith longer cycle lengths. Theslowest heart rate among these 8 subjects wvasthat of a 12 year old child -ho had a cyclelength of 1.18 second and a Q-T interval of0.415 second. At the other extreme, 5 cases hadlQ-T intervals of 0.22 second or less. The short-est Aw-as 0.21 second and was found in a 4 monthold infant faith a cycle length of 0.39 second.This was not the fastest heart rate in the entire
TABLE 2. Raze/e's K by Age Groups anld Sexes
Males Females
Ages
o-Below 1 month...1-4 months.........5 months-l1ear ....
2-5 years...... ...
6-13. years..........
0-13 v'ears........
Mlean "K"y StandardMenK Deviation
. 0.3860.410
.. 0.3910.4010.416
0.0190.0240.0220.0230.025
Coefficientof
variation
1.9%
5. 6%5.7%C'6.0%
0.404 0.026 6.4%'O
Ages
0-Below 1 month.1-4 months........5 months-1 year...2-5 ylears6-13 years .........
No. of Mean No. of MeanCases "K" Cases "K"
13135689102
0.3870.4110.3910.3960.415
1315556596
0.3810.4070.3880.3970.410
0-13 ears.......... 273 0.403 244 0.400
included here in views of the identical resultsobtained. Except for the l to 4 month agegroup, the value for K is shorter in the youngerages and progressively longer in the older agegroups. The differences in K values amongthese age groups are statistically significant asindicated by the coefficient of variation. Thiswould suggest a certain pattern of the Q-T andR-lI relationship, hence also of the K value,that is consistently followed and probably pe-culiar to specific age groups in infancy andchildhood.
Finally, table 2 shows that there is no signifi-cant difference in K values between the sexes.This situation is unlike that in adults wherewomen have a higher K value than men, indi-cating that women tend to have a longer Q-Tinterval than men for the same heart iate. Thislack of significant difference between the sexesin our series is evident not only from the over-
series, however, the shortest cycle length being0.326 second in a I month old infant with aQ-T interval of 0.225 second.On the basis of Bazett's formula, the largest
K value was that of 0.50 in a 9 year old childwith a cycle length of 0.52 second and a Q-Tinterval of 0.36 second. The smallest, K was0.289 in a 6 month old infant with a cyclelength of 0.465 second and a Q-T interval of0.225 second.
DIscusSIONThe value of the measurement of the time
duration of ventricular systole as a criterion ofmyocardial efficiency is agreed upon by physi-OlogiStS.25 33 Garrodl34 was the first to point outthe relationship between heart rate and theduration of ventricular systole. Althoughseveral other factors have since then been foundto affect the duration of systole, all workers
1 333
by guest on June 2, 2018http://circ.ahajournals.org/
Dow
nloaded from
Q-T INTERVAL IN NORMAL INFANTS AND CHILDREN
agree that the cardiac cycle length is the mostimportant one.35 To express this relationship interms of the Q-T and R-R intervals of theelectrocardiogram, several empiric formulashave been proposed. The most widely used arethose of Bazett and of Ashman and Hull.Bazett's formula, similar to many others, is asomewhat linear or curvilinear formula, whilethat of Ashman and Hull is the only logarithmicone. The latter workers feel that a logarithmicformula should be a better one because of thecloser relationship betweenlogarithmic formulasin general and many biologic processes.26 Onthe other hand, if a linear or curvilinear formulacan be just as satisfactory as a logarithmic one,the former is certainly a much simpler andmore practical guide.Among the various simple formulas, Bazett's
is probably the simplest. Using the cube rootrather than the square root of the cycle length,Fridericia36 proposed an almost identical for-mula to that of Bazett: Q-T = KVC. Thesetwo formulas have been found to be substan-tially correct by several other workers,37 42 ex-cept for some changes in the absolute value forK to suit the actual data of individual series.However, a few observers have introduced com-pletely different formulas. Adams,43 for in-stance, proposed the formula, Q-T = 0.1536R-R + 0.2462, for men and 0.1259 R.R +0.2789 for women. More recently, Schlamo-witz44 introduced the formula, Q-T = 0.205C + 0.167, while Lung45 favors the formula,Q-T = 0.2 R-R + 0.12 i 0.04.
In the present study, only Bazett's and Ash-man and Hull's formulas were tested chieflyfor two reasons: first, because they are the twomost widely used, and second, because such ananalysis would tell us whether a more compli-cated logarithmic formula is needed rather thana simpler linear or curvilinear one. From theresults in figure 1 it is evident that there is noreal need for a logarithmic formula and thatBazett's simple formula actually gives a slightlymore satisfactory approximation of our actualmeasurements. The validity of this analysis isconfirmed by the fact that the mean value of0.378 for Ashman and Hull's K, as derivedfrom our data, fits exactly Ashman's morerecent observation46; namely, that the mean K
value for children is closer to 0.38 than to theoriginal Ashman and Hull's figure of 0.375 forboth men and children. With Bazett's formulagiving a closer approximation, it becomes im-perative to know the true value for Bazett'sconstant in these younger ages. We believethat the present study, derived from a seriesthat is large and evenly distributed throughoutthe entire span of infancy and childhood, fur-nishes this data for the first time. Our figure issignificantly different from those that Bazettfound in adults (men, 0.37; women, 0.40).
It is equally important to know the normalspread of individual cases around this normalmein value or curve. Ashman and Hull fur-nished figures for their upper limits of normal,using their formula and considering identical Kvalues for men and children. Bazett, on theother hand, did not furnish similar figures foradults, nor could he do so for children becauseof an insufficient number of cases. Our figurefor Bazett's mean K differs significantly fromvarious figures in the literature that have beenemployed for the upper limits of normal inevaluating individual cases on the basis ofBazett's formula. Our results also demonstratethat the K values in the younger ages differfrom those generally accepted for adult men.
Other investigators3' 18, 47 have preferred toapproximate the normal spread from scatter-grams of their normal figures, the mean curvebeing constructed by simple inspection of thesefigures. This is probably an easier procedurebut is less accurate than one in which curvesare derived through a mathematical appraisalof the actual measurements. In any event sucha graph for the normal spread is obviously amore practical guide for the evaluation of indi-vidual Q-T intervals than tabulated figures andprediction tables which may set too rigid cri-teria for individual cases. For this reason figure2 was constructed. Such a diagram not onlyrelates an individual case, indicated by its Q-Tand R-R relationship-point, to the mean normalcurve but also to the areas of normal spread.The fact that such areas are wide in youngchildren is an important point to be considered.In fact, even with the wider area of spread, 4.4per cent of our cases still fell beyond it. Thesefindings emphasize the need for a less rigid
1334
by guest on June 2, 2018http://circ.ahajournals.org/
Dow
nloaded from
ALIMURUNG, JOSEPH, CRAIGE, AND MASSELL13
attitude in evaluating the Q-T interval in in-fancy and childhood as perhaps in contrast toadults. This is even more important when theQ-T interval may be the only apparent ab-normality in an individual case.
Finally, the differences in K values observedfor the arbitrary age groupings in table 1 are ofspecial interest. While statistically significant,they may not be exclusively due to a peculiarand specific pattern for certain ages of infancyand childhood. These age groupings were ar-rived at on the basis of the relationship of theQ-T and R-R points as well as the individual Kvalues to the mean curves and mean K values,respectively, of Bazett and of Ashman and Hull.Evidently, while both curves are satisfactoryapproximations of our actual figures, neither ofthem is identical with our data. This technicalfactor may partly explain the resulting agegroup deviations. How much deviations aredue to real age peculiarities and how much toincidental apparent differences as a result ofthe method herein followed can be ascertainedonly by constructing a new formula derivedfrom our figures.
Obviously, a new formula for this purposealone is not indicated, especially when the twoformulas tested proved to be satisfactory. Fur-thermore, another formula added to the manyalready found in the literature cannot possiblyclarify, much less simplify, the Q-T problem.From our observations, therefore, we may sug-gest that evaluation of individual Q-T intervalsin infancy and childhood can be satisfactorilydone on the basis of the over-all figures forBazett's K and the diagram for the normalspread in figure 2. Only in instances wheregreater accuracy is needed and in studies in-volving certain age groups of infants or childrenmay the age group figures in table 1 have to befollowed.
SUMMARY AND CONCLUSIONS
The Q-T interval was measured in 517 nor-mal infants and children from birth to 13 yearsof age inclusive. Its relationship to the cardiaccycle length was studied on the basis of bothBazett's and Ashman and Hull's formulas. Al-though curves from both of these two formulasapproximated the data well, Bazett's curve
fitted them somewhat more closely. The valuesfor the mean K in these two curves were 0.404with a standard deviation of 0.026 for Bazett'sformula and 0.378 with a standard deviation of0.025 for Ashman and Hull's formula.The spread of the normal Q-T, as related to
the heart rate, can be expressed by the diagramwith areas bounded by curves constructed withK values of the mean K plus and minus onceand twvice the standard deviation. In such adiagram, 73 per cent of all cases fell within thenarrower area of spread and 95.6 per centwithin the wider area.
Differences in the K values were noted incertain age groups, suggesting the possibility ofsome age peculiarities of the Q-T and R-Rrelationship. These variations may have to beconsidered for purposes of greater accuracy aswell as for studies involving specific age groupsin infancy and childhood.
There was no significant difference in Kvalues between the sexes.
ACKNOWLEDGEMENTS
The authors are indebted to Dr. Jane Worcester,Assistant Professor of Biostatistics, Harvard Schoolof Public Health, for her valuable help and criticismson the statistical aspects of this study; Dr. ClementSmith, Associate Professor of Pediatrics, HarvardMedical School, Physician to the Children's MedicalCenter, and Director of Research in Newborn In-fants, Boston Lying-In Hospital; and Dr. HaroldStuart, Phvsician to the Children's Medical Centerand Professor of Maternal and Child Health,Harvard School of Public Health, for furnishing USthe major portion of our clinical material; and to Dr.Fred Ml. Snell, Assistant Resident Physician, Chil-dren's Hospital, for devising the special reflectoscopeused in the analysis of the electrocardiograms.
REFERENCES
'BOWEN, W. P.: Changes in heart rate, blood pres-sure, and duration of systole resulting frombicycling. Am. J. Physiol. 11: 59, 1904.
2 CHEER, S. N.: Duration of electrical systole (Q-Tinterval) in cardiac failure. Proc. Soc. Exper.Biol. & M\ed. 27: 877, 1930.
3 AsCHENBRENNER, R., AND BAMBERGER, P.: Elektro-kardiographisehe Untersuchungen von spasmo-philen Kindern. Klin. Wchnschr. 14: 1494, 1935.
'BARKER, P. S., JOHNXrON, F. D., AND \VILSJN,F. N.: Duration of systole in hypocalcemia. Am.Heart J. 14: 82, 1937.
5BELLET, S., AND DYER, W. W, .: Electrocardiogram
1 335
by guest on June 2, 2018http://circ.ahajournals.org/
Dow
nloaded from
Q-T INTERVAL IN NORMAL INFANTS AND CHILDREN
during and after emergence from diabetic coma.
Am. Heart J. 13: 72, 1937.6 DRAWE, C. E., HAFKESBRING, E. ., AND ASH-
MAN, R.: The changes in children's electrocardio-grams produced by rheumatic and congenitalheart disease. Am. J. Dis. Child. 53: 1470, 1937.
7 ASHM1AN, R., AND HULL, E.: Essentials of Electro-cardiography-. lhliladelphia, Lea & Febiger,1941.
8 BEmLLr, S., AND MC.\LILLAN, T. M.: Electro-car(liogral)hy. Stroud 's DiagnoSiS an(l Treat-
ment of Cardiovascular Diseases, vol. 1, ed. 2.P'hiladelphia, F. A. Davis Co., 1945.
9 LA 1)UE, J. S., AND ASHMAN, 1.: Electrocardio-gr ap)hic changes in acute glomneruloneplhritis.Am. Heart J. 31: 685, 1946.
10 SCHLESINGER, B., AND LANDTNMAN, B.: Electro-cardiographic stu(lies in cretins. Brit. Heart J.11: 237, 1949.
" TUNG, CHEy-LANG: The (luration of electrical sys-
tole (Q-T interval) in cases of massive peri-car(dial effusion. Am. Heart J. 22: 3a, 1941.
12 BERLINER, K.: Observations on the duration of theelectrical systole of the heart, with special refer-ence to the effect of digitalis. Am. Heart J. 7:189, 1931.
13 PHANG, S. H., AND W\HITE, P. D).: The duration ofventricular systole as measurled by the Q-Tinterval of the electrocardiogram, with specialreference to car(liac enlargement with and with-out congestive failure. Am. Heart J. 26: 108,1943.
14 CHEER, S. Al., AND DIEUAIDE, F. R.: Studies on
the electrical systole (Q-T interval) of the heart.IV. The effect of digitalis on its duration incardiac failure. J. Clin. Investigation 11: 1241,1932.
15 BLAIR, H. A., WmEDD, A. i\l., AND YOUNG, A. C.:The relation of the Q-T interval to the refrac-tory period, the diastolic interval, the durationof contraction and the rate of beating of heartmuscle. Am. J. Physiol. 132: 157, 1941.
16 KELLOG, G., AND KERR, W. J.: Electrocardio-graphic changes in hyperparathyroidism. Am.Heart J. 12: 346, 1936.
14 KATZ, L. N.: Electrocai(liograpl)lhy. Philadt(lelphia,Lea & Febiger, 1946.
18 WHITE, P. D., AND MUDD, S. G.: Observations on
the effect of various factors on the duration ofthe electrical systole of the heart as indicated bythe length of the Q-T interval of the electro-car(liogram. J. Clin. Investigation 7: 387, 1929.
91 DociS, \.: The duration of electnital systole as an
index of mnvocardial efficiency. Am. Heart J. 6:690, 1931.
20 TARAN, L. Al., AND SZILAGYI, N.: The duration ofthe electrical systole (Q-T) in acute rheumaticcarditis in children. Am. Heart J. 33: 14, 1947.
21 POKRESS, Al. J., AND GOLDBERGER, E.: A study of
the Q-T intervXal in rheumatic fever. Am. HeartJ. 38: 423, 1949.
32 BELLET, S., NADLER, C. S., GAZES, P., AND LAN-NING, M.: The effect of hypopotassemia on theelectrocardiogram. Correlation with clinical andchemical studies. Paper read before III Inter-american Cardiological Congress, Chicago, Ill.,June 1918. Abstract in Am. Heart J. 37: 622,1949.
23 ERNSTENE, A. C., AND PROUDFIT, W. L.: Differ-entiation of the chtanges in the Q-T interval inhypocalcemia and hypopotassemia. Am. HeartJ. 38: 260, 1949.
24 WALLACE, W\. 2M., AND MOLL, F. C.: Balance andelectrocardiograph1ice studlies in a child with po-tassium deficienuc. 1e(liatrics 4: 287, 1949.
25. BAZETT, H. C.: AIn anaySiS of the time relation-ship of the electrocardiogram. Heart 7: 353,1920.
26 HAFKESIBRING, E. AM., DRA\WE, C. E., AND ASH-MAN, R.: Children's electrocardiograms. \Nleas-urements for 100 normal children. Am. J. Dis.Child. 53: 1457, 1937.
27 ASHMAN, R.: The normal duilration of the Q-T in-terval. Am. Heart J. 23: 522, 1942.
28 SAVILHATI, XI.: Unitersuchiungeen uiher (lie QT-Dauer ima Elektrokar(liogirammiiii. Acta Ine(l. Scan-dinav. 121: 392, 1945.
29 MANNHELMER, E.: Calibrated phonocardiographyand electrocar(liographiy. A clinical statisticalstudy of normal children and children with con-genital heart (lisease. Acta Pediat. 28: Supp.II, 1940.
30 NADRAI, A.: Die Elektrokardiographie imSauglingsalter. Ztschr. f. Kinderh. 60: 235, 1938.
31 CRAIGE, E., ALIMURUNG, Al. M., BLAND, E. F.,AND MASSELL, B. F.: The Q-T interval in lheu-matic fever. Circulation This issue, p. 1338.
32 HUNZICKER, W. J., AND LEVINE,, H. D.: Clinicalevaluation of direct writing electrocardiography.Am. J. MI. Sc. 218: 37, 1949.
33 WIGGERS, C. J., AND CLOUGH, H. D.: The physio-logic investigation into the dynamic action ofthe heart in functional disorders. J. Lab. & Clin.Med. 4: 624, 1919.
34 GARROD, A. H.: On the relative duration of thecomponent parts of the radial sphygmographtracing in health. Proc. Roy. Soc. Lond. 18: 351,1870.
35 KATZ, L. N.: Factors modifying the duration ofventricular systole. J. Lab. & Clin. M\1ed. 6: 291,1921.
36 FRIDERICIA, L. C.: Die Systolendauer im Elektro-kardiogramm bei normalen Menschen und beiHerzkranken, I & II. Acta med. Scandinav. 53:469, 1920.
37 MIKI, Y.: Experimentelle und klinische Unter-suchungen tibei (lie Dauer (les Kammer-Elektro-
1336
by guest on June 2, 2018http://circ.ahajournals.org/
Dow
nloaded from
ALIMURUNG, JOSEPH, CRAIGE, AND MASSELL
kardiogramnms. Ztschr. f. d. ges. exper. Med.27: 323, 1922.
38 FENN, G. K.: Studies in the variations of thelength of the Q-R-S-T interval. Arch. Int.Med. 29: 441, 1922.
39 CHEER, S. A., AND Li, R. C.: Studies on the elec-trical systole (Q-T interval) of the heart. Dura-tion of the electrical systole in normal Chinese.Chinese J. Phvsiol. 4: 191, 1930.
46 VIsCIDI, P. C., AND GEIGER, A. J.: Electrocardio-graphic ol)servations on 500 unselected youngadults at work. Am. Heart J. 26: 763, 1943.
41 SHIPLEY, R. A., AND HALLARAN, M. R.: Four-leadelectrocardiograms in 200 normal men andwomnen. Am. Heart J. 11: 325, 1936.
4' SCHLOMKA, G., AND RAAB, W.: Zur Bewertung der
relativen Systolendauer; ilber die Abhangigkeitder relativen Svstolendauer des Gesunden vom
Lebensalter. Ztschr. f. Kreislauforschi. 28: 335,1936.
43 ADAMS, XV.: Normal duration of electrocardio-graphic ventricular complex. J. Clin. Investiga-tion 15: 335, 1936.
4 SCHLAMOWITZ, I.: An analysis of the time relation-ships within the cardiac cycle in electrocardio-grams of normal men. I. The duration of theQ-T interval and its relationship to the cyclelength (R-R interval). Am. Heart J. 31: 329,1946.
45 LUNG, 0.: A simple formula for clinical interpreta-tion of the Q-T interval. Acta med. Scand. 134:79, 1949.
46 ASHMAN, R.: Personal communication to theauthors.
47 LARSEN, K. H., AND SKULASON, TH.: Det normaleelektrokardiogramm. Nord. Mled. 9: 300, 1941.
1337
by guest on June 2, 2018http://circ.ahajournals.org/
Dow
nloaded from
F. MASSELLMARIANO M. ALIMURUNG, LESTER G. JOSEPH, ERNEST CRAIGE and BENEDICT
The Q-T Interval in Normal Infants and Children
Print ISSN: 0009-7322. Online ISSN: 1524-4539 Copyright © 1950 American Heart Association, Inc. All rights reserved.
is published by the American Heart Association, 7272 Greenville Avenue, Dallas, TX 75231Circulation doi: 10.1161/01.CIR.1.6.1329
1950;1:1329-1337Circulation.
http://circ.ahajournals.org/content/1/6/1329the World Wide Web at:
The online version of this article, along with updated information and services, is located on
http://circ.ahajournals.org//subscriptions/
is online at: Circulation Information about subscribing to Subscriptions:
http://www.lww.com/reprints Information about reprints can be found online at: Reprints:
document.
Permissions and Rights Question and Answer Further information about this process is available in therequested is located, click Request Permissions in the middle column of the Web page under Services.the Editorial Office. Once the online version of the published article for which permission is being
can be obtained via RightsLink, a service of the Copyright Clearance Center, notCirculationpublished in Requests for permissions to reproduce figures, tables, or portions of articles originallyPermissions:
by guest on June 2, 2018http://circ.ahajournals.org/
Dow
nloaded from


![Interval Notation: ], not interval notationpgrant.weebly.com/uploads/2/3/2/7/23274454/6.3b_interval_notation.… · •Interval Notation: Uses different brackets to indicate an interval.](https://static.fdocuments.us/doc/165x107/5f8344624904df613146ef90/interval-notation-not-interval-ainterval-notation-uses-different-brackets.jpg)


![Q analysis on reflection seismic data - Imperial College … · · 2016-04-21Q analysis on reflection seismic data ... Introduction [2] ... Interval-Q Calculation by Inversion [20]TwoQ-analysis](https://static.fdocuments.us/doc/165x107/5af38bc17f8b9a95468cb548/q-analysis-on-reflection-seismic-data-imperial-college-analysis-on-reflection.jpg)