PV Reliability Development Lessons from JPL's Flat … 1 PER 20,000 PER YEAR 0.2 % PER YEAR 1 PER...
20
RR-1 39th IEEE PVSC PV Reliability Development Lessons from JPL's Flat Plate Solar Array Project Dr. R.G. Ross, Jr. FSA Engineering and Reliability Mngr, 1975-1990 June 17, 2013 Jet Propulsion Laboratory California Institute of Technology Pasadena, California Copyright 2013 California Institute of Technology. Government sponsorship acknowledged
Transcript of PV Reliability Development Lessons from JPL's Flat … 1 PER 20,000 PER YEAR 0.2 % PER YEAR 1 PER...

RR-139th IEEE PVSC
PV Reliability Development Lessons from JPL's Flat Plate Solar Array
Project
Dr. R.G. Ross, Jr.
FSA Engineering and Reliability Mngr, 1975-1990
June 17, 2013
Jet Propulsion LaboratoryCalifornia Institute of Technology
Pasadena, California
Copyright 2013 California Institute of Technology. Government sponsorship acknowledged

RR-239th IEEE PVSC
Topics
• Overview of the FSA Program Approach
• Closed-loop module development process• Program players and roles
• Reliability Management Lessons
• Closed-loop process• Defining reliability requirements• Measuring reliability against requirements
• Reliability Development Lessons
• Large applications for problem identification• Computer simulations for life prediction• Failure analysis and reliability physics research
• Qual tests for rapid product assessment
• Summary Observations

RR-339th IEEE PVSC
RequirementsSpecification
PrototypeProduction& Qual Test
Fielded PVApplications
ModuleDesign
Synthesis
ModuleLarge-scaleProduction
RequirementsResearch
ModuleTech Base
Development
Balance ofSystem
DevelopmentPV Manufacturer Lead
Field Perf.Data
Acquisition
AcceleratedLife & Field
Testing
Gov't Lead(NASA-GRC, MIT/LL, Sandia)
JPL Lead
FailureAnalysis
DoE / FSA Program Approachto PV Module Development
RR-439th IEEE PVSC
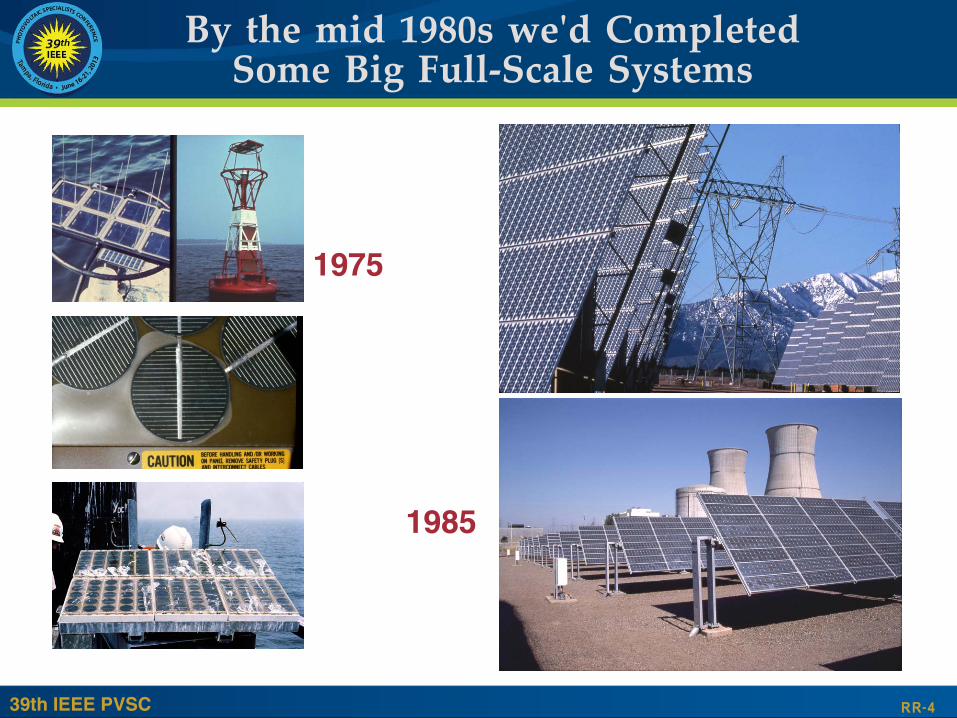
By the mid 1980s we'd CompletedSome Big Full-Scale Systems
1975
1985

RR-539th IEEE PVSC
Evolution of Reliability Issuesduring FSA Project (1975-1985)
75 76 77 78 79 80 81 82 83 84
YearProblem Area
Photothermal Degradation
High Operating Temperature
Module Arcs and Fires
Excessive Soiling
HotSpot Heating
Voltage Breakdown
Cell Cracking
Glass Breakage
Hail Impact Damage
Structural Failure
Electrochemical Corrosion
Metallization Corrosion
Interconnect Fatigue
Bond Delamination

RR-639th IEEE PVSC
Open-circuit cracked cells %/yr 0.08 0.13 0.005 EnergyShort circuit cells %/yr 0.24 0.40 0.050 EnergyInterconnect open circuits %/yr2 0.05 0.25 0.001 EnergyCell gradual power loss %/yr 0.67 1.15 0.20 EnergyModule optical degradation %/yr 0.67 1.15 0.20 EnergyFront surface soiling % 10 10 3 EnergyModule glass breakage %/yr 0.33 1.18 0.1 O&MModule open circuits %/yr 0.33 1.18 0.1 O&MModule hot-spot failures %/yr 0.33 1.18 0.1 O&MBypass diode failures %/yr 0.70 2.40 0.05 O&MModule shorts to ground %/yr2 0.022 0.122 0.01 O&MModule delamination %/yr2 0.022 0.122 0.01 O&MEncapsulant failure due years 27 20 35 Endto loss of stabilizers of life of life
Failure MechanismType of
Degradation
Units of¶Degradation¶
Allocationfor
30-yearLife
Module†
¶Economic¶Penalty
Life-limitingwearout
Modulefailures
PowerDegradation
Componentfailures
k=10k=0
NormalizedPowerOutput
Years
Baseline
Level for¶10%Energy¶Cost
Increase*
* k=discount rate, †Very difficult to measure in module level testing
Example Reliability Requirements atSystem & Components Level
WorkingDefinition
1 PER20,000
PER YEAR
0.2 %PER YEAR
1 PER1,000
PER YEAR

RR-739th IEEE PVSC
Reliability RequirementsRanked by Difficulty
• System Operating Voltage
• Large number of series cells magnifies component failure effects• High voltage exacerbates corrosion and safety issues
• Operating Temperature and Temperature Cycles
• Accelerates nearly all failure mechanisms• x2 life reduction for each 10°C increase in Temperature
• Ambient Humidity Level• x2 life reduction for each 10% increase in Relative Humidity
• Ultraviolet Exposure Level• Encapsulant degradation (highly nonlinear with UV level)
• Ambient Soiling Level• Much worse in urban environments
• Maximum Hail Size• Site specific, a problem with early applications in central US
• Presence of Salt Fog• Very specific to marine locations
• Maximum Wind & Snow Loads• Site specific, generally not a significant issue

RR-839th IEEE PVSC
Site Specific Effects of Temperature,Humidity and Voltage
Plots of Temp/Humidity chamber exposure equivalentto 20-year field exposure at indicated sites
based on integrating SOLMET hourly weather data
100 100170 200 170 200140140
10
1
103
104
100
105
106
124
1020
4590180360720
124
1020
4590180360720
Tim
e, h
ou
rs
10
1
103
104
100
105
106
Tim
e, d
ays
For daylight-hours/day Field ExposureFor 24-hour/day Field Exposure
Bottom Line: 10°C increase in Temp or 10% increase in RH drops life by factor of 2
Tim
e, h
ou
rs
Tim
e, d
ays
MIAMI
BOSTON
PHOENIX
FACTOR OF 2 PER
10 POINTS (T+RH)
MIAMI
BOSTON
PHOENIX
Temp (°C) + RH (%) Temp (°C) + RH (%)
FACTOR OF 2 PER
10 POINTS (T+RH)
85°C+ 85%RH 85°C+ 85%RH

RR-939th IEEE PVSC
Transmission Loss through EVAvs Temperature and UV Level
Ultraviolet Level (Suns)
UV response is very nonlinear and difficult to accelerate
No
rma
lize
d Y
ell
ow
ing
Ra
te
(Q/t
)

RR-1039th IEEE PVSC
Transmission Loss through EVAIncreases Arrheniusly with Temp
No
rma
lize
d Y
ell
ow
ing
Ra
te
(Q/t
)
Temperature (°C)
• Thermal response isrelatively predictable(typically Arrheniuswith approx. ratedoubling each 10°C)
• Accurate regulationof temperature iscritical to successfulUV testing

RR-1139th IEEE PVSC
Hourly Calculation ofEVA Yellowing Rate in Phoenix
Annual Hours at each Temperature-UV Level
Yellowing Rate at each Temperature-UV Level
Fromcurve-fit ofparametricUV -TempYellowingdata for
EVA
FromSOLMEThourly
weatherrecords
forPhoenix
Predictedpower lossafter 30-yearsin Phoenix:
• Ground-mounted array= 3.5%
• Roof-mountedarray = 7.9%*
* Because roof arrayoperates at highertemperature

RR-1239th IEEE PVSC
FSA Project Relied on aVariety of Test methods
• Large Application Experiments that include all system-level interfaces• Extremely valuable for quantifying reliability of mature designs
and identifying failures driven by complex interfaces• Outdoor Test Racks of minimal value: unaccelerated and lack key
system voltage-current interface conditions
• Laboratory Research and Life Tests
• High value for quantifying reliability physics parameterdependencies and resolving reliability problems
• Qualification (or screening) Tests
• High value for screening new designs for known failures

RR-1339th IEEE PVSC
OBJECTIVE
• To accurately assess hardware functionality andreliability in big systems with emphasis onsystem synergisms, interactions, and interfaces
ADVANTAGES
• Complete system interfaces and operating conditions providesreliable assessment of subsystem compatibility issues anddegradation mechanisms associated with large numbers of moduleswith real system interactions and operational stresses
• Inclusion of balance-of-system (BOS) hardware provides data andconfidence in complete functional system
LIMITATIONS
• Requires complete system with all important balance-of-systemcomponents and interfaces
• Occurs very late in the design cycle; problems at this point arehighly visible and expensive
• Added complexity in constructing and testing complete system
Full-Up System-Level TestingObjectives and Attributes

RR-1439th IEEE PVSC
Characterization and AcceleratedLife Testing Objectives and Attributes
OBJECTIVE
• To understand and quantify the fundamentalinterdependencies between performance (failure level),environmental and operational stress level, hardwarematerials and construction features, and time
ADVANTAGES
• Mechanism-level understanding achieved by selecting specializedtests and facilities targeted at specific degradation stressenvironments and construction material parameters
• Carefully controlled parameters (generally at parametric levels) withacceleration consistent with accurate extrapolation to use conditions
LIMITATIONS
• Expensive and time consuming — requires specialized testingequipment and modestly long test durations (2 weeks to 5 years)
• Requires multiple tests to address the total spectrum of degradationmechanisms and levels
• Number of specimens insufficient to quantify random failures
UV-Temp-HumidityExposure Chamber

RR-1539th IEEE PVSC
Key Output of Reliab. Physics Testingwas TechBase for Module Design
Fatigue strength
Circuit designs
Cell strength
• New lamination adhesives, primers, andstabilizers (PVB, EVA, EMA) for lower cost andimproved weathering
• Circuit redundancy configurations forcontrolling cell cracking and broken interconnects
• Interconnect design and test methods
• Cell attachment techniques to minimizelosses due to cell cracking
• Glass strength calculation methods
• Bypass diode design and hotspot test methods
• Hail resistance data and test methods
• Cell fracture strength and test methods
• Voltage breakdown data and test methods
• Electrochem corrosion Data and test methods
• UV-thermal durability data and test methods

RR-1639th IEEE PVSC
Qualification TestingObjectives and Attributes
OBJECTIVE
• To rapidly and economically screen module designsfor prominent failure mechanisms
• To rapidly assess the relative durability ofalternative designs
ADVANTAGES
• Quick turnaround — relatively inexpensive
• Relatively standard procedures allows inter-comparison withhistorical data
• Separate tests for important environmental and operationalstresses aids identification of high-risk mechanisms
LIMITATIONS
• Minimal life-prediction capability (a relative measure ofrobustness, generally does not quantify life attributes)
• Requires multiple tests and specialized facilities to address thetotal spectrum of stressing environments
• Number of specimens insufficient to quantify random failures

RR-1739th IEEE PVSC
HAIL IMPACTDiameter (mm) - - - 20 25.4Terminal¶Velocity¶(m/s) - - - 20.1 23.2Num. Impacts - - - 9 10
HOT-SPOT HEATING (h) - - - - 100
QUAL TEST I II III IV V NOTES
HUMIDITY CYCLINGRelative Humidity 90 85Temp. Range (°C) +70* -23 to+40 -40 to+85 *No cycling, 70°CNumber cycles - 5 10 Constant for 168 h
ELECTRICAL ISOLATION - 1500 2000* 3000* *1500 for resid.(volts) modules
WIND RESISTANCE (kPa) - - - 1.7* *Shingles only
THERMAL CYCLINGRange (°C) -40 to+90 -40 to+90Number cycles 100 50 200
MECHANICAL CYCLING* *Excluding shinglePressure (kPa) - ±2.4 modulesNumber Cycles - 100 10,000
TWISTED¶MOUNT¶(mm/m) - 20
Qualification Test Evolutionduring FSA Project (1975-1985)

RR-1839th IEEE PVSC
JPL's Role inNational PV Program
Sunsetted in theEarly 1990's
RR-1939th IEEE PVSC
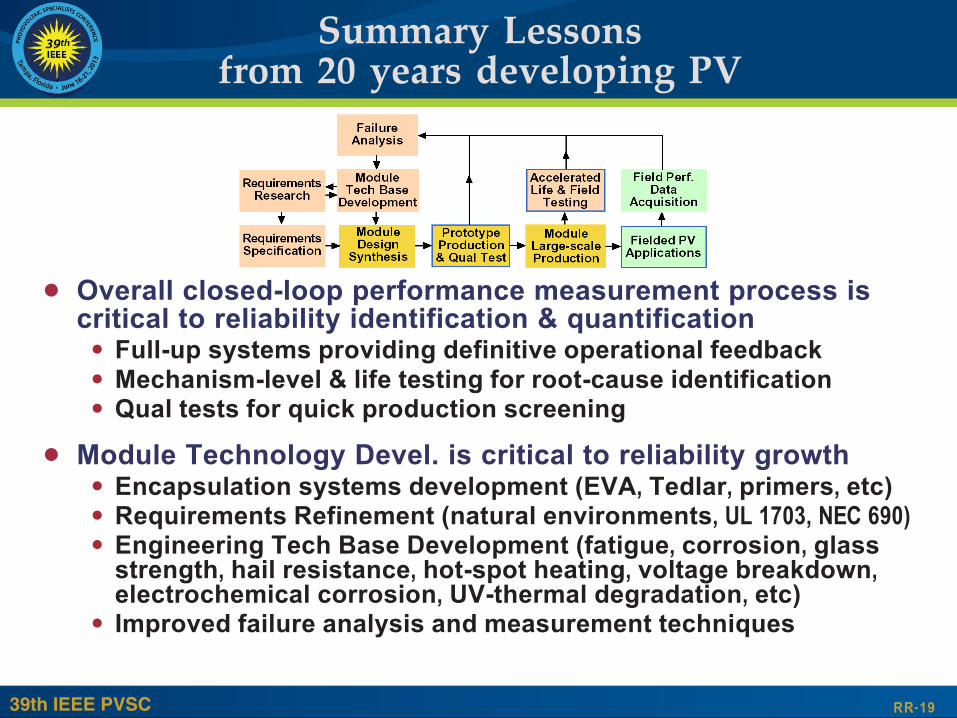
• Overall closed-loop performance measurement process iscritical to reliability identification & quantification• Full-up systems providing definitive operational feedback
• Mechanism-level & life testing for root-cause identification• Qual tests for quick production screening
• Module Technology Devel. is critical to reliability growth• Encapsulation systems development (EVA, Tedlar, primers, etc)• Requirements Refinement (natural environments, UL 1703, NEC 690)• Engineering Tech Base Development (fatigue, corrosion, glass
strength, hail resistance, hot-spot heating, voltage breakdown,electrochemical corrosion, UV-thermal degradation, etc)
• Improved failure analysis and measurement techniques
Summary Lessonsfrom 20 years developing PV

RR-2039th IEEE PVSC
Summary Lessons (Con't)
• Rapid open communication between all stakeholders iscritical to rapid reliability improvement• Rapid Problem Identification and communication• Resolution Teamwork across many organizations
(JPL FSA project had 131 organizations under contract;Engineering (ES&R, Module Proc, & Encapsulation) had atotal of 37 organizations under contract)
• In total, over 380 of the key reports resulting from theEngineering and Reliability activities of the FSA Projectare cataloged on the JPL web site:
http://www2.jpl.nasa.gov/adv_tech/photovol/PV_pubs.htm