PV Module Reliability Assessment using Thermography … · IEA INTERNATIONAL ENERGY AGENCY...
22
IEA INTERNATIONAL ENERGY AGENCY PHOTOVOLTAIC POWER SYSTEMS PROGRAMME PV Module Reliability Assessment using Thermography and Electroluminescence Imaging M. Köntges Institute for Solar Energy Research Hamelin Extract of TASK13 report and new work “Review on Failures of Photovoltaic Modules” Primary authors: M. Köntges, S. Kurtz, C. Packard, U. Jahn, K. A. Berger, K. Kato, Th. Friesen, Haitao Liu, M. Van Iseghem 1-3. April 2014, IEA TASK13 Meeting, Freiburg, Germany
Transcript of PV Module Reliability Assessment using Thermography … · IEA INTERNATIONAL ENERGY AGENCY...
IEA INTERNATIONAL ENERGY AGENCY
PHOTOVOLTAIC POWER SYSTEMS PROGRAMME
PV Module Reliability Assessment using Thermography and Electroluminescence
Imaging
M. Köntges Institute for Solar Energy Research Hamelin
Extract of TASK13 report and new work
“Review on Failures of Photovoltaic Modules” Primary authors: M. Köntges, S. Kurtz, C. Packard,
U. Jahn, K. A. Berger, K. Kato, Th. Friesen, Haitao Liu, M. Van Iseghem
1-3. April 2014, IEA TASK13 Meeting, Freiburg, Germany
IEA INTERNATIONAL ENERGY AGENCY
PHOTOVOLTAIC POWER SYSTEMS PROGRAMME
Outline
• Introduction for TG and EL, steady state and lock in techniques
• What physical quantity do we see ?
• Interpretation of the images EL/TG
• How much do the images allow to assess the reliability ?
IEA INTERNATIONAL ENERGY AGENCY
PHOTOVOLTAIC POWER SYSTEMS PROGRAMME
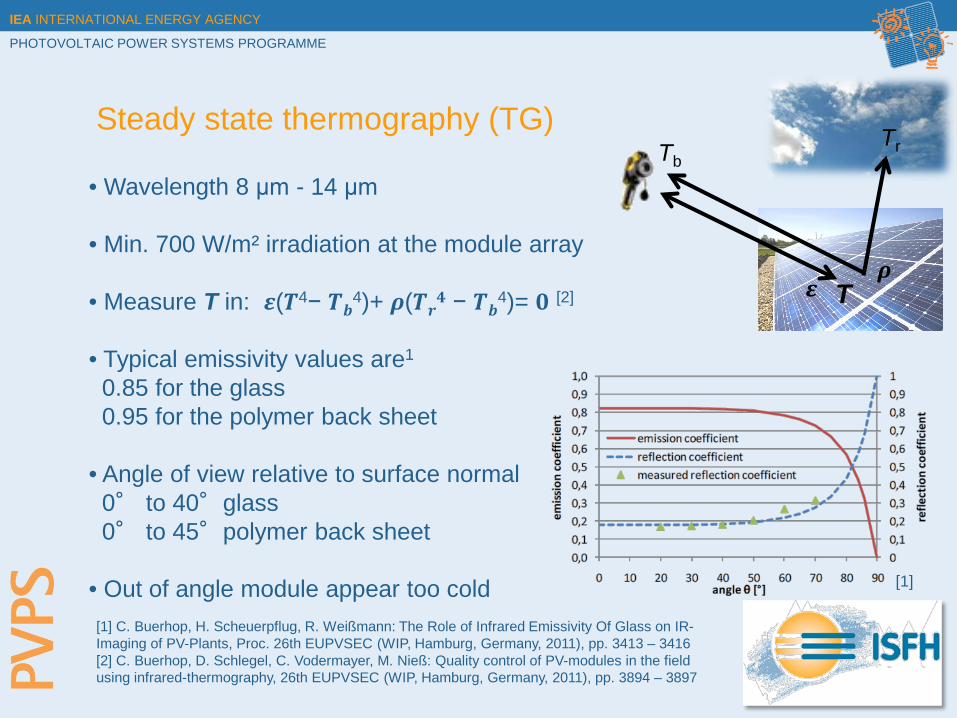
Steady state thermography (TG)
• Wavelength 8 μm - 14 μm
• Min. 700 W/m² irradiation at the module array
• Measure T in: 𝜺(𝑻4− 𝑻𝒃4)+ 𝝆(𝑻𝒓𝟒 − 𝑻𝒃4)= 𝟎 [2]
• Typical emissivity values are1 0.85 for the glass 0.95 for the polymer back sheet • Angle of view relative to surface normal 0° to 40°glass 0° to 45°polymer back sheet
• Out of angle module appear too cold [1] C. Buerhop, H. Scheuerpflug, R. Weißmann: The Role of Infrared Emissivity Of Glass on IR-Imaging of PV-Plants, Proc. 26th EUPVSEC (WIP, Hamburg, Germany, 2011), pp. 3413 – 3416 [2] C. Buerhop, D. Schlegel, C. Vodermayer, M. Nieß: Quality control of PV-modules in the field using infrared-thermography, 26th EUPVSEC (WIP, Hamburg, Germany, 2011), pp. 3894 – 3897
[1]
𝜺
Tb Tr
𝝆 T
IEA INTERNATIONAL ENERGY AGENCY
PHOTOVOLTAIC POWER SYSTEMS PROGRAMME
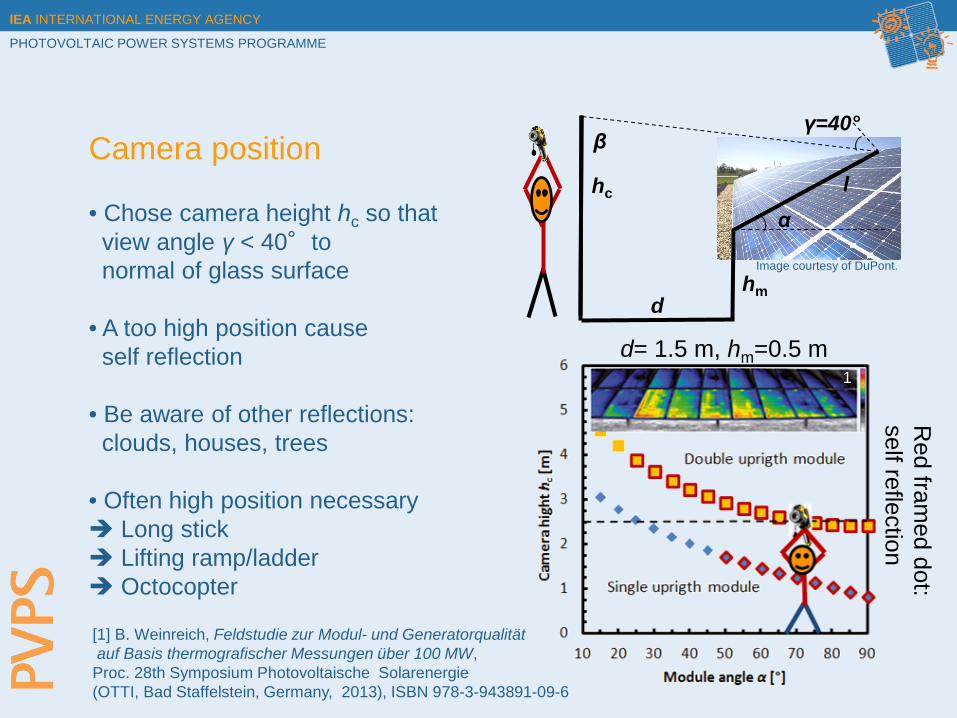
Camera position
• Chose camera height hc so that view angle γ < 40°to normal of glass surface
• A too high position cause self reflection
• Be aware of other reflections: clouds, houses, trees
• Often high position necessary Long stick Lifting ramp/ladder Octocopter
hc
d hm
α l
γ=40° β
d= 1.5 m, hm=0.5 m
Red fram
ed dot: self reflection
[1] B. Weinreich, Feldstudie zur Modul- und Generatorqualität auf Basis thermografischer Messungen über 100 MW, Proc. 28th Symposium Photovoltaische Solarenergie (OTTI, Bad Staffelstein, Germany, 2013), ISBN 978-3-943891-09-6
1
Image courtesy of DuPont.
IEA INTERNATIONAL ENERGY AGENCY
PHOTOVOLTAIC POWER SYSTEMS PROGRAMME
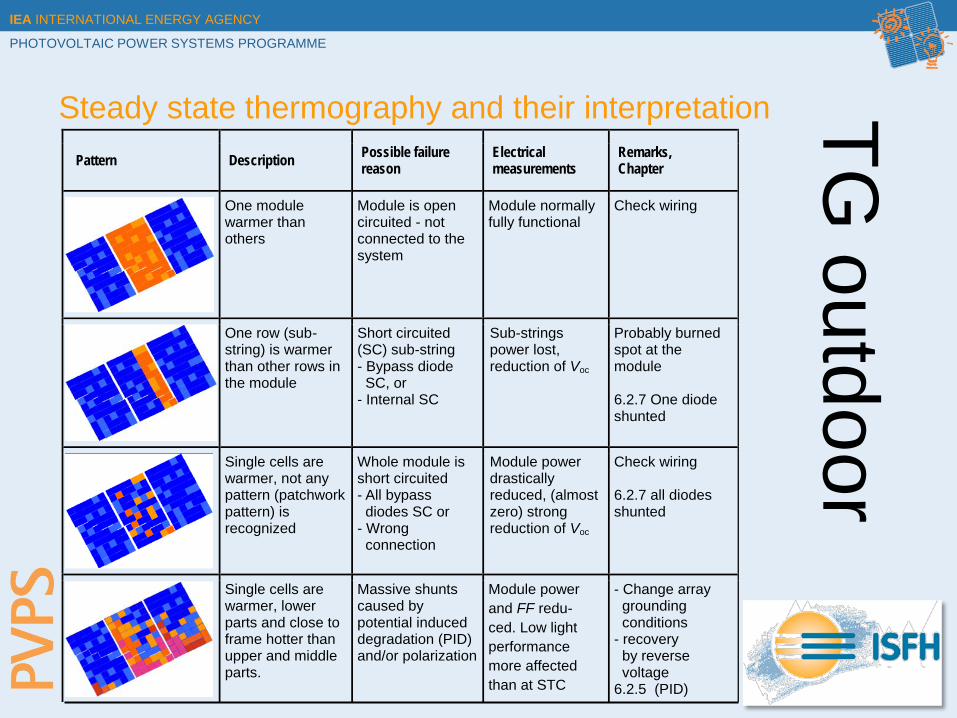
Steady state thermography and their interpretation Pattern Description Possible failure
reason Electrical measurements
Remarks, Chapter
One module warmer than others
Module is open circuited - not connected to the system
Module normally fully functional
Check wiring
One row (sub-string) is warmer than other rows in the module
Short circuited (SC) sub-string - Bypass diode SC, or - Internal SC
Sub-strings power lost, reduction of Voc
Probably burned spot at the module 6.2.7 One diode shunted
Single cells are warmer, not any pattern (patchwork pattern) is recognized
Whole module is short circuited - All bypass diodes SC or - Wrong connection
Module power drastically reduced, (almost zero) strong reduction of Voc
Check wiring 6.2.7 all diodes shunted
Single cells are warmer, lower parts and close to frame hotter than upper and middle parts.
Massive shunts caused by potential induced degradation (PID) and/or polarization
Module power and FF redu- ced. Low light performance more affected than at STC
- Change array grounding conditions - recovery by reverse voltage 6.2.5 (PID)
TG outdoor
IEA INTERNATIONAL ENERGY AGENCY
PHOTOVOLTAIC POWER SYSTEMS PROGRAMME
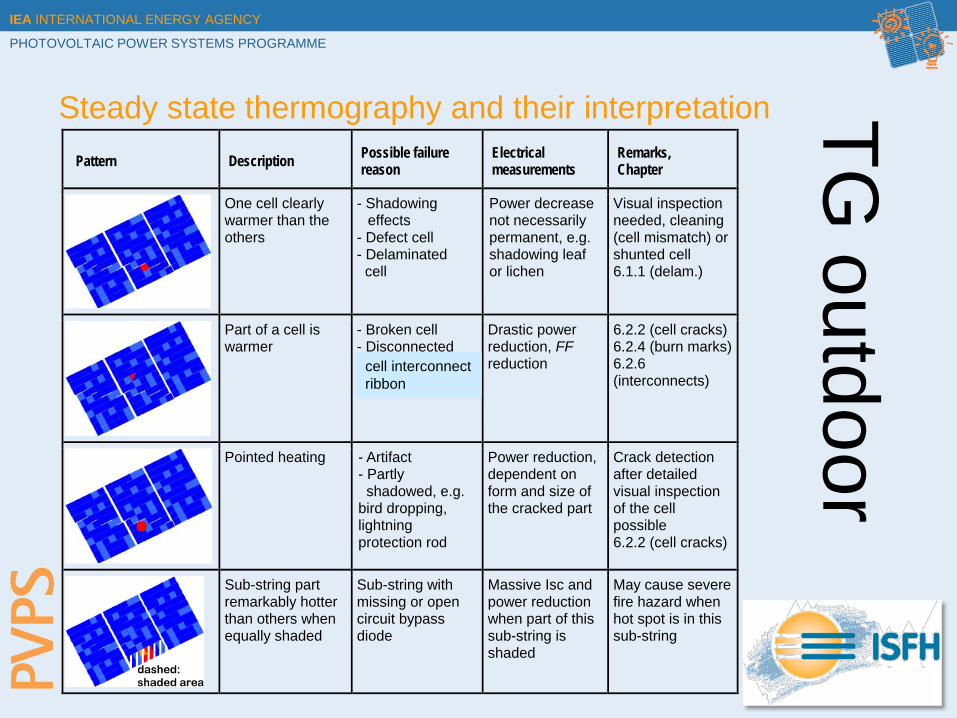
Steady state thermography and their interpretation Pattern Description Possible failure
reason Electrical measurements
Remarks, Chapter
One cell clearly warmer than the others
- Shadowing effects
- Defect cell - Delaminated cell
Power decrease not necessarily permanent, e.g. shadowing leaf or lichen
Visual inspection needed, cleaning (cell mismatch) or shunted cell 6.1.1 (delam.)
Part of a cell is warmer
- Broken cell - Disconnected string interconnect
Drastic power reduction, FF reduction
6.2.2 (cell cracks) 6.2.4 (burn marks) 6.2.6 (interconnects)
Pointed heating - Artifact - Partly shadowed, e.g. bird dropping, lightning protection rod
Power reduction, dependent on form and size of the cracked part
Crack detection after detailed visual inspection of the cell possible 6.2.2 (cell cracks)
Sub-string part remarkably hotter than others when equally shaded
Sub-string with missing or open circuit bypass diode
Massive Isc and power reduction when part of this sub-string is shaded
May cause severe fire hazard when hot spot is in this sub-string
TG outdoor
cell interconnect ribbon
IEA INTERNATIONAL ENERGY AGENCY
PHOTOVOLTAIC POWER SYSTEMS PROGRAMME
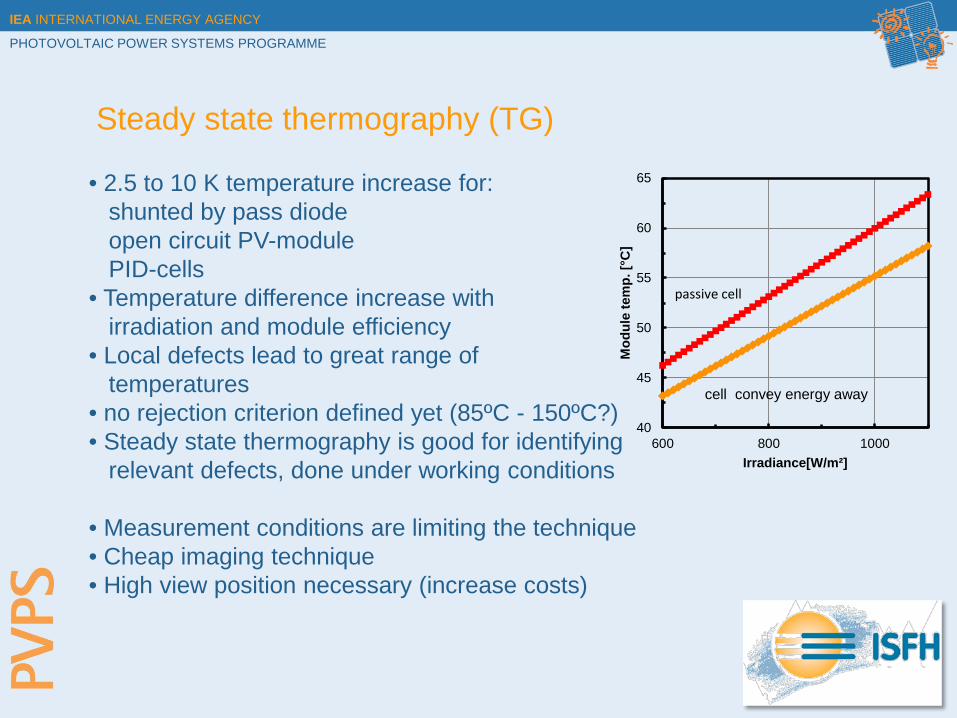
Steady state thermography (TG)
• 2.5 to 10 K temperature increase for: shunted by pass diode open circuit PV-module PID-cells • Temperature difference increase with irradiation and module efficiency • Local defects lead to great range of temperatures • no rejection criterion defined yet (85ºC - 150ºC?) • Steady state thermography is good for identifying relevant defects, done under working conditions
• Measurement conditions are limiting the technique • Cheap imaging technique • High view position necessary (increase costs)
40
45
50
55
60
65
600 800 1000
Mod
ule
tem
p. [°
C]
Irradiance[W/m²]
cell convey energy away
passive cell
IEA INTERNATIONAL ENERGY AGENCY
PHOTOVOLTAIC POWER SYSTEMS PROGRAMME
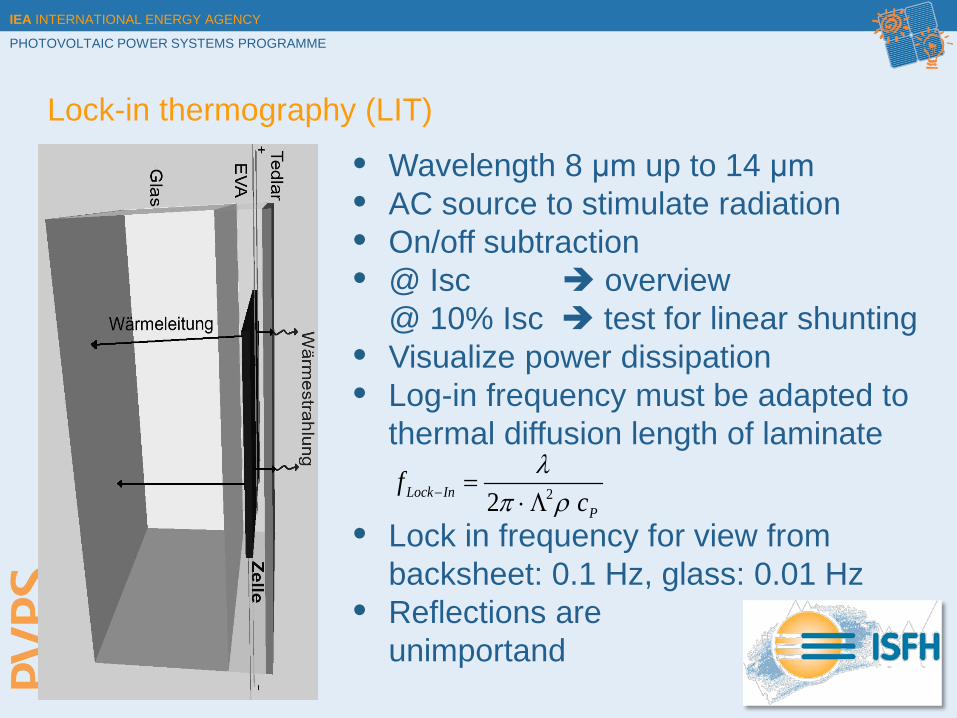
Lock-in thermography (LIT)
• Wavelength 8 μm up to 14 μm • AC source to stimulate radiation • On/off subtraction • @ Isc overview
@ 10% Isc test for linear shunting • Visualize power dissipation • Log-in frequency must be adapted to
thermal diffusion length of laminate
• Lock in frequency for view from
backsheet: 0.1 Hz, glass: 0.01 Hz • Reflections are
unimportand
PInLock c
fρπ
λ22 Λ⋅
=−
IEA INTERNATIONAL ENERGY AGENCY
PHOTOVOLTAIC POWER SYSTEMS PROGRAMME
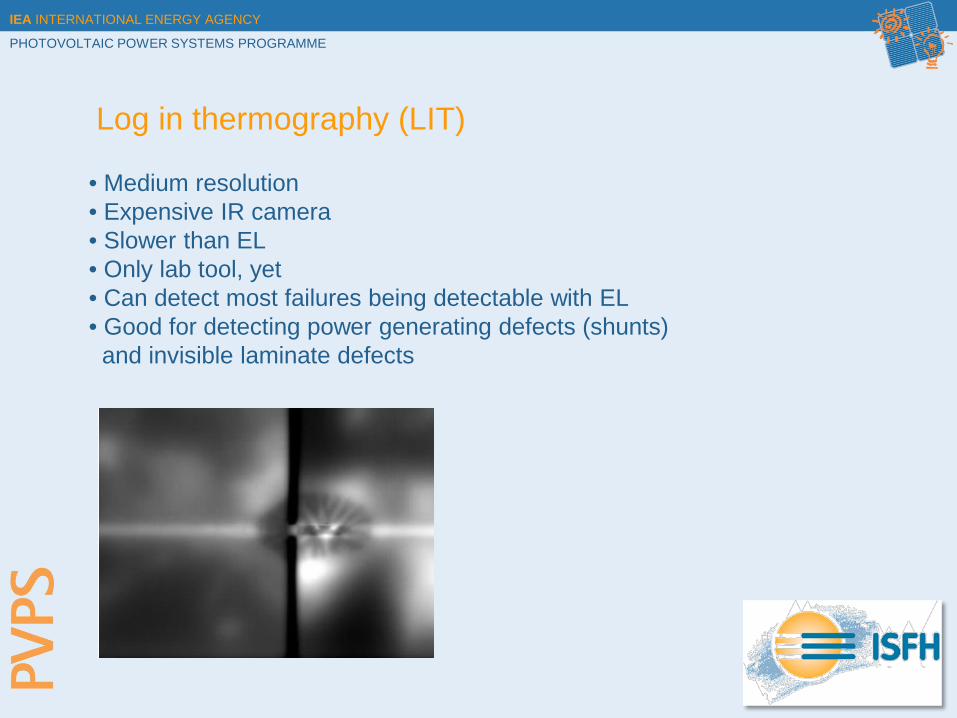
Log in thermography (LIT)
• Medium resolution • Expensive IR camera • Slower than EL • Only lab tool, yet • Can detect most failures being detectable with EL • Good for detecting power generating defects (shunts) and invisible laminate defects
IEA INTERNATIONAL ENERGY AGENCY
PHOTOVOLTAIC POWER SYSTEMS PROGRAMME
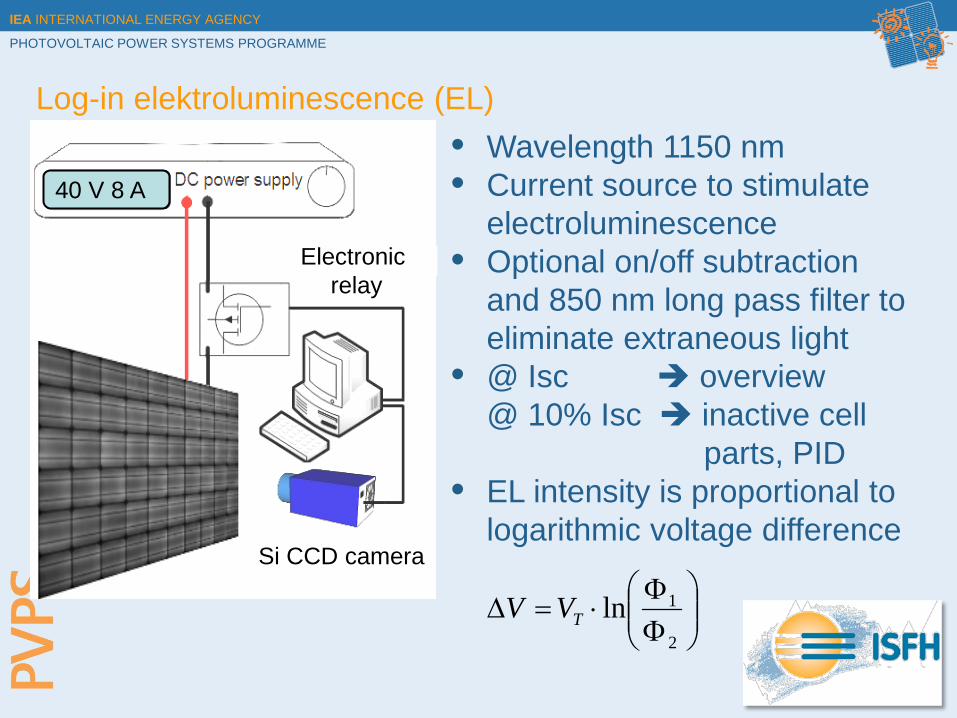
Log-in elektroluminescence (EL) • Wavelength 1150 nm • Current source to stimulate
electroluminescence • Optional on/off subtraction
and 850 nm long pass filter to eliminate extraneous light
• @ Isc overview @ 10% Isc inactive cell parts, PID
• EL intensity is proportional to logarithmic voltage difference
40 V 8 A
Si CCD camera
Electronic relay
ΦΦ
⋅=∆2
1lnTVV
IEA INTERNATIONAL ENERGY AGENCY
PHOTOVOLTAIC POWER SYSTEMS PROGRAMME
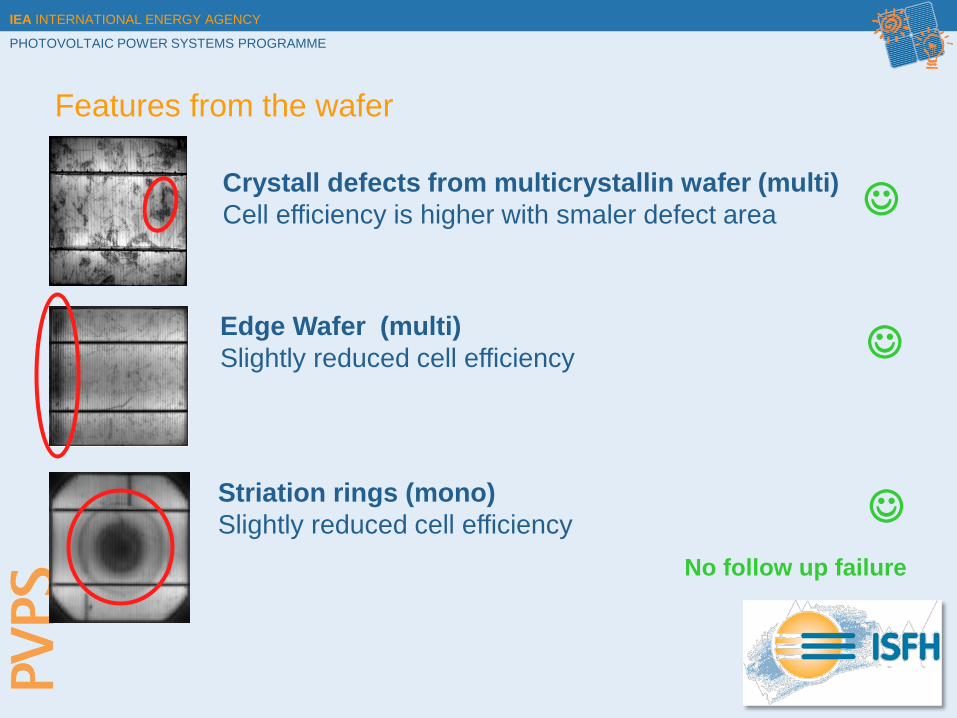
Features from the wafer
Crystall defects from multicrystallin wafer (multi) Cell efficiency is higher with smaler defect area
Edge Wafer (multi) Slightly reduced cell efficiency
Striation rings (mono) Slightly reduced cell efficiency
No follow up failure
IEA INTERNATIONAL ENERGY AGENCY
PHOTOVOLTAIC POWER SYSTEMS PROGRAMME
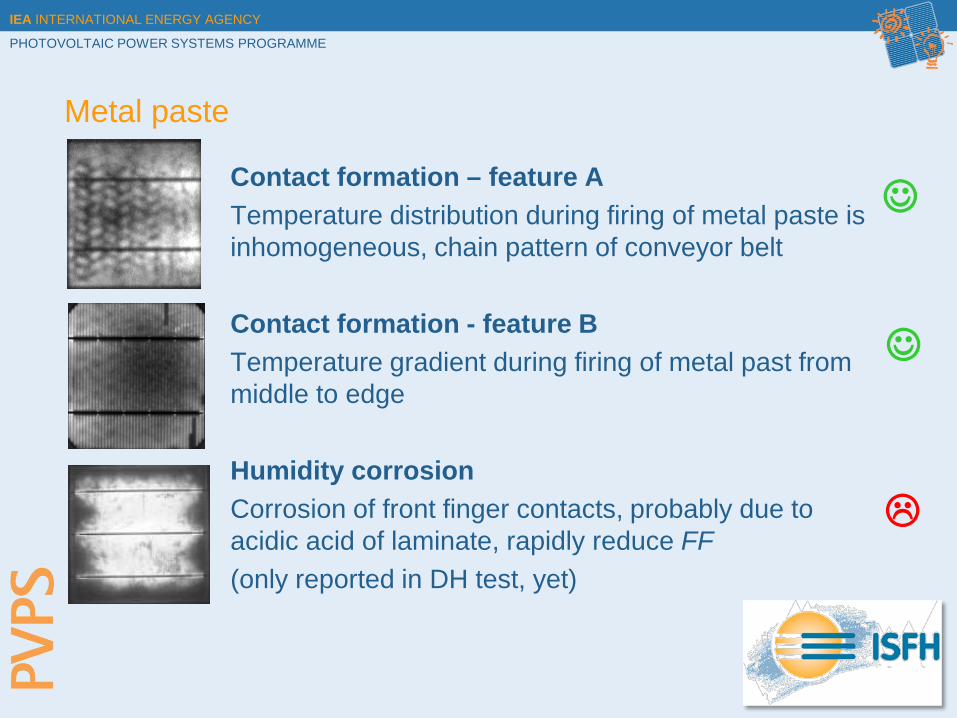
Metal paste
Contact formation – feature A Temperature distribution during firing of metal paste is inhomogeneous, chain pattern of conveyor belt Contact formation - feature B Temperature gradient during firing of metal past from middle to edge Humidity corrosion Corrosion of front finger contacts, probably due to acidic acid of laminate, rapidly reduce FF (only reported in DH test, yet)
IEA INTERNATIONAL ENERGY AGENCY
PHOTOVOLTAIC POWER SYSTEMS PROGRAMME
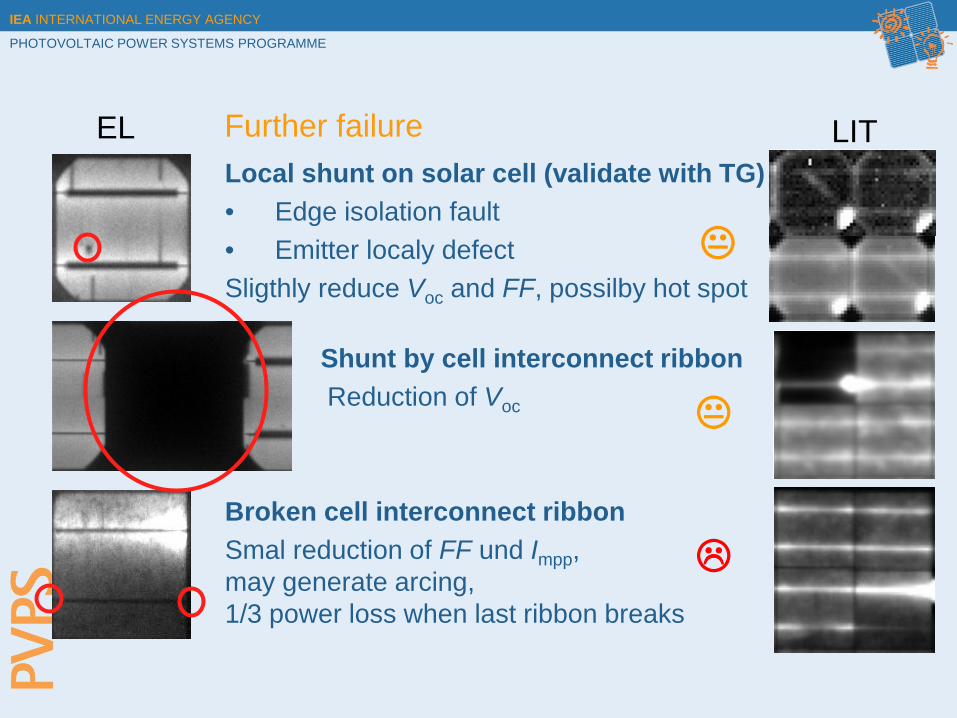
Further failure Local shunt on solar cell (validate with TG) • Edge isolation fault • Emitter localy defect Sligthly reduce Voc and FF, possilby hot spot
Shunt by cell interconnect ribbon Reduction of Voc
Broken cell interconnect ribbon Smal reduction of FF und Impp, may generate arcing, 1/3 power loss when last ribbon breaks
LIT EL
IEA INTERNATIONAL ENERGY AGENCY
PHOTOVOLTAIC POWER SYSTEMS PROGRAMME
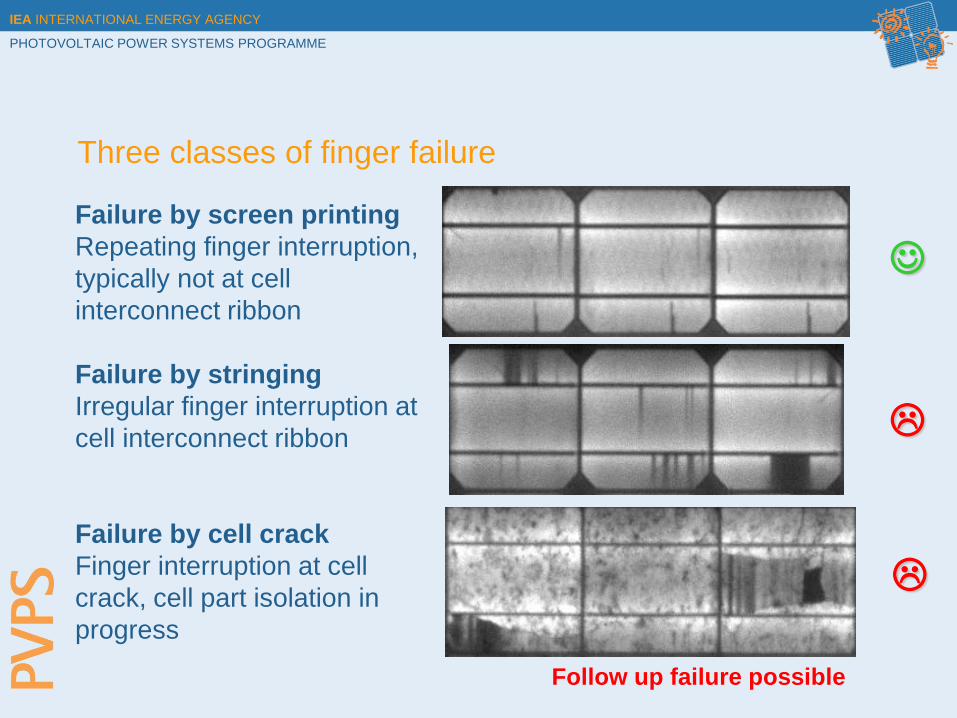
Three classes of finger failure
Failure by screen printing Repeating finger interruption, typically not at cell interconnect ribbon Failure by stringing Irregular finger interruption at cell interconnect ribbon Failure by cell crack Finger interruption at cell crack, cell part isolation in progress
Follow up failure possible
IEA INTERNATIONAL ENERGY AGENCY
PHOTOVOLTAIC POWER SYSTEMS PROGRAMME
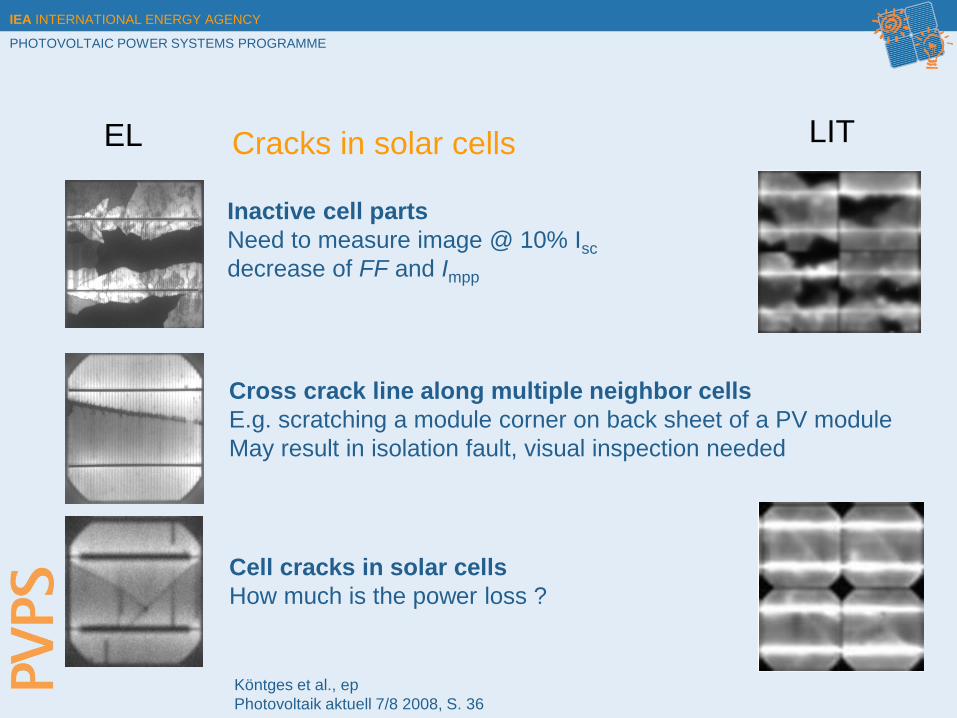
Cracks in solar cells
Cell cracks in solar cells How much is the power loss ?
Cross crack line along multiple neighbor cells E.g. scratching a module corner on back sheet of a PV module May result in isolation fault, visual inspection needed
Inactive cell parts Need to measure image @ 10% Isc decrease of FF and Impp
Köntges et al., ep Photovoltaik aktuell 7/8 2008, S. 36
EL LIT
IEA INTERNATIONAL ENERGY AGENCY
PHOTOVOLTAIC POWER SYSTEMS PROGRAMME
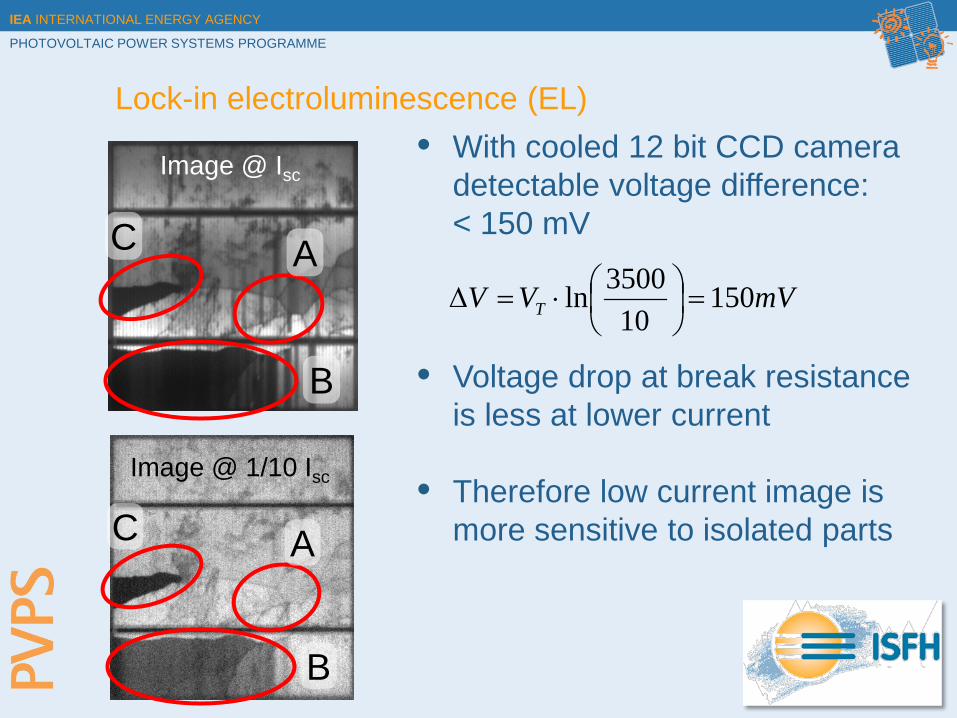
Lock-in electroluminescence (EL) • With cooled 12 bit CCD camera
detectable voltage difference: < 150 mV
• Voltage drop at break resistance is less at lower current
• Therefore low current image is more sensitive to isolated parts
Image @ Isc
A
B
C
A
B
C
Image @ 1/10 Isc
mVVV T 15010
3500ln =
⋅=∆
IEA INTERNATIONAL ENERGY AGENCY
PHOTOVOLTAIC POWER SYSTEMS PROGRAMME
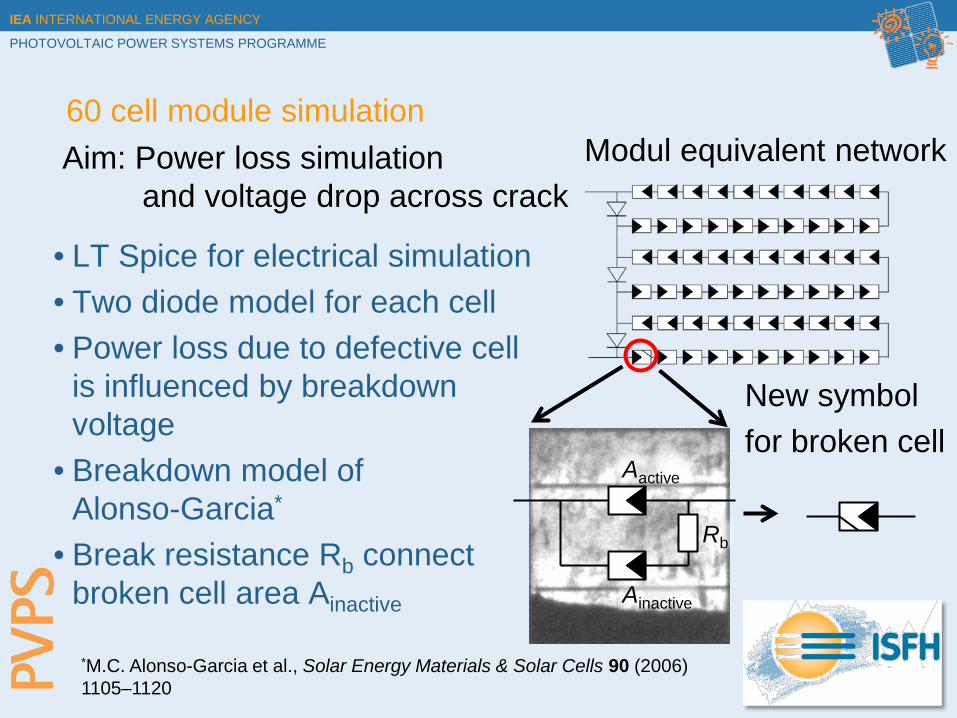
60 cell module simulation
*M.C. Alonso-Garcia et al., Solar Energy Materials & Solar Cells 90 (2006) 1105–1120
New symbol for broken cell
• LT Spice for electrical simulation • Two diode model for each cell • Power loss due to defective cell
is influenced by breakdown voltage
• Breakdown model of Alonso-Garcia*
• Break resistance Rb connect broken cell area Ainactive
Modul equivalent network
Rb
Aactive
Ainactive
Aim: Power loss simulation and voltage drop across crack
IEA INTERNATIONAL ENERGY AGENCY
PHOTOVOLTAIC POWER SYSTEMS PROGRAMME
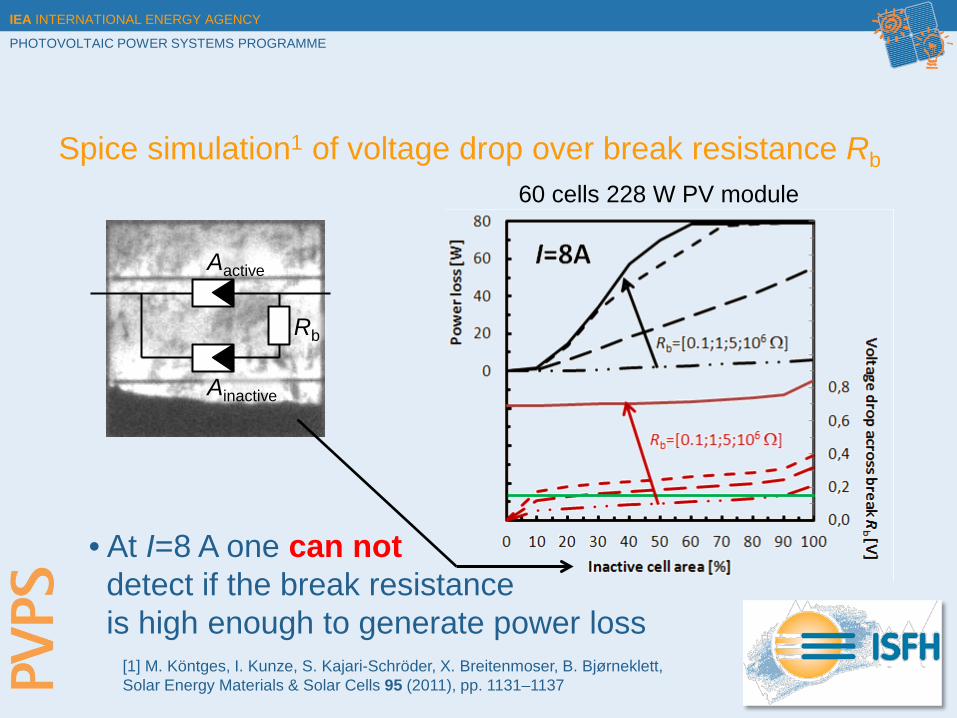
Spice simulation1 of voltage drop over break resistance Rb
Rb
Aactive
Ainactive
[1] M. Köntges, I. Kunze, S. Kajari-Schröder, X. Breitenmoser, B. Bjørneklett, Solar Energy Materials & Solar Cells 95 (2011), pp. 1131–1137
60 cells 228 W PV module
• At I=8 A one can not detect if the break resistance is high enough to generate power loss

IEA INTERNATIONAL ENERGY AGENCY
PHOTOVOLTAIC POWER SYSTEMS PROGRAMME
Spice simulation1 of voltage drop over break resistance Rb
Rb
Aactive
Ainactive
[1] M. Köntges, I. Kunze, S. Kajari-Schröder, X. Breitenmoser, B. Bjørneklett, Solar Energy Materials & Solar Cells 95 (2011), pp. 1131–1137
60 cells 228 W PV module
• At I=0.8 A one can detect if the break resistance is high enough to generate power loss
C Typ B A
IEA INTERNATIONAL ENERGY AGENCY
PHOTOVOLTAIC POWER SYSTEMS PROGRAMME
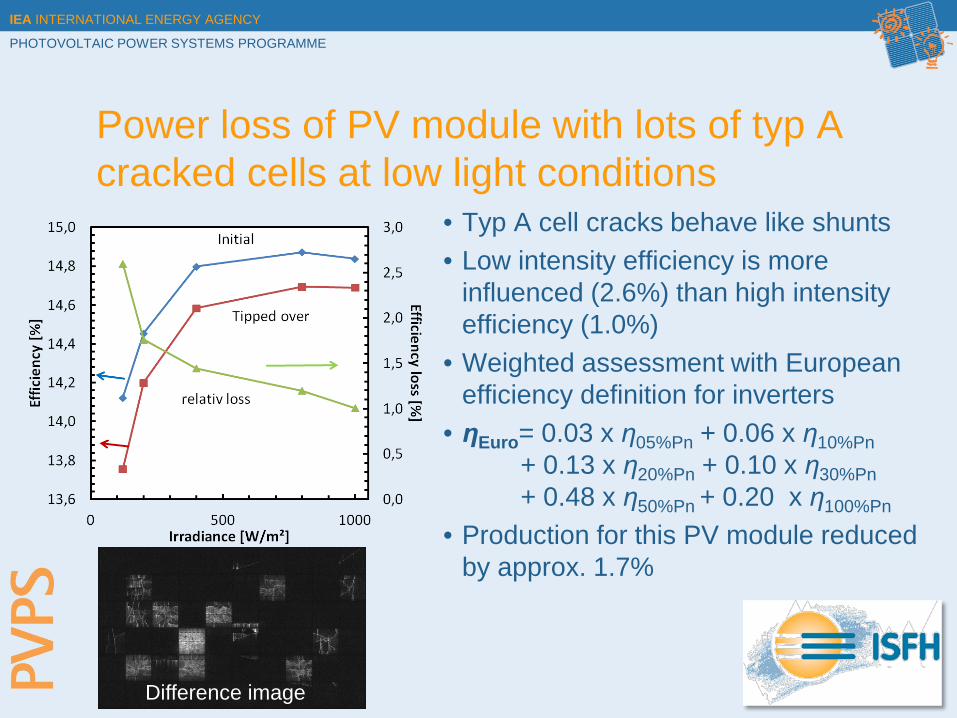
• Typ A cell cracks behave like shunts • Low intensity efficiency is more
influenced (2.6%) than high intensity efficiency (1.0%)
• Weighted assessment with European efficiency definition for inverters
• ηEuro= 0.03 x η05%Pn + 0.06 x η10%Pn + 0.13 x η20%Pn + 0.10 x η30%Pn + 0.48 x η50%Pn + 0.20 x η100%Pn
• Production for this PV module reduced by approx. 1.7%
Power loss of PV module with lots of typ A cracked cells at low light conditions
Difference image
IEA INTERNATIONAL ENERGY AGENCY
PHOTOVOLTAIC POWER SYSTEMS PROGRAMME
Electroluminescence (EL)
• High resolution • Cost efficient Si CCD camera for dark environment • Very expensive camera for daylight imaging • Fast image recoding • Often difficult to differentiate between feature and failure • Automation of failure detection only for production possible • “Failure cells” are detectable by deviation from mean intensity, but a human has to classify further
• For much more detectable failure and more explanations read TASK13 report
IEA INTERNATIONAL ENERGY AGENCY
PHOTOVOLTAIC POWER SYSTEMS PROGRAMME
Thanks for financial support: State of Lower Saxony and BMUB under contract number FKZ 0325194C.
Summary: • Steady state TG is a cheap technique for failure detection in
the field, but is strongly restricted by weather conditions • LIT shows similar defects like EL, but is more expensive and has lower
resolution. Strong in stunt detection and hidden laminate bubbles • EL can detect most defects, often difficult to differentiate between
failures and effects, inexpensive technique • EL for outdoor same advantages like indoor, but quite expensive technique
• TASK13 report “Review on Failures of Photovoltaic Modules”
is available today