Pv market business and price developments in italy
25
PV market, business and price developments in Italy Matteo Giannì
-
Upload
gestore-dei-servizi-energetici -
Category
Environment
-
view
106 -
download
1
Transcript of Pv market business and price developments in italy

PV market, business and price developments in Italy
Matteo Giannì

Outlook
PV role in electricity generation in Italy
Anatomy of PV deployment
New PV trends
distribution costs
impacts
incentives
optimize existing plants new plants

GSE
INCENTIVES AND PROMOTION OF
ELECTRICITY FROM RENEWABLE SOURCES
Qualifying RES plants Granting incentives, purchase & resale energy, certification On site verification of plants Satellite-assisted metering (forecast of energy production)
ENERGY EFFICIENCY, RENEWABLE ENERGY FOR HEATING & COOLING AND
TRASPORT
White Certificates High-efficiency CHP Heating & Cooling support scheme Biofuel On site verification of plants
INSTITUTIONAL ACTIVITIES AND OTHER TECHNICAL
ENERGY SERVICES
Monitor European targets on renewables Studies and Statistics Support to the Public Administration ETS auctions to sale the Italian CO2 allowances Promotion and communication
GSE is a state owned company having as mission “…to foster sustainable development by providing support for renewable energy and energy efficiency… “

Renewable electricity generation in Italy
RES gross electricity production (TWh)
20
00
20
01
20
02
20
03
20
04
20
05
20
06
20
07
20
08
20
09
20
10
20
11
20
12
20
13
20
14
20
15
20
16
0
10
20
30
40
50
60
51 54
48 47 54
48 51 48
58
69 77
83
92
112
121
109 108
20
00
20
01
20
02
20
03
20
04
20
05
20
06
20
07
20
08
20
09
20
10
20
11
20
12
20
13
20
14
20
15
20
16
TWh
Renewable generation almost doubled in the last decade Renewables covered 37% of national generation in 2016 Hydro generation stil l plays the main role, but other RES showed great increase

0,33%
99,67%
PV generation
Other RESgeneration (Hydro,wind, bioenergy andgeothermal)
PV production in the generation mix
In 2016 electricity generation by PV plants was 22,1 TWh, lower than the previous year (-3,6%), mainly because of the radiation decrease (-3,9%)
Preliminary elaboration of 2017 data (Gen-Aug) indicate conversely a significant increase with respect to 2016 (7-8%)
PV share in renewable generation: 2008 vs 2016
PV generation in Italy (GWh)
2008
In 2008 PV generation was about 0,3% of total renewable generation in Italy. In 2016 this share became 20,5%
2011 2012 2013 2014 2015 2016
Full load hours 1.326 1.313 1.241 1.211 1.225 1.158
677 1.906
10.796
18.862
21.589 22.306 22.942 22.104
2009 2010 2011 2012 2013 2014 2015 2016
20,5%
79,5%
2016

PV share in electricity demand
In 2016 generation from PV plants covered 20% of RES generation , the 7,6% of gross generation , the 7% of electricity demand .
PV share in electricity generation and consumption
2010 2011 2012 2013 2014 2015 2016
Gross electricity generation (TWh) 302 303 299 290 280 283 290
Natural gas 51% 48% 43% 38% 33% 39% 44%
RES 25% 27% 31% 39% 43% 38% 37%
Hydro 17% 15% 14% 18% 21% 16% 15%
PV 1% 4% 6% 7% 8% 8% 8%
Bioenergy 3% 4% 4% 6% 7% 7% 7%
Wind 3% 3% 4% 5% 5% 5% 6%
Geothermal 2% 2% 2% 2% 2% 2% 2%
Gross final consumption (TWh) 343 346 340 330 322 328 325
PV 1% 3% 6% 7% 7% 7% 7%
Demand (TWh) 330 335 328 319 311 317 314
PV 1% 3% 6% 7% 7% 7% 7%

Outlook
PV role in electricity generation in Italy
Anatomy of PV deployment
New PV trends
distribution costs
optimize existing plants new plants
impacts
incentives

2%
98%
PV generation
Other RESgeneration (Hydro,wind, bioenergy andgeothermal)
Historical PV development in Italy
In the past years, the number and capacity of PV plants grew at a very sustained pace.
More than 550.000 plants for 17,7 GW were realized under the Energy Accounts support schemes
By the end of 2016 more than 730,000 PV plants were installed, for a total power of 19.3 GW
PV share in renewable capacity: 2008 vs 2016
Number and capacity of PV plants
In 2008 PV capacity was about 2% of the total renewable capacity installed in Italy. In 2016 this share became 37%
431 1.144
3.470
12.773
16.690 18.185 18.594 18.901 19.283
32.018 71.288
155.977
330.196
481.267
596.355 648.196 687.759
732.053
050.000100.000150.000200.000250.000300.000350.000400.000450.000500.000550.000600.000650.000700.000750.000800.000
0
1.500
3.000
4.500
6.000
7.500
9.000
10.500
12.000
13.500
15.000
16.500
18.000
19.500
2008 2009 2010 2011 2012 2013 2014 2015 2016
Installed capacity (MW)
Number
37%
63%
2008 2016
End of Energy Account

PV regional distribution in Italy in 2016
Although the difference in solar radiation (≈+20% in South than North), the PV plants are spread all over the country North: 54% of installations, 44% of capacity; average size 21 kW Centre: 18% of installations, 18% of capacity; average size 27 kW South: 28% of installations, 38% of capacity; average size 35 kW
PV plants regional distribution PV capacity regional distribution
Total number: 732.053
Total capacity: 19,2 GW

Breakdown of PV installations by capacity and by sectors
91% PV plants have size below 20 kW, with average capacity of 6 KW (668.600 plants, 3,7 GW, 20% of overall capacity)
60% PV capacity refers to plants with size above 200 kW (11.780 plants, 11,4 GW, 1,6% of total number)
79% PV plants are residential, mainly small size (about 5 kW)
52% of PV capacity refers to the industry sector, including utility-scale plants (average size 230 kW)
79%
14% 12%
24%
6%
51%
3% 11%
Number Capacity
Residential Services
Industry Agricolture
Size (kW)
1<=C<=3 245.293 671
3<C<=20 423.307 3.107
20<C<=200 51.673 4.032
200<C<=1.000 10.638 7.297
1.000<C<=5.000 958 2.343
C>5.000 184 1.834
Total 732.053 19.283
n° MW
2016 PV by size
PV by sector

21.757
11.887
4.185
Net generation, total PV(GWh)
Net generation, PV with selfconsumption (GWh)
Self-consumption (GWh)
PV self-consumptions
PV self-consumption amounts to 4,3 TWh in 2016 , 35% of net generation produced by PV plants with self-consumption, which is in turn almost half of total net generation
Almost all domestic plants have a self-consumption quota (30% on average). These plants are usually small in size (C<=20 kW) under net bil l ing scheme, which can limit self-consumption by mitigating the cost of grid exchange
Industry sector includes power companies (that generate electricity only to fed to the grid)
PV generation and self-consumption
35%
19%
0
350
Jan Feb Mar Apr May Jun Jul Aug Sep Oct Nov Dec
Residential
0
100
Jan Feb Mar Apr May Jun Jul Aug Sep Oct Nov Dec
Agricolture
0
400
Jan Feb Mar Apr May Jun Jul Aug Sep Oct Nov Dec
Serv ices
0
400
Jan Feb Mar Apr May Jun Jul Aug Sep Oct Nov Dec
Industry
PV production and self consumption profile by sector
N: 8.758 (tot 18.480) MW: 329 (tot 2.060)
N: 47.263 (tot 90.756) MW: 1.176 (tot 4.540)
N: 443.566 (tot 580.382) MW: 2.049 (tot 2.793)
N: 17.018 (tot 43.008) MW: 858 (tot 9.890)
Generation Self consumption Consumption
30% 41%
57% 49%

Market trends: system costs
In 2016 residential and commercial system prices are about 45% of 2011 prices
In 2016 ground mounted system prices are about 30% of 2011 prices
Evolution of PV system cost [€/W] 3,6
2,6
2,2
1,67 1,6 1,55
2,7 1,8
1,4
1,4 1,32 1,22
2,8
1,7
1,2 1,03 0,96 0,88
2011 2012 2013 2014 2015 2016
RESIDENTIAL PV SYSTEMS < 10 KW
COMMERCIAL AND INDUSTRIAL
GROUND-MOUNTED
GSE has performed an extensive monitoring of system costs: collecting data from plants accessing Energy Accounts until 2013 (510.000+ plants, 15,9 GW) dedicated surveys from 2013
66%
34%
72%
28%
Residential
Ground-mounted

630
450
60
120
250
40
20
160
30
880
0 200 400 600 800 1.000
Total hardware
Modules
Inverter
Other hardware
Total soft costs
Installation
Customer Acquisition
Profit
Other soft costs
Total Installed Cost
1.020
600
150
270
530
90
30
300
110
1.550
0 500 1.000 1.500
Total hardware
Modules
Inverter
Other hardware
Total soft costs
Installation
Customer Acquisition
Profit
Other soft costs
Total Installed Cost
Market trends
In the case of a residential PV system, the cost of modules cover the 39% of the total installed cost. Hardware cost and soft cost amount to 66% and 34% of the total installed cost, respectively,
Cost breakdown for a residential PV systems in 2016 [€/kW]
Cost breakdown for a Utility-scale PV systems > 5 MW in 2016 [€/kW]
In the case of utility-scale PV system , the cost of mudules cover the 51% of the total installed cost. Hardware cost and soft cost amount to 72% and 28% of the total installed cost, respectively,

Market trends: modules
In 2016 PV modules price is about 20% of 2009 price. In the last 4 years prices continued to decrease but at a slower rate compared to the past.
Evolution of prices of PV modules [€/W]
2,3
1,5
1,2
0,7
0,5 0,5 0,5 0,4
2,8
1,9
1,7
0,9 0,8 0,75
0,65
2,5
1,7 1,5
0,8 0,6 0,55 0,55 0,48
2009 2010 2011 2012 2013 2014 2015 2016
HIGHEST PRICES LOWEST PRICES AVERAGE PRICE

Cost of incentives: PV and other sources
Self consumption quota by sector
6,7
2,4 1,9 1,9
1,1 0,9 0,6 0,3 0,2
Solar PV Wind Hydroelectric Biogas Biomass andWaste
Bioliquids Other sources Districtheating
Geothermal
Net Billing
MD 7/6/2012 & 6/23/2016
Simpl. Purchase
CIP6
GC Withdrawal
FiT
FIP (former GC)
E.A. PV
Incentive cost in 2016 (bn €)
• Total cost: 15,9 € bn
• Revenue: 1,5 € bn
• Burden on consumers: 14,4 € bn
In 2016 the total expenditure of GSE for support and purchase of electricity was 15,9 billion euros. The largest contribution is
related to PV plants, with a cost of 6,7 € bn, mainly related to the Energy Account (6,0 € bn)
Part of the cost is restored by the revenues arising from the electricity sale (1,5 € bn), thus determining a burden on electricity bills
of 14,4 bn €
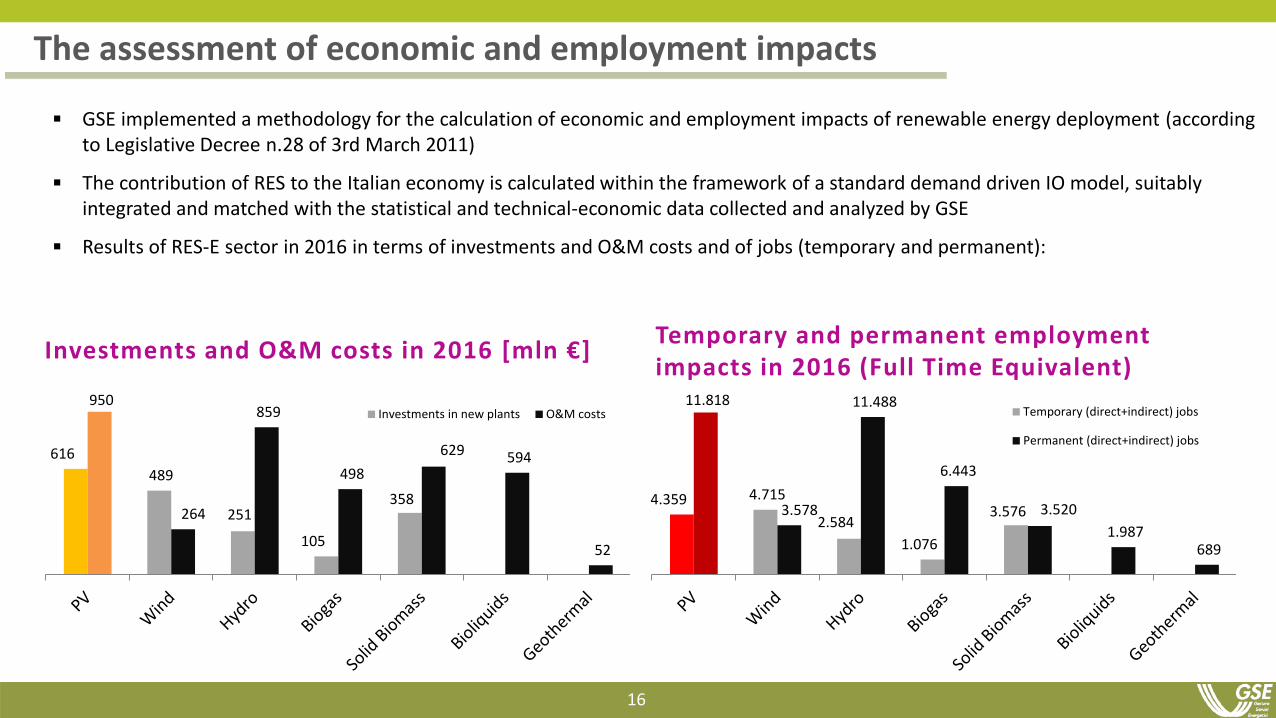
GSE implemented a methodology for the calculation of economic and employment impacts of renewable energy deployment (according to Legislative Decree n.28 of 3rd March 2011)
The contribution of RES to the Italian economy is calculated within the framework of a standard demand driven IO model, suitably integrated and matched with the statistical and technical-economic data collected and analyzed by GSE
Results of RES-E sector in 2016 in terms of investments and O&M costs and of jobs (temporary and permanent):
The assessment of economic and employment impacts
16
Investments and O&M costs in 2016 [mln €] Temporary and permanent employment impacts in 2016 (Full Time Equivalent)
4.359 4.715
2.584
1.076
3.576
11.818
3.578
11.488
6.443
3.520
1.987 689
Temporary (direct+indirect) jobs
Permanent (direct+indirect) jobs 616
489
251
105
358
950
264
859
498
629 594
52
Investments in new plants O&M costs

GHG saving by PV
• Each MWh produced by PV avoids 532 kg CO2 related to the marginal fossil fuel (mainly constituted by CCGT) • In 2015 12 MtCO2 are avoided by PV production corresponding to the 22% of the GHG saving by RES
Substituted fossil fuel mix by PV Avoided GHG emissions by RES-E [MtCO2]
15%
70%
14% 1%
COAL
CCGT
OIL
TG
GHG saving emission factor [kgCO2eq/MWh]
502 528 493 493 485
536 532
Hydro Geothermal Biogas Bioliquid Biomass Wind PV
0,9 4,7
9,0 10,2 11,9 12,2
31,9
36,3
44,2 47,9
55,1 56,2
2010 2011 2012 2013 2014 2015
PV Other RES

Outlook
PV role in electricity generation in Italy
Anatomy of PV deployment
New PV trends
distribution costs
optimize existing plants new plants
impacts
incentives

Optimizing existing PV plants: regulation and monitoring
PV maintenance interventions breakdown
In February 2017, GSE published the procedures for maintenance and upgrading of PV plants supported by Energy Account in order to: Preserve and optimize PV generation performance to achieve renewable targets Simplify administrative practices for operators dealing with the Energy Account constraints Disseminate good practices
In 2016, 90% of PV maintenance interventions concern PV component replacement (inverter, module, electrical equipment)
GSE is investigating the potential of behavioral economics for the increase of PV production performance
3%
2% 5%
37%
15%
32%
6%
90%
PLANT MOVING
CONNECTION MODIFICATION
OTHER INTERVENTIONS (LAYOUT ETC)
INVERTER REPLACEMENT
PV MODULE REPLACEMENT
ENERGY METER REPLACEMENT
OTHER REPLACEMENT (ELECTRICAL EQUIPMENT ETC.)
PV glass breaking
PID effect
Plant moving 7.925 intervention in 2016

Energy Storage Systems and PV
storage systems by PV size in 2016 Installed storage systems by technology
391 Storage
31%
1 kW < P < 3 kW
68%
3 kW < P < 20 kW
1%
20 kW < P < 200 kW
By the end of 2016, 503 (391 in 2016) communications of installation of Energy Storage Systems were received by GSE
Most installations concern small size plants (< 20 kW), with the aim of increasing self consumption
Lithium-ion technology is prevailing
111
391
2015 2016
Other
Lithium ion
Lead/Acid

Recent trend of PV installations
New PV capacity 2014-2016
1<=C<=3
3<C<=20
20<C<=200
200<C<=1.000
1.000<C<=5.000
C>5.000
2016 new plants by size
In the past 3 years more than 300 MW per year were installed without direct incentives
Most plants have small size , and benefit from “Net bill ing” scheme and tax credit

PV role in 2030 energy scenario
Evolution of PV capacity (GW) and future trends
Italy is defining 2030 renewable energy targets in the National Energy Strategy (NES)
The current NES version defines an increase of RES share up to 48%-50% in electricity sector consumptions
PV capacity is expected almost to triple by 2030. That would also require large PV plants, and new business models
RES share in electricity sector
33,5%48% - 50%
26%
18
17
50
1 3
0
10
20
30
40
50
60
70
20
00
20
02
20
04
20
06
20
08
20
10
20
12
20
14
20
16
20
18
20
20
20
22
20
24
20
26
20
28
2030…
GW
NES target Target NREAP
2015 2020 2030
Hydro
Wind
PV
Geothermal
Bioenergies
proposed
NES 2030
targets

Economics of future plants: market value of PV energy
Hourly profile
0%
2%
4%
6%
8%
10%
12%
14%
-
10
20
30
40
50
60
70
gen
feb
mar
apr
mag giu
lug
ago
set
ott
no
v
dic
production [%]
price [€/MWh]
Average monthly price
PV production
0%
3%
6%
9%
12%
15%
18%
-
10
20
30
40
50
60
0 2 4 6 8 10 12 14 16 18 20 22
production [%]
price [€/MWh]
Average hourly price
PV production
The new era of large PV plants will require new business model (PPA, auctions etc.)
The income will have to rely on the sale of PV energy. What is the current value of PV energy in the market?
GSE carried out an analysis of PV energy market price in 2016, which depends on the profiles of PV production and energy price
Monthly profile
PV daily production bell does not
match with the price peaks The seasonal PV profile is not in phase
with price profile
38,9 €/MWh
42,8 €/MWh
Average PV price Average national price
In 2016 the average PV price was about 39 €/MWh,
4 €/MWh less than average price (43 €/MWh)
Market price

2017 latest news and key points for future PV trends
In 2017 more than 60 MW have already been realized in “market parity”
Technology: ground mounted, with tracking system (mono-axial)
Industrial approach to squeeze system and O&M costs
Medium term PPA
Latest news
Key points
Address authorization length (30 years?)
In the short-term, public auctions may be implemented, with a “two-way” approach to stabilize investor income
After 2020, long term PPAs should be set, defining new standards

contacts
Thank you for your attention
matte o . g iann i@g se . i t stud i@g s e . i t