Putting the “S” in ESG: Measuring Human Rights Performance ... · Putting the “S” in ESG:...
57
Putting the “S” in ESG: Measuring Human Rights Performance for Investors CASEY O’CONNOR AND SARAH LABOWITZ MARCH 2017
-
Upload
phunghuong -
Category
Documents
-
view
221 -
download
1
Transcript of Putting the “S” in ESG: Measuring Human Rights Performance ... · Putting the “S” in ESG:...
Putting the “S” in ESG:
Measuring Human Rights Performance for Investors
C A S E Y O’C O N N O R A N D S A R A H L A B O W I T Z
M A RC H 2 0 1 7
About the Center
Launched in March 2013, the NYU Stern Center for Business and Human Rights is the first human rights center based at a business school. Led by Michael Posner and Sarah Labowitz, the Center offers dedicated courses on business and human rights to MBA and undergraduate business students. In different business sectors, it under-takes projects that combine original research, convening stakeholders, and public advocacy. The Center is an independent academic endeavor of NYU Stern. It receives funding from NYU Stern, philanthropic foundations, individuals, and companies.
More information at http://bhr.stern.nyu.edu.
Cover design and report visualizations by Hovsep AgopReport design by Paloma Avila
NYU Stern Center for Business and Human RightsLeonard N. Stern School of Business44 West 4th Street, Suite 800New York, NY 10012
© 2017 NYU Stern Center for Business and Human Rights
All rights reserved. This work is licensed under the Creative Commons Attribution-NonCommercial 4.0 International License. To view a copy of the license, visit http://creativecommons.org/licenses/by-nc/4.0/.
Investors have a special role in shaping and influencing company actions relating to human rights. Since its founding in 2013, the NYU Stern Center for Business and Human Rights has devoted significant attention to this issue, promoting long-term investing, advocating with public pension funds and university endowments to pay greater attention to human rights, and partnering with Robert F. Kennedy Human Rights to develop human rights programming for some of the largest investors in the world.
In April 2016, the Center and Robert F. Kennedy Human Rights co-sponsored a two-day workshop entitled Measuring Human Rights Performance: Metrics that Drive Change. It brought together people from different business sectors with representatives from civil society, ratings agencies, and academia to explore the current gaps in evaluating the human rights performance of large multinational companies. This paper draws inspiration from the ideas generated at that meeting, but is not a record of the workshop.
Investors increasingly recognize that the lack of reliable, accessible information about the human rights track records of individual companies hinders their ability to manage medium- to long-term risks and advance social objectives in an investment context. While much of this report focuses on the shortcomings of current efforts, we recognize the significant conceptual and operational hurdles and costs that make the assessment of human rights performance such a daunting task.
This paper is based on analysis of 12 existing frameworks for assessing “S” – the social component of “environmental, social, and governance” (ESG) investing approaches. The efforts of those behind these frameworks have been a pioneering first step in pushing investors to develop metrics and tools that help improve the human rights performance of companies. We remain committed to collaborating with the dynamic field of ESG professionals to make practical progress in enhancing “S” measurement in the years ahead.
David Wang, Andrew Duncan, APG, Robert F. Kennedy Human Rights, and the NYU Green Grants program generously supported the April 2016 workshop andsubsequent preparation of this white paper. Dorothée Baumann-Pauly, the Center’s research director, provided expert guidance on indicator coding and analysis.Gabriel Ng, Nicole Kenney, Nate Stein, Ijeamaka Obasi, Tara Wadhwa, and April Gu did the painstaking work of indicator coding. The paper benefited from thoughtfulsuggestions offered by Will Millberg, Amol Mehra, Debora Spar, Kilian Moote, Josh Zoffer, Auret van Heerden, and Justine Nolan. Mike Posner’s sharp editorial eye helped bring the project to completion, and Kerry Kennedy was a guiding light throughout. Luke Taylor copy edited the report and Samantha Kupferman and Na-talie Butz of West End Strategy Team provided communications guidance.
Foreword
Executive Summary
Part 1: Growth of the ESG Industry
1.1 Sustainable Investing Goes Mainstream
1.2 The Role for “Social” in Investing
Part 2: Typology of Social Measurement
2.1 Company-focused Frameworks
2.2 Investor-focused Frameworks
2.3 Human Rights-focused Frameworks
Part 3: The Current State of “S” in ESG
3.1 Analysis Overview
3.2 Findings
3.3 Conclusions
Part 4: The Way Forward
4.1 Principles for Measuring “S”
4.2 Recommendations to Key Stakeholders
Appendix 1. — A History of Social Measurement
Appendix 2. — Methodology
Appendix 3. — Indicator Types – Definitions, Trends, and Examples
1
5
5
8
11
11
12
14
16
16
17
25
27
27
29
31
35
45
Contents
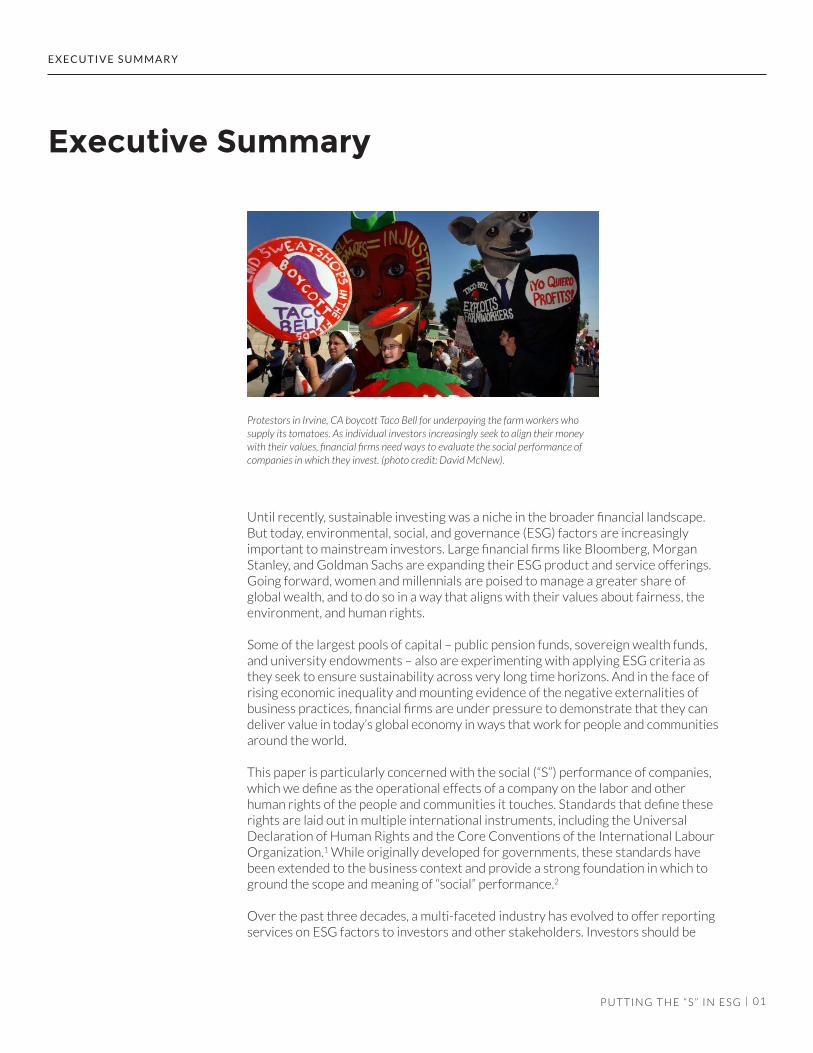
Protestors in Irvine, CA boycott Taco Bell for underpaying the farm workers who supply its tomatoes. As individual investors increasingly seek to align their money with their values, financial firms need ways to evaluate the social performance of companies in which they invest. (photo credit: David McNew).
0 1
E X E C U T I V E S U M M A R Y
Executive Summary
P U T T I N G T H E “ S ” I N E S G |
Until recently, sustainable investing was a niche in the broader financial landscape. But today, environmental, social, and governance (ESG) factors are increasingly important to mainstream investors. Large financial firms like Bloomberg, Morgan Stanley, and Goldman Sachs are expanding their ESG product and service offerings. Going forward, women and millennials are poised to manage a greater share of global wealth, and to do so in a way that aligns with their values about fairness, the environment, and human rights.
Some of the largest pools of capital – public pension funds, sovereign wealth funds, and university endowments – also are experimenting with applying ESG criteria as they seek to ensure sustainability across very long time horizons. And in the face of rising economic inequality and mounting evidence of the negative externalities of business practices, financial firms are under pressure to demonstrate that they can deliver value in today’s global economy in ways that work for people and communitiesaround the world.
This paper is particularly concerned with the social (“S”) performance of companies, which we define as the operational effects of a company on the labor and other human rights of the people and communities it touches. Standards that define these rights are laid out in multiple international instruments, including the Universal Declaration of Human Rights and the Core Conventions of the International Labour Organization.1 While originally developed for governments, these standards have been extended to the business context and provide a strong foundation in which to ground the scope and meaning of “social” performance.2
Over the past three decades, a multi-faceted industry has evolved to offer reportingservices on ESG factors to investors and other stakeholders. Investors should be
0 2
E X E C U T I V E S U M M A R Y
P U T T I N G T H E “ S ” I N E S G |
able to rely on the ESG industry to provide data that helps them identify strong performers and assess risk. When it comes to evaluating companies on their toxic waste emissions (“E”) or vulnerability to fraud and corruption (“G”), investors now have tools to assist them. But our analysis of 12 leading ESG frameworks shows that the ESG industry is still falling short of this objective when it comes to “S”.
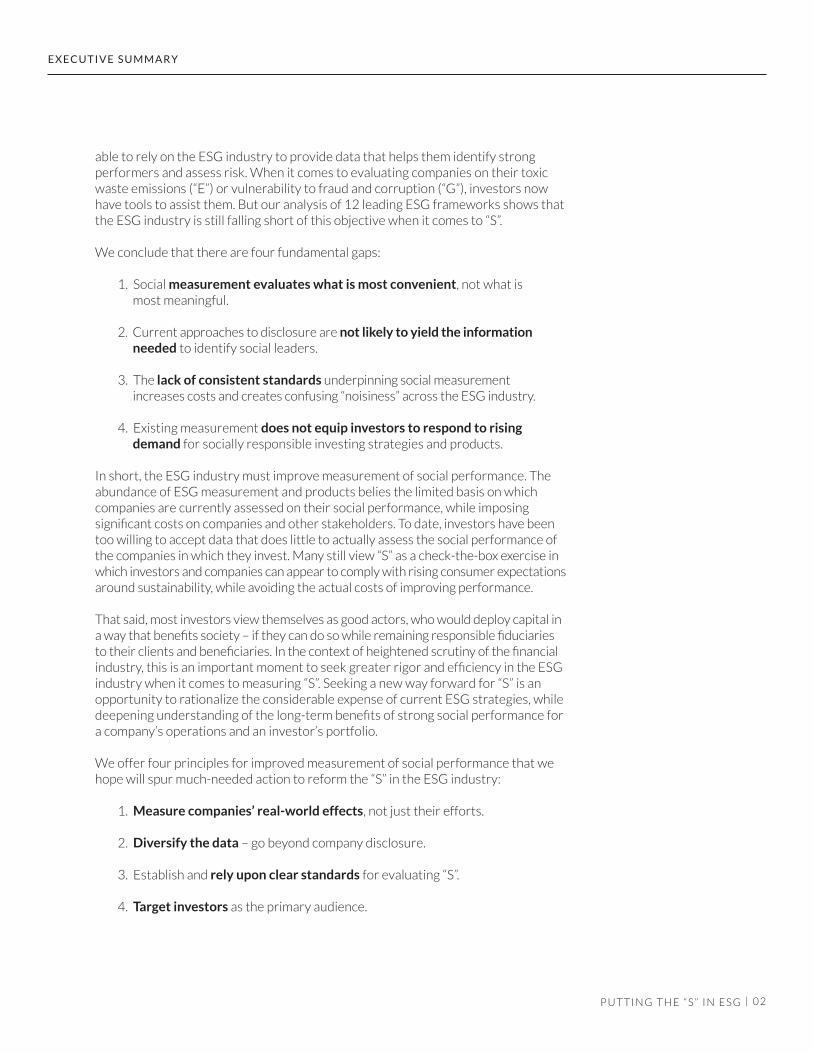
We conclude that there are four fundamental gaps:
1. Social measurement evaluates what is most convenient, not what is most meaningful.
2. Current approaches to disclosure are not likely to yield the informationneeded to identify social leaders.
3. The lack of consistent standards underpinning social measurementincreases costs and creates confusing “noisiness” across the ESG industry.
4. Existing measurement does not equip investors to respond to rising demand for socially responsible investing strategies and products.
In short, the ESG industry must improve measurement of social performance. The abundance of ESG measurement and products belies the limited basis on which companies are currently assessed on their social performance, while imposing significant costs on companies and other stakeholders. To date, investors have been too willing to accept data that does little to actually assess the social performance of the companies in which they invest. Many still view “S” as a check-the-box exercise in which investors and companies can appear to comply with rising consumer expectationsaround sustainability, while avoiding the actual costs of improving performance.
That said, most investors view themselves as good actors, who would deploy capital in a way that benefits society – if they can do so while remaining responsible fiduciariesto their clients and beneficiaries. In the context of heightened scrutiny of the financialindustry, this is an important moment to seek greater rigor and efficiency in the ESG industry when it comes to measuring “S”. Seeking a new way forward for “S” is an opportunity to rationalize the considerable expense of current ESG strategies, while deepening understanding of the long-term benefits of strong social performance for a company’s operations and an investor’s portfolio.
We offer four principles for improved measurement of social performance that we hope will spur much-needed action to reform the “S” in the ESG industry:
1. Measure companies’ real-world effects, not just their efforts.
2. Diversify the data – go beyond company disclosure.
3. Establish and rely upon clear standards for evaluating “S”.
4. Target investors as the primary audience.
0 3
E X E C U T I V E S U M M A R Y
P U T T I N G T H E “ S ” I N E S G |
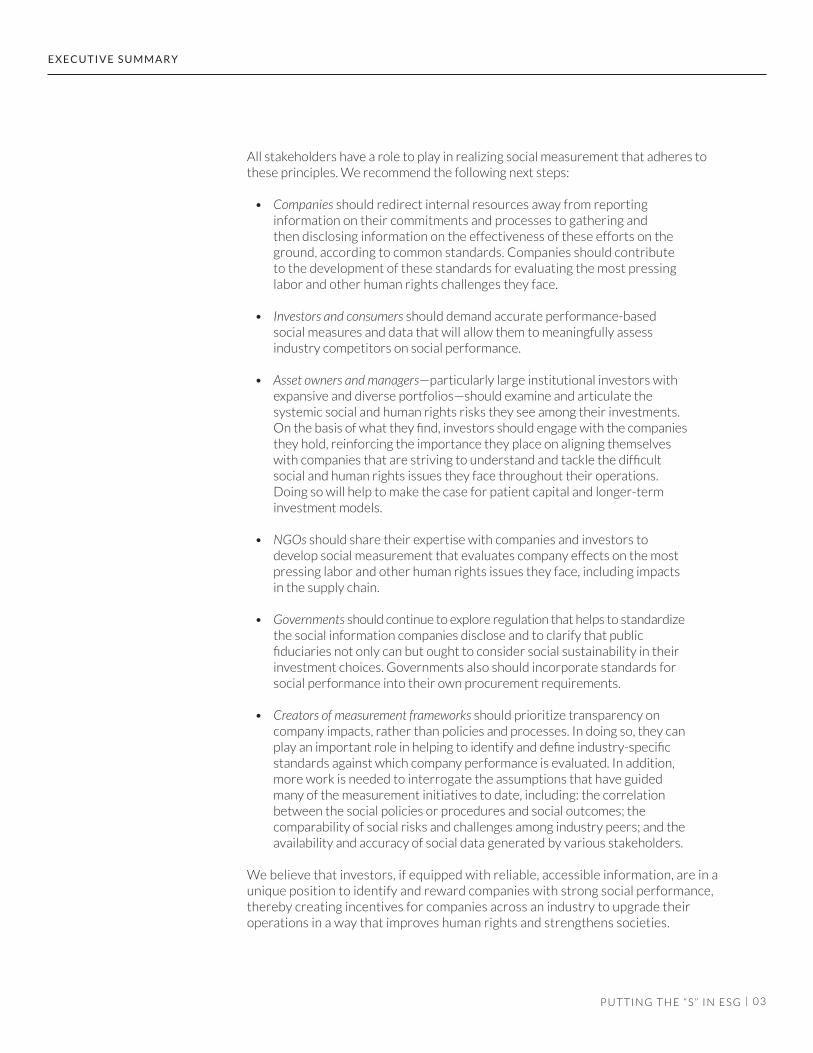
All stakeholders have a role to play in realizing social measurement that adheres to these principles. We recommend the following next steps:
• Companies should redirect internal resources away from reportinginformation on their commitments and processes to gathering and then disclosing information on the effectiveness of these efforts on the ground, according to common standards. Companies should contribute to the development of these standards for evaluating the most pressing labor and other human rights challenges they face.
• Investors and consumers should demand accurate performance-basedsocial measures and data that will allow them to meaningfully assess industry competitors on social performance.
• Asset owners and managers—particularly large institutional investors with expansive and diverse portfolios—should examine and articulate the systemic social and human rights risks they see among their investments. On the basis of what they find, investors should engage with the companies they hold, reinforcing the importance they place on aligning themselves with companies that are striving to understand and tackle the difficult social and human rights issues they face throughout their operations. Doing so will help to make the case for patient capital and longer-term investment models.
• NGOs should share their expertise with companies and investors to develop social measurement that evaluates company effects on the most pressing labor and other human rights issues they face, including impacts in the supply chain.
• Governments should continue to explore regulation that helps to standardizethe social information companies disclose and to clarify that public fiduciaries not only can but ought to consider social sustainability in their investment choices. Governments also should incorporate standards for social performance into their own procurement requirements.
• Creators of measurement frameworks should prioritize transparency on company impacts, rather than policies and processes. In doing so, they can play an important role in helping to identify and define industry-specific standards against which company performance is evaluated. In addition, more work is needed to interrogate the assumptions that have guided many of the measurement initiatives to date, including: the correlation between the social policies or procedures and social outcomes; the comparability of social risks and challenges among industry peers; and the availability and accuracy of social data generated by various stakeholders.
We believe that investors, if equipped with reliable, accessible information, are in aunique position to identify and reward companies with strong social performance,thereby creating incentives for companies across an industry to upgrade their operations in a way that improves human rights and strengthens societies.
Defining Sustainable Investment
Sustainable investment goes by many names – “socially responsible,” “ethical,” “sustainable & responsible,” “Environmental, Social, and Governance (ESG),” and “impact,” among others – but generally follows three broad approaches:
(1) screening out companies that violate certain values (such as divesting from coal, tobacco, weapons, or other “sin” stocks) and/or positively screening for companies that uphold values or perform well on ESG factors;
(2) impact investing in organizations or projects that have social or environmental aims; and
(3) integrating ESG factors into traditional financial analysis.3
Once a company is in an investor’s portfolio, they may further advance sustaina-bility objectives through engagement with management and shareholder voting. This paper focuses on how labor and other human rights factors are currently defined and measured for use across these approaches.
0 4
E X E C U T I V E S U M M A R Y
P U T T I N G T H E “ S ” I N E S G |
0 5
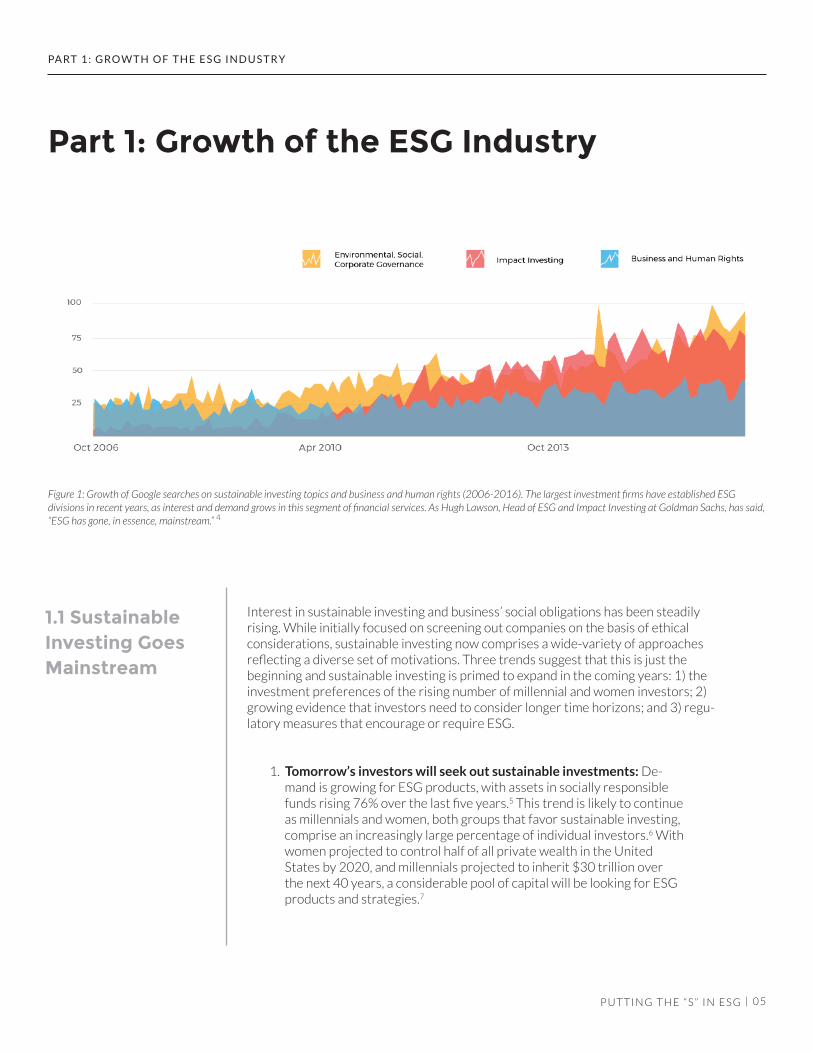
Figure 1: Growth of Google searches on sustainable investing topics and business and human rights (2006-2016). The largest investment firms have established ESG divisions in recent years, as interest and demand grows in this segment of financial services. As Hugh Lawson, Head of ESG and Impact Investing at Goldman Sachs, has said, “ESG has gone, in essence, mainstream.” 4
PA RT 1 : G RO W T H O F T H E E S G I N D U S T R Y
Part 1: Growth of the ESG Industry
Interest in sustainable investing and business’ social obligations has been steadily rising. While initially focused on screening out companies on the basis of ethical considerations, sustainable investing now comprises a wide-variety of approaches reflecting a diverse set of motivations. Three trends suggest that this is just the beginning and sustainable investing is primed to expand in the coming years: 1) the investment preferences of the rising number of millennial and women investors; 2) growing evidence that investors need to consider longer time horizons; and 3) regu-latory measures that encourage or require ESG.
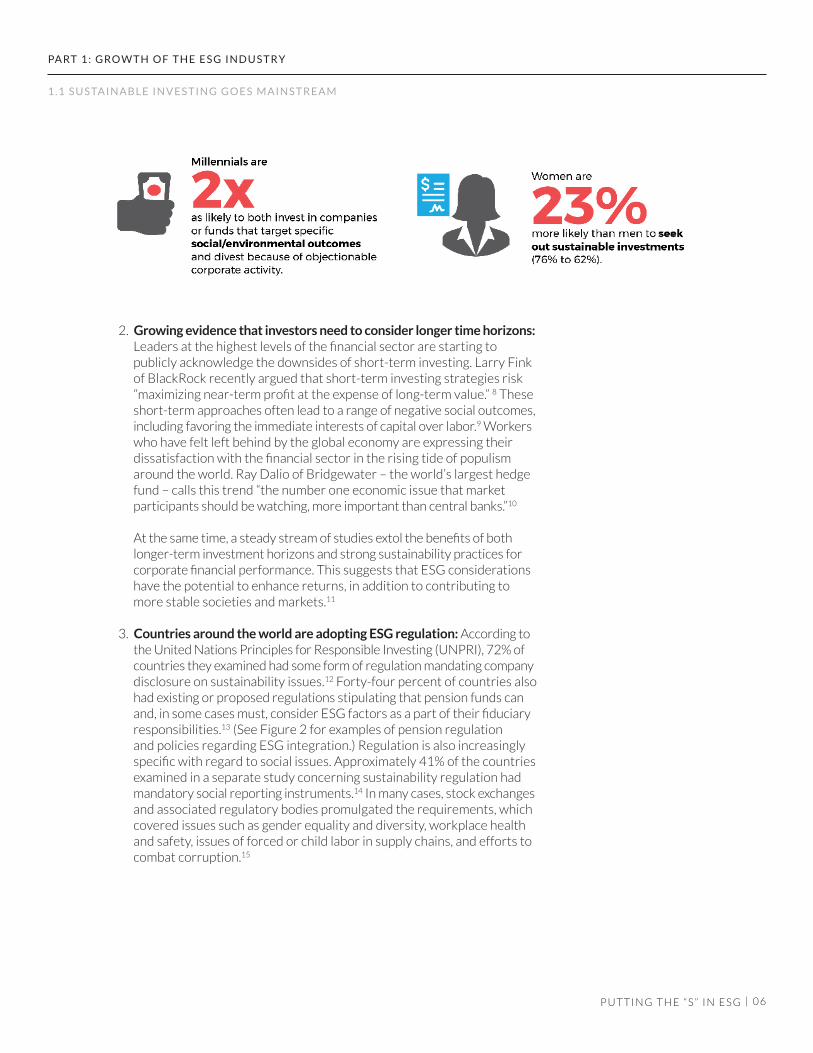
1. Tomorrow’s investors will seek out sustainable investments: De-mand is growing for ESG products, with assets in socially responsible funds rising 76% over the last five years.5 This trend is likely to continue as millennials and women, both groups that favor sustainable investing, comprise an increasingly large percentage of individual investors.6 With women projected to control half of all private wealth in the United States by 2020, and millennials projected to inherit $30 trillion over the next 40 years, a considerable pool of capital will be looking for ESG products and strategies.7
P U T T I N G T H E “ S ” I N E S G |
1.1 Sustainable Investing Goes Mainstream
0 6
PA RT 1 : G RO W T H O F T H E E S G I N D U S T R Y
2. Growing evidence that investors need to consider longer time horizons:Leaders at the highest levels of the financial sector are starting to publicly acknowledge the downsides of short-term investing. Larry Fink of BlackRock recently argued that short-term investing strategies risk “maximizing near-term profit at the expense of long-term value.” 8 These short-term approaches often lead to a range of negative social outcomes,including favoring the immediate interests of capital over labor.9 Workerswho have felt left behind by the global economy are expressing their dissatisfaction with the financial sector in the rising tide of populism around the world. Ray Dalio of Bridgewater – the world’s largest hedge fund – calls this trend “the number one economic issue that marketparticipants should be watching, more important than central banks.”10
At the same time, a steady stream of studies extol the benefits of both longer-term investment horizons and strong sustainability practices for corporate financial performance. This suggests that ESG considerations have the potential to enhance returns, in addition to contributing to more stable societies and markets.11
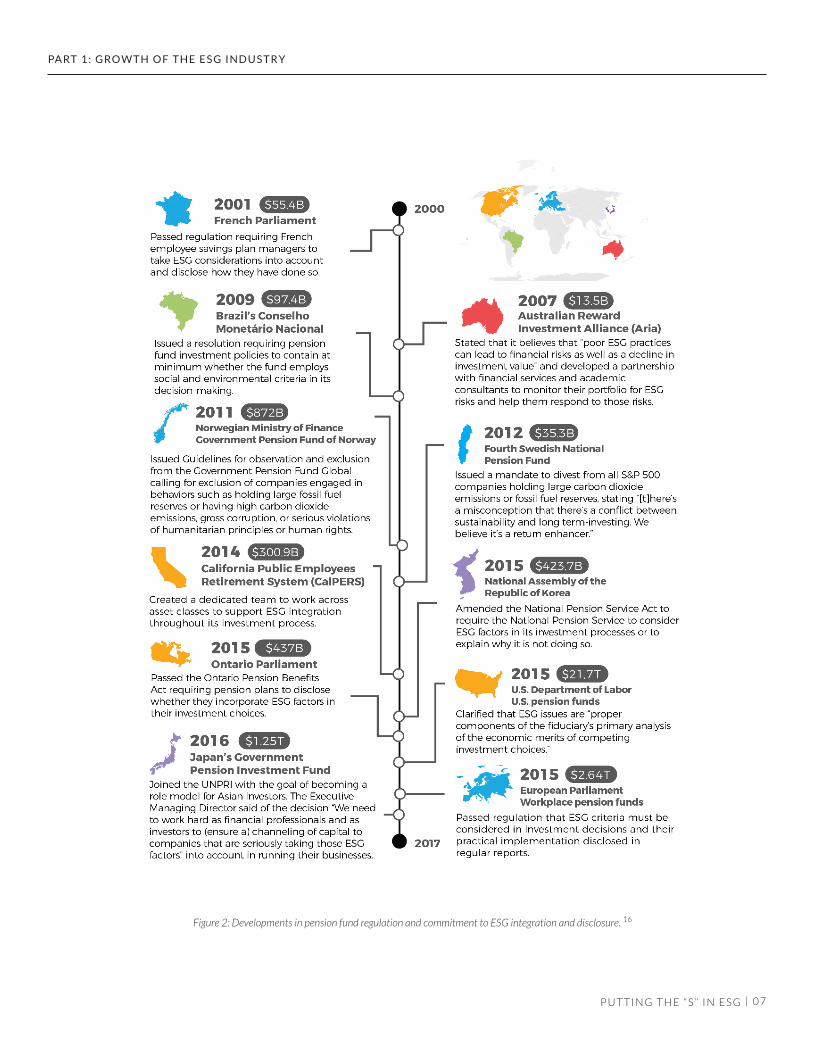
3. Countries around the world are adopting ESG regulation: According to the United Nations Principles for Responsible Investing (UNPRI), 72% of countries they examined had some form of regulation mandating companydisclosure on sustainability issues.12 Forty-four percent of countries also had existing or proposed regulations stipulating that pension funds can and, in some cases must, consider ESG factors as a part of their fiduciary responsibilities.13 (See Figure 2 for examples of pension regulation and policies regarding ESG integration.) Regulation is also increasingly specific with regard to social issues. Approximately 41% of the countries examined in a separate study concerning sustainability regulation had mandatory social reporting instruments.14 In many cases, stock exchangesand associated regulatory bodies promulgated the requirements, which covered issues such as gender equality and diversity, workplace health and safety, issues of forced or child labor in supply chains, and efforts to combat corruption.15
P U T T I N G T H E “ S ” I N E S G |
1 . 1 S U S TA I N A B L E I N V E S T I N G G O E S M A I N S T R E A M
0 7
PA RT 1 : G RO W T H O F T H E E S G I N D U S T R Y
P U T T I N G T H E “ S ” I N E S G |
Figure 2: Developments in pension fund regulation and commitment to ESG integration and disclosure. 16
0 8
“Sustainability issues have become material concerns for many businesses and investors”
— Bloomberg, Year In, Year Out: Impact Report Update 2015
Several studies affirm a long-term gains argument, especially in light of the shift inrecent decades toward intangible assets (such as brand reputation and human capital) as significant drivers of company value.21 For instance, studies of employment conditionsby scholars at the University of Maastricht and New York University found that firms that treat their workforce poorly suffer a host of negative consequences, including:weaker access to human capital; higher turnover (and associated financial costs of
Whether social performance is likely to improveinvestment outcomes is a question of time horizons.Investors tend to focus on near-term risks and financial returns when determining what infor-mation is material to their decisions.20 Under this approach, investors are likely to consider social performance only when it imposes short-term costs that are easy to calculate. Such costs are most likely to occur when mismanagement ofsocial issues results in damage to brand repu-tation, lawsuits, fines, workplace shutdowns, or consumer protests.
Investors are less accustomed to accounting for the long-term gains of affirmative social perfor-mance, especially if realizing these gains requires absorbing near-term costs. This is problematic be-cause many of the most significant ways in which social performance may improve investment out-comes are only likely to occur in the longer-term. A growing body of research, and CEOs, provides preliminary evidence of such benefits, but more and better data is needed to fully account for the ways in which social performance may impact the strength of an investment.
PA RT 1 : G RO W T H O F T H E E S G I N D U S T R Y
P U T T I N G T H E “ S ” I N E S G |
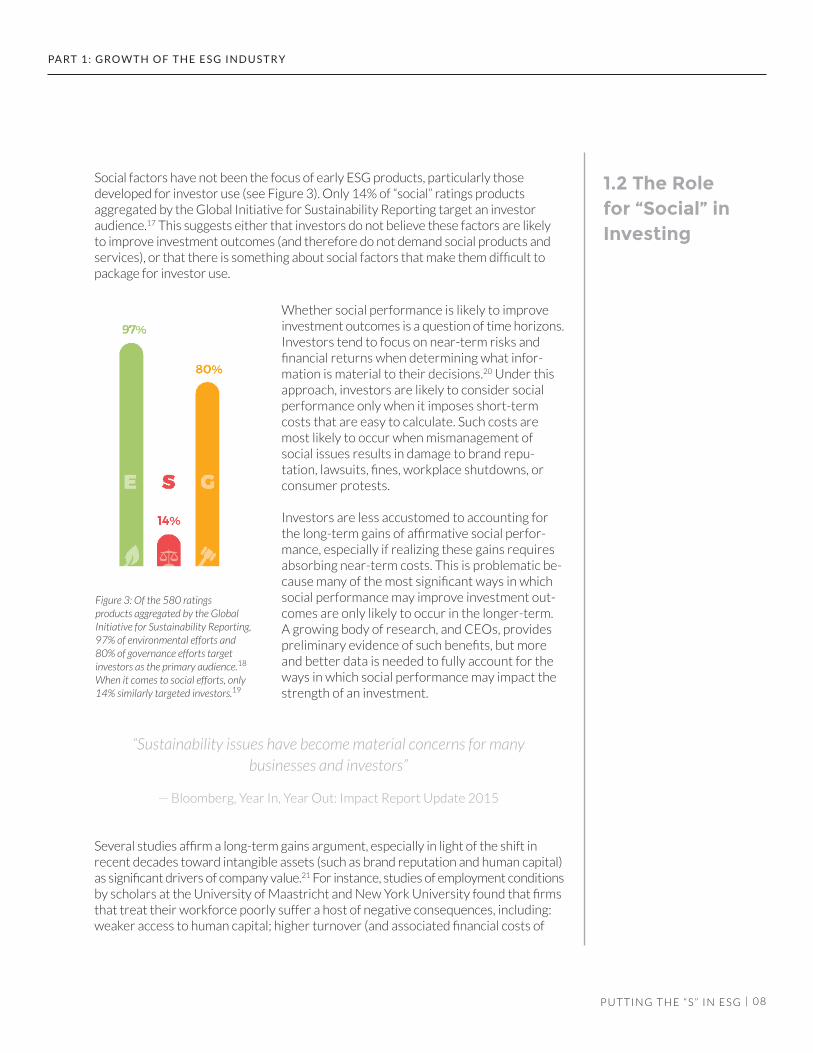
Figure 3: Of the 580 ratingsproducts aggregated by the Global Initiative for Sustainability Reporting, 97% of environmental efforts and 80% of governance efforts target investors as the primary audience.18 When it comes to social efforts, only 14% similarly targeted investors.19
Social factors have not been the focus of early ESG products, particularly thosedeveloped for investor use (see Figure 3). Only 14% of “social” ratings productsaggregated by the Global Initiative for Sustainability Reporting target an investor audience.17 This suggests either that investors do not believe these factors are likely to improve investment outcomes (and therefore do not demand social products and services), or that there is something about social factors that make them difficult to package for investor use.
1.2 The Rolefor “Social” inInvesting
0 9
PA RT 1 : G RO W T H O F T H E E S G I N D U S T R Y
P U T T I N G T H E “ S ” I N E S G |
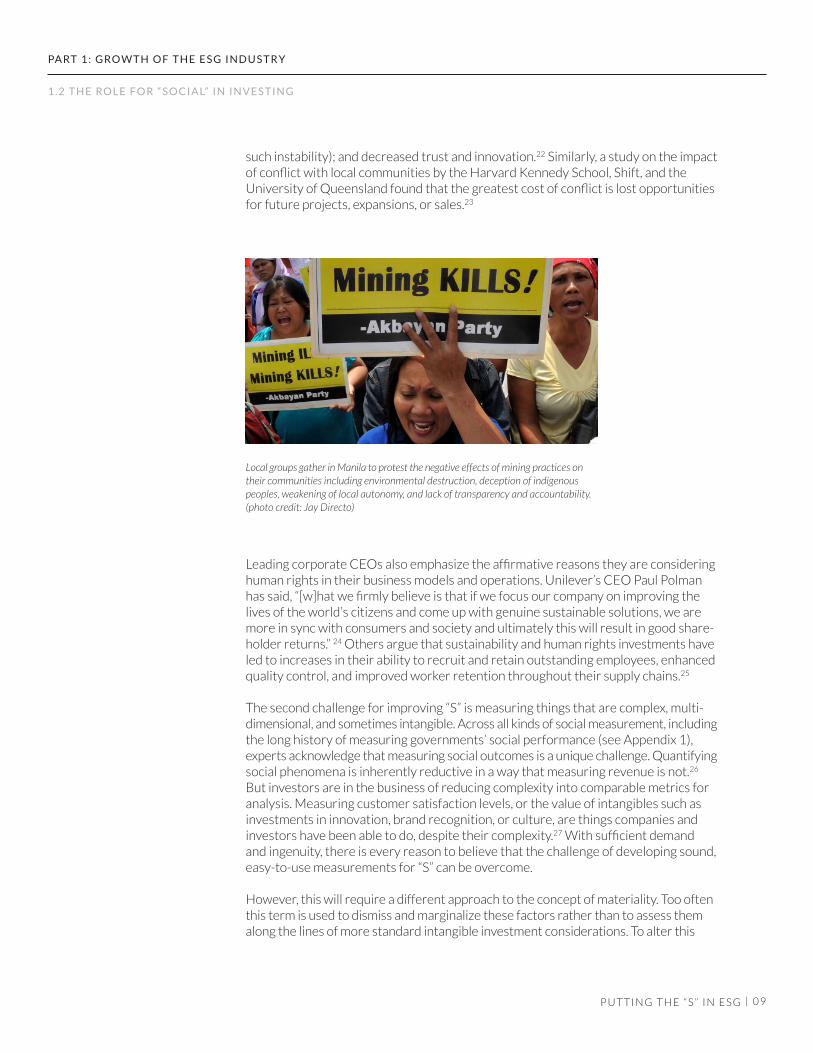
Local groups gather in Manila to protest the negative effects of mining practices on their communities including environmental destruction, deception of indigenous peoples, weakening of local autonomy, and lack of transparency and accountability. (photo credit: Jay Directo)
1 . 2 T H E RO L E F O R “ S O C I A L” I N I N V E S T I N G
such instability); and decreased trust and innovation.22 Similarly, a study on the impactof conflict with local communities by the Harvard Kennedy School, Shift, and the University of Queensland found that the greatest cost of conflict is lost opportunities for future projects, expansions, or sales.23
Leading corporate CEOs also emphasize the affirmative reasons they are consideringhuman rights in their business models and operations. Unilever’s CEO Paul Polman has said, “[w]hat we firmly believe is that if we focus our company on improving the lives of the world’s citizens and come up with genuine sustainable solutions, we are more in sync with consumers and society and ultimately this will result in good share-holder returns.” 24 Others argue that sustainability and human rights investments haveled to increases in their ability to recruit and retain outstanding employees, enhanced quality control, and improved worker retention throughout their supply chains.25
The second challenge for improving “S” is measuring things that are complex, multi-dimensional, and sometimes intangible. Across all kinds of social measurement, includingthe long history of measuring governments’ social performance (see Appendix 1),experts acknowledge that measuring social outcomes is a unique challenge. Quantifyingsocial phenomena is inherently reductive in a way that measuring revenue is not.26
But investors are in the business of reducing complexity into comparable metrics for analysis. Measuring customer satisfaction levels, or the value of intangibles such as investments in innovation, brand recognition, or culture, are things companies and investors have been able to do, despite their complexity.27 With sufficient demand and ingenuity, there is every reason to believe that the challenge of developing sound, easy-to-use measurements for “S” can be overcome.
However, this will require a different approach to the concept of materiality. Too often this term is used to dismiss and marginalize these factors rather than to assess them along the lines of more standard intangible investment considerations. To alter this
1 0
PA RT 1 : G RO W T H O F T H E E S G I N D U S T R Y
P U T T I N G T H E “ S ” I N E S G |
Lessons from “E”
When looking to improve social measurement, there are lessons to be drawn from the success of “E”, while acknowledging that there are some limitations to the comparison. First, “E” demonstrates the importance of standards-based, performance-oriented measurement. For example, the Carbon DisclosureProject (CDP), a widely cited reporting framework used by more than 5,500 companies worldwide, asks respondents to provide total global emissionsof carbon dioxide and compares those numbers against prior years.28 Newsweek’s Green Rankings issues an energy productivity score that is calculated using gross company revenue/global energy consumption.29 These approaches set an industry standard that applies across companies and allows investors and others to compare companies’ performance over time and against competitors. As of yet, there are no equivalent measurements for “S”.
Investors also reward companies for their environmental performance. A report on Newsweek’s Green Rankings found that market values of ranked companies were enhanced in the days following its publication. The study found that “getting one position closer to the top of Newsweek’s ‘Global 100 Green Rankings’ increases the value of an average firm in the list by eleven million dollars.” 30
That said, environmental considerations often result in near-term costsavings, whereas social considerations do not. A prime example of this is Nike’s development of Flyknit technology, a single piece of recycled polyester fabric that it introduced in a new line of athletic shoes in 2012. Flyknit can be used for the entire upper portion of the shoe, decreasing material and labor costs associated with older models. The shift reduced environmental waste by 3.5 million pounds, while expanding the company’s profit margin by 0.25%.31 On the other hand, company investments that improve social performance – such as upgrading a facility’s safety or regulating hours of work – impose costs, often without an attendant rise in near-term profits. Companies and investors have not yet reckoned with how to accommodate these costs, especially in the context of high-pressure, short-term investing.
1 . 2 T H E RO L E F O R “ S O C I A L” I N I N V E S T I N G
pattern, investors should work collectively and with other stakeholders to developa better framework for valuing and incorporating labor and other human rights issues into their routine assessments of company performance.
1 1
There are now hundreds of initiatives, services, and tools available to measure and communicate companies’ performance on labor and other human rights issues, some of which are intended to be useful in an investment context. The proliferation of these efforts reflects broad consensus that labor and other human rights issues should be measured as a part of ESG investing, but little convergence around how to do so.
This paper examines 12 leading measurement frameworks that target an investor audience. In selecting those to evaluate, we first turned to SustainAbility’s Rate the Raters survey of investors to identify the tools most commonly used by investors.32 We then added tools that focus on labor and other human rights issues. The 12 frameworks fit into three general categories:
1. Company-focused frameworks: Sustainability and human rightsreporting guidelines for companies to inform their public disclosures on social and sustainability practices.
2. Investor-focused frameworks: ESG data providers, third-party research services, and ratings and indices designed specifically to aid investment decisions.
3. Human rights-focused frameworks: Publicly available ratings and rankings designed by human rights experts to identify which companies are leading on labor and other human rights factors specifically.
In the typology below, we illustrate the different categories of frameworks withadditional examples that were not included in our sample but are otherwise prominentin the field.
Company reporting underpins the vast majority of social measurement efforts. But there are few regulatory or standards-based requirements mandating consistency in what companies disclose. As a result, company reporting is highly individualized; the structure and content of what is reported varies between peer companies and even from year to year for the same company. Moreover, companies control what and how to report. They determine what is “material” and therefore should be reported, often without external validation of the accuracy or completeness of their disclosures.
Company reporting frameworks are intended to provide reporting standards to guide company disclosures. Two frameworks dominate this space, the generalist standards of the Global Reporting Initiative and the industry-specific standards issued by the Sustainability Accounting Standards Board. The UN Guiding PrinciplesReporting Framework, which focuses specifically on human rights, is not yet as widely-discussed.
PA RT 2 : T Y P O LO G Y O F S O C I A L M E A S U R E M E N T
P U T T I N G T H E “ S ” I N E S G |
Part 2: Typology of Social Measurement
2.1 Company-focusedFrameworks
1 2
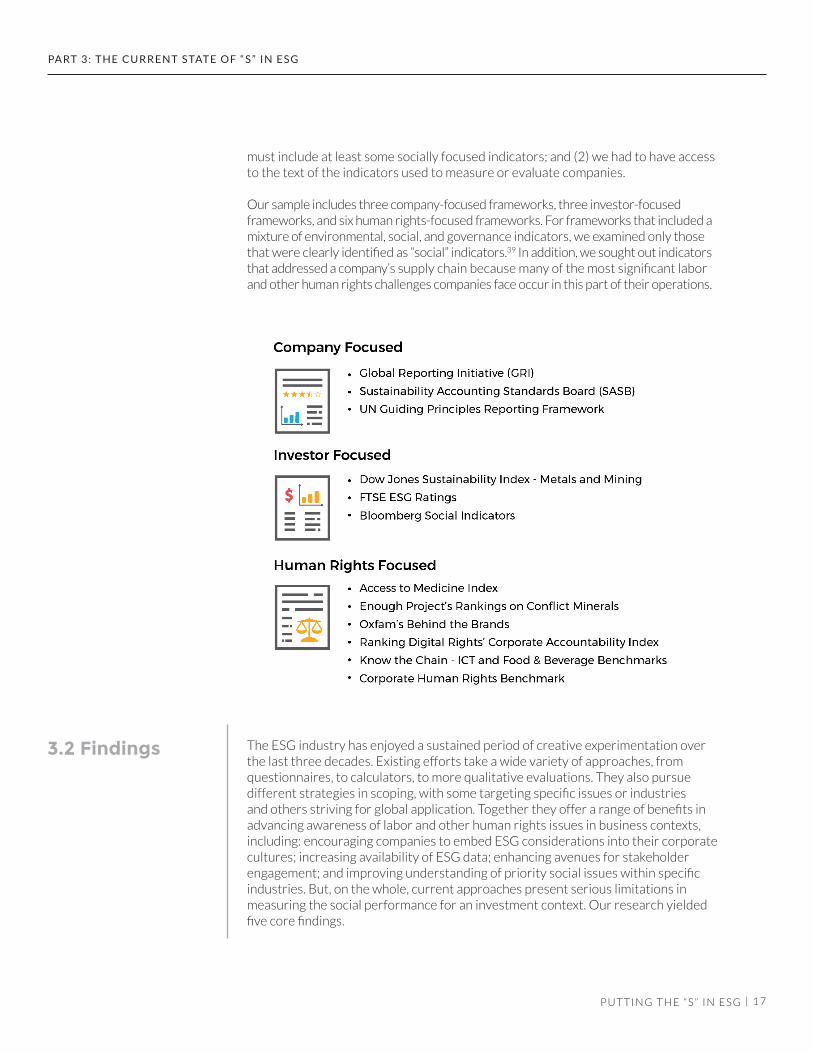
• Global Reporting Initiative (GRI): GRI issues broad reporting standards for sustainability. After a recent update, it now consists of 36 individual reporting standards. Participating companies are required to incorporate three general standards, and are free to opt-in to additional subject-specific standards if they decide these standards are “material” to their business model.
• Sustainability Accounting Standards Board (SASB): SASB has developed industry-specific standards for company sustainability. It has convened a series of consultative groups comprised of industry, civil society and academic experts over the last several years to develop means for evaluating 79 industries in 10 sectors.
• UN Guiding Principles Reporting Framework (UNGPRF): UNGPRF provides a series of 31 questions to assist companies in communicating how they are integrating human rights considerations into their operations.
Each framework is developed by non-profit organizations following extensive, multi-stakeholder consultation processes. While both GRI and SASB have both garnered considerable attention, neither has emerged as the dominant standard. A recent study found that companies prefer to report using GRI, while investors preferto consume information via SASB.33 This is likely because SASB standards were developed specifically to be decision-useful for investors, and are more concise and quantitative in nature.
The growing interest in ESG investing has resulted in a wide range of products aimedat helping investors incorporate ESG factors into their decisions and offerings. There are now hundreds of sustainability indices and sources of ESG data, many of which build upon one another and on the information disclosed by companies.
As with reporting frameworks, these tools are quite broad. Though some, like the Carbon Disclosure Project, focus exclusively on environmental issues, none are similarly focused exclusively on labor or other human rights issues. Where social considerations are incorporated, they examine a set of loosely defined issues, from health and safety, to labor standards, customer relations, community engagement, philanthropy, employee volunteering, and social investment.
According to the Rate the Raters survey, investors look to third-party data and re-search providers as among their top sources for ESG information.34 That said, when rating individual frameworks, only a select few indices, data aggregators, and re-search providers were used “at least sometimes” by more than 20% of respondents.35
These were:
• Bloomberg: Bloomberg gathers ESG data disclosed by over 11,000 companies and integrates it into its Equities and Bloomberg Intelligence platforms. It also produces targeted analysis and tools, including an ESG scorecard.
PA RT 2 : T Y P O LO G Y O F S O C I A L M E A S U R E M E N T
P U T T I N G T H E “ S ” I N E S G |
2.2 Investor-focusedFrameworks
1 3
• Dow Jones Sustainability Indices (DJSI): Provides a large family of indices composed of industry leaders on a variety of sustainability factors. The indices are based on an annual sustainability assessment administered by RobecoSAM and sent to over 3,000 publicly traded companies.
• Morgan Stanley Capital International (MSCI) ESG research and indices: Provides ESG ratings on over 6,000 companies, research on ESG strategies and trends, and more than 700 indices designed to support integration, screening, and impact investing approaches.
Initiatives that were used “at least sometimes” by more than 10% of respondents36 were:
• Carbon Disclosure Project: Aggregates company reports and environmental disclosures using the reporting framework described above (“Lessons from ‘E’”).
• FTSE4Good: A series of indices based on FTSE’s ESG rating of over 4,000 companies. FTSE’s rating relies on 300+ indicators to evaluate ESG exposure and performance.
• Sustainalytics’ Global Access: Online platform for Sustainalytics’ products related to ESG research and ratings, corporate governance research andratings, controversies, product involvement, and Global Compact compliance.
The majority of these are fee-for-service efforts undertaken by financial institutions and service providers. They have large teams, advanced technology, and access to a wide variety of data sources. This allows these firms to provide regular updates on a large number of companies. But because of the proprietary nature of these services,the methodologies for determining company ratings generally are not publicly available.DJSI is the most transparent, providing a public sample of the questionnaire it uses to assess company sustainability. Bloomberg and FTSE4Good shared their indicators privately with the Center’s research team, but at the time of publication, MSCI and Sustainalytics had not yet done so.
Numerous investor-focused consulting groups also offer sustainability researchservices. In some cases, these may be ESG arms of traditional investment consultants such as Mercer, Cambridge Associates, and Aon Hewett. Others are sustainability-focused consultants. Examples of this later group include:
• Sustainalytics: Consultancy that provides sustainability research to companies, investors and investment indices, and civil society groups.
• SustainAbility: Consultancy and think tank that offers research and services to help companies and other stakeholders understand key issues and trends, improve engagement, and develop sustainability management strategies.
• RepRisk: For-profit data aggregator on ESG risks. Uses a combination of automated and human research of media, stakeholders, and other public sources external to the company to evaluate reputational risks.
PA RT 2 : T Y P O LO G Y O F S O C I A L M E A S U R E M E N T
P U T T I N G T H E “ S ” I N E S G |
2 . 2 I N V E S TO R - F O C U S E D F R A M E W O R K S
1 4
These firms offer a range of services, targeting a range of clients. Because they are customized and generally fee-based, they offer very little public information on their exact metrics, indicators, standards, or on the processes they use.
In recent years, a growing number of labor and other human rights experts have created public ratings and rankings that focus specifically on social issues. They aim to highlight leading and lagging companies in a particular industry and/or on a certain social issue. In most cases, they evaluate a small number of companies, using indicators that cover a range of human rights concerns.
Because they are developed by human rights experts in consultation with other stakeholders, these ratings more deeply cover labor or other human rights issues. And, unlike other initiatives, they are transparent about their methodologies and the indicators they use in making their evaluations.
A few relatively small social investment firms like Domini and Calvert rely on these ratings, in part because they have dedicated staffs focusing on human rights as part of ESG investing.37 By contrast, most mainstream investment firms indicate that their use of external ratings is low.38
Prominent examples include:
• Access to Medicine Index: Since 2008, it has issued rankings on the efforts of the top 20 research-based pharmaceutical companies to improve access to medicine in developing countries.
• Enough Project’s Company Rankings on Conflict Minerals: In 2010 and 2012, it publicly ranked 24 electronics companies on their policies, statements, and actions to eliminate conflict minerals from their supply chains in the Democratic Republic of the Congo.
• Oxfam’s Behind the Brands campaign: In 2013 and 2015, it ranked the largest 10 food and beverage companies across environmental, social, and governance aspects of their agricultural sourcing policies and commitments.
• Ranking Digital Rights: Since 2015, it has ranked 16 (soon to be 22) internet and telecommunications companies on their public commitments and policies affecting users’ freedom of expression and privacy.
• KnowTheChain: Since 2016, it benchmarks 60 large global companies in the information and technology communications, food and beverage, and apparel and footwear sectors on their efforts to address forced labor and human trafficking in their supply chains.
• Corporate Human Rights Benchmark: A new initiative, supported by social investors, non-governmental organizations (NGOs) and companies
PA RT 2 : T Y P O LO G Y O F S O C I A L M E A S U R E M E N T
P U T T I N G T H E “ S ” I N E S G |
2.3 HumanRights-focused Frameworks
1 5
that aims to eventually rank the top 500 globally-listed companies on their human rights related policies, processes, and practices, in addition to responses to issues.
Typically, these efforts rely on very small teams of researchers to gather informationabout companies from publicly available sources. Several draw exclusively on information provided by companies through their websites, financial reporting, and sustainability reports. Companies are given a chance to give feedback and make corrections and clarifications. In most cases, quantitative scores are augmented with some degree of qualitative analysis, often in the form of a supplemental narrative. Because this is a resource-intensive process, most of these ratings are updated at most every two or more years.
PA RT 2 : T Y P O LO G Y O F S O C I A L M E A S U R E M E N T
P U T T I N G T H E “ S ” I N E S G |
2 . 3 H U M A N R I G H T S - F O C U S E D F R A M E W O R K S
1 6
PA RT 3 : T H E C U R R E N T S TAT E O F “ S ” I N E S G
P U T T I N G T H E “ S ” I N E S G |
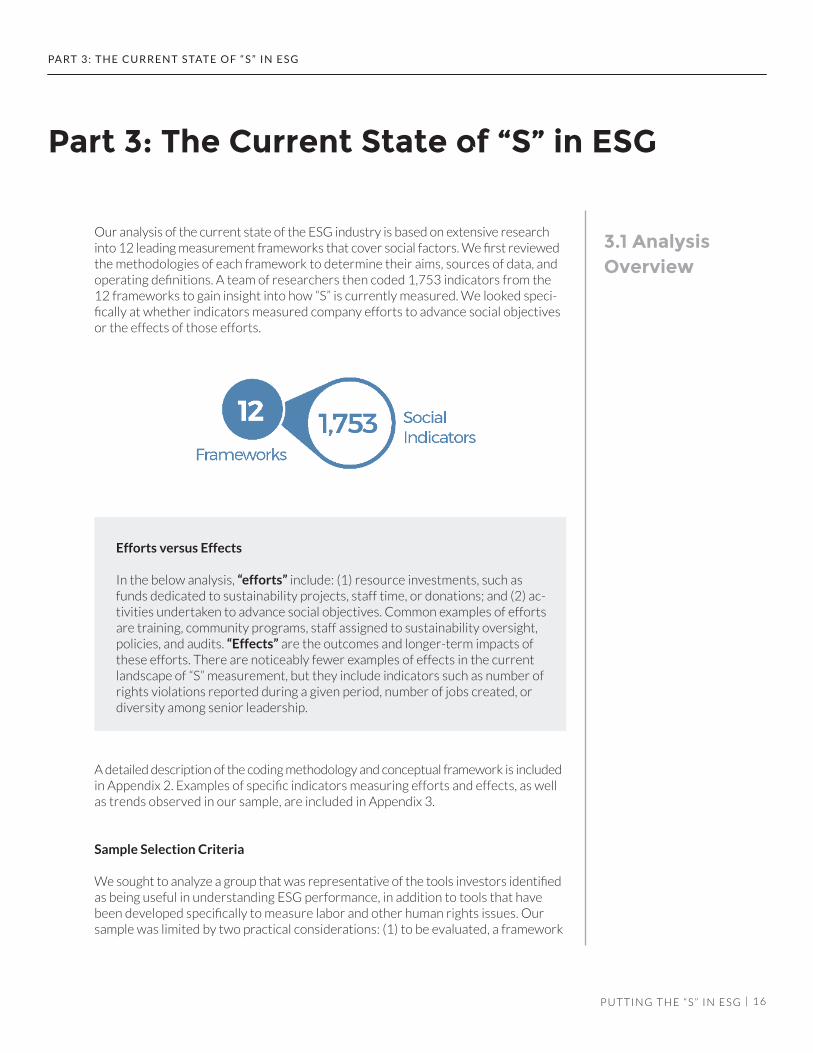
Our analysis of the current state of the ESG industry is based on extensive research into 12 leading measurement frameworks that cover social factors. We first reviewedthe methodologies of each framework to determine their aims, sources of data, and operating definitions. A team of researchers then coded 1,753 indicators from the 12 frameworks to gain insight into how “S” is currently measured. We looked speci-fically at whether indicators measured company efforts to advance social objectives or the effects of those efforts.
A detailed description of the coding methodology and conceptual framework is includedin Appendix 2. Examples of specific indicators measuring efforts and effects, as well as trends observed in our sample, are included in Appendix 3.
Sample Selection Criteria
We sought to analyze a group that was representative of the tools investors identifiedas being useful in understanding ESG performance, in addition to tools that have been developed specifically to measure labor and other human rights issues. Our sample was limited by two practical considerations: (1) to be evaluated, a framework
Part 3: The Current State of “S” in ESG
Efforts versus Effects
In the below analysis, “efforts” include: (1) resource investments, such as funds dedicated to sustainability projects, staff time, or donations; and (2) ac-tivities undertaken to advance social objectives. Common examples of efforts are training, community programs, staff assigned to sustainability oversight, policies, and audits. “Effects” are the outcomes and longer-term impacts of these efforts. There are noticeably fewer examples of effects in the current landscape of “S” measurement, but they include indicators such as number of rights violations reported during a given period, number of jobs created, or diversity among senior leadership.
3.1 Analysis Overview
1 7
must include at least some socially focused indicators; and (2) we had to have access to the text of the indicators used to measure or evaluate companies.
Our sample includes three company-focused frameworks, three investor-focused frameworks, and six human rights-focused frameworks. For frameworks that included a mixture of environmental, social, and governance indicators, we examined only those that were clearly identified as “social” indicators.39 In addition, we sought out indicators that addressed a company’s supply chain because many of the most significant labor and other human rights challenges companies face occur in this part of their operations.
The ESG industry has enjoyed a sustained period of creative experimentation over the last three decades. Existing efforts take a wide variety of approaches, fromquestionnaires, to calculators, to more qualitative evaluations. They also pursue different strategies in scoping, with some targeting specific issues or industries and others striving for global application. Together they offer a range of benefits in advancing awareness of labor and other human rights issues in business contexts, including: encouraging companies to embed ESG considerations into their corporatecultures; increasing availability of ESG data; enhancing avenues for stakeholder engagement; and improving understanding of priority social issues within specific industries. But, on the whole, current approaches present serious limitations in measuring the social performance for an investment context. Our research yielded five core findings.
P U T T I N G T H E “ S ” I N E S G |
PA RT 3 : T H E C U R R E N T S TAT E O F “ S ” I N E S G
3.2 Findings
1 8
Finding 1: Social measurement almost exclusively targets efforts, not effects
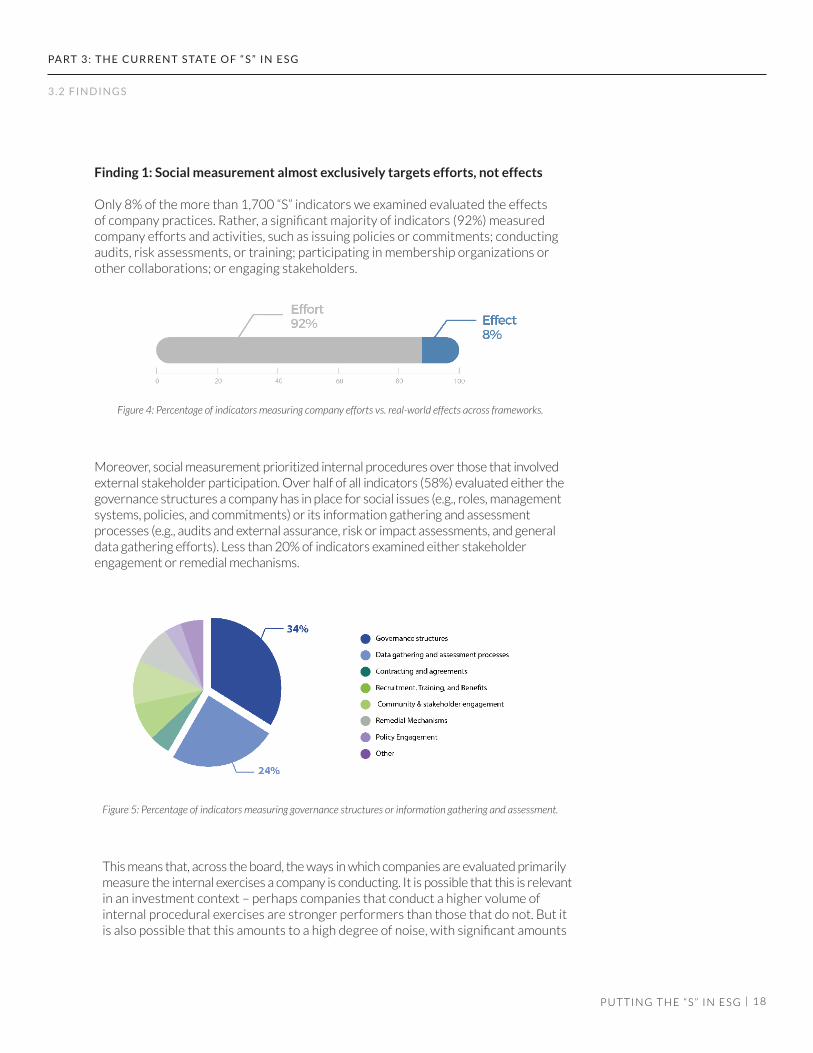
Only 8% of the more than 1,700 “S” indicators we examined evaluated the effects of company practices. Rather, a significant majority of indicators (92%) measured company efforts and activities, such as issuing policies or commitments; conducting audits, risk assessments, or training; participating in membership organizations or other collaborations; or engaging stakeholders.
Moreover, social measurement prioritized internal procedures over those that involvedexternal stakeholder participation. Over half of all indicators (58%) evaluated either the governance structures a company has in place for social issues (e.g., roles, management systems, policies, and commitments) or its information gathering and assessmentprocesses (e.g., audits and external assurance, risk or impact assessments, and general data gathering efforts). Less than 20% of indicators examined either stakeholderengagement or remedial mechanisms.
P U T T I N G T H E “ S ” I N E S G |
PA RT 3 : T H E C U R R E N T S TAT E O F “ S ” I N E S G
Figure 4: Percentage of indicators measuring company efforts vs. real-world effects across frameworks.
3 . 2 F I N D I N G S
Figure 5: Percentage of indicators measuring governance structures or information gathering and assessment.
This means that, across the board, the ways in which companies are evaluated primarilymeasure the internal exercises a company is conducting. It is possible that this is relevantin an investment context – perhaps companies that conduct a higher volume of internal procedural exercises are stronger performers than those that do not. But it is also possible that this amounts to a high degree of noise, with significant amounts
1 9P U T T I N G T H E “ S ” I N E S G |
PA RT 3 : T H E C U R R E N T S TAT E O F “ S ” I N E S G
3 . 2 F I N D I N G S
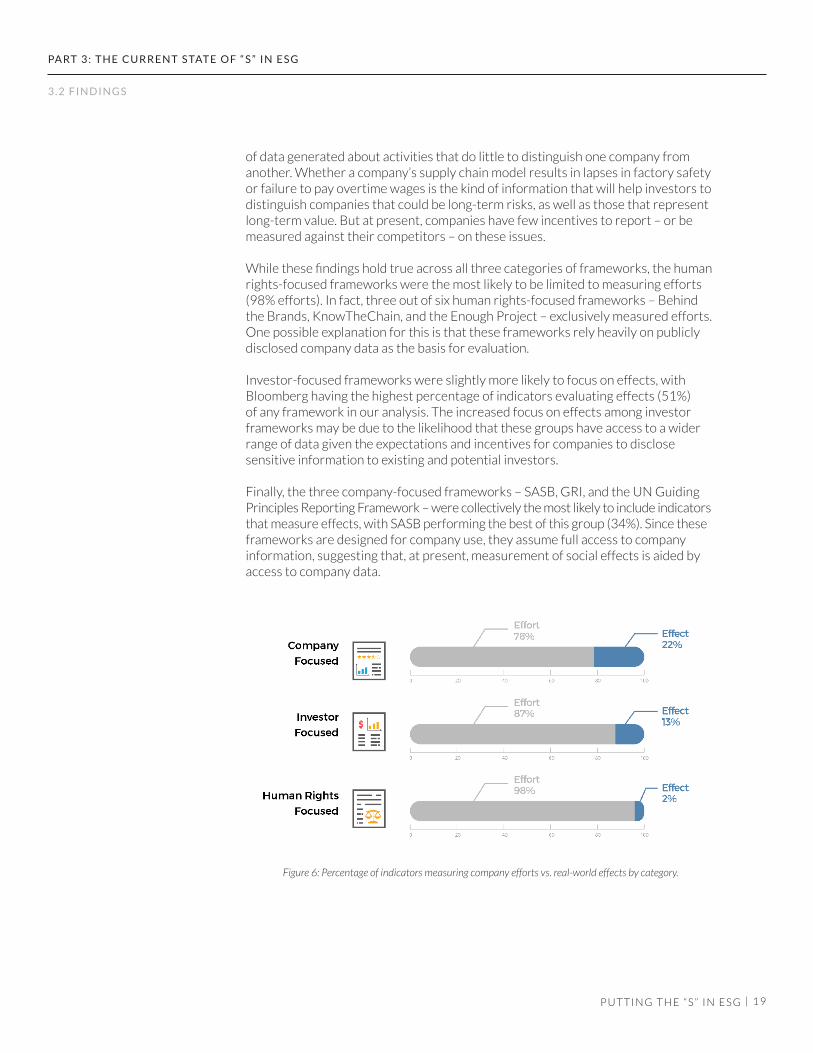
Figure 6: Percentage of indicators measuring company efforts vs. real-world effects by category.
of data generated about activities that do little to distinguish one company from another. Whether a company’s supply chain model results in lapses in factory safety or failure to pay overtime wages is the kind of information that will help investors to distinguish companies that could be long-term risks, as well as those that represent long-term value. But at present, companies have few incentives to report – or be measured against their competitors – on these issues.
While these findings hold true across all three categories of frameworks, the human rights-focused frameworks were the most likely to be limited to measuring efforts (98% efforts). In fact, three out of six human rights-focused frameworks – Behind the Brands, KnowTheChain, and the Enough Project – exclusively measured efforts. One possible explanation for this is that these frameworks rely heavily on publicly disclosed company data as the basis for evaluation.
Investor-focused frameworks were slightly more likely to focus on effects, with Bloomberg having the highest percentage of indicators evaluating effects (51%) of any framework in our analysis. The increased focus on effects among investor frameworks may be due to the likelihood that these groups have access to a wider range of data given the expectations and incentives for companies to disclosesensitive information to existing and potential investors.
Finally, the three company-focused frameworks – SASB, GRI, and the UN Guiding Principles Reporting Framework – were collectively the most likely to include indicatorsthat measure effects, with SASB performing the best of this group (34%). Since theseframeworks are designed for company use, they assume full access to company information, suggesting that, at present, measurement of social effects is aided by access to company data.

2 0
Absent regulation or agreed upon standards, companies have significant latitude across all three kinds of frameworks in determining the scope of social measurement through the information they choose to disclose. Companies understandably are likely to highlight the efforts they make, often through their corporate social responsibility or communications departments, rather than the higher-cost, higher-risk analysis of the effectiveness of those efforts.
Finding 2: “S” is defined in a multitude of (often vague or limited) ways, making it difficult to draw conclusions about company performance
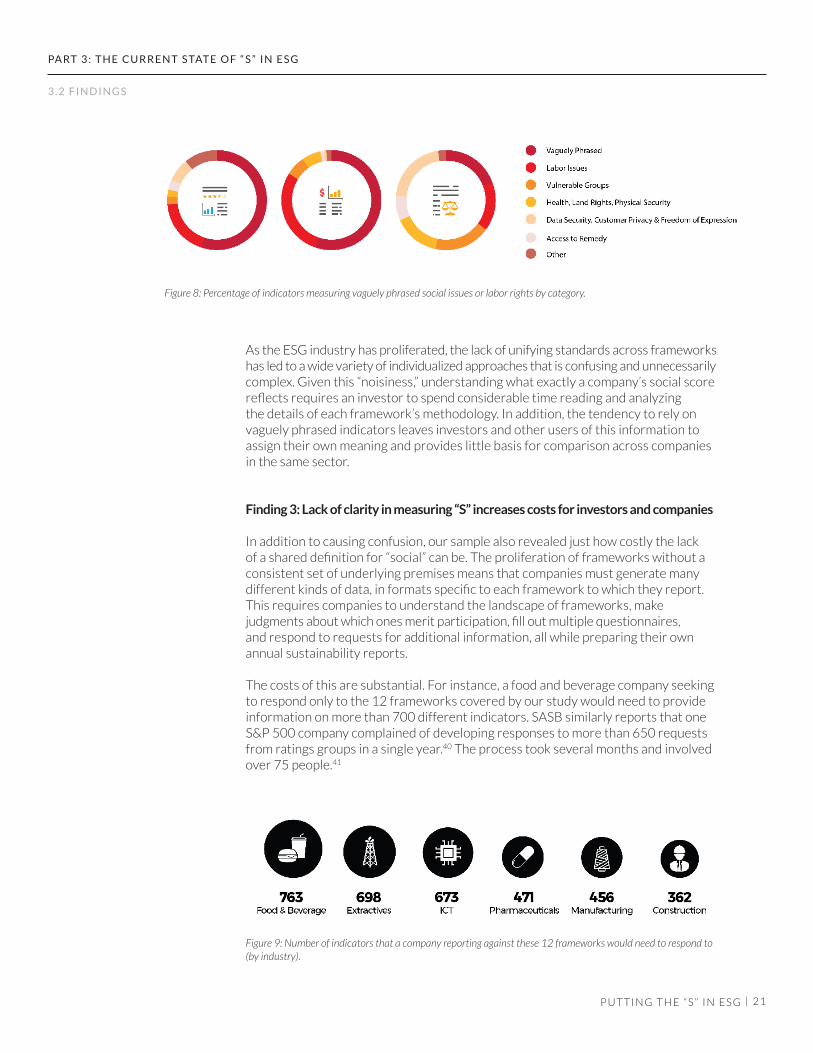
In our review of methodologies, we found no consistent set of standards underpinning “S” among ESG frameworks. When examined in aggregate, the 12 frameworks most often measured social issues vaguely or with respect to a small set of labor concerns. The highest number of “S” indicators (35%) examined social issues generally, using vague terms such as “social,” “human rights,” or “ESG” without greater definition.Another 20% focused on a limited set of common labor issues such as occupational health and safety, freedom of association, compensation and benefits, or diversity and equal opportunity.
P U T T I N G T H E “ S ” I N E S G |
PA RT 3 : T H E C U R R E N T S TAT E O F “ S ” I N E S G
3 . 2 F I N D I N G S
This was most pronounced in investor-driven frameworks (Dow Jones, FTSE, and Bloomberg), where 84% of indicators focused either on vague ESG language or a limited set of labor issues. Investors’ reliance on a vague or limited definition of “S” means that they are not equipped to capture the full picture of social considerations in their investing approaches.
Human rights-focused frameworks, in aggregate, covered a greater diversity and ba-lance of social issues. These frameworks tend to focus on a specific industry, allowing them to target the most relevant issues, as opposed to generalist approaches. For example, Ranking Digital Rights and Access to Medicine each target three to four of the highest priority issues for the information and communications technology sector and the pharmaceutical sector, respectively. They include no indicators that use vague or generalist language.
Figure 7: Percentage of indicators measuring vaguely phrased social issues or labor rights across frameworks.
2 1
As the ESG industry has proliferated, the lack of unifying standards across frameworkshas led to a wide variety of individualized approaches that is confusing and unnecessarilycomplex. Given this “noisiness,” understanding what exactly a company’s social score reflects requires an investor to spend considerable time reading and analyzing the details of each framework’s methodology. In addition, the tendency to rely on vaguely phrased indicators leaves investors and other users of this information to assign their own meaning and provides little basis for comparison across companies in the same sector.
Finding 3: Lack of clarity in measuring “S” increases costs for investors and companies
In addition to causing confusion, our sample also revealed just how costly the lack of a shared definition for “social” can be. The proliferation of frameworks without a consistent set of underlying premises means that companies must generate many different kinds of data, in formats specific to each framework to which they report. This requires companies to understand the landscape of frameworks, makejudgments about which ones merit participation, fill out multiple questionnaires,and respond to requests for additional information, all while preparing their own annual sustainability reports.
The costs of this are substantial. For instance, a food and beverage company seeking to respond only to the 12 frameworks covered by our study would need to provide information on more than 700 different indicators. SASB similarly reports that one S&P 500 company complained of developing responses to more than 650 requests from ratings groups in a single year.40 The process took several months and involved over 75 people.41
P U T T I N G T H E “ S ” I N E S G |
PA RT 3 : T H E C U R R E N T S TAT E O F “ S ” I N E S G
Figure 8: Percentage of indicators measuring vaguely phrased social issues or labor rights by category.
3 . 2 F I N D I N G S
Figure 9: Number of indicators that a company reporting against these 12 frameworks would need to respond to (by industry).
2 2
For the frameworks, sorting through all of the company-reported information results in significant additional costs. Measurement projects can cost millions of dollars annually. For instance, the Access to Medicine Index, conducted every other year, reports that it costs approximately $1.6 million to produce,42 while SASB and GRI report annual expenses of more than $8.2 million and $9.8 million respectively.43
An ESG data client at one of the human rights rankings reports that each individual indicator purchased from an ESG service provider such as Sustainalytics can cost $50 or more.44 This means that an initiative seeking to evaluate 100 companies on the basis of 100 indicators would face costs of $500,000 in data alone, on top of personneland other management expenses.
Finding 4: Supply chains merit special focus, but are largely missing fromevaluations of “S”
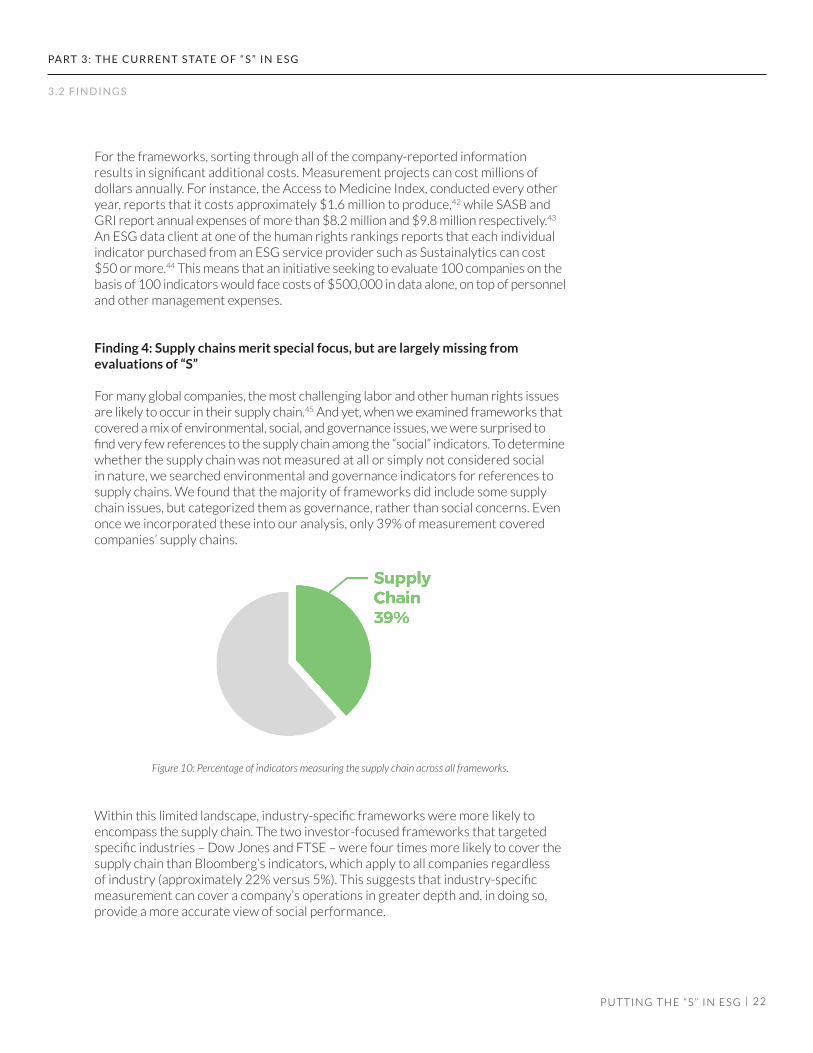
For many global companies, the most challenging labor and other human rights issues are likely to occur in their supply chain.45 And yet, when we examined frameworks that covered a mix of environmental, social, and governance issues, we were surprised to find very few references to the supply chain among the “social” indicators. To determinewhether the supply chain was not measured at all or simply not considered social in nature, we searched environmental and governance indicators for references to supply chains. We found that the majority of frameworks did include some supply chain issues, but categorized them as governance, rather than social concerns. Even once we incorporated these into our analysis, only 39% of measurement covered companies’ supply chains.
P U T T I N G T H E “ S ” I N E S G |
PA RT 3 : T H E C U R R E N T S TAT E O F “ S ” I N E S G
3 . 2 F I N D I N G S
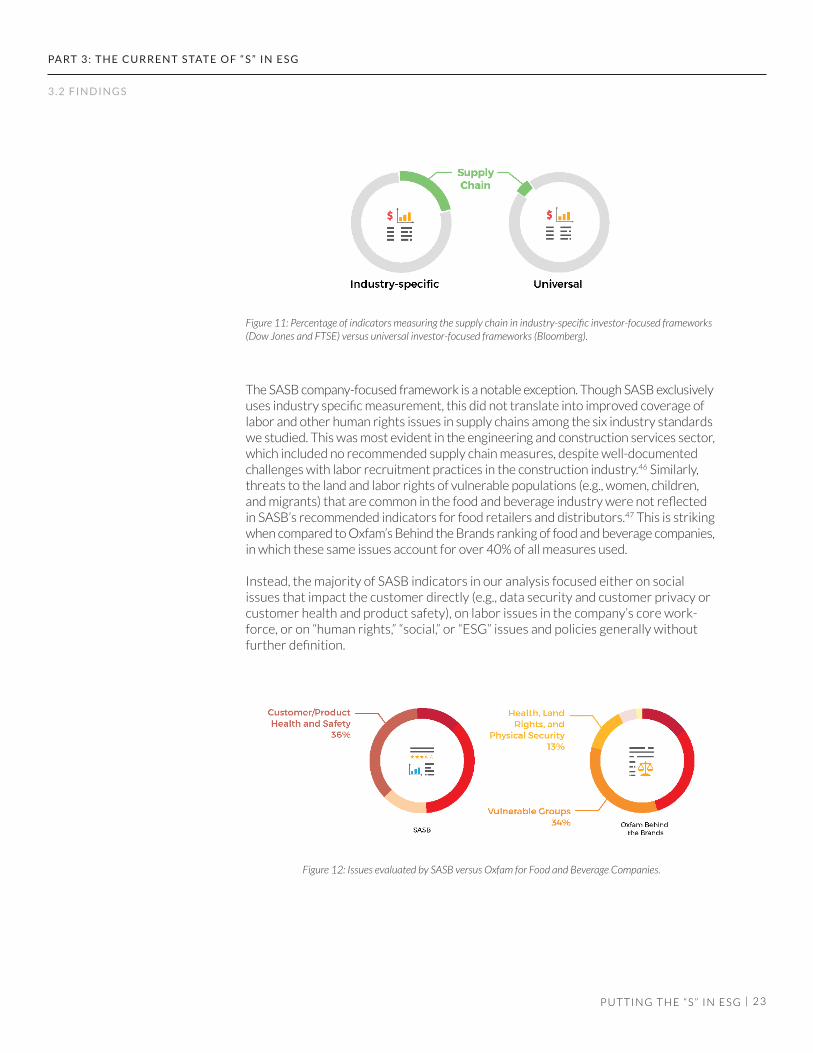
Within this limited landscape, industry-specific frameworks were more likely to encompass the supply chain. The two investor-focused frameworks that targeted specific industries – Dow Jones and FTSE – were four times more likely to cover the supply chain than Bloomberg’s indicators, which apply to all companies regardless of industry (approximately 22% versus 5%). This suggests that industry-specific measurement can cover a company’s operations in greater depth and, in doing so, provide a more accurate view of social performance.
Figure 10: Percentage of indicators measuring the supply chain across all frameworks.
2 3
The SASB company-focused framework is a notable exception. Though SASB exclusivelyuses industry specific measurement, this did not translate into improved coverage of labor and other human rights issues in supply chains among the six industry standards we studied. This was most evident in the engineering and construction services sector, which included no recommended supply chain measures, despite well-documented challenges with labor recruitment practices in the construction industry.46 Similarly, threats to the land and labor rights of vulnerable populations (e.g., women, children, and migrants) that are common in the food and beverage industry were not reflected in SASB’s recommended indicators for food retailers and distributors.47 This is striking when compared to Oxfam’s Behind the Brands ranking of food and beverage companies,in which these same issues account for over 40% of all measures used.
Instead, the majority of SASB indicators in our analysis focused either on social issues that impact the customer directly (e.g., data security and customer privacy or customer health and product safety), on labor issues in the company’s core work-force, or on “human rights,” “social,” or “ESG” issues and policies generally without further definition.
P U T T I N G T H E “ S ” I N E S G |
PA RT 3 : T H E C U R R E N T S TAT E O F “ S ” I N E S G
Figure 11: Percentage of indicators measuring the supply chain in industry-specific investor-focused frameworks (Dow Jones and FTSE) versus universal investor-focused frameworks (Bloomberg).
Figure 12: Issues evaluated by SASB versus Oxfam for Food and Beverage Companies.
3 . 2 F I N D I N G S
2 4
Finding 5: In the current ESG landscape, transparency too often functions as a substitute for more meaningful measurement of performance
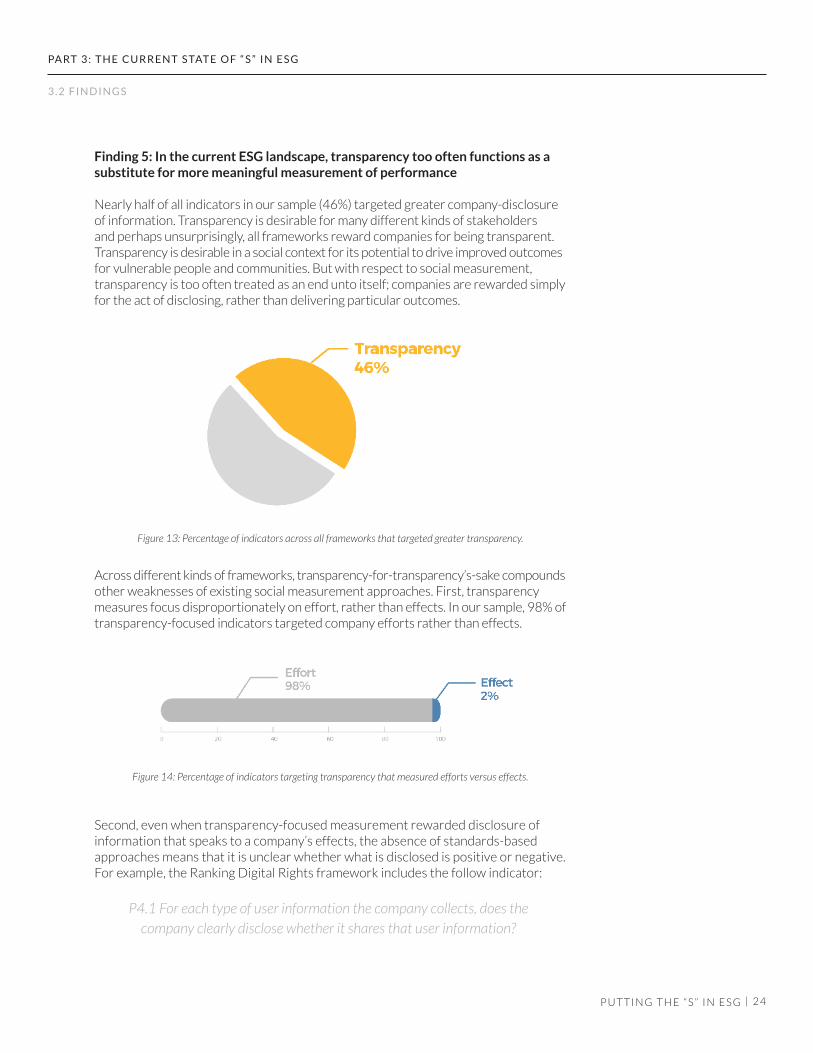
Nearly half of all indicators in our sample (46%) targeted greater company-disclosure of information. Transparency is desirable for many different kinds of stakeholders and perhaps unsurprisingly, all frameworks reward companies for being transparent. Transparency is desirable in a social context for its potential to drive improved outcomesfor vulnerable people and communities. But with respect to social measurement, transparency is too often treated as an end unto itself; companies are rewarded simply for the act of disclosing, rather than delivering particular outcomes.
Across different kinds of frameworks, transparency-for-transparency’s-sake compoundsother weaknesses of existing social measurement approaches. First, transparency measures focus disproportionately on effort, rather than effects. In our sample, 98% of transparency-focused indicators targeted company efforts rather than effects.
P U T T I N G T H E “ S ” I N E S G |
PA RT 3 : T H E C U R R E N T S TAT E O F “ S ” I N E S G
Figure 13: Percentage of indicators across all frameworks that targeted greater transparency.
Figure 14: Percentage of indicators targeting transparency that measured efforts versus effects.
Second, even when transparency-focused measurement rewarded disclosure of information that speaks to a company’s effects, the absence of standards-based approaches means that it is unclear whether what is disclosed is positive or negative. For example, the Ranking Digital Rights framework includes the follow indicator:
P4.1 For each type of user information the company collects, does the company clearly disclose whether it shares that user information?
3 . 2 F I N D I N G S

2 5
It is not clear from this indicator when and with whom a company ought to share user information. When measurement remains neutral about what “good” looks like for companies, investors and other stakeholders are either left without an under-standing of which companies are leaders, or must apply their own standard to make this determination.
Finally, the pressure for ever-increasing disclosure – especially of policies andprocedures – contributes to rising costs. Today, it is standard for companies to issues sustainability reports. Among the largest 250 global companies, the number issuing sustainability reports went from 35% in 1999 to 92% in 2015,48 with an averagelength of 98 pages.49 While the expectation that companies be transparent on social issues is certainly useful, it is not clear that the enormous effort around disclosure is resulting in disclosure of information that is useful to investors and others in evaluatingthe effects of a company’s operations.
Our analysis leads to four main conclusions:
1. Social measurement evaluates what is most convenient, not what is most meaningful. In the current ESG landscape, most measurement focuses on information that companies have ready access to and are willing to disclose. This effectively rewards companies for generating policies and procedures that relate to social issues, not for the outcomes of those efforts.
2. Current approaches are not likely to yield the information needed to identify social leaders. Many frameworks reward companies for expanded disclosure of social information. However, too often companiesare rewarded for producing and releasing ever more granular data about their policies and procedures. This practice requires companies to producea significant volume of information, without enough attention to quality or usefulness of that information. Disclosure-for-disclosure's-sake is not delivering significant benefit in evaluating companies’ social performance.
3. The lack of consistent standards underpinning social measurement increases costs and creates confusing “noisiness” across the ESG industry. The proliferation of frameworks without clear standards for social performance amplifies the cost of ESG evaluation for all stakeholders.Moreover, the lack of standards contributes to the proliferation of datathat does not lead to clear conclusions about which companies areperforming well, simply because there is no agreed-upon definition of what “good” looks like.
4. Existing measurement does not equip investors to respond to rising demand for socially responsible investing strategies and products.“Social” lags behind other elements of ESG in the development of consistent,efficient strategies for measuring company performance in a way that is
P U T T I N G T H E “ S ” I N E S G |
PA RT 3 : T H E C U R R E N T S TAT E O F “ S ” I N E S G
3.3 Conclusions
2 6
useful to investors. Measurement that does target investors tends to omit some of the most pressing human rights issues in a given industry. While there likely would be significant demand from millennial and women investors for financial products that reward social leaders and contribute to a fairer economy, investors are unable to deliver this kind of product in the current environment.
In addition to these general conclusions, we have identified the following strengths and limitations of company-, investor-, and human rights-focused frameworks.
• Company-focused Frameworks (GRI, SASB, and the UN Guiding Principles Framework). These are the most likely to measure effects. However, there is no standard reporting format or requirement that applies to all companiesusing these frameworks, because each company opts in to the measurementsof its choice. The quality of reporting through company-focused frameworkstherefore is highly variable, and its accuracy is unverified. These frameworksmay provide some examples of good indicators but, absent external verificationor consistent reporting requirements, are as yet insufficient to deliver deep understanding of companies’ social effects.
• Investor-focused Frameworks (Dow Jones, FTSE, and Bloomberg). These frameworks rank second among the three kinds of frameworks in measuring effects. They limit the scope of what they aim to measure, which may be a source of strength when attempting to measure outcomes and impacts. However, these frameworks often exclude the most significant human rights issues and aspects of company operations that are most relevant for human rights and labor, most notably the supply chain. Finally, the proprietarynature of investor-focused frameworks means that, while they are the most opaque regarding their methodologies, they have more resources to devote to diversifying data sources, including big data.
• Human Rights-focused Frameworks (Behind the Brands, Ranking Digital Rights, the Corporate Human Rights Benchmark, KnowTheChain, Access to Medicine Index, and the Enough Project’s ranking on conflict minerals). Because these frameworks are developed by experts with a comprehensiveunderstanding of the human rights issues a company is likely to face in its operations, they collectively cover the broadest scope of relevant issues and company operations. However, they are the most restricted to measuring company efforts – their policies, procedures, and governance structures – and are therefore the weakest in assessing actual performance. In addition, the relatively small number of companies they rate makes these frameworks less well suited to the needs of investors seeking to develop diverse portfolios.
Taken together, the combined strengths of existing frameworks suggest that here is an opportunity to begin to close the “S” gap through greater collaboration among industry participants and the development of shared standards. In the next section, we set out four principles and priority next steps to guide the way forward formeasuring “S”.
P U T T I N G T H E “ S ” I N E S G |
PA RT 3 : T H E C U R R E N T S TAT E O F “ S ” I N E S G
3 . 3 C O N C L U S I O N S
2 7
1. Measure companies’ real-world effects, not just their efforts
It is often said, “What’s measured improves.” It’s time for the ESG industry to measurethe real-world effects of companies on the human rights of the people and communitiesthey touch. This is no easy task – unlike measuring environmental effects, there is great potential to misrepresent social phenomena in the attempt to simplify what is inherently complex.50 A company’s impact is the most meaningful aspect of performanceto measure, but impacts occur on long time horizons and almost surely result from numerous intersecting institutions, policies, and practices. Linking social impacts to a specific policy, investment, or practice is challenging.
That said, it should be possible to identify and measure a few key features of companiesthat are good social performers. Companies that treat their employees well, havediverse and upwardly-mobile workforces, and source from safe and stable supply chains should be rewarded. An investor (and other stakeholders) should be able to ascertain whether a company is achieving these outcomes based on a handful of indicators.
For example, does the company have high supplier turnover? Are there frequent reports of wage and hour violations in supplier factories? Are there frequent reports of accidents in the supply chain? How does one company compare to its competitors? This has little to do with how many trainings or policy commitments a company has made, but with the effects of those activities. It’s possible that these indicators may need to be complemented with qualitative analysis that helps to capture context and avoid gaming.
More empirical research is needed to strengthen and inform the development of future indicators in areas such as: the correlation between social performance and financial performance over time; the relationship between development of social policies and delivery of social outcomes; the comparability of social risks among industry peers; and the availability and accuracy of social data generated by various external stakeholders.
2. Diversify the data – go beyond company disclosure
As currently structured, the ESG industry is too dependent on companies’ discretion in what they choose to disclose. To be sure, companies must disclose information about their operations if investors and others are to understand their social effects or their risk and value propositions. Companies in the end have the best access to information on the social effects of their operations. A core tension that the ESG industry will have to overcome is how to access meaningful, comparable information generated by companies, while maintaining independence from them.
Advances in government requirements51 around ESG reporting are a promising way forward to strengthen the comparability and reliability of ESG data, especially
P U T T I N G T H E “ S ” I N E S G |
PA RT 4 : T H E WAY F O R WA R D
Part 4: The Way Forward
4.1 Principles for Measuring “S”
2 8
if companies face penalties for reporting false information. Regulatory innovations in California, the UK, and France are early examples of governments establishing a baseline for reporting.52 These should be strengthened to include penalties for false disclosures, and to ensure that companies report meaningful, comparable data.Governments also have an important role to play in establishing standards for companyperformance as part of their procurement requirements.
Diversifying sources of data that inform ESG assessments will require looking beyondcompanies themselves to assess companies’ performance. There are some early encouraging signs that this already is beginning to happen. In our own research on the apparel supply chain, for example, a shift occurred in 2014 when the government of Bangladesh and local manufacturers’ trade associations disclosed factory data at a national level.53 This data belied what companies had reported themselves about the size of the factory base in Bangladesh and revealed that the apparel supply chain in Bangladesh was about 65% bigger than previously estimated.54 Stakeholders in the ESG industry should be looking for other innovative ways to capture a fuller picture of “S”, potentially using big data, in addition to the news and NGO reporting that already are part of some ESG frameworks.
3. Establish clear standards for evaluating “S”
For ESG measurement to identify and reward social leaders, it must rely on sharedstandards that enable comparisons of industry competitors using a commonframework. Naturally there is a tension between developing standards that are easy to apply and the need to adapt to changing conditions across industries and in the various sociopolitical, legal, and economic environments where companies operate. However, at present, the complete lack of clear social standards has resulted in a “noisiness” that fundamentally compromises the ESG industry’s effectiveness and exaggerates its costs.
Industry-specific frameworks that are developed on the basis of established standardsand periodically reviewed for relevance by or in collaboration with subject area experts and key stakeholders offer a good way forward. Companies operating in the same industry are likely to face similar risks. Rather than covering the full scope of human rights issues, Industry-specific indicators can focus on the most relevant risks that companies in that industry are likely to face. While some existing frameworks apply industry-specific approaches, these have not yet resulted in widespread agreement on a shared set of standards. More work is therefore needed to reconcile the myriad approaches that currently exist for defining and measuring social performance. This will include agreeing upon the most important issues to measure, the scope of a company’s operations that ought to be considered, as well as what good looks like and how this can be captured by an indicator. In developing standards that are relevant to an investor audience, it will be important to establish a connection between social performance and long-term value. This means developing a standard for high performing companies that manage their operations and their workforces in a sustainable way over the long-term.
P U T T I N G T H E “ S ” I N E S G |
PA RT 4 : T H E WAY F O R WA R D
4 . 1 P R I N C I P L E S F O R M E A S U R I N G “ S ”
2 9
4. Target investors as the primary audience
Companies are accountable to their investors for best use of their capital. Thisrelationship empowers investors to influence companies to adopt business practices that result in greater respect for human rights. However, when it comes to “S”, very few existing efforts target investors as their primary audience. As a result, there is a dearth of measurements that offer investors assessments of companies on labor and other human rights standards that are packaged for their easy use. The development of social measures that identify the strongest social performers would enable investorsto reward true human rights leaders. It also would lay the groundwork for making the link between social performance, long-term stability, and economic benefit.
This means engaging investors in the development of standards and new methods of collecting and interpreting information. Some of the biggest firms have establishedin-house units to assess ESG, in part because the broader ESG industry is notserving their interests in assessing ESG risks. As in other areas of financial services, they are turning to advanced technical tools to assess these risks.55 Going forward, the ESG industry should identify best practices from the in-house experience of large investment firms (to the extent that these methodologies are not proprietary) and seek to encourage greater availability of data in the areas that are most helpful for distinguishing leaders and laggards on “S” factors.
All stakeholders have a role to play in realizing social measurement that adheres to these principles. We recommend the following next steps:
• Companies should redirect internal resources away from reportinginformation on their commitments and processes to gathering and then disclosing information on the effectiveness of these efforts on the ground, according to common standards. Companies should contribute to the development of these standards for evaluating the most pressing labor and other human rights challenges they face.
• Investors and consumers should demand accurate performance-based social measures and data that will allow them to meaningfully assess industry competitors on social performance.
• Asset owners and managers, particularly large institutional investors with expansive and diverse portfolios, should examine and articulate thesystemic social and human rights risks they see among their investments. On the basis of what they find, investors should engage with the companies they hold, reinforcing the importance they place on aligning themselves with companies that are striving to understand and tackle the difficult social and human rights issues they face throughout their operations. Doing so will help to make the case for patient capital and longer-term investment models.
• NGOs should share their expertise with companies and investors to develop social measurement that evaluates company effects on the most
P U T T I N G T H E “ S ” I N E S G |
PA RT 4 : T H E WAY F O R WA R D
4.2 Recommen-dations to Key Stakeholders
3 0
pressing labor and other human rights issues they face, including impacts in the supply chain.
• Governments should continue to explore regulation that helps to standardizethe social information companies disclose and to clarify that public fiduciaries not only can but ought to consider social sustainability in their investment choices. Governments also should incorporate standards for social performance into their own procurement requirements.
• Creators of measurement frameworks should prioritize transparency on company impacts, rather than policies and processes. In doing so, they can play an important role in helping to identify and define industry-specific standards against which company performance is evaluated. In addition, more work is needed to interrogate the assumptions that have guided many of the measurement initiatives to date, including: the correlation between the social policies or procedures and social outcomes; the comparability of social risks and challenges among industry peers; and the availability and accuracy of social data generated by various stakeholders.
P U T T I N G T H E “ S ” I N E S G |
PA RT 4 : T H E WAY F O R WA R D
4 . 2 R E C O M M E N DAT I O N S TO K E Y S TA K E H O L D E R S
3 1P U T T I N G T H E “ S ” I N E S G |
A P P E N D I X 1 . T H E R I S E O F S O C I A L M E A S U R E M E N T
Though social factors are least developed in the investment context, governments and civil society groups have long used social indicators to understand and improve social issues. As early as 1810, social reform groups in Philadelphia used detention data to advocate for prison reform, while in Europe, indicators were used to help understand the causes of epidemics in industrial cities.56 The modern approach to social measurement and reporting arose out of the social indicator movement of the United States in the 1960s.57
The Social Indicator Movement (1960s)
In 1946 Congress established the Council of Economic Advisors (CEA), reflecting a post-depression and post-war focus on economic factors.58 But critics argued that economic measurement alone was not providing an adequate understanding of the country’s development. Increasingly, policy makers called for well-defined social metrics and a national-level advisory function analogous to the CEA to help achieve the country’s economic and social goals.59
In 1966, NASA developed social indicators to better understand the social impacts of the space program.60 The project highlighted the need for social indicator systems to measure and evaluate progress toward national goals and to predict social events and crises.61 It also spurred a range of other social indicator initiatives, books, and articles in the 1970s, including the first indicators aimed at understanding citizens’ views of their wellbeing.62
Other nations and multinational organizations began similar efforts, which contributedto the emergence of a global social measurement movement.63 However, by the early 1980s, the movement had stalled in the United States.64 Though Congress put forward legislation proposing a Council of Social Advisors, it was never adopted. Other efforts to develop comprehensive social indicators similarly struggled under political pressures.65
Expansion of Social Indicators (1980s – 2000s)
Beginning in the 1980s, a number of new efforts emerged that sought to understand and compare the governance, social, and environmental conditions of countries. These built on efforts by the United Nations to establish statistics departments that began inthe 1950s.66 By the late 1980s, multinational organizations’ use of indicators had pickedup dramatically.67 During this period, the Organization for Economic Cooperationand Development, the World Bank, the World Health Organization, and various United Nations agencies all developed measurement frameworks, and in some cases ratings systems that assessed country performance against social indicators.68
In 2002, President George W. Bush established the Millennium Challenge Corporation(MCC), which evaluates potential US aid recipients on the basis of both economic and
Appendix 1. The Rise of Social Measurement
3 2
political commitments and past performance.69 It drew on existing multinational and NGO ratings and rankings, which gave many of these initiatives greater weight.70
Criticisms of Social Indicators
These and other country rankings on social performance have been studied extensivelyand subject to considerable criticism. The most common criticism centers on the inherently reductive nature of rankings and their potential to misrepresent social phenomena in the attempt to simplify what is inherently complex.71 The heavy reliance on quantitative proxies exacerbates these concerns.
Critics refer to what they term a “performance paradox,” where weak correlation between performance indicators and actual performance creates problematicincentives.72 This most commonly occurs when there is too great a focus on proceduralindicators, or when objectives or goals are unclear or difficult to measure, as is often the case with social measurements.73
The result can be:
• Tunnel vision – where performance measurement focuses on what is easily quantifiable, not most meaningful.
P U T T I N G T H E “ S ” I N E S G |
A P P E N D I X 1 . T H E R I S E O F S O C I A L M E A S U R E M E N T
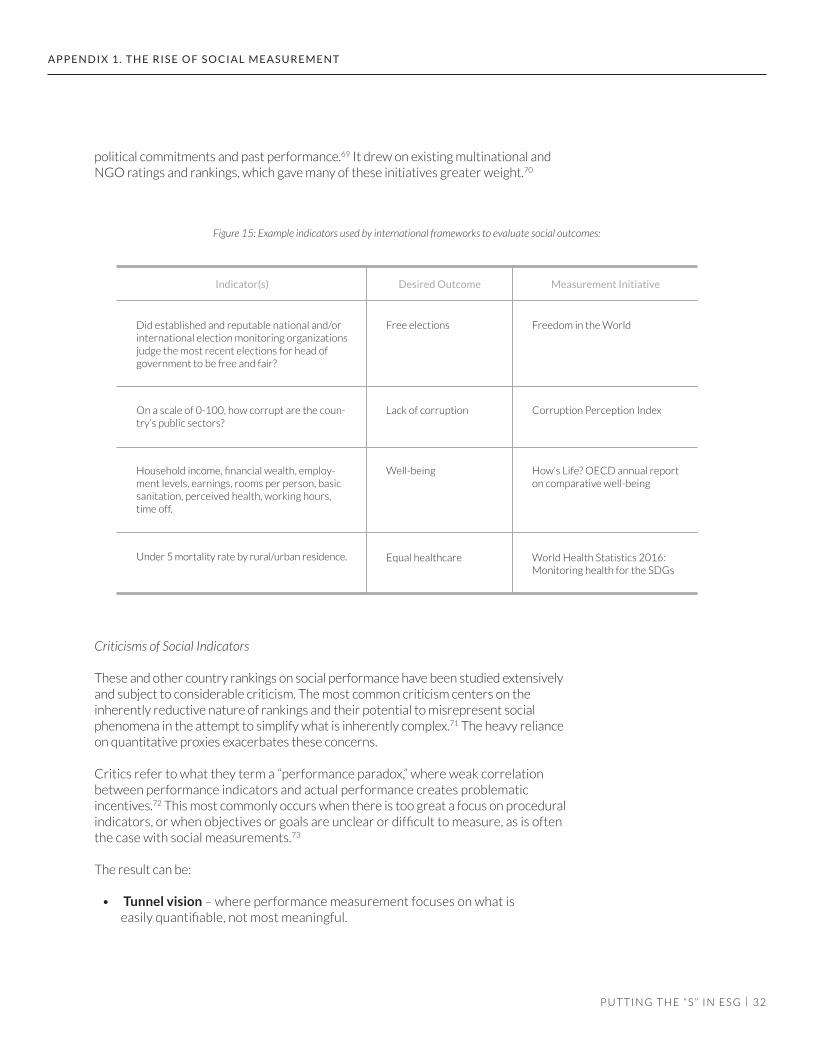
Indicator(s) Desired Outcome Measurement Initiative
Free electionsDid established and reputable national and/or international election monitoring organizations judge the most recent elections for head of government to be free and fair?
On a scale of 0-100, how corrupt are the coun-try’s public sectors?
Household income, financial wealth, employ-ment levels, earnings, rooms per person, basic sanitation, perceived health, working hours, time off.
Under 5 mortality rate by rural/urban residence.
Lack of corruption
Well-being
Equal healthcare
Freedom in the World
Corruption Perception Index
How’s Life? OECD annual report on comparative well-being
World Health Statistics 2016: Monitoring health for the SDGs
Figure 15: Example indicators used by international frameworks to evaluate social outcomes:
3 3
• Measure fixation – where the person or entity under evaluation focuses effort on maximizing performance against the metric rather than achieving the underlying objectives.
• Ossification – where the person or entity under evaluation prefers known paths that will maximize performance against established measures to creative and innovative approaches and solutions.74
Despite these challenges, social indicators, rankings, and ratings are here to stay. As Nobel Laureate Amartya Sen observed, people will always seek out “crude but convenient” measures.75 The core challenge for any social measurement is how to improve the accuracy and reliability of such indicators, while ensuring that they are simple, credible, and straightforward, and most importantly drive the desired changesin behavior.
Lessons from Measuring States: Monitoring vs. Evaluation
One of the biggest challenges in measuring social performance is distinguishing between effort and effect.76 States and regional unions including the United States and the European Union, as well as multinational bodies, like the United Nations and the World Bank, commonly use monitoring and evaluation frameworks to define and assess different aspects of performance.77 Under this model, “monitoring” focuses on inputs, activities, and the immediate outputs they yield; while “evaluation,” focuses on the broader impact and effectiveness of a program or set of actions.78
Monitoring focuses on effort and is achieved through three types of indicators:
• Input – resources invested, including financial contributions, human resources, and intellectual or physical capital.
• Activity – actions taken, including creation of policies, procedures and, commitments; establishment and oversight of structures, mechanisms, and institutions; as well as trainings and stakeholder engagement efforts.
• Output – immediate results of activities, often looking for evidence that products or services are used by the intended beneficiaries, e.g., number of people trained or audited, users of remedial mechanisms, users of handbooks or guidelines, etc.
Evaluation of effect requires two additional indicator styles:
• Outcome – focus on the short- and medium-term results of outputs on society. This might include the number of rights violations or employment rates.
• Impact – measure longer-term and larger-scale changes, e.g., increases or decreases in social stability or crises or the rate and distribution of economic growth. Impacts are often the effect of numerous intersecting outcomes over time.
P U T T I N G T H E “ S ” I N E S G |
A P P E N D I X 1 . T H E R I S E O F S O C I A L M E A S U R E M E N T
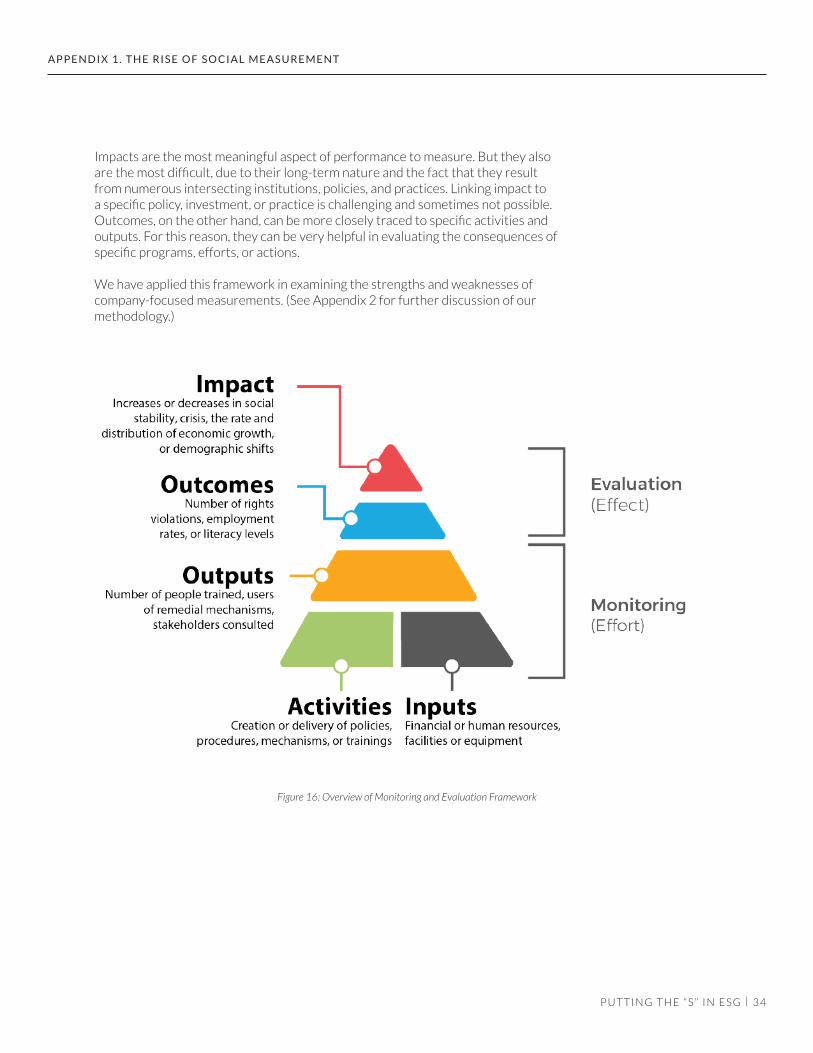
3 4
Impacts are the most meaningful aspect of performance to measure. But they also are the most difficult, due to their long-term nature and the fact that they result from numerous intersecting institutions, policies, and practices. Linking impact to a specific policy, investment, or practice is challenging and sometimes not possible. Outcomes, on the other hand, can be more closely traced to specific activities and outputs. For this reason, they can be very helpful in evaluating the consequences of specific programs, efforts, or actions.
We have applied this framework in examining the strengths and weaknesses of company-focused measurements. (See Appendix 2 for further discussion of our methodology.)
P U T T I N G T H E “ S ” I N E S G |
A P P E N D I X 1 . T H E R I S E O F S O C I A L M E A S U R E M E N T
Figure 16: Overview of Monitoring and Evaluation Framework
P U T T I N G T H E “ S ” I N E S G |
A P P E N D I X 2 . M E T H O D O LO G Y
To better understand how companies’ social sustainability performance is currently measured, we conducted a two-phase study. We first reviewed academic literature and media sources on social measurement, sustainable investing, and trends in the ESG industry, as well as the materials and methodologies for leading measurement efforts. On the basis of this review, we generated a central hypothesis: that social measurement tends to focus on company efforts rather than effects. To test this hypothesis, we then identified and systematically coded 12 prominent measurement frameworks according to a standard monitoring and evaluation framework (see Appendix 1 for more details). We selected this framework for two reasons: (1) it is structured to help separate indicators that focus on efforts (monitoring) from those that focus on effect (evaluation); and (2) it is commonly used by governments to measure social factors. We additionally examined the scope of issues, procedures, and operations that social indicators measure to further understand how “social” is currently defined in practice.
Scope and selection criteria
In selecting the frameworks for analysis, we sought a group that was representative of the most useful measurement tools available for investors seeking to understandsocial performance. To achieve this aim, we prioritized frameworks that either investorshave indicated they use most often (i.e., company reporting, Bloomberg, DJSI) or are most likely to rigorously evaluate sustainability and human rights performance (i.e., those developed by sustainability and human rights experts).
In addition to these criteria, our sample was limited by two practical considerations: (1) all frameworks needed to include at least some socially-focused indicators; and (2) we had to have access to the text of the indicators used to measure or evaluate companies. As a result of these additional considerations efforts like the Carbon Disclosure Project and MSCI, though popular with investors, are not included in the study (due to an environmental focus in the first case and unavailability of indicators in the second).
Frameworks selected
After applying our selection criteria and adjusting for practical considerations, we selected the following frameworks to code:
Company-Focused
1. Global Reporting Initiative (GRI):
• General Disclosures (102), Management Approach (103), and all social reporting standards (401-419)
Appendix 2. Methodology
3 5
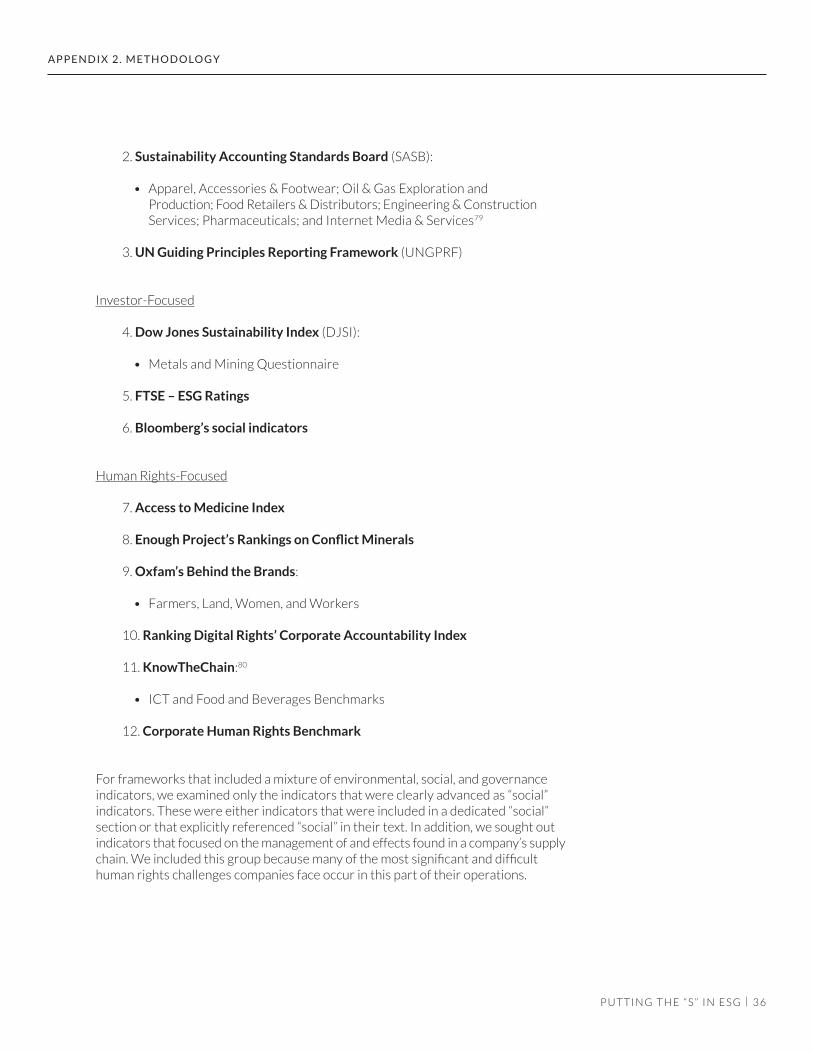
3 6
2. Sustainability Accounting Standards Board (SASB):
• Apparel, Accessories & Footwear; Oil & Gas Exploration andProduction; Food Retailers & Distributors; Engineering & Construction Services; Pharmaceuticals; and Internet Media & Services79
3. UN Guiding Principles Reporting Framework (UNGPRF)
Investor-Focused
4. Dow Jones Sustainability Index (DJSI):
• Metals and Mining Questionnaire
5. FTSE – ESG Ratings
6. Bloomberg’s social indicators
Human Rights-Focused
7. Access to Medicine Index
8. Enough Project’s Rankings on Conflict Minerals
9. Oxfam’s Behind the Brands:
• Farmers, Land, Women, and Workers
10. Ranking Digital Rights’ Corporate Accountability Index
11. KnowTheChain:80
• ICT and Food and Beverages Benchmarks
12. Corporate Human Rights Benchmark
For frameworks that included a mixture of environmental, social, and governance indicators, we examined only the indicators that were clearly advanced as “social” indicators. These were either indicators that were included in a dedicated “social” section or that explicitly referenced “social” in their text. In addition, we sought out indicators that focused on the management of and effects found in a company’s supplychain. We included this group because many of the most significant and difficult human rights challenges companies face occur in this part of their operations.
P U T T I N G T H E “ S ” I N E S G |
A P P E N D I X 2 . M E T H O D O LO G Y
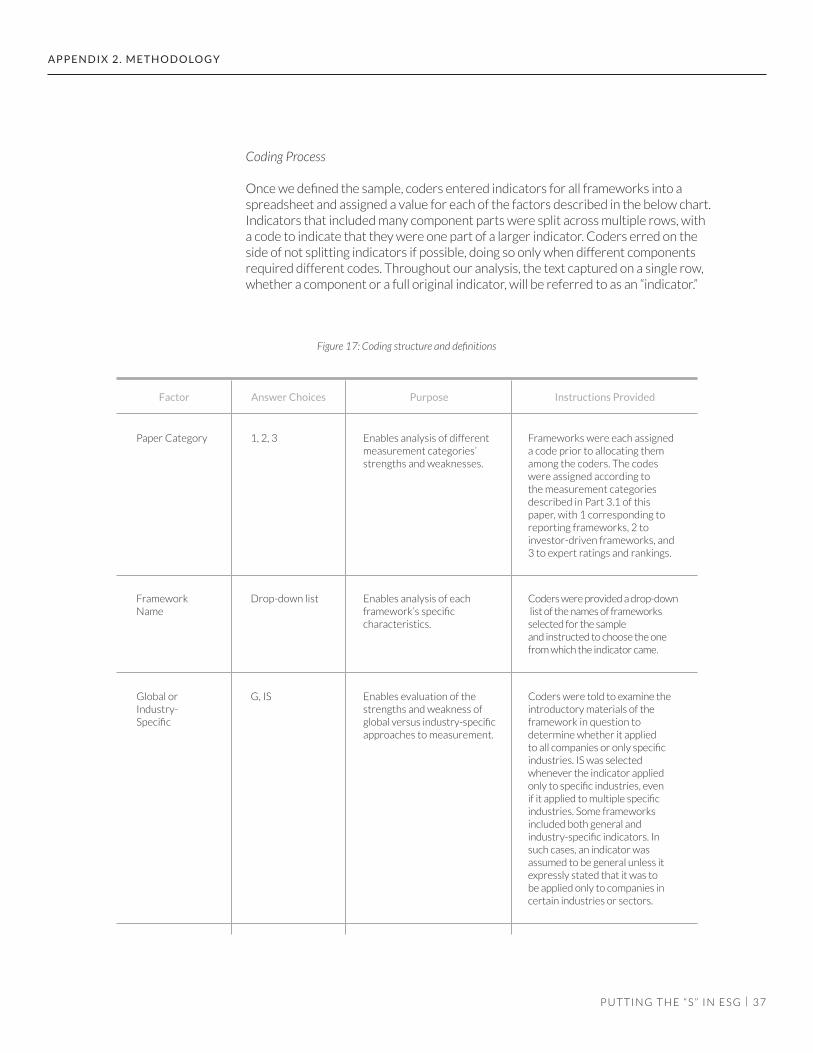
3 7
Coding Process
Once we defined the sample, coders entered indicators for all frameworks into a spreadsheet and assigned a value for each of the factors described in the below chart. Indicators that included many component parts were split across multiple rows, with a code to indicate that they were one part of a larger indicator. Coders erred on the side of not splitting indicators if possible, doing so only when different components required different codes. Throughout our analysis, the text captured on a single row, whether a component or a full original indicator, will be referred to as an “indicator.”
P U T T I N G T H E “ S ” I N E S G |
A P P E N D I X 2 . M E T H O D O LO G Y
Factor Answer Choices Purpose Instructions Provided
1, 2, 3Paper Category
Framework Name
Drop-down list
Enables analysis of different measurement categories’ strengths and weaknesses.
Frameworks were each assigned a code prior to allocating them among the coders. The codes were assigned according to the measurement categories described in Part 3.1 of this paper, with 1 corresponding to reporting frameworks, 2 toinvestor-driven frameworks, and 3 to expert ratings and rankings.
Enables analysis of each framework’s specificcharacteristics.
Coders were provided a drop-down list of the names of frameworks selected for the sampleand instructed to choose the one from which the indicator came.
Figure 17: Coding structure and definitions
G, ISGlobal orIndustry-Specific
Enables evaluation of the strengths and weakness of global versus industry-specificapproaches to measurement.
Coders were told to examine the introductory materials of theframework in question todetermine whether it applied to all companies or only specific industries. IS was selectedwhenever the indicator applied only to specific industries, even if it applied to multiple specific industries. Some frameworks included both general andindustry-specific indicators. In such cases, an indicator was assumed to be general unless it expressly stated that it was to be applied only to companies in certain industries or sectors.
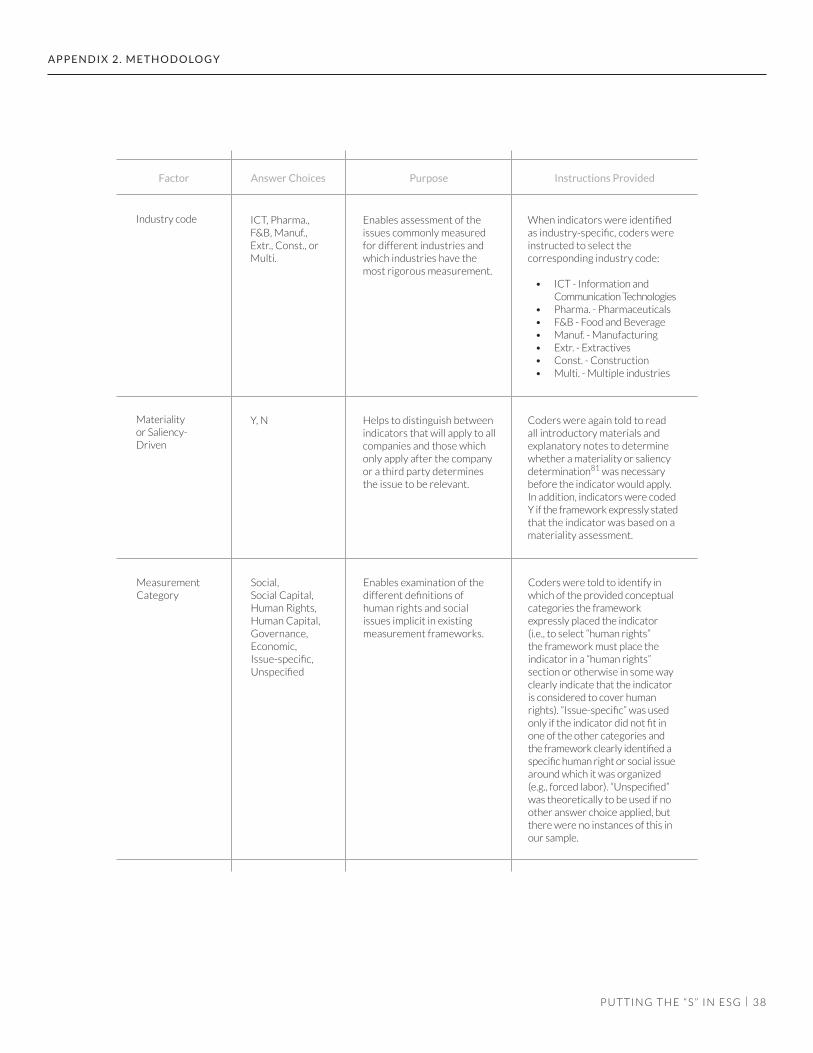
3 8P U T T I N G T H E “ S ” I N E S G |
A P P E N D I X 2 . M E T H O D O LO G Y
Factor Answer Choices Purpose Instructions Provided
Industry code
Materialityor Saliency-Driven
ICT, Pharma., F&B, Manuf., Extr., Const., or Multi.
Y, N
Enables assessment of the issues commonly measured for different industries and which industries have the most rigorous measurement.
Helps to distinguish between indicators that will apply to all companies and those which only apply after the company or a third party determines the issue to be relevant.
When indicators were identified as industry-specific, coders were instructed to select thecorresponding industry code:
• ICT - Information andCommunication Technologies
• Pharma. - Pharmaceuticals• F&B - Food and Beverage• Manuf. - Manufacturing• Extr. - Extractives• Const. - Construction• Multi. - Multiple industries
Coders were again told to read all introductory materials and explanatory notes to determine whether a materiality or saliency determination81 was necessarybefore the indicator would apply. In addition, indicators were codedY if the framework expressly statedthat the indicator was based on a materiality assessment.
Social, Social Capital, Human Rights, Human Capital, Governance, Economic, Issue-specific, Unspecified
Measurement Category
Enables examination of the different definitions ofhuman rights and social issues implicit in existing measurement frameworks.
Coders were told to identify in which of the provided conceptualcategories the framework expressly placed the indicator (i.e., to select “human rights” the framework must place the indicator in a “human rights” section or otherwise in some way clearly indicate that the indicator is considered to cover human rights). “Issue-specific” was used only if the indicator did not fit in one of the other categories and the framework clearly identified a specific human right or social issuearound which it was organized (e.g., forced labor). “Unspecified” was theoretically to be used if no other answer choice applied, but there were no instances of this in our sample.
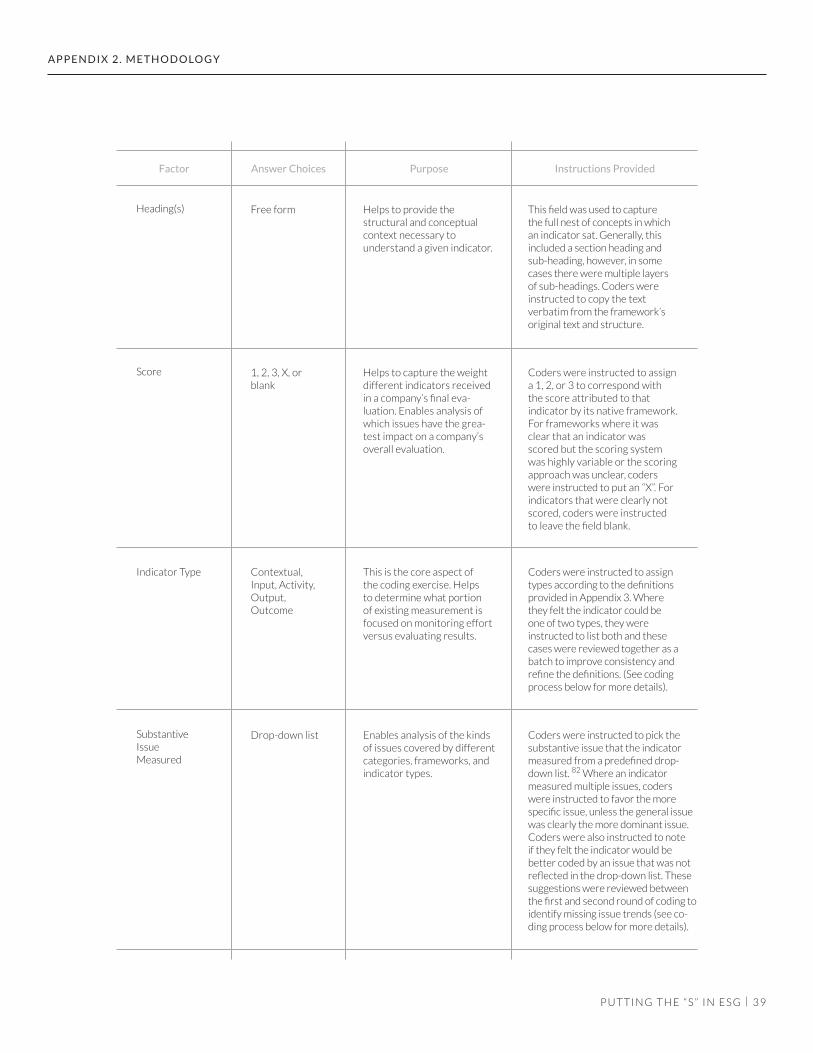
3 9P U T T I N G T H E “ S ” I N E S G |
A P P E N D I X 2 . M E T H O D O LO G Y
Factor Answer Choices Purpose Instructions Provided
Heading(s)
Score
Free form
1, 2, 3, X, or blank
Helps to provide thestructural and conceptual context necessary tounderstand a given indicator.
Helps to capture the weight different indicators received in a company’s final eva-luation. Enables analysis of which issues have the grea-test impact on a company’s overall evaluation.
This field was used to capture the full nest of concepts in which an indicator sat. Generally, this included a section heading and sub-heading, however, in some cases there were multiple layers of sub-headings. Coders wereinstructed to copy the textverbatim from the framework’s original text and structure.
Coders were instructed to assign a 1, 2, or 3 to correspond with the score attributed to that indicator by its native framework. For frameworks where it was clear that an indicator was scored but the scoring system was highly variable or the scoring approach was unclear, coders were instructed to put an “X”. For indicators that were clearly not scored, coders were instructed to leave the field blank.
Contextual, Input, Activity, Output,Outcome
Indicator Type This is the core aspect of the coding exercise. Helps to determine what portion of existing measurement is focused on monitoring effort versus evaluating results.
Coders were instructed to assign types according to the definitions provided in Appendix 3. Where they felt the indicator could be one of two types, they were instructed to list both and these cases were reviewed together as a batch to improve consistency and refine the definitions. (See coding process below for more details).
Substantive IssueMeasured
Drop-down list Enables analysis of the kinds of issues covered by different categories, frameworks, and indicator types.
Coders were instructed to pick the substantive issue that the indicatormeasured from a predefined drop-down list. 82 Where an indicator measured multiple issues, coders were instructed to favor the more specific issue, unless the general issue was clearly the more dominant issue. Coders were also instructed to note if they felt the indicator would be better coded by an issue that was not reflected in the drop-down list. These suggestions were reviewed between the first and second round of coding to identify missing issue trends (see co-ding process below for more details).
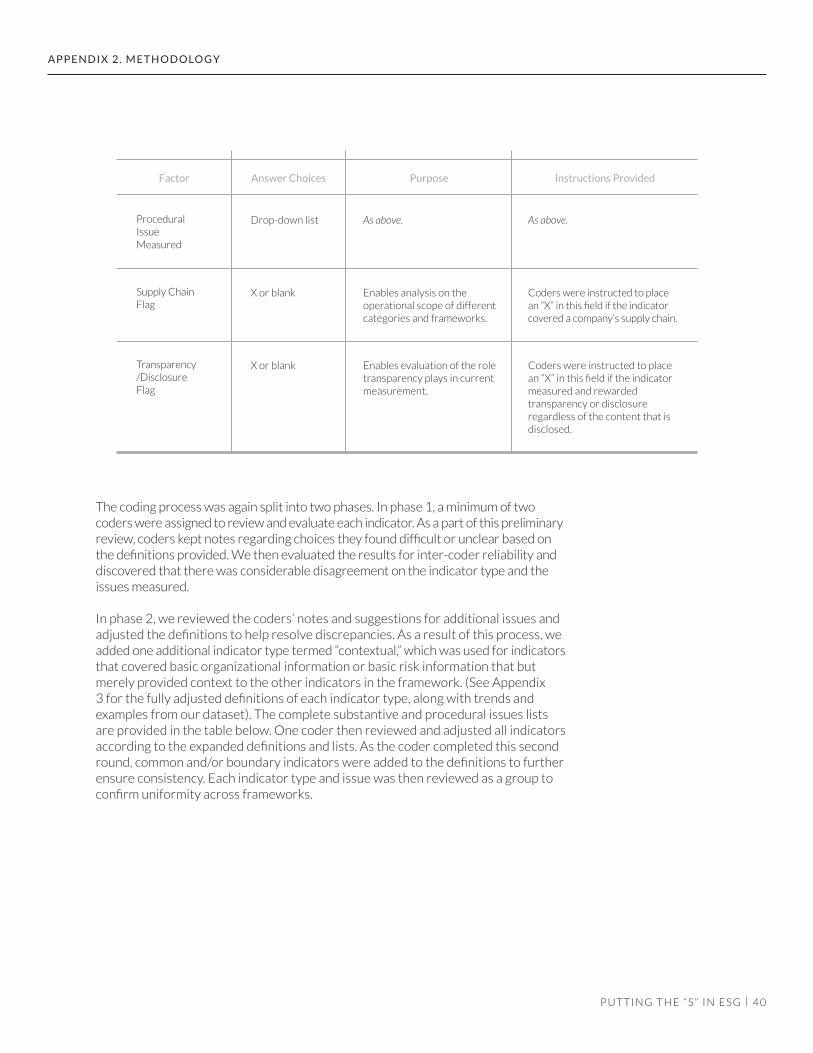
4 0P U T T I N G T H E “ S ” I N E S G |
A P P E N D I X 2 . M E T H O D O LO G Y
Factor Answer Choices Purpose Instructions Provided
Supply Chain Flag
Transparency/Disclosure Flag
Procedural IssueMeasured
X or blank
X or blank
Drop-down list
Enables analysis on the operational scope of different categories and frameworks.
Enables evaluation of the role transparency plays in current measurement.
As above.
Coders were instructed to place an “X” in this field if the indicator covered a company’s supply chain.
Coders were instructed to place an “X” in this field if the indicator measured and rewardedtransparency or disclosure regardless of the content that is disclosed.
As above.
The coding process was again split into two phases. In phase 1, a minimum of twocoders were assigned to review and evaluate each indicator. As a part of this preliminary review, coders kept notes regarding choices they found difficult or unclear based on the definitions provided. We then evaluated the results for inter-coder reliability and discovered that there was considerable disagreement on the indicator type and the issues measured.
In phase 2, we reviewed the coders’ notes and suggestions for additional issues and adjusted the definitions to help resolve discrepancies. As a result of this process, we added one additional indicator type termed “contextual,” which was used for indicatorsthat covered basic organizational information or basic risk information that butmerely provided context to the other indicators in the framework. (See Appendix 3 for the fully adjusted definitions of each indicator type, along with trends and examples from our dataset). The complete substantive and procedural issues lists are provided in the table below. One coder then reviewed and adjusted all indicators according to the expanded definitions and lists. As the coder completed this second round, common and/or boundary indicators were added to the definitions to further ensure consistency. Each indicator type and issue was then reviewed as a group to confirm uniformity across frameworks.
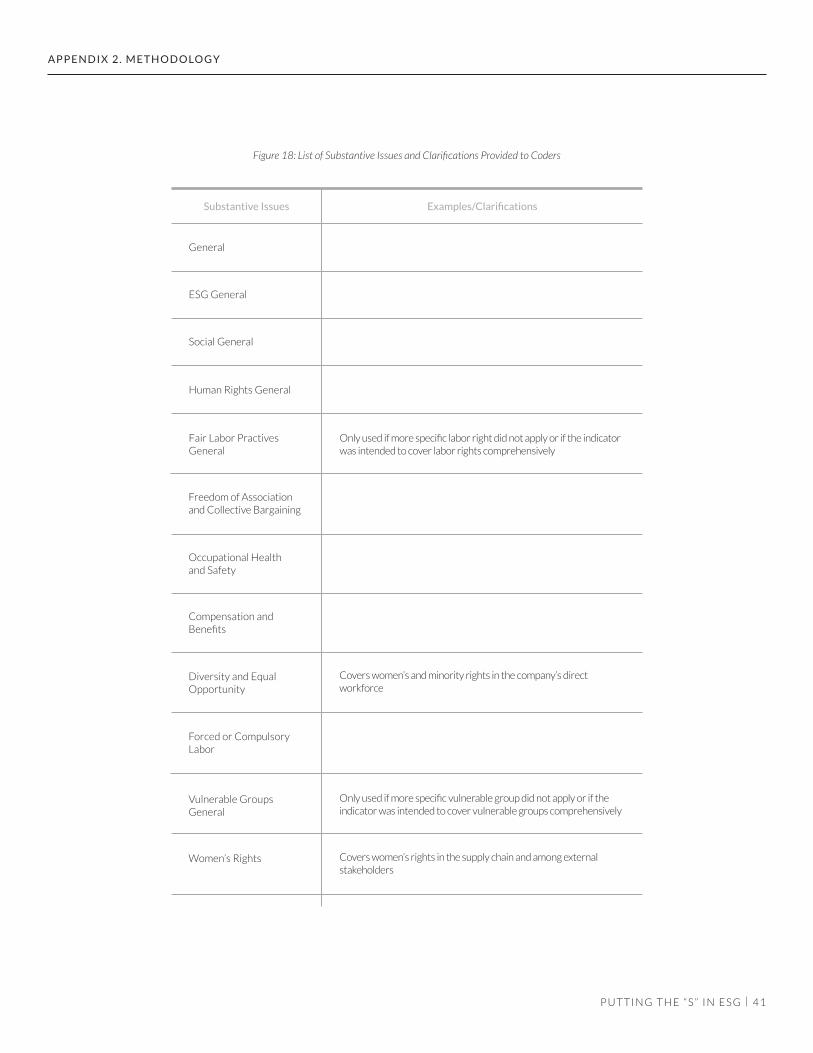
4 1P U T T I N G T H E “ S ” I N E S G |
A P P E N D I X 2 . M E T H O D O LO G Y
Substantive Issues Examples/Clarifications
General
ESG General
Social General
Human Rights General
Fair Labor Practives General
Only used if more specific labor right did not apply or if the indicator was intended to cover labor rights comprehensively
Figure 18: List of Substantive Issues and Clarifications Provided to Coders
Freedom of Association and Collective Bargaining
Occupational Healthand Safety
Compensation and Benefits
Diversity and Equal Opportunity
Vulnerable Groups General
Forced or Compulsory Labor
Covers women’s and minority rights in the company’s direct workforce
Only used if more specific vulnerable group did not apply or if the indicator was intended to cover vulnerable groups comprehensively
Women’s Rights Covers women’s rights in the supply chain and among external stakeholders
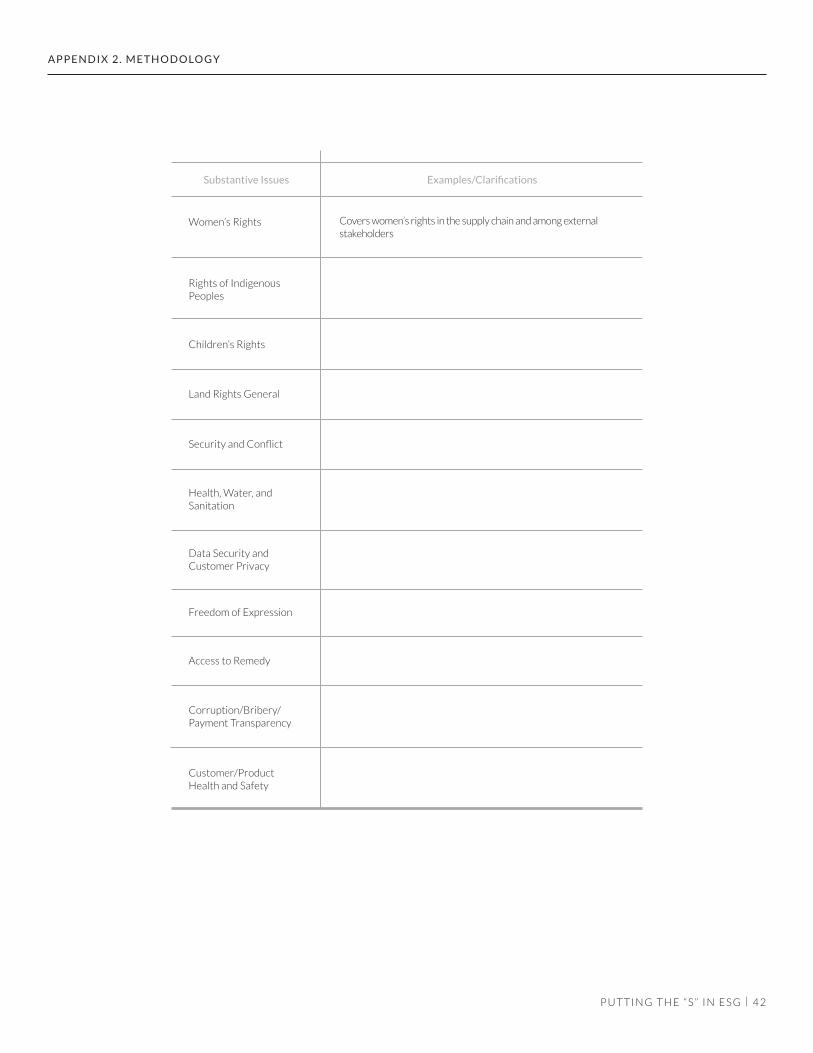
4 2P U T T I N G T H E “ S ” I N E S G |
A P P E N D I X 2 . M E T H O D O LO G Y
Substantive Issues Examples/Clarifications
Women’s Rights
Rights of Indigenous Peoples
Children’s Rights
Land Rights General
Security and Conflict
Covers women’s rights in the supply chain and among external stakeholders
Health, Water, and Sanitation
Data Security andCustomer Privacy
Freedom of Expression
Access to Remedy
Customer/Product Health and Safety
Corruption/Bribery/Payment Transparency

4 3P U T T I N G T H E “ S ” I N E S G |
A P P E N D I X 2 . M E T H O D O LO G Y
Procedural Issues Examples/Clarifications
Policies andCommitments
Leadership Involvement
Governance Structure
Definitions and Scoping
Data Collection and Mapping
Includes distribution and translation of policies and alsosystemic judgment calls or aspirations (e.g., a policy ofrespecting women’s rights)
CEO/board involvement, statements, etc.
General management/oversight structures or processes, internal auditing, approach to implementation of policies (e.g., notification practices)
Figure 19: List of Procedural Issues and Clarifications Provided to Coders
Audits and External Assurance
Risk and Impact Assess-ment
Contracting andAgreements
Social and Human Rights Training
Compensation and Benefits
Recruitment andDevelopment
Ethical clauses, supplier requirements, purchasing practicesincluding sourcing preferences/avoidance
Use of compensation and benefits to achieve objectives, either because objective is higher wages or to advance human rights/social objectives through financial and performance incentives built into compensation structures
Training that is broader than social or human rights would beincluded in this category
Employee Engagement
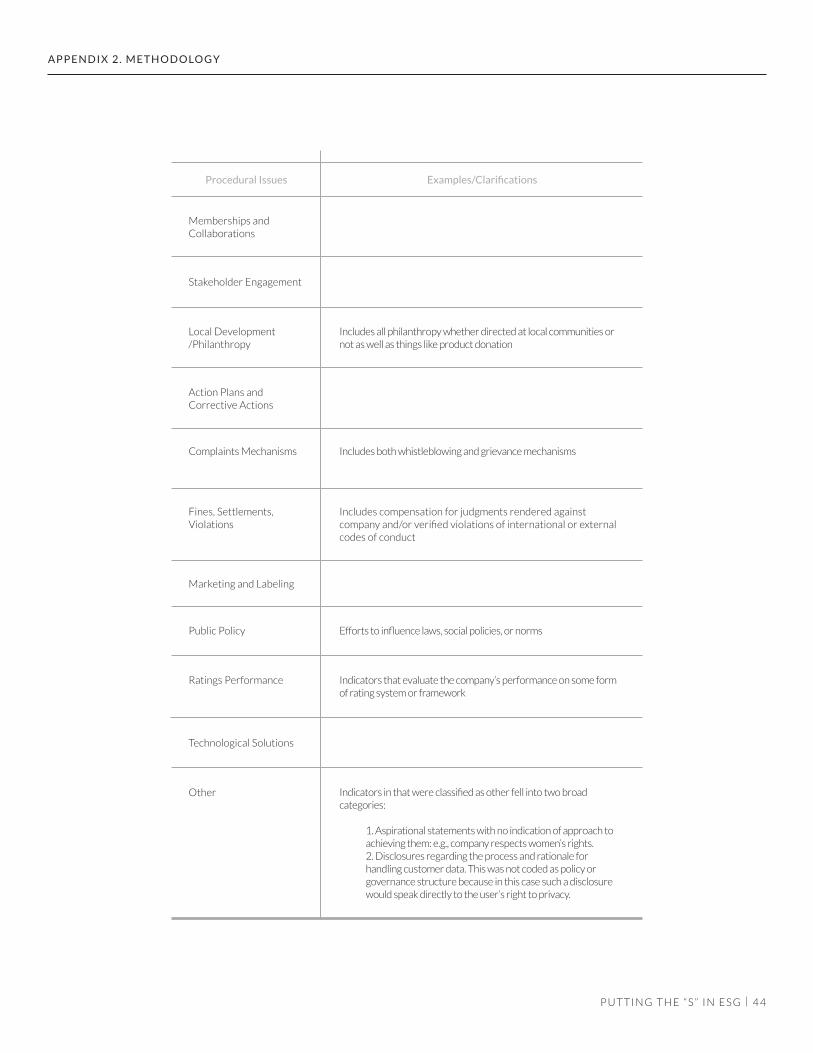
4 4P U T T I N G T H E “ S ” I N E S G |
A P P E N D I X 2 . M E T H O D O LO G Y
Procedural Issues Examples/Clarifications
Memberships andCollaborations
Stakeholder Engagement
Local Development/Philanthropy
Action Plans andCorrective Actions
Includes all philanthropy whether directed at local communities or not as well as things like product donation
Complaints Mechanisms
Fines, Settlements, Violations
Marketing and Labeling
Public Policy
Technological Solutions
Other
Ratings Performance
Includes both whistleblowing and grievance mechanisms
Includes compensation for judgments rendered against company and/or verified violations of international or external codes of conduct
Indicators in that were classified as other fell into two broad categories:
1. Aspirational statements with no indication of approach to achieving them: e.g., company respects women’s rights.2. Disclosures regarding the process and rationale for handling customer data. This was not coded as policy or governance structure because in this case such a disclosure would speak directly to the user’s right to privacy.
Efforts to influence laws, social policies, or norms
Indicators that evaluate the company’s performance on some form of rating system or framework

P U T T I N G T H E “ S ” I N E S G |
A P P E N D I X 3 . I N D I C ATO R T Y P E S – D E F I N I T I O N S , T R E N D S , A N D E X A M P L E S
As described in the report, 92% of the indicators in our sample measured company efforts and 8% measured effects. The below chart provides more detailed definitions of the indicator types associated with these two categories, as well as trends and examples for each type. For the purpose of coding, we broke “efforts” into four types that correspond with the monitoring and evaluation framework described in Appendix 1: contextual, input, activity, and output. We broke “effects” into the two remaining monitoring and evaluationtypes: outcomes and impacts. Figure X providesthe breakdown of indicators in our sample according indicator type.
Appendix 3. Indicator Types – Definitions, Trends, and Examples
4 5
Figure 20: Percentage of Each Indicator Type in our Sample
Type Definition Example 1 Example 2 Example 3Trends in Sample
Elicit basic demographicinformation about companiesand facts that are relevant to risk levels in the company's operations. Answers are neither positive nor negative but simply give context to other indicators.
GRI 102-4: Location of operations:
a. Number of countries where the organization operates, and the names of countries where it has significant operations and/or that are relevant to the topics covered in the report.
SASB NR0101-13: (1) Proved and (2) probable reserves in or near indigenous land.
SASB TC0401-07(a): Number of government or law enforcementrequests for customerinformation
Contextual Most common inreporting frameworks.
Tended to focus on:
• the scope ofreporting;
• a company’s size/scope of operations;
• general risks faced due to industry or geography; and
• basic information about boardstructures, etc.
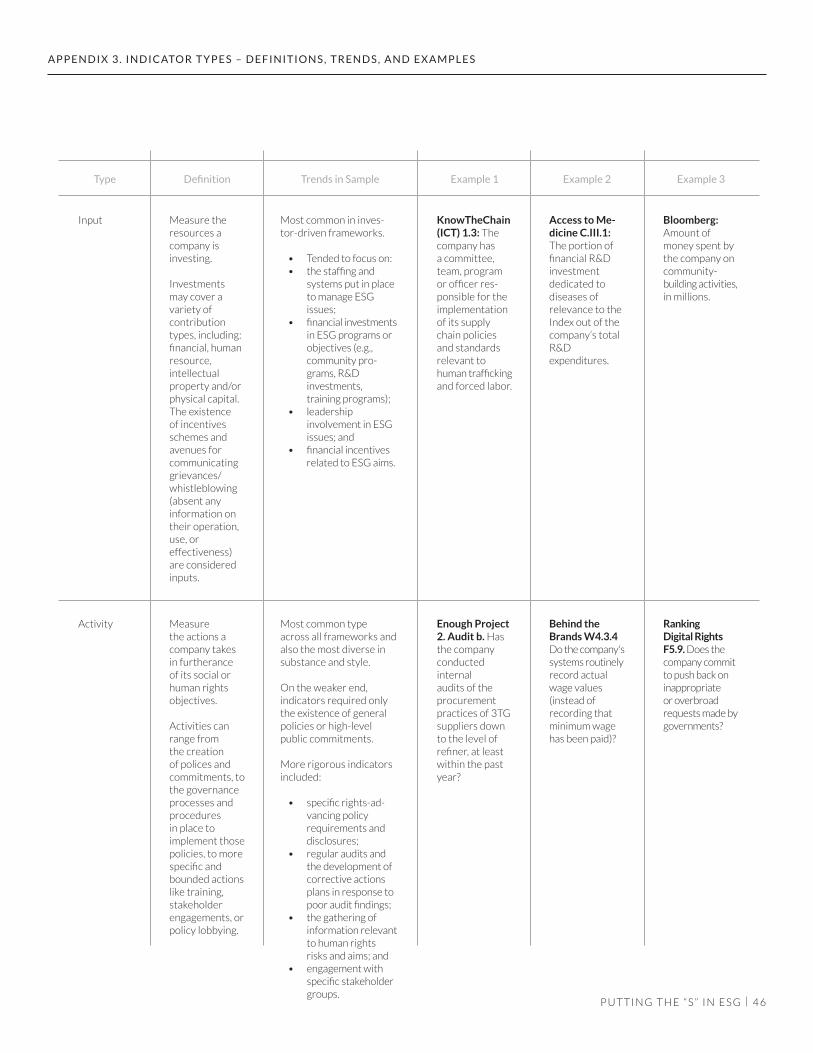
P U T T I N G T H E “ S ” I N E S G |
A P P E N D I X 3 . I N D I C ATO R T Y P E S – D E F I N I T I O N S , T R E N D S , A N D E X A M P L E S
4 6
Type Definition Example 1 Example 2 Example 3Trends in Sample
Measure the resources a company is investing.
Investments may cover a variety ofcontribution types, including:financial, human resource,intellectual property and/or physical capital. The existence of incentives schemes and avenues for communicating grievances/whistleblowing (absent any information on their operation,use, oreffectiveness)are considered inputs.
Measure the actions a company takes in furtherance of its social or human rights objectives.
Activities can range from the creation of polices and commitments, to the governance processes and procedures in place to implement those policies, to more specific and bounded actions like training, stakeholder engagements, or policy lobbying.
KnowTheChain (ICT) 1.3: The company has a committee, team, program or officer res-ponsible for the implementation of its supply chain policies and standards relevant tohuman traffickingand forced labor.
Enough Project 2. Audit b. Has the company conducted internalaudits of the procurement practices of 3TG suppliers down to the level of refiner, at least within the past year?
Access to Me-dicine C.III.1: The portion of financial R&D investment dedicated to diseases of relevance to the Index out of the company’s total R&Dexpenditures.
Behind the Brands W4.3.4 Do the company'ssystems routinelyrecord actual wage values(instead of recording that minimum wage has been paid)?
Bloomberg: Amount of money spent by the company on community-building activities,in millions.
Ranking Digital Rights F5.9. Does the company commit to push back on inappropriate or overbroad requests made by governments?
Input
Activity
Most common in inves-tor-driven frameworks.
• Tended to focus on: • the staffing and
systems put in place to manage ESG issues;
• financial investmentsin ESG programs or objectives (e.g.,community pro-grams, R&Dinvestments,training programs);
• leadershipinvolvement in ESG issues; and
• financial incentives related to ESG aims.
Most common type across all frameworks and also the most diverse in substance and style.
On the weaker end, indicators required only the existence of general policies or high-level public commitments.
More rigorous indicators included:
• specific rights-ad-vancing policy requirements and disclosures;
• regular audits and the development of corrective actions plans in response to poor audit findings;
• the gathering of information relevant to human rights risks and aims; and
• engagement with specific stakeholder groups.
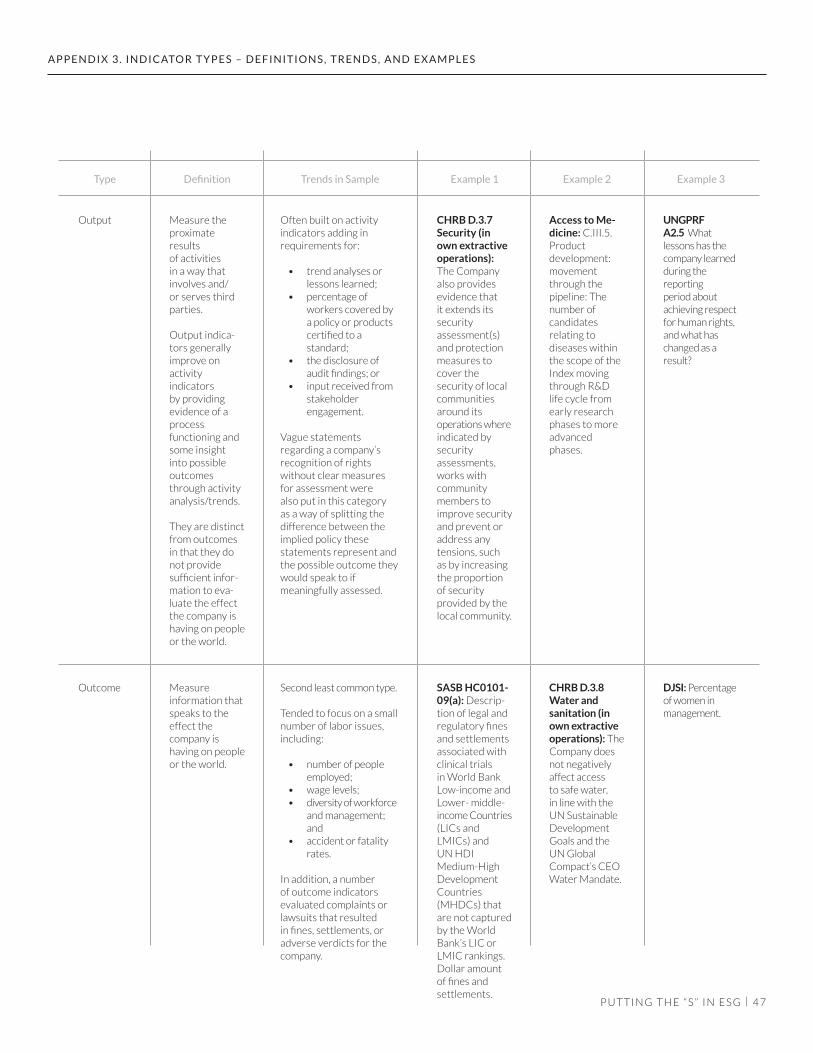
P U T T I N G T H E “ S ” I N E S G |
A P P E N D I X 3 . I N D I C ATO R T Y P E S – D E F I N I T I O N S , T R E N D S , A N D E X A M P L E S
4 7
Type Definition Example 1 Example 2 Example 3Trends in Sample
Measure the proximate resultsof activities in a way that involves and/or serves third parties.
Output indica-tors generally improve onactivityindicators by providing evidence of a processfunctioning and some insight into possible outcomes through activity analysis/trends.
They are distinct from outcomes in that they do not provide sufficient infor-mation to eva-luate the effect the company is having on people or the world.
Measure information that speaks to the effect thecompany is having on people or the world.
CHRB D.3.7 Security (in own extractive operations): The Company also provides evidence that it extends its securityassessment(s) and protection measures tocover the security of local communities around itsoperations whereindicated by securityassessments, works with community members to improve security and prevent or address any tensions, such as by increasing the proportion of security provided by the local community.
SASB HC0101-09(a): Descrip-tion of legal and regulatory fines and settlements associated with clinical trials in World Bank Low-income andLower- middle-income Countries(LICs and LMICs) and UN HDI Medium-High Development Countries (MHDCs) that are not captured by the World Bank’s LIC or LMIC rankings. Dollar amount of fines and settlements.
Access to Me-dicine: C.III.5. Productdevelopment: movement through the pipeline: The number ofcandidatesrelating to diseases within the scope of the Index moving through R&D life cycle from early research phases to more advanced phases.
CHRB D.3.8 Water and sanitation (in own extractive operations): The Company does not negatively affect access to safe water, in line with the UN Sustainable Development Goals and the UN Global Compact’s CEO Water Mandate.
UNGPRF A2.5 What lessons has the company learned during the reportingperiod about achieving respect for human rights, and what has changed as a result?
DJSI: Percentage of women in management.
Output
Outcome
Often built on activity indicators adding inrequirements for:
• trend analyses or lessons learned;
• percentage of workers covered by a policy or products certified to astandard;
• the disclosure of audit findings; or
• input received from stakeholderengagement.
Vague statements regarding a company’s recognition of rightswithout clear measures for assessment were also put in this category as a way of splitting the difference between the implied policy these statements represent and the possible outcome they would speak to ifmeaningfully assessed.
Second least common type.
Tended to focus on a small number of labor issues, including:
• number of people employed;
• wage levels; • diversity of workforce
and management; and
• accident or fatality rates.
In addition, a number of outcome indicators evaluated complaints or lawsuits that resulted in fines, settlements, or adverse verdicts for the company.
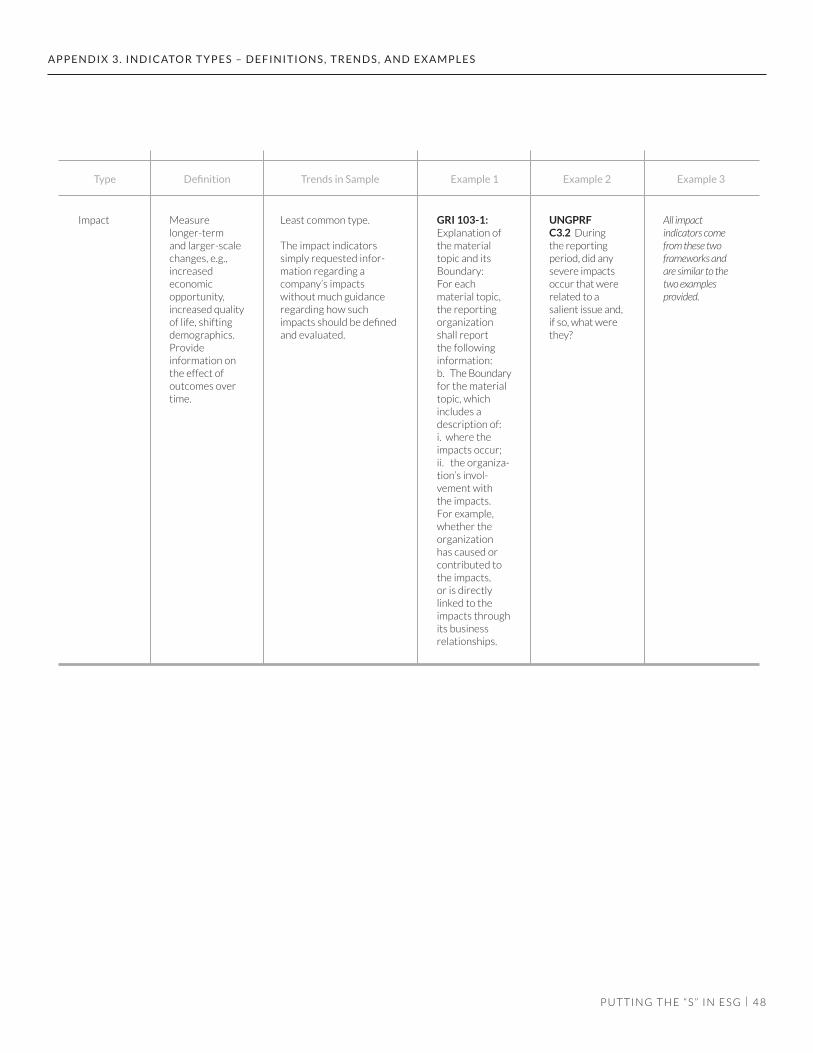
P U T T I N G T H E “ S ” I N E S G |
A P P E N D I X 3 . I N D I C ATO R T Y P E S – D E F I N I T I O N S , T R E N D S , A N D E X A M P L E S
4 8
Type Definition Example 1 Example 2 Example 3Trends in Sample
Measure longer-term and larger-scale changes, e.g., increasedeconomic opportunity,increased qualityof life, shifting demographics.Provide information on the effect of outcomes over time.
GRI 103-1: Explanation of the material topic and its Boundary: For each material topic, the reporting organization shall report the following information:b. The Boundaryfor the material topic, which includes adescription of:i. where the impacts occur; ii. the organiza-tion’s invol-vement with the impacts. For example, whether the organization has caused or contributed to the impacts, or is directly linked to the impacts through its business relationships.
UNGPRF C3.2 During the reporting period, did any severe impacts occur that were related to a salient issue and, if so, what were they?
All impact indicators come from these two frameworks and are similar to the two examples provided.
Impact Least common type.
The impact indicatorssimply requested infor-mation regarding acompany’s impacts without much guidance regarding how such impacts should be defined and evaluated.
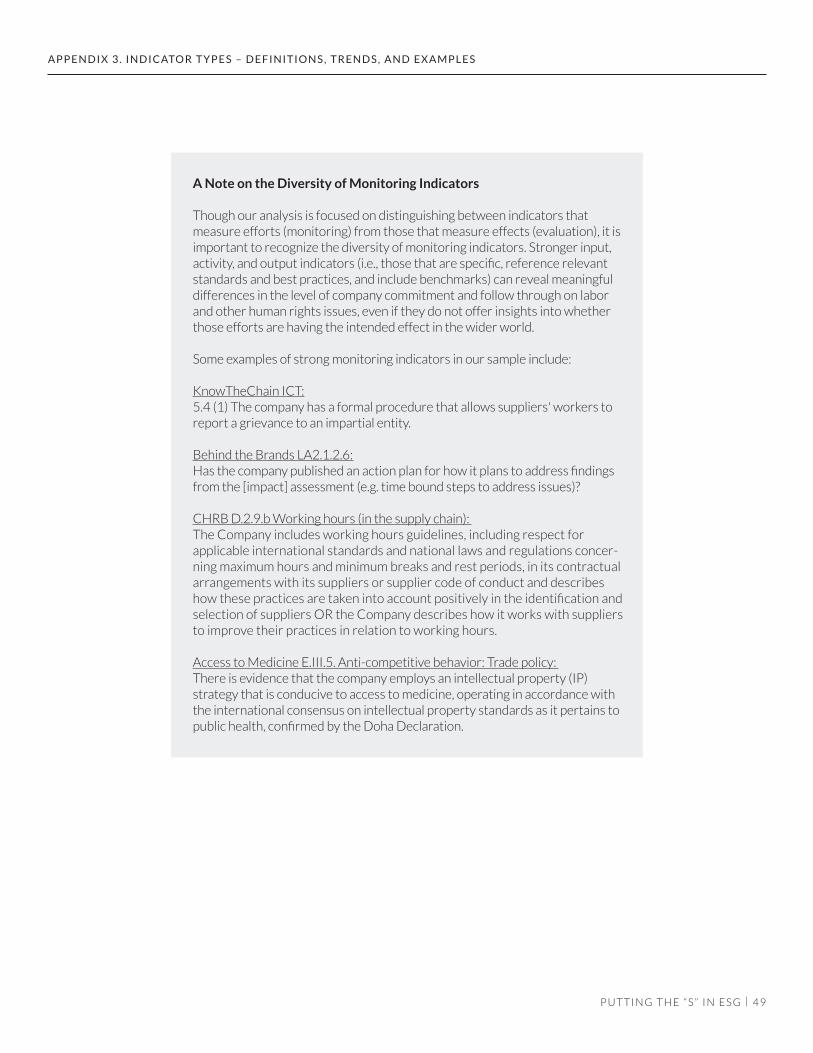
P U T T I N G T H E “ S ” I N E S G |
A P P E N D I X 3 . I N D I C ATO R T Y P E S – D E F I N I T I O N S , T R E N D S , A N D E X A M P L E S
4 9
A Note on the Diversity of Monitoring Indicators
Though our analysis is focused on distinguishing between indicators that measure efforts (monitoring) from those that measure effects (evaluation), it is important to recognize the diversity of monitoring indicators. Stronger input, activity, and output indicators (i.e., those that are specific, reference relevant standards and best practices, and include benchmarks) can reveal meaningful differences in the level of company commitment and follow through on labor and other human rights issues, even if they do not offer insights into whether those efforts are having the intended effect in the wider world.
Some examples of strong monitoring indicators in our sample include:
KnowTheChain ICT:5.4 (1) The company has a formal procedure that allows suppliers' workers to report a grievance to an impartial entity.
Behind the Brands LA2.1.2.6:Has the company published an action plan for how it plans to address findings from the [impact] assessment (e.g. time bound steps to address issues)?
CHRB D.2.9.b Working hours (in the supply chain): The Company includes working hours guidelines, including respect forapplicable international standards and national laws and regulations concer-ning maximum hours and minimum breaks and rest periods, in its contractual arrangements with its suppliers or supplier code of conduct and describes how these practices are taken into account positively in the identification and selection of suppliers OR the Company describes how it works with suppliers to improve their practices in relation to working hours.
Access to Medicine E.III.5. Anti-competitive behavior: Trade policy: There is evidence that the company employs an intellectual property (IP) strategy that is conducive to access to medicine, operating in accordance with the international consensus on intellectual property standards as it pertains to public health, confirmed by the Doha Declaration.
5 0
E N D N OT E S
1. Universal Declaration of Human Rights, GA Res. 217A(III), 10 December 1948 (UDHR); International Covenant on Civil and Political Rights, opened for signature 16 December 1966, 999 UNTS 171 (entered into force 23 March 1976); International Covenant on Economic, Social and Cultural Rights, opened for signature 16 December 1966, 993 UNTS 3 (entered into force 3 January 1976). The eight fundamental conventions of the Inter-national Labour Organization can be found at International Labour Organization, Conven-tions and Recommendations, http://ilo.org/global/standards/introduction-to-internatio-nal-labour-standards/conventions-and-re-commendations/lang--en/index.htm.
2. In 2011, the UN Human Rights Council unanimously endorsed the UN Guiding Prin-ciples on Business and Human Rights. These principles codified, among other things, that corporations have a responsibility to respect human rights as laid out in the UDHR and the core human rights and ILO conventions (see above n 1). Human Rights Council, Guiding Principles on Business and Human Rights: Implementing the United Nations ‘Protect, Respect and Remedy’ Framework, Report of the Special Representative of the Secre-tary-General on the issue of Human Rights and Transnational Corporations and Other Business Enterprises, UN Doc A/HRC/17/31 (2011), http://www.ohchr.org/Documents/Publications/GuidingPrinciplesBusiness-HR_EN.pdf.
3. John Goldstein & Jake Siewert, “Niche No Longer: ESG Investing Goes Mainstream,” Exchanges at Goldman Sachs (Podcast, Episode 36, recorded 19 February 2016, online April 2016), http://www.goldman-sachs.com/our-thinking/podcasts/episo-des/04-21-2016-john-goldstein.html; MSCI, MSCI ESG Research: Overview and Products (2016), https://www.msci.com/docu-ments/1296102/1636401/MSCI_ESG_Re-search_Factsheet.pdf/411954d3-68af-44d6-b222-d89708c5120d; USSIF, SRI Basics, http://www.ussif.org/sribasics.
4. Goldman Sachs, Environmental, Social, and Governance Report 2015 (2016), http://www.goldmansachs.com/s/esg-report/index.html.
5. Murray Coleman, “Advisors Find Opportu-nities with SRI Funds,” Financial Adviser IQ, 7 November 2016, http://financialadvisoriq.com/c/1492473/172073?referrer_module=-SearchSubFromFAIQ&highlight=SRI.
6. Dan Schawbel, “10 New Findings About The Millennial Consumer,” Forbes, 20 January 2015, http://www.forbes.com/sites/danschawbel/2015/01/20/10-new-fin-
dings-about-the-millennial-consumer/#238a-487c28a8; Morgan Stanley Institute for Sustainable Investing, Sustainable Signals: The Individual Investor Perspective (February 2015), http://www.morganstanley.com/sus-tainableinvesting/pdf/Sustainable_Signals.pdf; Jean Rogers, “Millennials and Women Rede-fine What It Means to be a Reasonable Inves-tor,” Institutional Investor, 20 October 2016, http://www.institutionalinvestor.com/blo-garticle/3594839/blog/millennials-and-wo-men-redefine-what-it-means-to-be-a-re-asonable-investor.html?utm_campaign=general%20SASB%20info&utm_content=36349416&utm_me-dium=social&utm_source=twitter#/.WBje-9C0rLGh.
7. Rogers, above n 6.
8. Matt Turner, “Here is the letter the world’s largest investor, BlackRock CEO Larry Fink, just sent to CEOs everywhere,” Business Insider, 2 February 2016, http://www.businessinsider.com/blackrock-ceo-larry-fink-letter-to-sp-500-ceos-2016-2; Laurence Fink, “Our Gambling Culture,” McKinsey & Company, April 2015, http://www.mckinsey.com/business-functions/strategy-and-corpo-rate-finance/our-insights/our-gambling-cul-ture; CBC News, “BlackRock’s Larry Fink calls for more long-term thinking,” 15 May 2014, http://www.cbc.ca/news/business/blackrock-s-larry-fink-calls-for-more-long-term-thin-king-1.2644081.
9. Ibid.
10. Stephen Gandel, “Why the Manager of the World’s Biggest Hedge Fund is Afraid of Populism,” Fortune, 18 January 2017, http://fortune.com/2017/01/18/ray-dalio-da-vos-populism/; Jim Edwards, “Ray Dalio: ‘I want to be loud and clear – populism scares me’,” Business Insider, 18 January 2017, http://www.businessinsider.com/ray-dalio-po-pulism-scares-me-2017-1.
11. CalPERS maintains a Sustainable Investment Research Initiative Library with an annotated bibliography of studies regarding the financial impact of sustainability factors: CalPERS, Sustainable Investment Research Library, https://www.calpers.ca.gov/page/invest-ments/governance/sustainable-investing/siri-library. Highlights from recent sustaina-bility studies include: Gunnar Friede, Timo Busch & Alexander Bassen, “ESG and financial performance: aggregated evidence from more than 2000 empirical studies” (2015) 5(4) Journal of Sustainable Finance & Investment 210, http://www.tandfonline.com/doi/pdf/10.1080/20430795.2015.1118917 (finding that that 90% of the 2,000 studies examined found
a neutral or positive relationship between high ESG scores and financial performan-ce, with the majority of studies finding a positive relationship); Mozaffar Nayim Khan, Georgios Serafeim & Aaron Yoon, "Corporate Sustainability: First Evidence on Materiality" (2015) Harvard Business School Working Paper, No. 15-073, https://dash.harvard.edu/handle/1/14369106 (finding that compa-nies with strong records on sustainability issues deemed material for their sector outperformed those with weak sustainability records); Lei Liao, “Responsible Investing Can Deliver Competitive Performance,” Pensions & Investments Online, 2 November 2016, http://www.pionline.com/article/20161102/ONLINE/161109970/responsible-inves-ting-can-deliver-competitive-performance (finding no evidence of elevated risk when comparing well-known ESG-based index funds with market benchmarks). For a recent study on the benefits of long-term investment horizons, see Dominic Barton, James Manyika & Sarah Keohane Williamson, “Finally, Eviden-ce That Managing for the Long Term Pays Off,” Harvard Business Review, 7 February 2017, https://hbr.org/2017/02/finally-proof-that-managing-for-the-long-term-pays-off.
12. United Nations Principles for Responsible Investment and Morgan Stanley Capital International, Global Guide to Responsible Investment Regulation (2016), https://www.unpri.org/download_report/22438.
13. Ibid.
14. Adrian King & Wim Bartels, Carrots and Sticks: Global Trends in Sustainability Regu-lation and Policy (February 2015), KPMG International, the Global Reporting Initiative, the United Nations Environment Programme, & The Centre for Corporate Governance in Africa, https://assets.kpmg.com/content/dam/kpmg/pdf/2016/02/kpmg-internatio-nal-survey-of-corporate-responsibility-repor-ting-2015.pdf.
15. Ibid.
16. Information in this graphic comes from the following sources: Paul Davies & Michael D. Green, “EU Workplace Pen-sions Now Required to Incorporate ESG Issues,” Lexology, 6 December 2016, http://www.lexology.com/library/detail.aspx?g=54972ba9-45e9-4f75-86f6-3a6fe-b2ef67e; Willis Tower Watson, Global Pension Assets Study 2016 (2016), https://www.willistowerswatson.com/DownloadMedia.aspx?media=%7B-9FF7A5FA-C2E8-419F-9A80-149DF-DE03218%7D; United Kingdom Law Commission, Fiduciary Duties of Investment
P U T T I N G T H E “ S ” I N E S G |
5 1
E N D N OT E S
Intermediaries, Consultation Paper No. 215 (March 2015), http://www.lawcom.gov.uk/wp-content/uploads/2015/03/cp215_fidu-ciary_duties.pdf; Willis Towers Watson, “U.S. Pension Fund Assets Remain Stable,” Press Release, 2 February 2016, https://www.willis-towerswatson.com/en-US/press/2016/02/global-pension-fund-assets-crab-sideways; US Department of Labor, Employee Benefits Security Administration, Interpretive Bulletin Relating to the Fiduciary Standard under ERI-SA in Considering Economically Targeted In-vestments (2015), https://s3.amazonaws.com/public-inspection.federalregister.gov/2015-27146.pdf; Canadian Institutional Investment Network, 2012 Canada’s Pension Landscape Report: The Evolution of Risk (2012), http://www.institutionalinvestmentnetwork.ca/re-searchDocument.jsf?id=2; Financial Services Commission of Ontario, “FAQs - Statement of Investment Policies and Procedures (SIPP),” https://www.fsco.gov.on.ca/en/pensions/legislative/Pages/sipp.aspx#ESG; Sovereign Wealth Fund Institute (SWFI), “National Pen-sion Service Korea,” http://www.swfinstitute.org/public-investors/national-pension-ser-vice-korea/; CalPERS, Towards Sustainable Investment and Operations: Making Progress (2014), https://www.calpers.ca.gov/docs/forms-publications/esg-report-2014.pdf; Norges Bank Investment Management, Government Pension Fund Global, https://www.nbim.no/en/the-fund/; Fourth Swedish National Pension Fund (AP4), http://www.ap4.se/en/; Frances Denmark, “European Pen-sions Go Green for Social, and Bottom-Line, Benefits,” Institutional Investor, 19 February 2015, http://www.institutionalinvestor.com/article/3429171/investors-pensions/euro-pean-pensions-go-green-for-social-and-bo-ttom-line-benefits.html#/.VzzlU-crIy4; Norwegian Ministry of Finance, Guidelines for observation and exclusion from the Gover-nment Pension Fund Global, 9 February 2016, https://www.regjeringen.no/contentassets/7c9a364d2d1c474f8220965065695a4a/guidelines_observation_exclusion2016.pdf; Wilmington Insight, Pension Funds Online, “Country Profiles: Brazil,” http://www.pen-sionfundsonline.co.uk/content/country-profi-les/brazil/123; Gustavo Pimentel, Responsible Investment in Brazil 2016: ESG incorporation by pension funds (September 2016), http://irlatam.com/wp-content/uploads/2016/docs/IRLATAM-presentaciones-2016/SITAWI-RI-Brazil-2016-EN-2016-09-12.pdf; Belgian Sustainable and Socially Responsible Invest-ment Forum (Belsif), “SRI Tools: SRI Legisla-tion – Europe,” http://www.belsif.be/default.aspx?ref=AJADAA&lang=EN#u.k; Initiative For Responsible Investment, “CSR,” http://iri.hks.harvard.edu/csr.
17. Global Institute for Sustainability Ratings (GISR), “Corporate Sustainability (ESG)
Ratings Products Hub,” http://ratesustainabili-ty. org/hub/index.php/search/report-in-graph.
18. Ibid.
19. Ibid.
20. Ernst & Young Poland, Short-termism in business: causes, mechanics, and consequen-ces (2014), http://www.ey.com/Publication/vwLUAssets/EY_Poland_Report/$FILE/Short-termism_raport_EY.pdf.
21. Patrick H. Sullivan, Jr. & Patrick H. Sullivan, Sr., “Valuing intangibles companies: An intellec-tual capital approach” (2000) 1(4) Journal of Intellectual Capital 328, http://home.bi.no/fgl99011/Bok2215/IK-artikkel-3.pdf.
22. Rob Bauer & Daniel Hann, “Corporate Environmental Management and Credit Risk” (2010), https://papers.ssrn.com/sol3/papers.cfm?abstract_id=1660470; Viral V. Acharya, Ramin P Baghai & Krishnamurthy V. Subra-manian, “Labor Laws and Innovation” (2013) 56(4) Journal of Law and Economics 997.
23. Rachel Davis & Daniel Franks, Costs of Com-pany-Community Conflict in the Extractive Sector, Corporate Social Responsibility Initiative Report No. 66 (2014), https://www.hks.harvard.edu/m-rcbg/CSRI/research/Costs%20of%20Conflict_Davis%20%20Franks.pdf.
24. Jo Confino, “Unilever’s Paul Polman: challen-ging the corporate status quo,” The Guardian, 24 April 2012, https://www.theguardian.com/sustainable-business/paul-polman-unile-ver-sustainable-living-plan.
25. Dorothée Baumann-Pauly & Michael Posner, “Making the business case for human rights: an assessment,” in Dorothée Baumann-Pauly & Justine Nolan (eds.), Business and Human Rights: From Principles to Practice (Routle-dge, New York, 2016) 11. For a discussion specifically of benefits in the supply chain, see “Beyond Supply Chains: Empowering Respon-sible Value Chains,” World Economic Forum, in collaboration with Accenture (January 2015), http://tinyurl.com/z3ldam6.
26. Sally Engle Merry, “Measuring the World: Indicators, Human Rights, and Global Gover-nance” (2011) 52 (Supplement 3) Current Anthropology S83, https://www.law.berkeley.edu/files/Merry-MeasuringtheWorld.pdf; Daniel Kaufmann & Aart Kraay, “Governance Indicators: Where Are We, Where Should We Be Going?,” Discussion Draft, World Bank (October 2007), http://info.worldbank.org/governance/wgi/pdf/governanceindicators-survey.pdf.
27. For an example of common performance in-dicators, including customer satisfaction, see Bernard Marr, Key Performance Indicators (KPI): The 75 measures every manager needs to know (Pearson, 2011). For a discussion of measuring intangibles more broadly, see Feng Gu & Baruch Lev, “Intangible assets: me-asurement, drivers, usefulness,” in Giovanni Schiuma, Managing Knowledge Assets and Business Value Creation in Organizations: Measures and Dynamics (New York, 2001) 7. For a discussion of evaluating culture, see James O’Toole and Warren Bennis, “A Culture of Candor,” Harvard Business Review, June 2009, https://hbr.org/2009/06/a-cultu-re-of-candor.
28. Carbon Disclosure Project (CDP), CDP Climate Change Report 2015: The mains-treaming of low-carbonon Wall Street, US edition based on the S&P 500 Index (November 2015), https://b8f65cb373b-1b7b15feb-c70d8ead6ced550b4d-987d7c03fcdd1d.ssl.cf3.rackcdn.com/cms/reports/documents/000/000/783/original/CDP-USA-climate-change-report-2015.pdf?1471960506; CDP, CDP’s 2017 Climate Change Information Request, https://b8f65c-b373b1b7b15feb-c70d8ead6ced550b4d-987d7c03fcdd1d.ssl.cf3.rackcdn.com/cms/guidance_docs/pdfs/000/000/227/original/CDP-Climate-Change-Information-Request.pdf?1478623269.
29. HIP Investor & Corporate Knights Capital, “2016 Newsweek Green Rankings,” http://s.newsweek.com/sites/www.newsweek.com/files/newsweek_green_rankings_final_metho-dology_2016.pdf.
30. Juan Murguia& Sergio Lence, “Investors' Reaction to Environmental Performance: A Global Perspective of the Newsweek's 'Green Rankings'” (2015) 60(4) Environmental & Resource Economics 583.
31. Tensie Whelan & Carly Fink, “The Compre-hensive Business Case for Sustainability,” Harvard Business Review, 21 October 2016, https://hbr.org/2016/10/the-comprehensi-ve-business-case-for-sustainability; Hayley Peterson, “Nike Is Saving A Ton Of Money On Its New Flyknit Shoes,” Business Insider, 5 September 2014, http://www.businessinsider.com/nike-saves-money-on-flyknit-2014-9.
32. Michael Sadowski, Rate the Raters: Phase Five – The Investor View (November 2012), SustainAbility, http://10458-presscdn-0-33.pagely.netdna-cdn.com/wp-content/uploads/2016/07/rtr_phase5_investor_view.pdf.
33. PWC, Investors, corporates, and ESG: brid-ging the gap (October 2016), https://www.
P U T T I N G T H E “ S ” I N E S G |
5 2
E N D N OT E S
pwc.com/us/en/governance-insights-center/publications/assets/investors-corpora-tes-and-esg-bridging-the-gap.pdf.
34. Sadowski, above n 32.
35. Ibid.
36. Ibid.
37. Information obtained through conversations with representatives of these firms.
38. Ibid.
39. These were either indicators that were included in a dedicated “social” section or that directly referenced “social” issues or efforts in their text. In many cases indicators consisted of numerous component parts. Where the components constituted different indicator types or covered different substantive or procedural issues, they were broken apart. For the purpose of this study, each of these component parts is considered an “indicator” as each one requires and evaluates different information.
40. Sustainability Accounting Standards Board, “Implementation Guide,” https://library.sasb.org/implementation-guide/.
41. Ibid.
42. Stichting Access to Medicine Foundation, Annual Report 2015 (2015), https://accessto-medicinefoundation.org/media/atmf/atmf_an-nual_report_2015.pdf.
43. US Department of the Treasury, Internal Revenue Service, Form 990: Return of Orga-nization Exempt from Income Tax (2015)
44. Author interview with client, August 2016, New York.
45. Richard M. Locke, “Global rules, private actors: Future challenges for business and human rights,” in Baumann-Pauly & Nolan, above n 27, 299.
46. Aude Ucla, Jean-Baptise Andrieu & Michaela Lee, Addressing Workers’ Rights in Enginee-ring and Construction: Opportunities for Collaboration (July 2016), Business for Social Responsibility, https://www.bsr.org/en/our-in-sights/report-view/addressing-workers-ri-ghts-in-engineering-and-construction-oppor-tunities-for.
47. United Nations Environment Programme, Finance Initiative, “Human Rights Guidance Tool for the Financial Sector,” http://www.unepfi.org/humanrightstoolkit/agriculture.php; Michael J. Maloni & Michael E. Brown,
“Corporate Social Responsibility in the Supply Chain: An Application in the Food Industry” (2006) 68(1) Journal of Business Ethics 35.
48. King & Bartels, above n 14.
49. World Business Council for Sustainable De-velopment, Reporting matters: Improving the effectiveness of reporting: WBCSD Baseline Report 2013 (2013), http://www.wbcsd.org/Projects/Reporting/Resources/Repor-ting-Matters-WBCSD-2013-Baseline-Report.
50. Merry, above n 26; Kaufmann & Kraay, above n 26.
51. Countries and regional unions that have passed some form of mandatory sustainability reporting include: Australia, Brazil, Canada, China, Denmark, the EU, Finland, France, Japan, Malaysia, Pakistan, Russia, South Africa, Spain, Sweden, the UK, and the US. For discussion of these efforts, see: Galit A. Sarfaty, “Measuring Corporate Accountabi-lity through Global Indicators,” in Sally Engle Merry, Kevin E. Davis & Benedict Kingsbury (eds.), The Quiet Power of Indicators: Mea-suring Governance, Corruption, and Rule of Law (Cambridge University Press, Cambri-dge, 2015) 103; Ioannis Ioannou & George Serafeim, “The Consequences of Mandatory Corporate Sustainability Reporting: Evidence from Four Countries,” Working Paper 11-100, Harvard Business School, 20 August 2014, http://www.hbs.edu/faculty/Publication%20Files/11-100_7f383b79-8dad-462d-90df-324e298acb49.pdf; Ernst & Young and Global Reporting Initiative, Sustainability reporting – the time is now (2012), http://www.ey.com/Publication/vwLUAssets/EY_Sustainability_reporting_-_the_time_is_now/$FILE/EY-Sus-tainability-reporting-the-time-is-now.pdf.
52. California Transparency in Supply Chains Act of 2010, Senate Bill 657, Ch. 556, passed 30 September 2010; Modern Slavery Act 2015, c.30; France Diplomatie, “Extra financial re-porting made mandatory for large companies in a view of a standardization of European standards,” 2 December 2013, http://www.diplomatie.gouv.fr/en/french-foreign-policy/economic-diplomacy-foreign-trade/corpo-rate-social-responsibility/france-s-domes-tic-csr-policy/article/extra-financial-repor-ting-made.
53. Sarah Labowitz & Dorothée Baumann-Pauly, Beyond the Tip of the Iceberg: Bangladesh’s Forgotten Apparel Workers (December 2015), NYU Stern Center for Business and Human Rights, http://people.stern.nyu.edu/twadhwa/bangladesh/downloads/beyond_the_tip_of_the_iceberg_report.pdf.
54. Ibid.
55. Bob Massie, “Welcome to the ESG Evolution,” Institutional Investor, 9 March 2016, http://www.institutionalinvestor.com/Article.as-px?ArticleId=3535562&p=3#.WLdNxW8rL-Gg.
56. Clifford W. Cobb & Craig Rixford, Lessons Learned from the History of Social Indicators (November 1998), Redefining Progress, ht-tps://www.researchgate.net/profile/Clifford_Cobb/publication/228798417_Lessons_Lear-ned_from_the_History_of_Social_Indicators/links/56fe2d0908aee995dde673af.pdf.
57. Franz Rothenbacher, “National and Interna-tional Approaches in Social Reporting” (1993) 29 Social Indicators Research 1.
58. The Whitehouse, “About the Council of Eco-nomic Advisers,” https://georgewbush-white-house.archives.gov/cea/about.html.
59. Cobb & Rixford, above n 56.
60. Rothenbacher, above n 57; Ian Bache & Louise Reardon, The Politics and Policy of Wellbe-ing: Understanding the Rise and Significance of a New Agenda (Edward Elgar Publishing Limited, Cheltenham, 2016).
61. Rothenbacher, above n 58.
62. Cobb & Rixford, above n 56.
63. Ibid.
64. Ibid.
65. Ibid.
66. Rothenbacher, above n 58.
67. Christopher Hood, Ruth Dixon & Craig Beeston, “Rating the Rankings: Assessing International Rankings of Public Service Per-formance” (2008) 11(3) International Public Management Journal 298.
68. Cobb & Rixford, above n 56; Rothenbacher, above n 57; Hood, Dixon & Beeston, above n 67.
69. Curt Tarnoff, Millennium Challenge Corpora-tion, Congressional Research Service, 26 July 2009, http://research.policyarchive.org/2094.pdf.
70. Ibid.
71. Merry, above n 26; Kaufmann & Kraay, above n 26.
72. Marshall W. Meyer & Vipin Gupta, “The performance paradox” (1994) 16 Research in Organizational Behavior 309.
P U T T I N G T H E “ S ” I N E S G |
5 3
E N D N OT E S
73. Sandra van Thiel & Frans L. Leeuw, “The Performance Paradox in the Public Sector” (2002) 25(3) Public Performance and Mana-gement Review 267. For discussion of the lack of standards around desired social outcomes see AnnJanette Rosga & Margaret L. Satter-thwaite, “The Trust in Indicators: Measuring Human Rights” (2009) 27(2) Berkley Journal of International Law 253; Merry, above n xvi; Donald P. Moynihan et al., “Performance Regimes Amidst Governance Complexity” (2011) 21 (Supplement 1) Journal of Public Administration and Research Theory i141.
74. Peter Smith, “On the unintended consequen-ces of publishing performance data in the public sector” (1995) 18(2-3) International Journal of Public Administration 277.
75. Amartya Sen, “Assessing Human Develop-ment,” United Nations Development Program-me, Human Development Reports, Blog entry, 1999, http://hdr.undp.org/en/content/asses-sing-human-development.
76. The definitions and general framework used in this section are pulled from various government and multinational program measurement guidelines. See, e.g., Planning and Performance Management Unit, Office of the Director of US Foreign Assistance, Glos-sary of Evaluation Terms (25 March 2009), http://pdf.usaid.gov/pdf_docs/Pnado820.pdf; SIDA, Strengthening SIDA Management for Developing Results (2007), http://www.sida.se/contentassets/3a01588888d040f89a-90f8dc80824d46/strengthening-sida-mana-gement-for-development-results_1180.pdf; European Commission, European Cohesion Fund & European Regional Development Fund, Guidance Document on Monitoring and Evaluation: Concepts and Recommendations 2014-2020 (2015), https://www.portu-gal2020.pt/Portal2020/Media/Default/Docs/AVALIACAO/03_Guidance%20ME_Con-cepts%20and%20Recommendations_ERDF_CF_Mar2014.pdf; RBM/Accountability Team, UNDG WGP (FAO, WFP, UNAIDS, UNSSC, UNDP, UNIFEM, UNICEF, UNFPA), United Nations Development Group Results-Based Management Handbook: Strengthening RBM harmonization for improved development results (24 March 2010), http://www.un.cv/files/UNDG%20RBM%20Handbook.pdf; Jody Zall Kusek & Ray C. Rust, Ten Steps to a Results-based Monitoring and Evaluation System (The World Bank, 2004), https://openknowledge.worldbank.org/bitstream/handle/10986/14926/296720PAPER0100s-teps.pdf.
77. For examples of states and multinational bodies using this framework see ibid. For a critical discussion of monitoring and evalua-tion frameworks see Meyer & Gupta, above
n 72; Smith, above n 74; van Thiel & Leeuw, above n 75.
78. M. Adil Khan, “Evaluation Capacity Building: An Overview of Current Status, Issues and Options” (1998) 4(3) Evaluation 310.
79. With 79 sectors, each having approximately 14 metrics, coding the full SASB framework was not feasible for our study. We therefore selected a subset of sectors to evaluate. This subset was selected according to two criteria: (1) the sector corresponded to one of the Center’s five priority industries – extractives, technology, food and beverage, manufac-turing, and construction; or (2) the sector was the same as another industry-specific framework already in the study (i.e., pharma-ceuticals).
80. At the time of selection, the third KnowThe-Chain benchmark for Apparel and Footwear was not yet released.
81. Both materiality and saliency are approa-ches to determining the relevance of a given issue to a particular business or industry. As described in Part 1.2 of this paper, materiality has historically been understood in terms of whether a given issue impacts a company’s near-term financial risk and return charac-teristics. Saliency is a term used by the UN Guiding Principles Reporting Framework that is intended to look beyond a strict materia-lity assessment to determine which issues risk “the most severe negative impact” more generally.
82. We developed the preliminary substantive and procedural lists on the basis of a cursory review of the frameworks included in our sample for perceptible issue trends
P U T T I N G T H E “ S ” I N E S G |