Push-Me Pull-You: Comparative Advertising in the OTC ... · Question How do –rms strategically...
24
Push-Me Pull-You: Comparative Advertising in the OTC Analgesics Industry Simon P. Anderson (UVA) Federico Ciliberto, (UVA) Jura Liaukonyte (Cornell) Regis Renault (Cergy-Pontoise) October 2009 Federico Ciliberto (University of Virginia), Push-Me Pull-You. Presentation for the FTC-NU Microeconomics Conference.
-
Upload
vuongthuan -
Category
Documents
-
view
215 -
download
1
Transcript of Push-Me Pull-You: Comparative Advertising in the OTC ... · Question How do –rms strategically...

Push-Me Pull-You: Comparative Advertising in the OTCAnalgesics Industry
Simon P. Anderson (UVA) Federico Ciliberto, (UVA) Jura Liaukonyte(Cornell) Regis Renault (Cergy-Pontoise)
October 2009
Federico Ciliberto (University of Virginia), Push-Me Pull-You. Presentation for the FTC-NU Microeconomics Conference.
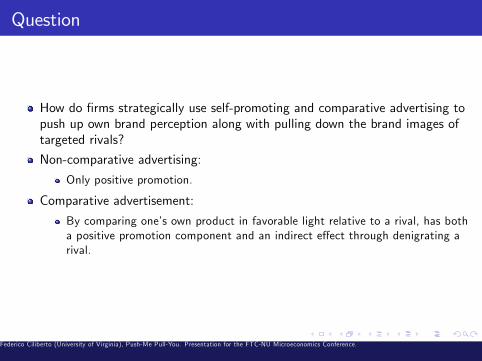
Question
How do �rms strategically use self-promoting and comparative advertising topush up own brand perception along with pulling down the brand images oftargeted rivals?
Non-comparative advertising:
Only positive promotion.
Comparative advertisement:
By comparing one�s own product in favorable light relative to a rival, has botha positive promotion component and an indirect e¤ect through denigrating arival.
Federico Ciliberto (University of Virginia), Push-Me Pull-You. Presentation for the FTC-NU Microeconomics Conference.
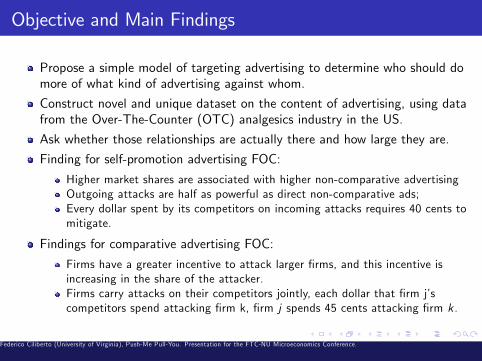
Objective and Main Findings
Propose a simple model of targeting advertising to determine who should domore of what kind of advertising against whom.
Construct novel and unique dataset on the content of advertising, using datafrom the Over-The-Counter (OTC) analgesics industry in the US.
Ask whether those relationships are actually there and how large they are.
Finding for self-promotion advertising FOC:
Higher market shares are associated with higher non-comparative advertisingOutgoing attacks are half as powerful as direct non-comparative ads;Every dollar spent by its competitors on incoming attacks requires 40 cents tomitigate.
Findings for comparative advertising FOC:
Firms have a greater incentive to attack larger �rms, and this incentive isincreasing in the share of the attacker.Firms carry attacks on their competitors jointly, each dollar that �rm j�scompetitors spend attacking �rm k, �rm j spends 45 cents attacking �rm k .
Federico Ciliberto (University of Virginia), Push-Me Pull-You. Presentation for the FTC-NU Microeconomics Conference.
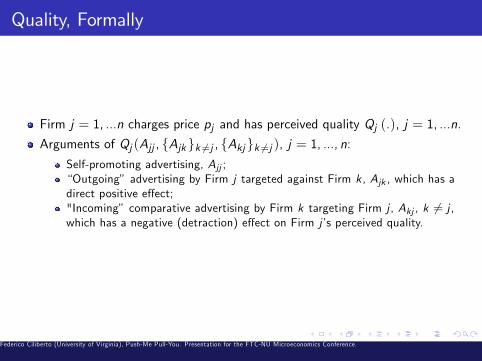
Quality, Formally
Firm j = 1, ...n charges price pj and has perceived quality Qj (.), j = 1, ...n.
Arguments of Qj (Ajj , fAjkgk 6=j , fAkjgk 6=j ), j = 1, ..., n:Self-promoting advertising, Ajj ;�Outgoing� advertising by Firm j targeted against Firm k , Ajk , which has adirect positive e¤ect;"Incoming� comparative advertising by Firm k targeting Firm j , Akj , k 6= j ,which has a negative (detraction) e¤ect on Firm j�s perceived quality.
Federico Ciliberto (University of Virginia), Push-Me Pull-You. Presentation for the FTC-NU Microeconomics Conference.

Demand
Uj = δj + µεj , j = 0, 1, ..., n, with δj = Qj (.)� pj .
"Outside option� (of not buying a painkiller) be associated to an objectiveutility δ0 = V0.
µ expresses the degree of horizontal consumer/product heterogeneity.
There are M consumers in the market, so that the total demand for product jwill be Msj , j = 0, ..., n
The structure of the random term determines the form of the correspondingdemand function. At �rst, we do not impose further structure, but we laterspecialize (for the comparative advertising analysis) to the logit model to geta sharper set of benchmark properties..
Federico Ciliberto (University of Virginia), Push-Me Pull-You. Presentation for the FTC-NU Microeconomics Conference.
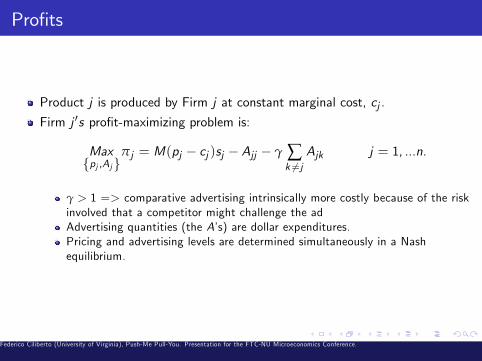
Pro�ts
Product j is produced by Firm j at constant marginal cost, cj .
Firm j 0s pro�t-maximizing problem is:
Maxfpj ,Ajg
πj = M(pj � cj )sj � Ajj � γ ∑k 6=j
Ajk j = 1, ...n.
γ > 1 => comparative advertising intrinsically more costly because of the riskinvolved that a competitor might challenge the adAdvertising quantities (the A�s) are dollar expenditures.Pricing and advertising levels are determined simultaneously in a Nashequilibrium.
Federico Ciliberto (University of Virginia), Push-Me Pull-You. Presentation for the FTC-NU Microeconomics Conference.

Firms�Optimal Choices: Non-Comp Ads
Non-comparative advertising expenditures are determined by:
dπjdAjj
=dπjdδj
.∂Qj∂Ajj
� 1 = M(pj � cj )dsjdδj
∂Qj∂Ajj
� 1 � 0, with equality if Ajj > 0 j = 1, ..., n,
Pricing �rst-order condition can be substituted into the advertising one to get:
Msj∂Qj∂Ajj
� 1, with equality if Ajj > 0, j = 1, ..., n.
Intuition: Raising Ajj by $1 and raising price by $∂Qj∂Ajj
leaves δj unchanged.
This change therefore increases the revenue by $ ∂Qj∂Ajj
on the existing
consumer base (i.e., Msj consumers). This extra revenue is equated to the $1marginal cost of the change, the RHS.
Federico Ciliberto (University of Virginia), Push-Me Pull-You. Presentation for the FTC-NU Microeconomics Conference.
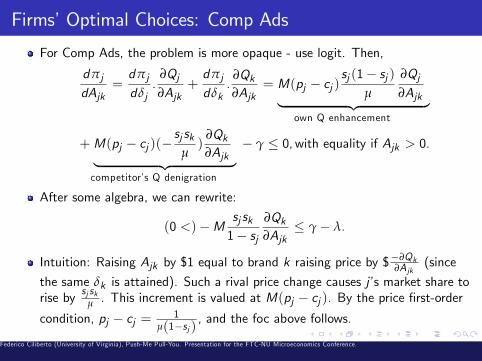
Firms�Optimal Choices: Comp Ads
For Comp Ads, the problem is more opaque - use logit. Then,
dπjdAjk
=dπjdδj
.∂Qj∂Ajk
+dπjdδk
.∂Qk∂Ajk
= M(pj � cj )sj (1� sj )
µ
∂Qj∂Ajk| {z }
own Q enhancement
+M(pj � cj )(�sj sk
µ)
∂Qk∂Ajk| {z }
competitor�s Q denigration
� γ � 0,with equality if Ajk > 0.
After some algebra, we can rewrite:
(0 <)�Msj sk1� sj
∂Qk∂Ajk
� γ� λ.
Intuition: Raising Ajk by $1 equal to brand k raising price by $�∂Qk∂Ajk
(since
the same δk is attained). Such a rival price change causes j�s market share torise by sj skµ . This increment is valued at M(pj � cj ). By the price �rst-ordercondition, pj � cj = 1
µ(1�sj ), and the foc above follows.
Federico Ciliberto (University of Virginia), Push-Me Pull-You. Presentation for the FTC-NU Microeconomics Conference.

Predictions
(Non-Comparative Advertising levels): In equilibrium, �rms with largermarket shares will use more non-comparative advertising.
(Larger target more): In equilibrium, for all �rms using a strictly positivelevel of non-comparative advertising, larger �rms will use more comparativeadvertising against each target.
(Larger targeted more) In equilibrium, larger �rms su¤er more attacks fromeach rival.
Follows from the logit property that fall-out is greater from peeling o¤consumers from a larger rival. Analogously, the largest brands will also bethose attacked most (Tylenol in our industry context.)
Federico Ciliberto (University of Virginia), Push-Me Pull-You. Presentation for the FTC-NU Microeconomics Conference.
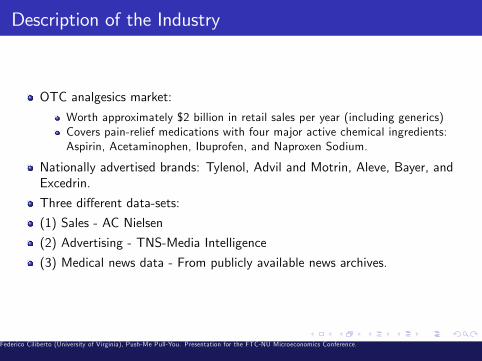
Description of the Industry
OTC analgesics market:
Worth approximately $2 billion in retail sales per year (including generics)Covers pain-relief medications with four major active chemical ingredients:Aspirin, Acetaminophen, Ibuprofen, and Naproxen Sodium.
Nationally advertised brands: Tylenol, Advil and Motrin, Aleve, Bayer, andExcedrin.
Three di¤erent data-sets:
(1) Sales - AC Nielsen
(2) Advertising - TNS-Media Intelligence
(3) Medical news data - From publicly available news archives.
Federico Ciliberto (University of Virginia), Push-Me Pull-You. Presentation for the FTC-NU Microeconomics Conference.
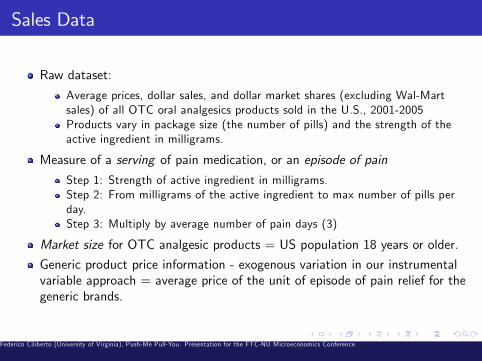
Sales Data
Raw dataset:
Average prices, dollar sales, and dollar market shares (excluding Wal-Martsales) of all OTC oral analgesics products sold in the U.S., 2001-2005Products vary in package size (the number of pills) and the strength of theactive ingredient in milligrams.
Measure of a serving of pain medication, or an episode of pain
Step 1: Strength of active ingredient in milligrams.Step 2: From milligrams of the active ingredient to max number of pills perday.Step 3: Multiply by average number of pain days (3)
Market size for OTC analgesic products = US population 18 years or older.
Generic product price information - exogenous variation in our instrumentalvariable approach = average price of the unit of episode of pain relief for thegeneric brands.
Federico Ciliberto (University of Virginia), Push-Me Pull-You. Presentation for the FTC-NU Microeconomics Conference.
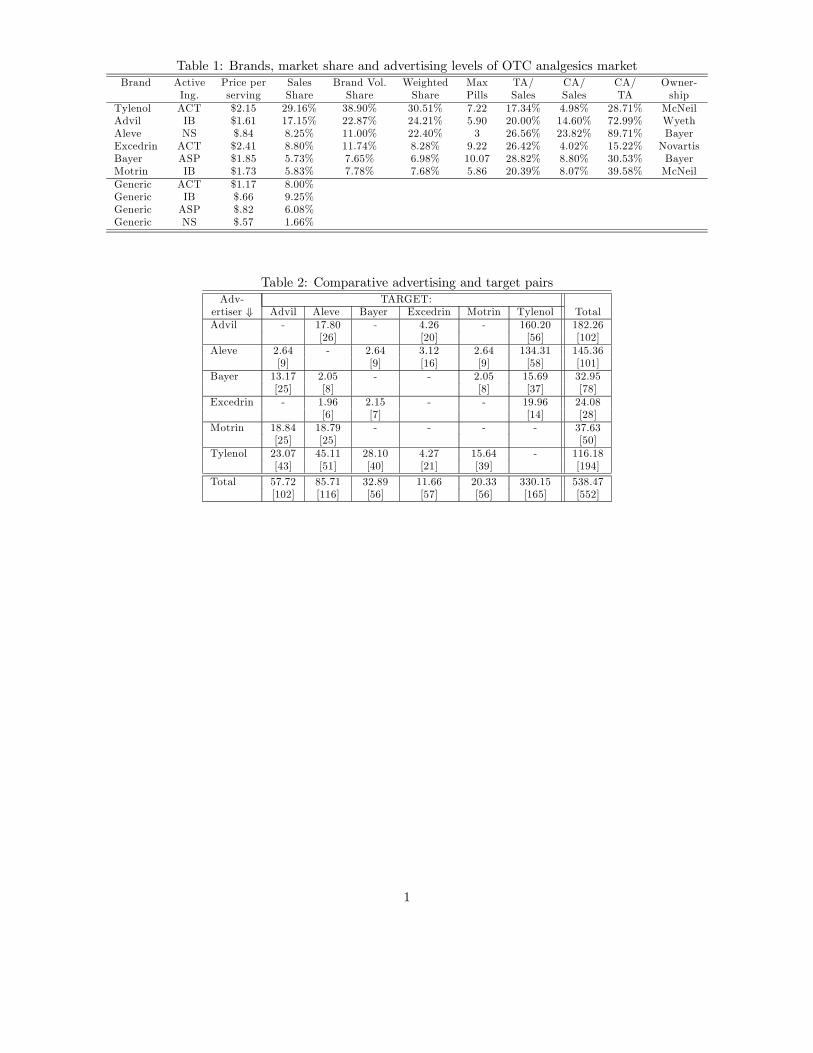
Table 1: Brands, market share and advertising levels of OTC analgesics marketBrand Active Price per Sales Brand Vol. Weighted Max TA/ CA/ CA/ Owner-
Ing. serving Share Share Share Pills Sales Sales TA shipTylenol ACT $2.15 29.16% 38.90% 30.51% 7.22 17.34% 4.98% 28.71% McNeilAdvil IB $1.61 17.15% 22.87% 24.21% 5.90 20.00% 14.60% 72.99% WyethAleve NS $.84 8.25% 11.00% 22.40% 3 26.56% 23.82% 89.71% BayerExcedrin ACT $2.41 8.80% 11.74% 8.28% 9.22 26.42% 4.02% 15.22% NovartisBayer ASP $1.85 5.73% 7.65% 6.98% 10.07 28.82% 8.80% 30.53% BayerMotrin IB $1.73 5.83% 7.78% 7.68% 5.86 20.39% 8.07% 39.58% McNeilGeneric ACT $1.17 8.00%Generic IB $.66 9.25%Generic ASP $.82 6.08%Generic NS $.57 1.66%
Table 2: Comparative advertising and target pairsAdv- TARGET:
ertiser ⇓ Advil Aleve Bayer Excedrin Motrin Tylenol TotalAdvil - 17.80 - 4.26 - 160.20 182.26
[26] [20] [56] [102]Aleve 2.64 - 2.64 3.12 2.64 134.31 145.36
[9] [9] [16] [9] [58] [101]Bayer 13.17 2.05 - - 2.05 15.69 32.95
[25] [8] [8] [37] [78]Excedrin - 1.96 2.15 - - 19.96 24.08
[6] [7] [14] [28]Motrin 18.84 18.79 - - - - 37.63
[25] [25] [50]Tylenol 23.07 45.11 28.10 4.27 15.64 - 116.18
[43] [51] [40] [21] [39] [194]
Total 57.72 85.71 32.89 11.66 20.33 330.15 538.47[102] [116] [56] [57] [56] [165] [552]
1

Advertising Data
Raw dataset: Monthly advertising expenditures on each ad, and video �les ofall TV advertisements for the 2001-2005 time period for each brandadvertised in the OTC analgesics category.
Advertising Content: Watched all (>4K!) the ads and coded according totheir content.
Whether the commercial had any comparative claimsWhich brand (or class of drugs) it was compared toUnit of observation is a year-month-brand-attacked brand combination.
Attack Matrix: See Table 2.
Federico Ciliberto (University of Virginia), Push-Me Pull-You. Presentation for the FTC-NU Microeconomics Conference.

News Shocks
Between 2001 and 2005, OTC analgesics market endured several medicalnews related shocks.
Follow Chintagunta, Jiang and Jin (2007) = us Lexis-Nexis to search overnews.
News Shock:From a data-set of articles we then constructed a data-set of news shocks.Check whether a news shock was associated with any new medical �ndingsthat were published in major scienti�c journals.Table 3.
E¤ect of a Shock:
Each shock assigned a dummy variable, equal to 1 in all the periods after andincluding t: t; t + 1; . . . ; TInteract each of the major shocks listed in Table 3 with brand dummies.
Federico Ciliberto (University of Virginia), Push-Me Pull-You. Presentation for the FTC-NU Microeconomics Conference.
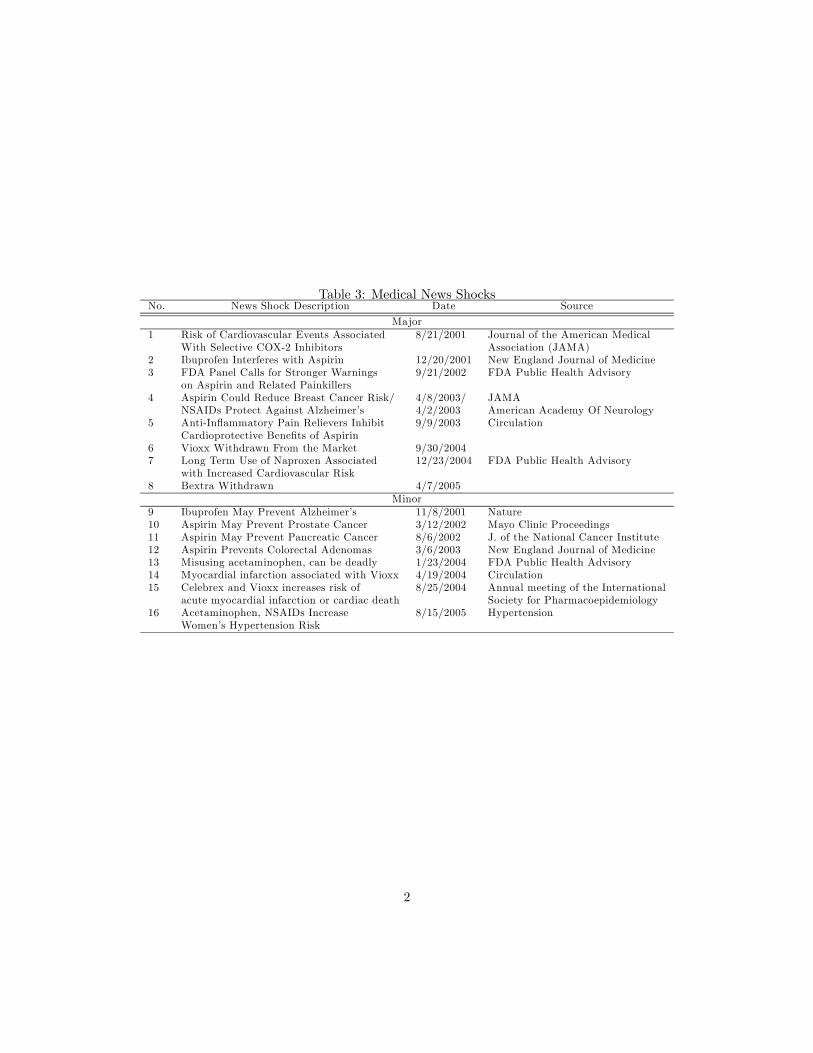
Table 3: Medical News ShocksNo. News Shock Description Date Source
Major1 Risk of Cardiovascular Events Associated 8/21/2001 Journal of the American Medical
With Selective COX-2 Inhibitors Association (JAMA)2 Ibuprofen Interferes with Aspirin 12/20/2001 New England Journal of Medicine3 FDA Panel Calls for Stronger Warnings 9/21/2002 FDA Public Health Advisory
on Aspirin and Related Painkillers4 Aspirin Could Reduce Breast Cancer Risk/ 4/8/2003/ JAMA
NSAIDs Protect Against Alzheimer’s 4/2/2003 American Academy Of Neurology5 Anti-Inflammatory Pain Relievers Inhibit 9/9/2003 Circulation
Cardioprotective Benefits of Aspirin6 Vioxx Withdrawn From the Market 9/30/20047 Long Term Use of Naproxen Associated 12/23/2004 FDA Public Health Advisory
with Increased Cardiovascular Risk8 Bextra Withdrawn 4/7/2005
Minor9 Ibuprofen May Prevent Alzheimer’s 11/8/2001 Nature10 Aspirin May Prevent Prostate Cancer 3/12/2002 Mayo Clinic Proceedings11 Aspirin May Prevent Pancreatic Cancer 8/6/2002 J. of the National Cancer Institute12 Aspirin Prevents Colorectal Adenomas 3/6/2003 New England Journal of Medicine13 Misusing acetaminophen, can be deadly 1/23/2004 FDA Public Health Advisory14 Myocardial infarction associated with Vioxx 4/19/2004 Circulation15 Celebrex and Vioxx increases risk of 8/25/2004 Annual meeting of the International
acute myocardial infarction or cardiac death Society for Pharmacoepidemiology16 Acetaminophen, NSAIDs Increase 8/15/2005 Hypertension
Women’s Hypertension Risk
2

Quality Function
After extensive experimentation, we chose the following functional form forthe base quality:
Qj =
��Aj � α1
�Ajj + λ ∑k 6=j Ajk
��2�φ
�Cj �
�Ajj + λ ∑k 6=j Ajk
��∑k 6=j Akj
+∑k 6=j�Akj � α2Akj
�2 � β ∑k 6=j ∑k 0 6=j ,k 0 6=k AkjAk 0j
Federico Ciliberto (University of Virginia), Push-Me Pull-You. Presentation for the FTC-NU Microeconomics Conference.
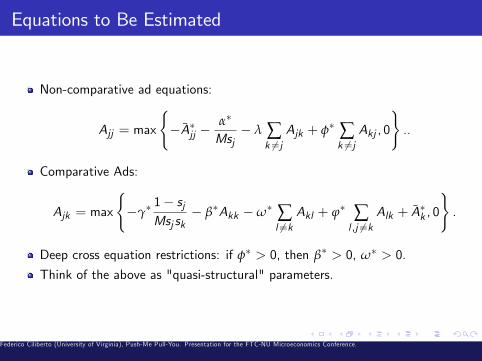
Equations to Be Estimated
Non-comparative ad equations:
Ajj = max
(�A�jj �
α�
Msj� λ ∑
k 6=jAjk + φ� ∑
k 6=jAkj , 0
)..
Comparative Ads:
Ajk = max
(�γ�
1� sjMsj sk
� β�Akk �ω� ∑l 6=k
Akl + ϕ� ∑l ,j 6=k
Alk + A�k , 0
).
Deep cross equation restrictions: if φ� > 0, then β� > 0, ω� > 0.
Think of the above as "quasi-structural" parameters.
Federico Ciliberto (University of Virginia), Push-Me Pull-You. Presentation for the FTC-NU Microeconomics Conference.

Identi�cation I (Brand FE)
Two main concerns:
Left-censoring of non-comparative and comparative advertising (Tobits);Endogeneity of market shares and advertising expenditures.
Brand Fixed E¤ects: Exploit the panel structure of our data to account fortime-constant di¤erences across brands.
Model the unobservable ξ jt as:
ξ jt = ξ j + ∆ξ jt ,
ξ j brand �xed e¤ect, while ∆ξ jt time speci�c idiosyncratic shocks. Two �xede¤ects, one for the top brands (Advil, Aleve, Tylenol), and one for the otherbrands (Excedrin, Motrin, Bayer) �ts our data best (Figure 2).
Federico Ciliberto (University of Virginia), Push-Me Pull-You. Presentation for the FTC-NU Microeconomics Conference.

Identi�cation II (News Shocks and Exclusion Restrictions)
Using Timing to Identify the Parameters: Use news shocks ...
Exogenous since they require new medical discoveries, which �surprise�boththe consumers and the �rms.
Exclusion Restrictions : Need variables that a¤ect advertising only throughshares, but not directly - marginal cost = generic prices...
MC must be constant - otherwise, the price of the generic would depend onthe quantity produced by the branded products.Bertrand competition and free entry among generic producers of the drugswith the same active ingredient leads to pricing at marginal cost.Cost of producing generic products highly correlated with cost of producingbranded products, then generic prices have an additional indirect impact onbranded products�market shares through branded prices.
Federico Ciliberto (University of Virginia), Push-Me Pull-You. Presentation for the FTC-NU Microeconomics Conference.

Non-Comparative Ads FOC:
The unit of observation now is a brand-year-month.
Start by running the following simple Tobit regression:
8<: A�jjt = �α�Msjt
� λ ∑k 6=j Ajkt + φ� ∑k 6=j Akjt � ξjt , ξjt � N�0, σ2
�,
Ajjt = max�A�jjt , 0
�.
For the economic interpretation of α�:
eAjj ,sj =dAjjdsj
sjAjj.
Federico Ciliberto (University of Virginia), Push-Me Pull-You. Presentation for the FTC-NU Microeconomics Conference.
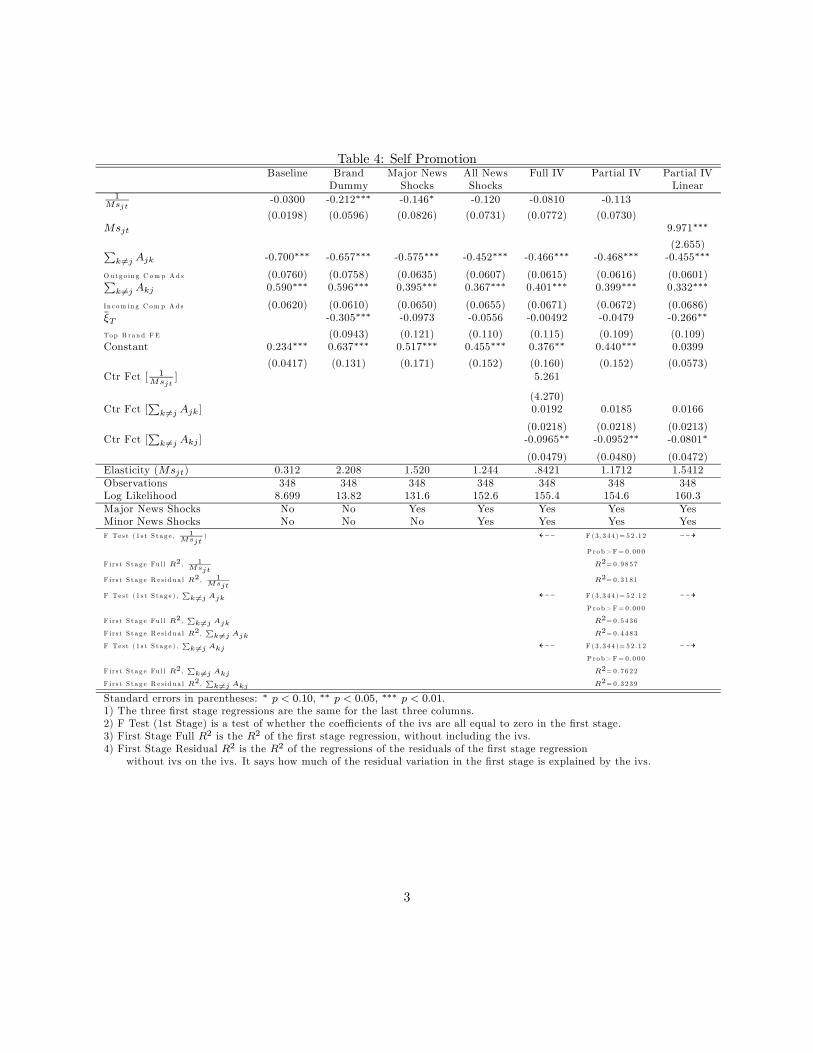
Table 4: Self PromotionBaseline Brand Major News All News Full IV Partial IV Partial IV
Dummy Shocks Shocks Linear1
Msjt-0.0300 -0.212∗∗∗ -0.146∗ -0.120 -0.0810 -0.113
(0.0198) (0.0596) (0.0826) (0.0731) (0.0772) (0.0730)Msjt 9.971∗∗∗
(2.655)
k 6=j Ajk -0.700∗∗∗ -0.657∗∗∗ -0.575∗∗∗ -0.452∗∗∗ -0.466∗∗∗ -0.468∗∗∗ -0.455∗∗∗
O u tg o in g C om p A d s (0.0760) (0.0758) (0.0635) (0.0607) (0.0615) (0.0616) (0.0601)
k 6=j Akj 0.590∗∗∗ 0.596∗∗∗ 0.395∗∗∗ 0.367∗∗∗ 0.401∗∗∗ 0.399∗∗∗ 0.332∗∗∗
In c om in g C om p A d s (0.0620) (0.0610) (0.0650) (0.0655) (0.0671) (0.0672) (0.0686)ξT -0.305∗∗∗ -0.0973 -0.0556 -0.00492 -0.0479 -0.266∗∗
Top B ra n d F E (0.0943) (0.121) (0.110) (0.115) (0.109) (0.109)Constant 0.234∗∗∗ 0.637∗∗∗ 0.517∗∗∗ 0.455∗∗∗ 0.376∗∗ 0.440∗∗∗ 0.0399
(0.0417) (0.131) (0.171) (0.152) (0.160) (0.152) (0.0573)Ctr Fct [ 1
Msjt] 5.261
(4.270)Ctr Fct [ k 6=j Ajk] 0.0192 0.0185 0.0166
(0.0218) (0.0218) (0.0213)Ctr Fct [ k 6=j Akj ] -0.0965∗∗ -0.0952∗∗ -0.0801∗
(0.0479) (0.0480) (0.0472)Elasticity (Msjt) 0.312 2.208 1.520 1.244 .8421 1.1712 1.5412Observations 348 348 348 348 348 348 348Log Likelihood 8.699 13.82 131.6 152.6 155.4 154.6 160.3Major News Shocks No No Yes Yes Yes Yes YesMinor News Shocks No No No Yes Yes Yes YesF Te s t ( 1 s t S t a g e , 1
Msjt) L99 F (3 ,3 4 4 )= 5 2 .1 2 99K
P ro b> F= 0 .0 0 0
F i r s t S t a g e Fu l l R2 , 1Msjt
R2= 0 .9 8 5 7
F i r s t S t a g e R e s id u a l R2 , 1Msjt
R2= 0 .3 1 8 1
F Te s t ( 1 s t S t a g e ) , k 6=j Ajk L99 F (3 ,3 4 4 )= 5 2 .1 2 99KP ro b> F= 0 .0 0 0
F i r s t S t a g e Fu l l R2 , k 6=j Ajk R2= 0 .5 4 3 6
F i r s t S t a g e R e s id u a l R2 , k 6=j Ajk R2= 0 .4 4 8 3
F Te s t ( 1 s t S t a g e ) , k 6=j Akj L99 F (3 ,3 4 4 )= 5 2 .1 2 99KP ro b> F= 0 .0 0 0
F i r s t S t a g e Fu l l R2 , k 6=j Akj R2= 0 .7 6 2 2
F i r s t S t a g e R e s id u a l R2 , k 6=j Akj R2= 0 .3 2 3 9
Standard errors in parentheses: ∗ p < 0.10, ∗∗ p < 0.05, ∗∗∗ p < 0.01.1) The three first stage regressions are the same for the last three columns.2) F Test (1st Stage) is a test of whether the coefficients of the ivs are all equal to zero in the first stage.3) First Stage Full R2 is the R2 of the first stage regression, without including the ivs.4) First Stage Residual R2 is the R2 of the regressions of the residuals of the first stage regression
without ivs on the ivs. It says how much of the residual variation in the first stage is explained by the ivs.
3
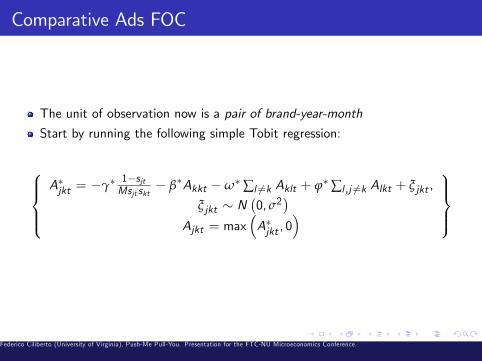
Comparative Ads FOC
The unit of observation now is a pair of brand-year-month
Start by running the following simple Tobit regression:
8>><>>:A�jkt = �γ�
1�sjtMsjt skt
� β�Akkt �ω� ∑l 6=k Aklt + ϕ� ∑l ,j 6=k Alkt + ξjkt ,
ξjkt � N�0, σ2
�Ajkt = max
�A�jkt , 0
�9>>=>>;
Federico Ciliberto (University of Virginia), Push-Me Pull-You. Presentation for the FTC-NU Microeconomics Conference.
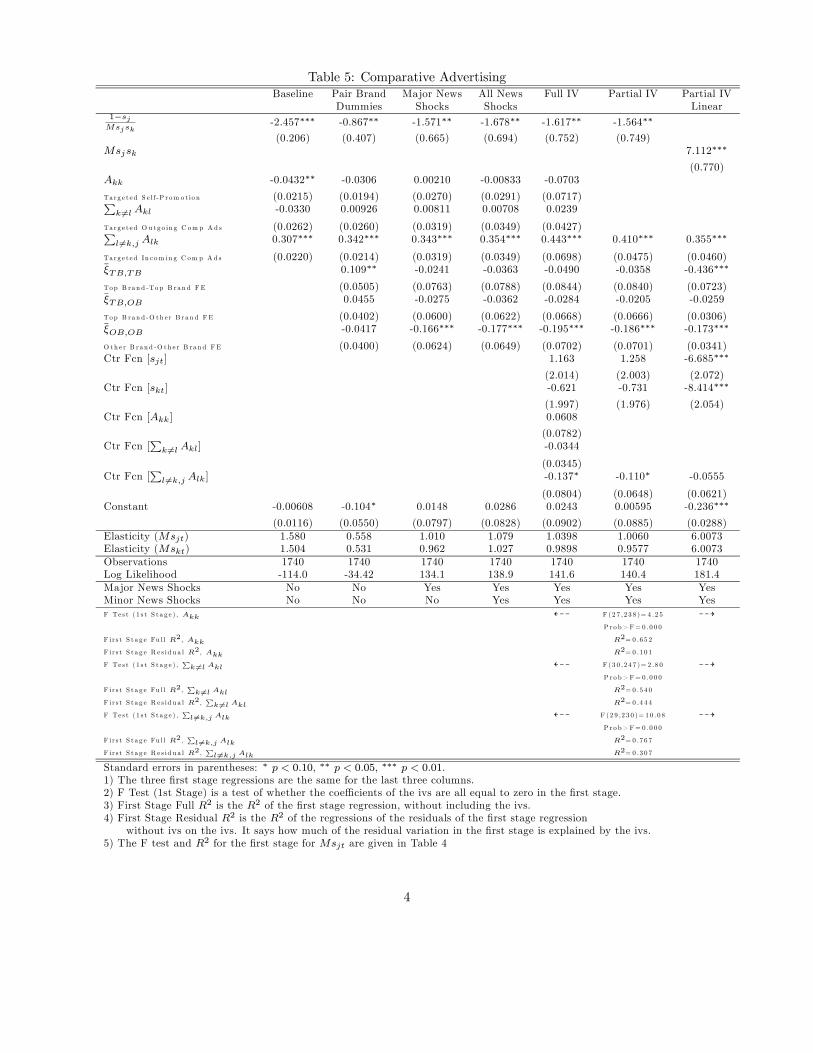
Table 5: Comparative AdvertisingBaseline Pair Brand Major News All News Full IV Partial IV Partial IV
Dummies Shocks Shocks Linear1−sjMsjsk
-2.457∗∗∗ -0.867∗∗ -1.571∗∗ -1.678∗∗ -1.617∗∗ -1.564∗∗
(0.206) (0.407) (0.665) (0.694) (0.752) (0.749)Msjsk 7.112∗∗∗
(0.770)Akk -0.0432∗∗ -0.0306 0.00210 -0.00833 -0.0703
Ta rg e t e d S e l f -P r om o t io n (0.0215) (0.0194) (0.0270) (0.0291) (0.0717)
k 6=lAkl -0.0330 0.00926 0.00811 0.00708 0.0239
Ta rg e t e d O u tg o in g C om p A d s (0.0262) (0.0260) (0.0319) (0.0349) (0.0427)
l6=k,j Alk 0.307∗∗∗ 0.342∗∗∗ 0.343∗∗∗ 0.354∗∗∗ 0.443∗∗∗ 0.410∗∗∗ 0.355∗∗∗
Ta rg e t e d In c om in g C om p A d s (0.0220) (0.0214) (0.0319) (0.0349) (0.0698) (0.0475) (0.0460)ξTB,TB 0.109∗∗ -0.0241 -0.0363 -0.0490 -0.0358 -0.436∗∗∗
Top B ra n d -To p B ra n d F E (0.0505) (0.0763) (0.0788) (0.0844) (0.0840) (0.0723)ξTB,OB 0.0455 -0.0275 -0.0362 -0.0284 -0.0205 -0.0259
Top B ra n d -O th e r B ra n d F E (0.0402) (0.0600) (0.0622) (0.0668) (0.0666) (0.0306)ξOB,OB -0.0417 -0.166∗∗∗ -0.177∗∗∗ -0.195∗∗∗ -0.186∗∗∗ -0.173∗∗∗
O th e r B ra n d -O th e r B ra n d F E (0.0400) (0.0624) (0.0649) (0.0702) (0.0701) (0.0341)Ctr Fcn [sjt] 1.163 1.258 -6.685∗∗∗
(2.014) (2.003) (2.072)Ctr Fcn [skt] -0.621 -0.731 -8.414∗∗∗
(1.997) (1.976) (2.054)Ctr Fcn [Akk] 0.0608
(0.0782)Ctr Fcn [ k 6=lAkl] -0.0344
(0.0345)Ctr Fcn [ l6=k,j Alk] -0.137∗ -0.110∗ -0.0555
(0.0804) (0.0648) (0.0621)Constant -0.00608 -0.104∗ 0.0148 0.0286 0.0243 0.00595 -0.236∗∗∗
(0.0116) (0.0550) (0.0797) (0.0828) (0.0902) (0.0885) (0.0288)Elasticity (Msjt) 1.580 0.558 1.010 1.079 1.0398 1.0060 6.0073Elasticity (Mskt) 1.504 0.531 0.962 1.027 0.9898 0.9577 6.0073Observations 1740 1740 1740 1740 1740 1740 1740Log Likelihood -114.0 -34.42 134.1 138.9 141.6 140.4 181.4Major News Shocks No No Yes Yes Yes Yes YesMinor News Shocks No No No Yes Yes Yes YesF Te s t ( 1 s t S t a g e ) , Akk L99 F (2 7 ,2 3 8 )= 4 .2 5 99K
P ro b> F= 0 .0 0 0
F i r s t S t a g e Fu l l R2 , Akk R2= 0 .6 5 2
F i r s t S t a g e R e s id u a l R2 , Akk R2= 0 .1 0 1
F Te s t ( 1 s t S t a g e ) , k 6=l Akl L99 F (3 0 ,2 4 7 )= 2 .8 0 99KP ro b> F= 0 .0 0 0
F i r s t S t a g e Fu l l R2 , k 6=l Akl R2= 0 .5 4 0
F i r s t S t a g e R e s id u a l R2 , k 6=l Akl R2= 0 .4 4 4
F Te s t ( 1 s t S t a g e ) , l6=k,j Alk L99 F (2 9 ,2 3 0 )= 1 0 .0 8 99KP ro b> F= 0 .0 0 0
F i r s t S t a g e Fu l l R2 , l6=k,j Alk R2= 0 .7 6 7
F i r s t S t a g e R e s id u a l R2 , l6=k,j Alk R2= 0 .3 0 7
Standard errors in parentheses: ∗ p < 0.10, ∗∗ p < 0.05, ∗∗∗ p < 0.01.1) The three first stage regressions are the same for the last three columns.2) F Test (1st Stage) is a test of whether the coefficients of the ivs are all equal to zero in the first stage.3) First Stage Full R2 is the R2 of the first stage regression, without including the ivs.4) First Stage Residual R2 is the R2 of the regressions of the residuals of the first stage regression
without ivs on the ivs. It says how much of the residual variation in the first stage is explained by the ivs.5) The F test and R2 for the first stage for Msjt are given in Table 4
4

Conclusions
Think of this paper as developing a template for a Push-Pull analysis.Understanding the �rst order conditions for advertising as a �rst step.
Only three papers which deploy models of price and advertising competitionthat are close to ours. Gasmi, La¤ont, and Vuong [1992], Roberts andSamuelson [1988], Goeree [2008].
Here a deeper look at the advertising decisions - we look at the content ofads (comp ads).Proviso: we only look at persuasion role as in GLV and RS (vs. onlyinformative in Goeree).
In the (next) future:
Estimate full equilibrium model, and do counterfactual exercises to see ifindustry is at a suboptimal equilibrium (prisoner�s dilemma?). This isparticularly true with comparative ads that have not informative role ... here,in our Push-Pull model there is no info role for advertising.Introduce more details in the nature of advertising ... that is model how �rmscan mention characteristics in their advertising decisions.
Federico Ciliberto (University of Virginia), Push-Me Pull-You. Presentation for the FTC-NU Microeconomics Conference.