Purification of Complex Biopharmaceuticals with New ... · Duarte Lima Martins Purification of...
99
Duarte Lima Martins Purification of Complex Biopharmaceuticals with New Processes, Advanced Analytics and Computer-Aided Process Design Tools Dissertação para obtenção do Grau de Mestre em Biotecnologia Orientadora : Cristina Peixoto, PhD, Senior Scientist, ACTU, IBET/ITQB - UNL Co-orientador : Professor José Paulo Mota, Full Professor, Requimte/CQFB, FCT - UNL Júri: Presidente: Prof. Doutor Carlos A. Salgueiro Arguente: Professor João G. Crespo Vogal: Doutora Cristina Peixoto Setembro, 2013
Transcript of Purification of Complex Biopharmaceuticals with New ... · Duarte Lima Martins Purification of...

Duarte Lima Martins
Purification of ComplexBiopharmaceuticals with New Processes,Advanced Analytics and Computer-Aided
Process Design Tools
Dissertação para obtenção do Grau de Mestre emBiotecnologia
Orientadora : Cristina Peixoto, PhD,Senior Scientist,ACTU, IBET/ITQB - UNL
Co-orientador : Professor José Paulo Mota,Full Professor,Requimte/CQFB, FCT - UNL
Júri:
Presidente: Prof. Doutor Carlos A. Salgueiro
Arguente: Professor João G. Crespo
Vogal: Doutora Cristina Peixoto
Setembro, 2013


Purification of Complex Biopharmaceuticals with New Processes, AdvancedAnalytics and Computer-Aided Process Design Tools
Copyright © Duarte Lima Martins, Faculdade de Ciências e Tecnologia, Universidade Novade Lisboa
A Faculdade de Ciências e Tecnologia e a Universidade Nova de Lisboa têm o direito, perpé-tuo e sem limites geográficos, de arquivar e publicar esta dissertação através de exemplaresimpressos reproduzidos em papel ou de forma digital, ou por qualquer outro meio conhecidoou que venha a ser inventado, e de a divulgar através de repositórios científicos e de admitira sua cópia e distribuição com objectivos educacionais ou de investigação, não comerciais,desde que seja dado crédito ao autor e editor.
iii

iv

à minha família
v

vi

Acknowledgements
I would like thank some people who supported and contributed to the work presented inthis MSc thesis, particularly:
To Dr. Cristina Peixoto, my supervisor, for her scientific guidance, remarkable work ethic,confidence and encouragement. I’m deeply thankful for the outstanding people manager thatyou are, ensuring the highest quality of this work at all stages.
To Professor Paulo Mota, my co-supervisor, for his enthusiasm and enlightening talks onchromatography.
To Professor Paula Alves, for being the demanding and caring head of the ACTU andiBET always pushing the standards; and of course for the opportunity to develop my MScthesis work at such a stimulating research group.
To Professor Manuel Carrondo, for his inspiring role model of leadership and scientificwork.
To Sartorius Stedim Biotech, especially to Dr. Tobias Schleuss, Dr. Franziska Jonas andDr. Louis Villain, for providing the materials, support and advice throughout this work;and for the opportunity to attend the European Downstream Technology Forum at SartoriusCollege.
To the funding from Fundação para a Ciência e a Tecnologia (PTDC/EBB-BIO/119501/2010) for supporting the work presented in this thesis.
To Pier, for being a great colleague always up for interesting discussions about purification,his pragmatic view on biopharmaceutical industry and for all the laughs!
To Carina Silva, for the patience and experience shared when teaching me all aboutadenovirus production and handling.
To all my colleagues of the virus lab at ACTU, for all the help as well as for the funmoments; you guys made wearing two lab coats and two gloves fun!
vii

To all former and current colleagues at the ACTU, especially Nuno, Fabiana, Marco,Carina, João and Marcos, for all the assistance, advice, companionship and good work envi-ronment.
À Lídia pela compreensão e ânimo em todos os momentos, pelo exemplo de trabalho eresiliência. Por completares o outro lado, um obrigado muito especial.
Aos meus pais que acreditaram sempre em mim e me deram a liberdade de fazer o quegosto. Ao meu irmão por ser um exemplo extraordinário de carácter e determinação. Sem ovosso apoio este trabalho não seria possível.
viii

Abstract
Viruses are highly e�cient vectors that have been used for vaccination and gene therapyapplications. However, their complexity renders downstream process particularly challengingsince devices and strategies especially designed for virus purification are still lacking or needfurther optimization. After an introduction to the challenges of virus purification and thecurrent strategies being employed, this dissertation presents the study of three di�erent stagesof the downstream process: clarification, ultrafiltration and chromatography.
A novel clarification procedure based on diatomaceous earth was evaluated. Small-scalebatch incubations led to the identification of Divergan RS – a synthetic non-charged material –as the most promising candidate for integration in a scalable filtration set-up.
Ultrafiltration was addressed with the evaluation of cassette and hollow fiber modules.The results obtained show that cassette module with cut-o�s in the 500 kDa range and highlyhydrophilic materials enable complete recovery of infective Adenovirus while reducing processtime in half when compared with the best hollow fibers. Despite the encouraging results withAdenovirus, the experiments using Retrovirus resulted in low yields and possible optimizationstrategies were identified.
Membrane technology was also evaluated as an alternative to the packed-bed chromatog-raphy columns. By using a scale-down 96-well device, the impact of ligand density, membranestructure and feed conductivity were evaluated for the purification of Adenovirus by ion ex-change chromatography. The hydrogel-grafted membrane with ligand density of 2.4 µmol cm-2
operated in bind/elute mode shown the best compromise between yield and purity.Overall, this thesis contributed to the advancement of virus purification field by exploiting
innovative technologies.
Keywords: virus purification; clarification; ultrafiltrattion; membrane chromatography;biopharmaceuticals; innovative technologies.
ix

x

Resumo
Os vírus são vectores altamente eficientes que tem sido aplicados para vacinação e terapiagénica. Contudo, a sua complexidade torna o processo de purificação particularmente de-safiante uma vez que materiais e estratégias desenhadas especificamente para purificação devírus são inexistentes ou precisam de ser optimizados. Após uma introdução sobre os desafiosrelativos à purificação de vírus e estratégias atualmente usadas, é apresentado o estudo detrês etapas diferentes do processo de purificação: clarificação, ultrafiltração e cromatografia.
Foi estudado um inovador processo de clarificação que usa terras de diatomáceas. Osensaios em pequena escala identificaram Divergan RS – um material sintético não carregado –como o candidato mais promissor para a integração no passo de clarificação.
Relativamente à ultrafiltração, foram testados vários módulos de cassete e de fibras ocas.Os resultados obtidos indicam que os módulos de cassete com um cut-o� próximo de 500 kDae material altamente hidrofílico permitem recuperar 100 % dos Adenovírus infecciosos e aomesmo tempo reduzir o tempo de processamento para metade relativamente aos módulosde fibras ocas. Apesar dos resultados positivos obtidos com Adenovírus, os ensaios comRetrovírus resultaram em baixos rendimentos e as possíveis causas foram identificadas.
A tecnologia de membrana foi estudada como alternativa à de cromatografia de leito com-pactado. Através um dispositivo de 96 poços, o impacto da densidade de ligando, da estruturada membrana e da condutividade da carga foram avaliados na purificação de Adenovírus porcromatografia de troca iónica. A membrana modificada com hidrogel e uma densidade deligando de 2.4 µmol cm-2 resultou no melhor compromisso entre rendimento e pureza.
Na globalidade, esta tese contribuiu para o avanço na área da purificação de vírus atravésdo estudo de tecnologias inovadoras.
Palavras-chave: purificação de vírus; clarificação, ultrafiltração; cromatografia de mem-brana; biofármacos; tecnologias inovadoras.
xi

xii

Contents
I Introduction 1
1 Purification of complex biopharmaceuticals 31.1 Complex biopharmaceuticals . . . . . . . . . . . . . . . . . . . . . . . . . . . 3
1.1.1 The challenges of complex biopharmaceuticals . . . . . . . . . . . . . . 31.1.2 The Adenovirus - a stable proteic capsid particle . . . . . . . . . . . . 61.1.3 The Retrovirus - a labile enveloped particle . . . . . . . . . . . . . . . 7
1.2 Current scalable DSP strategies . . . . . . . . . . . . . . . . . . . . . . . . . . 81.2.1 Harvest . . . . . . . . . . . . . . . . . . . . . . . . . . . . . . . . . . . 91.2.2 Clarification . . . . . . . . . . . . . . . . . . . . . . . . . . . . . . . . . 101.2.3 Concentration . . . . . . . . . . . . . . . . . . . . . . . . . . . . . . . . 111.2.4 Intermediate purification . . . . . . . . . . . . . . . . . . . . . . . . . 121.2.5 Polishing . . . . . . . . . . . . . . . . . . . . . . . . . . . . . . . . . . 13
1.3 Scope of the thesis . . . . . . . . . . . . . . . . . . . . . . . . . . . . . . . . . 13
II Materials and Methods 15
2 Materials and Methods 172.1 Cell lines, culture media and virus strains . . . . . . . . . . . . . . . . . . . . 172.2 Virus production . . . . . . . . . . . . . . . . . . . . . . . . . . . . . . . . . . 18
2.2.1 Ad5 stock production . . . . . . . . . . . . . . . . . . . . . . . . . . . 182.2.1.1 CsCl gradient purification . . . . . . . . . . . . . . . . . . . . 18
2.2.2 Ad5 bioreactor production . . . . . . . . . . . . . . . . . . . . . . . . . 182.2.3 RV production . . . . . . . . . . . . . . . . . . . . . . . . . . . . . . . 19
2.3 Virus purification . . . . . . . . . . . . . . . . . . . . . . . . . . . . . . . . . . 192.3.1 Harvest and Clarification . . . . . . . . . . . . . . . . . . . . . . . . . 19
2.4 Body feed filtration . . . . . . . . . . . . . . . . . . . . . . . . . . . . . . . . . 19
xiii

2.5 Ultrafiltration studies . . . . . . . . . . . . . . . . . . . . . . . . . . . . . . . 202.6 Membrane chromatography . . . . . . . . . . . . . . . . . . . . . . . . . . . . 232.7 Analytical methods . . . . . . . . . . . . . . . . . . . . . . . . . . . . . . . . . 23
2.7.1 Total virus particles quantification . . . . . . . . . . . . . . . . . . . . 232.7.2 Infectious virus particles titration . . . . . . . . . . . . . . . . . . . . . 232.7.3 DNA quantification . . . . . . . . . . . . . . . . . . . . . . . . . . . . 242.7.4 Protein analysis . . . . . . . . . . . . . . . . . . . . . . . . . . . . . . 24
III Results and Discussion 27
3 Body Feed Filtration 293.1 Virus recovery . . . . . . . . . . . . . . . . . . . . . . . . . . . . . . . . . . . 293.2 Impurity removal . . . . . . . . . . . . . . . . . . . . . . . . . . . . . . . . . . 313.3 Discussion . . . . . . . . . . . . . . . . . . . . . . . . . . . . . . . . . . . . . . 32
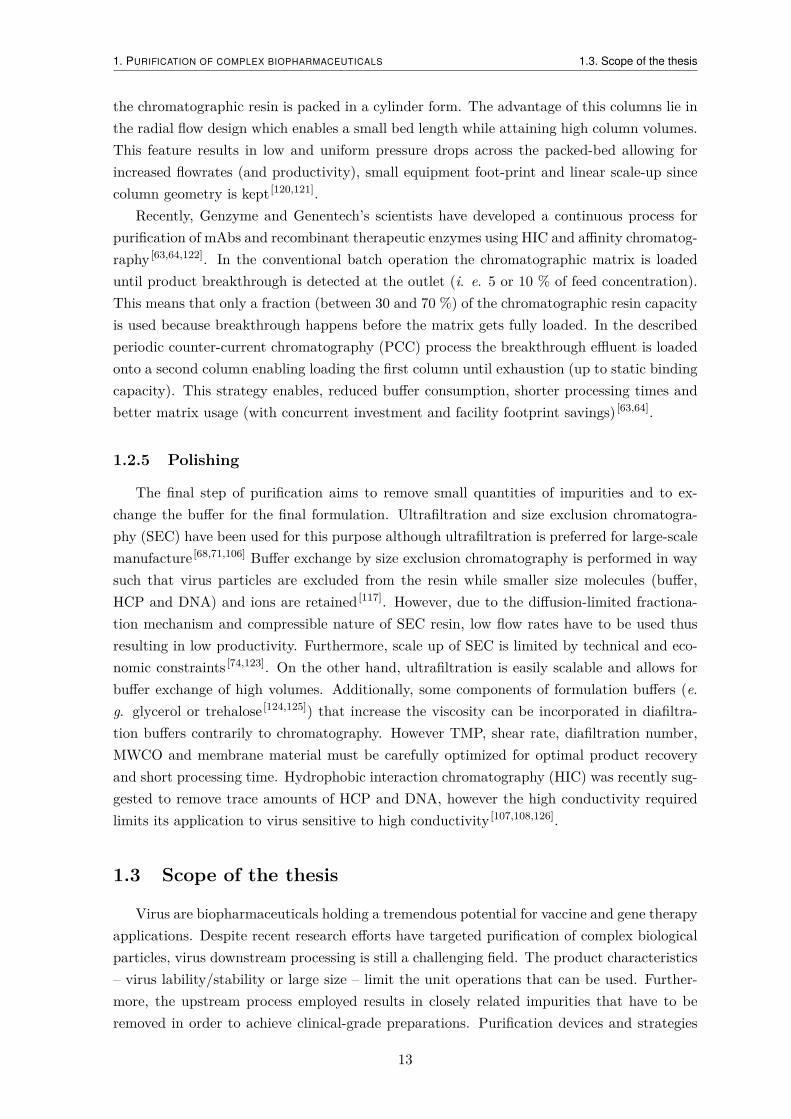
4 Ultrafiltration 334.1 R&D prototypes . . . . . . . . . . . . . . . . . . . . . . . . . . . . . . . . . . 33
4.1.1 Hydraulic permeability . . . . . . . . . . . . . . . . . . . . . . . . . . . 334.1.2 Virus recovery . . . . . . . . . . . . . . . . . . . . . . . . . . . . . . . 344.1.3 Impurity removal . . . . . . . . . . . . . . . . . . . . . . . . . . . . . . 35
4.1.3.1 Protein clearance . . . . . . . . . . . . . . . . . . . . . . . . 354.1.3.2 DNA clearance . . . . . . . . . . . . . . . . . . . . . . . . . . 36
4.1.4 Productivity analysis . . . . . . . . . . . . . . . . . . . . . . . . . . . . 364.1.5 Flux Recovery . . . . . . . . . . . . . . . . . . . . . . . . . . . . . . . 37
4.2 Commercial/pilot production devices . . . . . . . . . . . . . . . . . . . . . . . 384.2.1 Hydraulic permeability . . . . . . . . . . . . . . . . . . . . . . . . . . . 384.2.2 Virus recovery . . . . . . . . . . . . . . . . . . . . . . . . . . . . . . . 394.2.3 Impurity removal . . . . . . . . . . . . . . . . . . . . . . . . . . . . . . 40
4.2.3.1 Protein clearance . . . . . . . . . . . . . . . . . . . . . . . . 404.2.3.2 DNA clearance . . . . . . . . . . . . . . . . . . . . . . . . . . 41
4.2.4 Productivity analysis . . . . . . . . . . . . . . . . . . . . . . . . . . . . 424.2.5 Flux Recovery . . . . . . . . . . . . . . . . . . . . . . . . . . . . . . . 42
4.3 Discussion . . . . . . . . . . . . . . . . . . . . . . . . . . . . . . . . . . . . . . 43
5 Membrane chromatography 475.1 Hydrogel-grafted membranes . . . . . . . . . . . . . . . . . . . . . . . . . . . 47
5.1.1 Virus recovery . . . . . . . . . . . . . . . . . . . . . . . . . . . . . . . 475.1.2 Impurity removal . . . . . . . . . . . . . . . . . . . . . . . . . . . . . . 48
5.1.2.1 Protein clearance . . . . . . . . . . . . . . . . . . . . . . . . 485.1.2.2 DNA clearance . . . . . . . . . . . . . . . . . . . . . . . . . . 49
5.2 Directly grafted membranes . . . . . . . . . . . . . . . . . . . . . . . . . . . . 505.2.1 Virus recovery . . . . . . . . . . . . . . . . . . . . . . . . . . . . . . . 505.2.2 Impurity removal . . . . . . . . . . . . . . . . . . . . . . . . . . . . . . 51
xiv

5.2.2.1 Protein clearance . . . . . . . . . . . . . . . . . . . . . . . . 515.2.2.2 DNA clearance . . . . . . . . . . . . . . . . . . . . . . . . . . 51
5.3 Discussion . . . . . . . . . . . . . . . . . . . . . . . . . . . . . . . . . . . . . . 52
IV Conclusions 55
6 General Discussion and Conclusion 576.1 Debottlenecking the DSP rigth from the beginning . . . . . . . . . . . . . . . 576.2 Future work and outlook . . . . . . . . . . . . . . . . . . . . . . . . . . . . . . 58
Appendix 73
xv

xvi

List of Figures
1.1 Structure of the Adenovirus by cross-section representation. . . . . . . . . . . 61.2 Structure of the Retovirus by cross-section representation. . . . . . . . . . . . 7
2.1 Schematic representation of the hydrogel-grafted and directly grafted membrane. 23
3.1 TP recovery after incubation with di�erent filter aids. . . . . . . . . . . . . . 303.2 IP recovery after incubation with di�erent filter aids. . . . . . . . . . . . . . . 303.3 DNA clearance after incubation with di�erent filter aids. . . . . . . . . . . . . 313.4 HCP clearance after incubation with di�erent filter aids. . . . . . . . . . . . . 32
4.1 NWP20¶C for the di�erent R&D UF prototypes . . . . . . . . . . . . . . . . . 334.2 TP recovery for the di�erent R&D UF prototypes . . . . . . . . . . . . . . . 344.3 HCP clearance for the di�erent R&D UF prototypes . . . . . . . . . . . . . . 354.4 SDS-PAGE comparative analysis of the di�erent R&D UF prototypes . . . . 364.5 DNA clearance for the di�erent R&D UF prototypes . . . . . . . . . . . . . . 364.6 Permeate flux and throughput capacity of each R&D UF prototypes . . . . . 374.7 Flux recovery for the di�erent R&D UF prototypes . . . . . . . . . . . . . . . 384.8 NWP20¶C for the di�erent UF devices . . . . . . . . . . . . . . . . . . . . . . 384.9 TP recovery for the di�erent UF devices . . . . . . . . . . . . . . . . . . . . . 394.10 HCP clearance for the di�erent UF devices . . . . . . . . . . . . . . . . . . . 404.11 SDS-PAGE comparative analysis of the di�erent UF devices . . . . . . . . . . 414.12 DNA clearance for the di�erent UF devices . . . . . . . . . . . . . . . . . . . 424.13 Permeate flux and throughput capacity of each UF devices . . . . . . . . . . 434.14 Flux recovery for the di�erent UF devices . . . . . . . . . . . . . . . . . . . . 44
5.1 TP recovery for the hydrogel-grafted membrane. . . . . . . . . . . . . . . . . 485.2 Protein clearance for the hydrogel-grafted membrane. . . . . . . . . . . . . . 495.3 DNA clearance for the hydrogel-grafted membrane. . . . . . . . . . . . . . . . 495.4 TP recovery for the directly grafted membrane. . . . . . . . . . . . . . . . . . 505.5 Protein clearance for the directly grafted membrane. . . . . . . . . . . . . . . 51
xvii

5.6 DNA clearance for the directly grafted membrane. . . . . . . . . . . . . . . . 525.7 Experimental design space for the hydrogel-grafted membranes. . . . . . . . . 52
A1 Amount of the di�erent filter aids used in dry state. . . . . . . . . . . . . . . 75A2 Volume filed by the wet filter aid with 50 mL of virus bulk. . . . . . . . . . . 75
xviii

List of Tables
1.1 Specifications for biotechnological products. . . . . . . . . . . . . . . . . . . . 5
2.1 Membrane characteristics and feed flow rates used. . . . . . . . . . . . . . . . 22
4.1 IP recovery for the di�erent R&D UF prototypes . . . . . . . . . . . . . . . . 344.2 IP recovery for the di�erent UF devices . . . . . . . . . . . . . . . . . . . . . 40
xix

xx

List of Symbols
ACRONYMSAd5 Adenovirus serotype 5ATCC american type culture collectionBFF body feed filtrationCEX cation exchange chromatographycGMP current good manufacturing practicesCIP cleaning-in-placeD-PBS Dulbecco’s phosphate-bu�ered salineDE diatomaceous earthDF diafiltrationDMEM Dulbecco’s Modified Eagle MediumEMA European Medicines AgencyFDA Food and Drug AdministrationGaLV gibbon ape leukemia virusGFP green fluorescent proteinHEPES 2-[4-(2-hydroxyethyl)piperazin-1-yl]ethanesulfonic acidHF hollow fiberHPV human papillomavirusmAb monoclonal antibodyMF microfiltrationMLV murine leukemia virusMWM molecular weight markerPES polyethersulfonepI isoelectric pointPS polysulfonePVDF polyvinylidene fluoride
xxi

RC regenerated celluloseRV retrovirusSDS-PAGE sodium dodecyl sulphate polyacrylamide gel electrophoresisSEC size exclusion chromatographySEM standard error of the meanTFF tangential flow filtrationTRIS tris(hydroxymethyl)aminomethaneUF ultrafiltrationVLP virus-like particleGREEK SYMBOLS“̇w shear rate (s-1)÷ dynamic viscosity (Pa s)‡ conductivity (mS cm-1)· throughput capacity (L m-2 h-1)ROMAN SYMBOLSA area (m2)C concentrationh flow channel height in a cassette module (m)J flux (LMH © L m-2 h-1)K hydraulic permeability (m)n number of fibers in a hollow fiber moduleQ volumetric flow rate (mL min-1)r radius (m)Re Reynolds number ( – )t time (min)v linear velocity (m s-1)w flow channel width in a cassette module (m)Y recovery yield (%)g gravitational acceleration at the Earth’s surface (9.81 m s-2)Abs absorbance (AU)CF concentration factor ( – )Da molecular mass (Dalton © g mol-1)DNA deoxyribonucleic acid (µg mL-1)HCP host cell protein (µg mL-1)IP infectious particles (particles mL-1)NWP20¶C normalized water permeability corrected for 20¶C (LMH bar-1)P pressure (bar)rpm rotations per minute (min-1)
xxii

T temperature (¶C)TCF temperature correction factor ( – )TMP transmembrane pressure (bar)TP total particles (particles mL-1)WCW wet cell weight (g L-1)SUBSCRIPTS AND SUPERSCRIPTSf feedi initialp permeater retentate
xxiii

xxiv

Part I
Introduction


1Purification of complex
biopharmaceuticals
1.1 Complex biopharmaceuticals
Biopharmaceuticals are structured and highly specific biomolecules capable of targetingunmet medical needs where other drugs have failed. The success of these novel bio-basedpharmaceuticals has been reshaping medical therapies over the past decades [1]. Nowadaysthere are numerous biopharmaceuticals (both approved and under development) with a widerange of sizes, levels of complexity and medical indications [2,3]. Some examples of approvedbiotherapeutics are the Factor VIII (blood factor), tissue plasminogen activator (antico-agulant/thrombolytic), insulin and insulin-derived products, erythropoietins, interferon-–,pegaptanib (nucleic acid-based anti-angiogenic medicine), monoclonal antibodies (mAbs),human papillomavirus (HPV) virus-like particle (VLP) vaccine, inactivated influenza virusvaccines and adeno-associated viral (AAV) gene therapy vector (Glybera®) [2,4].
Among the above-referred biomolecules virus-based biopharmaceuticals hold a greatpromise to redefine modern medicine in di�erent fields such as vaccination [5], gene therapy [4]
and cancer treatment [6]. However these biopharmaceuticals represent also a series of thechallenges both product- and process-wise since their are not as well studied and developedas other less complex biopharmaceuticals already established.
1.1.1 The challenges of complex biopharmaceuticals
Virus and virus-like particle are considerably larger than an insulin protein or a mAband their size can range from 20 nm (parvovius) to 300 nm (Measles and Mumps virus),
3

1. PURIFICATION OF COMPLEX BIOPHARMACEUTICALS 1.1. Complex biopharmaceuticals
with di�erent possible morphologies (i. e. the rod-shape of Baculovirus) [7,8]. The highlyrepetitive tri-dimensional structure is fundamental for immunization in the case of vaccines.Additionally, post-translational modifications, like glycosylation, impact the immunogenicityand antigenicity of the vaccine [9,10]. For gene therapy applications the vector quality iscrucial [11].
As a result of this complexity, animal cell lines have to be used often for production ofthese virus-based biopharmaceuticals. The new virus vaccines are now produced in cell-basedsystems. The traditional production with fertilized eggs has several drawbacks since it is awork-intensive process, is dependent on egg supply, is not fast enough in the case of a globalpandemics and might cause anaphylactic reactions due to egg’s proteins [1,7,12]. Vaccinesrecently developed and under development make use of continuous mammalian cell lines suchas the African green monkey kidney (VERO) cells [13,14], the human lung fibroblast (MRC-5) cells [15], Madin-Darby Canine Kidney (MDCK) cells [16], human embryonic retina-derivedPER.C6®cells (Crucell) [17–19] and human embryonic kidney (HEK) 293 [19,20].
The VLP-based vaccines might be produced by a wide range of hosts from mammaliancell lines to transgenic plants, however only VLPs produced in yeast and animal cell lines wereapproved by regulatory authorities [5,8]. The recombinant hepatitis B vaccines are producedalmost exclusively in yeast systems (Saccharomyces cerevisiae, Pichia pastoris and Hansenulapolymorpha) with the exception of chinese hamster ovary (CHO) cells, which is the onlymammalian cell line used. S. cerevisiae is also used for production of the Merck & Co’sHPV-VLP [21] whereas the GSK’s HPV-VLP is produced with the baculovirus-insect cell (B-IC) system [22]. These expression systems seem to have a favorable compromise between highproductivity/yield and capability to perform post-translational modifications [5].
Contrarily to VLPs, the gene therapy vectors are less flexible in terms of productionsystem and the system chosen is dependent on the virus used. Ad-based vectors are producedin a complementing cell line (see Section 1.1.2), such as the 293 and the PER.C6® celllines [19,23]. In the case of AVV vectors, like UniQure’s Glybera® – recently approved byEMA –, these can be produced in mammalian cell lines as well as with the B-IC system [24,25].The current retrovirus production systems rely on genetically engineered virus packaging celllines (see Section 1.1.3), usually human-derived cell lines [26,27].
As biopharmaceuticals are intended for therapeutic human use there are stringent guide-lines put in place by the regulatory agencies (e. g. EMA or FDA). The Table 1.1 reports thequality attributes evaluated by the regulatory authorities [28,29].
The analyticals for virus-based biopharmaceuticals must be highly specific and robust,however often new analytical assays must be developed and validated, specially for innovativetherapeutic biomolecules. Additionally, the lack of well-characterized and accepted standardsadds up to the challenges of developing new analytical assays for such specific products [1,31].
The final goal is to obtain a biopharmaceutical of high purity (process-related impurities,like HCP and DNA, within regulatory specifications), high potency (highest concentrationfeasible of the relevant active component) and high quality (low concentration of product-derived impurities relatively to the desired product, e. i. virus capsid proteins or nonfunctional virions).
4

1. PURIFICATION OF COMPLEX BIOPHARMACEUTICALS 1.1. Complex biopharmaceuticals
Table 1.1: Specifications for biotechnological products [28–30].Attribute Specification
Appearance anddescription
ColorPhysical stateClarity/turbidity(Qualitative statement)
Identity
Multiple tests might be required:PhysicochemicalBiologicalimmunichemical(Highly specific butmight be qualitative)
Purity
Product-relatedimpurities
Degradated productTruncated formsMolecular variantsAggregates
Process-relatedimpurities
Host cell protein (HCP)Host cell DNAMedia components/ancillariesEnzymes/chemicalsLeachables
Potency Cell-based test orAnimal-based test
Quantity Protein mass orPotency (if applicable)
Safety
SterilityAdventitious virusEndotoxins/PyrogensMycoplasma
General pHOsmolarity
Two highly relevant representatives of these virus-based biopharmaceuticals are aden-ovirus and retrovirus.
5

1. PURIFICATION OF COMPLEX BIOPHARMACEUTICALS 1.1. Complex biopharmaceuticals
1.1.2 The Adenovirus - a stable proteic capsid particle
The Adenoviridae family is composed of over 100 virus, 57 serotypes of which are capableof infecting humans [32].
The adenovirus serotype 5 (Ad5) was the first adenovirus discovered when its icosahedralshape was reveled by Horne in 1959 [33]. Since then it has been extensively studied, usedas virus model and nowadays is widely characterized. The Ad5 is a nonenveloped double-stranded DNA virus with a molecular weight of 150-170 MDa (90-100 nm in diameter) [32,34,35],has a pI of approximately 4.5 and thus is negatively charged at physiological pH [36]. Thevirus is composed of 11 di�erent proteins (Figure 1.1), 7 are the structural proteins (II, III,IIIa, IV, VI, VIII and IX) which compose the icosahedral virus capsids and the remaining 4proteins (V, VII, mu and terminal protein) are packed inside the capsid together with thevirus DNA to form the core [32,37,38].
The virus capsid is composed of twelve hexon trimers (polypeptide II - 107.9 kDa for Ad5)in each of the 20 facets and twelve pentons in each of the twelve vertices (Figure 1.1). Eachpenton is a protein composed of one pentamer, the penton base (polypeptide III - 63.3 kDafor Ad5), and one trimer, the fiber (polypeptide IV - 61.6 kDa for Ad5) which is responsiblefor the adsorption to the cell surface via the CAR (Coxsackie/Adenovirus receptor) and–v-integrins. The remaining (minor) coat proteins are involved in virus stability, correctassemble and disassemble of the virion [32,38,39].
Vterminal
VII(X) mudsDNA
VIIIVIfiber (IV)
IX
IIIahexon (II)
penton base (III)
Figure 1.1: Structure of the Adenovirus by cross-section representation. The coat proteins are listedon the right side and the core proteins and DNA are on the left side.
The application of Ad5 goes beyond fundamental research and its use as biotechnologyproduct is very significant, either as gene therapy vector [40], oncolytic virus [41] or recombinantvaccines [42,43]. The best know examples are the use of recombinant p53-Ad5 approved inChina for cancer therapy [44,45] and the Merck & Co’s candidate HIV Ad5-based vaccine
6

1. PURIFICATION OF COMPLEX BIOPHARMACEUTICALS 1.1. Complex biopharmaceuticals
(although clinical tests failed for Ad5-based vaccine, currently di�erent, rarer Ad serotypesare being evaluated) [46,47].
However to use Ad-based therapies safely, these virus are genetically modified to renderreplication-incompetent vectors (or conditionally replication-competent virus for oncolytictherapy). To accomplish this several genes of the Ad5 genome were removed or mutated.Initially the genes targeted were involved in viral DNA transcription, inhibition of cell apop-tosis, avoiding host immune response and viral DNA replication [32]. More recently, helper-dependent Ad (also named gutless or high-capacity) were developed. Since these vectors haveno viral DNA, a helper virus has to be used to provide all structural proteins [23,32,48,49].
For the production of replication-incompetent adenoviral vectors trans-complementingcell lines must be used in order to provide the deleted functions. Several cell lines have beenused for Ad production, with the 293 and the PER.C6® being the most used. Since the Ad-producing cell lines can adapted to grow in suspension, stirred-tank bioreactors have beenused with or without the aid of microcarriers [19,23].
1.1.3 The Retrovirus - a labile enveloped particle
The Retroviridae is a family of viruses characterized by their RNA genome and its retro-transcription into DNA prior to protein synthesis. Notable species of this family includethe murine leukemia virus (MLV), belonging to the gamma-retrovirus genus (herein referredto as retrovirus (RV)) and the human immunodeficiency virus (HIV) which belongs to theLentivirus genus [50]. The RV is an enveloped, spherical, slightly pleomorphic particle with adiameter of 100-120 nm (Figure 1.2). The virion structure is divided in three major parts, the
RTPR
RNA
IN
CANC
MA
SUEnv
Gag
TM
Lipidbilayer
Figure 1.2: Structure of the Retovirus by cross-section representation.
envelope, the proteic capsid and the viral genome. The envelope that covers the the proteiccapsid is composed by a bi-lipidic layer and 100-300 Env glycoproteins (69.8 kDa) consistingof transmembrane (TM, 19.9 kDa) and surface (SU, 47.9 kDa) subunits. The SU subunitinteracts with the cell membrane receptors to promote the fusion of the envelope with the cellmembrane during the infection process. Given its function, the Env protein (and the virus
7

1. PURIFICATION OF COMPLEX BIOPHARMACEUTICALS 1.2. Current scalable DSP strategies
envelope) is of great relevance of highly infective retroviral preparations. The Gag protein(60.7 kDa) interacts both with the Env proteins by its N-terminal matrix domain (MA) andthe inner space of the virus capsid with through its C-terminal nucleocapsid (NC) domain.Inside this proteic structure, besides the ssRNA molecule, there are also the PR (responsiblefrom virus’ protein cleavages during assembling, budding and maturation), the RT (whichdoes the reverse-transcription of the viral RNA) and the IN (responsible for integrating thepro-viral DNA) proteins [51,52].
Retroviral vectors are highly advantageous for gene therapy due to their high transductione�ciency of replicating cells, low immunogenicity and ability to integrate the proviral cDNA(with the therapeutic gene) into the host genome, rendering a long-term e�ect [48]. Moreover,RV are the second most used gene therapy vector in clinical trials worldwide (the first beingadenovirus) [53].
Since retrovirus have a modular structure they can be pseudotyped, i. e. the env regionof the genome can be replaced by the env region of another, more favorable, retrovirus.The possibility to engineer the vector allowed to change, restrict ou broaden vector tropismand to modulate its immunogenicity. Among several Env proteins used, the MLV-basedretrovirus pseudotyped with gibbon ape leukemia virus (GaLV) Env has been one of themost studied [26,27].
As earlier described for Ad5, also retroviral vectors being developed for human therapeuticpurposes must be replication-incompetent. This is accomplished by providing the transgene ofinterest together with the packing signal in a di�erent transcriptional unit(s) than the packingfunctions (env and gag-pro-pol). Current RV generations have three di�erent transcriptionalunits (transgene, gag-pro-pol and env) with reduced sequence homology, thus reducing greatlythe frequency of replication-competent RVs [26,27].
For retrovirus production the packing functions (i. e. structural proteins) can be suppliedeither by a plasmid transfection (transient production) or by a packing cell line engineered toexpress constitutively those functions (stable production). While transient production is onlysuitable for small scale research purposes, the stable production includes the long process ofdeveloping a high titer packing cell line but yields a continuous low-variability productionsuitable for clinical lots. Currently, human cell lines, namely HEK-derived, are preferred tothe murine cell lines for the development of retrovirus-producing cells [26,27,54].
The RV-packing cells are generally cultured in static systems due to their anchorage-dependent feature. High capacity static system such as the Cell Factory® have been reportedfor clinical production of RV under current good manufacturing practices (cGMP) [55–57].These kind of strategies enable a limited but rapid and reliable scale-up and might provideenough material for pre-clinical and early clinical phases.
1.2 Current scalable DSP strategies
The biopharmaceutical process is no longer seen as the sum of upstream with downstreamprocesses and there is a e�ort to integrate and design together production and purification.Despite this, the downstream process is still crucial to obtain the final intended product; alsothe substantial developments achieved in the upstream process were not matched by small
8

1. PURIFICATION OF COMPLEX BIOPHARMACEUTICALS 1.2. Current scalable DSP strategies
improvements in the downstream. Furthermore, the cost of purification can go from 50 % upto 70 % of the total process [58,59]. Meaning that careful choice of operations, materials andequipment should be made to in order to keep the whole process cost-e�ective. Besides cost,the scalability of the DSP developed is a key issue. Robustness is also a required feature sothat small variations in upstream processing as well as in previous downstream operationsdo not impact the whole bioprocess performance and final product quality.
The following section describe the state-of-the-art regarding virus purification includingnovel technological advances, emerging industry trends and rational process developmentapproaches for di�erent stages of the DSP train. Some examples are the greater integra-tion between upstream and downstream, high density cell systems, continuous processing,scale-down tools closed systems, modulatiry, numbering up instead of scale-up (for nichebiopharmaceuticals) and disposable technologies [60–64].
1.2.1 Harvest
The first steps of the purification train are heavily influenced by the bioreactor bulk fea-tures, namely cell density, cell viability or if the product is secreted for the culture supernatantor if the cells have to be lysed.
In cases such as Ad5 production, is usually chosen to recover both the intra- and extra-cellular virus faction and thus an additional step is performed for virus release [19,23]. The celllysis can be performed using di�erent methods such as freeze-thaw, detergents, French Press,homogenizer or sonication [65]. Among these, non-ionic detergents especially Triton™ X-100have been preferred [18,19,65–67]. Incubating the bulk with detergent is e�cient, fast, robust,easily scalable, cost-e�ective and does not require any investment in equipment, howeverremoval of this additive has to be confirmed.
Although cell lysis enables the recovery of intra-celullar virus it also releases the hostcell DNA and protein which should be removed from the final product. Host cell DNA is ofspecial concern because it increases substantially bulk viscosity but also due to regulatoryrequirements. The DNA acceptable levels set by the regulatory authorities are generallybetween 10 ng and 10 pg per dose, depending on type of product, medical indication, pro-duction host and administration route. Therefore, the majority of scientific manuscriptspublished and patents disclosed refer an incubation step with nuclease (e. g. Benzonase®)either simultaneously with cell lysis or after clarification [18,19,65–68]. For enveloped virus, likeRV or baculovirus, cell lysis is not required since the virus are secreted by the producer cells– budding process. Therefore, the use of nuclease might be avoided for enveloped virus DSPdue to its high costs [54,69].
Selective precipitation has been suggested as an alternative to nuclease treatment toremove host cell DNA [17,70–72]. Cationinc detergents (namely domiphen bromide) are able toprecipitate DNA as well as Ad particles (both negatively charged and mildly hydrophobic).However fine adjustment of precipitant concentration enables up to 90 % DNA removal withmore than 90 % Ad recovery [70]. Selective DNA precipitation has the advantage of beinginexpensive, easily scalable (precipitated DNA can be removed by depth filter) and suitablefor high cell density processes [17,71].
9

1. PURIFICATION OF COMPLEX BIOPHARMACEUTICALS 1.2. Current scalable DSP strategies
1.2.2 Clarification
The goal of clarification is to recover and stabilize the product while removing solids,cells/cell debris and process impurities (DNA and HCP). Centrifugation and membrane fil-tration are the two common choices for the initial clarification.
Centrifugation is an operation widely used at laboratory scale for research purposes bothto clarify the cell culture fluid (CCF) and to obtain high purity viral preparations (by CsClgradient ultracentrifugation). The centrifugal separation is based on the solutes’ di�erentdensities meaning that clarification is generally a fast process. However, centrifugation hasseveral issues like the high maintenance costs, the lack of reliable scale-down model, does notremove soluble impurities and safety risks must be considered (for instance the Ad5 formsaerosols) [19,68,73]. Despite the earlier described limitations, continuous flow centrifugationare quite common in current industrial-scale operations for mAbs clarification where biore-action yields very high cell density CCFs (107 cell mL-1 and above). However in these casesthe clarification also comprises a depth filter operation to achieve higher removal of solubleimpurities (DNA and HCP) and low turbidity [74–77].
Microfiltration (MF) is an alternative to centrifugation which can be easily scaled up andimplemented in a cGMP setting. Microfiltration membranes have pore sizes in the 0.1–10 µmrange and can be classified as depth filters or "regular" filter depending on whether the solidsare retained throughout filter matrix/medium or only at its surface, respectively. Addition-ally, depth filter might include filter aids, e. g. diatomaceous earth (DE), to modify its struc-ture and charge [78]. Depth filters have been used for a wide variety of VLPs and viruses (en-veloped and non-enveloped) with recovery yields of approximately 90 % [66,67,69,79,80]. Depthfilters are usually preferred for feed streams with high biomass contents, sometimes lysedCCF, due to their ability to remove solids and impurities by di�erent mechanisms (size ex-clusion, hydrophobic and electrostatic interactions) [81]. Carefull selection of the filter (poresize, filter material, number and sequence of filter units) and operation parameters (inlet flowrate, pressure drop, conductivity and pH) must be assessed in order to avoid virus lossesand to allow solids and soluble impurities retention throughout the whole depth of the fil-ter medium rather than only at the filter surface. Often the trade-o� between feed flowrate/throughput and filter capacity/impurity removal should be evaluated [77,82].
Membrane microfiltration has also been performed either in normal (dead-end) or tangen-tial flow filtration (TFF) [79,83]. Microfiltration is usually operated at low pressures, especiallyTFF (less than 0.7 bar), and is better suited for low cell density CCFs [74]. However, mem-brane fouling or shear stress-induced cell lysis can become an issue [84].
More recently, a new microfiltration separation was purposed where a filter aid is mixedwith the CCF instead of being incorporated in the depth filter units [85,86]. The CCF andfilter aid (diatomaceous earth, layered double hydroxides or synthetic materials) are mixedand fed to a microfilter. This novel filtration would permit an enhanced adsorption duringmixing and the formation of highly porous and highly permeable cake (body feed) supportedby the filter aid, similarly to what is done in the brewing industry where diatomaceous earthis used to clarify beer [87]. Several patents applications claim that the body feed filtration(BFF) would avoid membrane fouling, enable lower pressure operation for longer times at
10

1. PURIFICATION OF COMPLEX BIOPHARMACEUTICALS 1.2. Current scalable DSP strategies
higher flow rates without compromising impurity removal. One paper recently published [88]
referrers the use of DE for clarification of a poliovirus CCF, however the performance of thismethod was not disclosed and its potential remains unexplored.
1.2.3 Concentration
Large-scale process can produce high volumes of CCF (up to 20 kL for mAbs [89]) whichmust be concentrated 10–100 times to be further purified by chromatographic steps. Ul-trafiltration (UF) is a pressure-driven separation which employs anisotropic membranes withmolecular weight cut-o�s (MWCO) ranging from 0.5 to 1000 kDa [84]. (The MWCO is definedby the solutes’ molecular mass which are 90 % retained by the membrane.) These membranescan be constructed with di�erent polymers like regenerated cellulose (RC), polysulfone (PS),polyethersulfone (PES) and polyvinylidene fluoride (PVDF), although RC and modified RCdisplays better trade-o� between low (unspecific) protein binding, mechanical strength andresistance to cleaning procedures (chemical agents and temperature) [74,90,91]. Ultrafiltrationmembrane are generally composed by two main layers, a thick macroporous structure pro-vides mechanical strength while a thin skin layer is responsible for membrane selectivity andpermeability [74].
Ultrafiltration is usually performed in TFF mode where the cross flow at the membranesurface creates a "sweeping action" that avoids or lessens concentration polarization and gellayer formation. UF processes are usually performed at constant transmembrane pressure(TMP, see equation 2.5, page 20), however constant permeate flux or constant permeatepressure operation are also feasible [74]. Ultrafiltration has been widely used both inconcentartive mode as well for bu�er exchange (diafiltration, DF) step and is present in almostevery virus DSP described in the literature [79,83,92–97] and patents disclosed [18,71,98]. Themembranes used in virus UF have MWCO in the range of 100–750 kDa allowing for high virusrecovery (70–100 %). The TMP generally used is between 0.5 and 1.4 bar but the optimumcross flow can vary greatly due to di�erent structural stability of virus; enveloped virus aremore labile than non-enveloped virus and thus more prone to shear-induced damage [83,97].The membrane modules might be constructed in di�erent arrangements, for example flatsheet cassette and hollow fibers. However the majority of the reports published referrers theuse of hollow fibers (HF) modules for virus processing [7,99] due to the fact that HF modulesprovide wider flow paths resulting in lower shear rates [7,84]. Shear rate is proportional tothe linear velocity of the feed and inversely proportional to the flow channel diameter orheight (see equation 2.9, page 21 for further details). The flow channel geometry influencesthe shear rate two ways: firstly, the wider flow channel result in lower linear velocity for thesame volumetric flow rate; and secondly, the wide flow channel results itself in lower shearrates. Although UF cassettes results in greater shear rates, these modules provide shorterprocessing times as the flow channel hydrodynamics are more e�ective than HF in avoidingconcentration polarization and gel layer formation [7,84].
Besides UF, rediscovered techniques like aqueous two-phase systems [100,101] and precipi-tation [102–104] have been suggested for early-stage operations in mAb DSP, however its ap-plicability and e�cacy remains unclear for virus-based biopharmcaeuticals [105].
11

1. PURIFICATION OF COMPLEX BIOPHARMACEUTICALS 1.2. Current scalable DSP strategies
1.2.4 Intermediate purification
The purification step(s) employs high resolution unit operations capable of removingimpurities closely related with the product, being chromatography the best example. Purifi-cation scientists have relied mainly on ion-exchange and size exclusion chromatography toprocess virus particles [23,26,92,106], although other techniques like a�nity [92,99], hydrophobicinteraction (HIC) [107,108] and multimodal [67] have been suggested.
Ion-exchange (IEX) chromatography is the method of choice for capture step. The virus-containing feed is loaded in the chromatographic matrix under low or moderate conductivityand recovered upon a conductivity increase of the mobile phase. The functional groups Q(quaternary amine) and DEAE (diethylaminoethyl) are common choices for this bind/elute(or positive) mode chromatography [23,99]. Accurate process development enables highly se-lective AEX chromatography capable of discriminate between whole virus and virus capsidproteins [109] or di�erent adenovirus serotypes [110,111].
Despite being widely used, packed-bed chromatography has several disadvantages: thepressure drop is high and increases during operation due to matrix deformation or poreobstruction; scale-up requires changes in the column geometry making scale-up problematic;the mass transfer is slow since it is limited by pore di�usion; the capacity is limited to theligand available at bead surface since the small pores (10–400 µm) will exclude the virusparticles. Additionally, the di�usion-limited transport greatly reduces binding capacity athigh flow rates (20–500 column volumes per hour) [112–114].
Membrane chromatography, in which a macroporous membrane serves as support tobound functional ligands, has the potential to overcome the limitations of the traditional chro-matography resins [114]. Monoliths – a single polymer block with a network of functionalizedflow paths highly interconnected – have also been suggested as an alternative for packed-bedchromatography [115]. The nearly-convective mass transport enables operation at flow ratesup to 500 membrane volumes per hour without decreasing binding capacity – reducing pro-cessing times. The wide porous (up to 3 µm) allow lower pressure drops and compact designcompared with packed-bed chromatography reduce hardware requirements and facility foot-print. Scale-up is greatly facilitated due to the modular design of chromatography supports.Since membranes adsorbers are single-use devices, column (re)packing, cleaning and valida-tions are avoided. The advantages referred above enable savings with the consumables andlabor costs [62,116,117], despite some limitations regarding membrane chromatography. Whilemultilayer membrane modules mitigated the distorted inlet flow, uneven membrane thick-ness and uneven pore size of the first membrane adsorbers some issues still remain. Themajor drawback of membrane adsorbers is lower binding capacity compared with packed-bedcolumns due to the lower surface-to-volume ratio [113,114]. AEX membrane adsorbers were firstdeveloped as flow-though (negative mode) chromatography for polishing step in mAbs DSPto capture virus, DNA and HCP [118]. However when used for virus purification, the productrecovery (desorption) and removal of closely related species (e. g. DNA) is limited. Consid-ering these drawbacks optimization of ligand density and membrane surface tri-dimensionalstructure were suggested to overcome the referred limitations [119].
Another di�erent option to improve chromatography is the use of radial columns, where
12
1. PURIFICATION OF COMPLEX BIOPHARMACEUTICALS 1.3. Scope of the thesis
the chromatographic resin is packed in a cylinder form. The advantage of this columns lie inthe radial flow design which enables a small bed length while attaining high column volumes.This feature results in low and uniform pressure drops across the packed-bed allowing forincreased flowrates (and productivity), small equipment foot-print and linear scale-up sincecolumn geometry is kept [120,121].
Recently, Genzyme and Genentech’s scientists have developed a continuous process forpurification of mAbs and recombinant therapeutic enzymes using HIC and a�nity chromatog-raphy [63,64,122]. In the conventional batch operation the chromatographic matrix is loadeduntil product breakthrough is detected at the outlet (i. e. 5 or 10 % of feed concentration).This means that only a fraction (between 30 and 70 %) of the chromatographic resin capacityis used because breakthrough happens before the matrix gets fully loaded. In the describedperiodic counter-current chromatography (PCC) process the breakthrough e�uent is loadedonto a second column enabling loading the first column until exhaustion (up to static bindingcapacity). This strategy enables, reduced bu�er consumption, shorter processing times andbetter matrix usage (with concurrent investment and facility footprint savings) [63,64].
1.2.5 Polishing
The final step of purification aims to remove small quantities of impurities and to ex-change the bu�er for the final formulation. Ultrafiltration and size exclusion chromatogra-phy (SEC) have been used for this purpose although ultrafiltration is preferred for large-scalemanufacture [68,71,106] Bu�er exchange by size exclusion chromatography is performed in waysuch that virus particles are excluded from the resin while smaller size molecules (bu�er,HCP and DNA) and ions are retained [117]. However, due to the di�usion-limited fractiona-tion mechanism and compressible nature of SEC resin, low flow rates have to be used thusresulting in low productivity. Furthermore, scale up of SEC is limited by technical and eco-nomic constraints [74,123]. On the other hand, ultrafiltration is easily scalable and allows forbu�er exchange of high volumes. Additionally, some components of formulation bu�ers (e.g. glycerol or trehalose [124,125]) that increase the viscosity can be incorporated in diafiltra-tion bu�ers contrarily to chromatography. However TMP, shear rate, diafiltration number,MWCO and membrane material must be carefully optimized for optimal product recoveryand short processing time. Hydrophobic interaction chromatography (HIC) was recently sug-gested to remove trace amounts of HCP and DNA, however the high conductivity requiredlimits its application to virus sensitive to high conductivity [107,108,126].
1.3 Scope of the thesis
Virus are biopharmaceuticals holding a tremendous potential for vaccine and gene therapyapplications. Despite recent research e�orts have targeted purification of complex biologicalparticles, virus downstream processing is still a challenging field. The product characteristics– virus lability/stability or large size – limit the unit operations that can be used. Further-more, the upstream process employed results in closely related impurities that have to beremoved in order to achieve clinical-grade preparations. Purification devices and strategies
13

1. PURIFICATION OF COMPLEX BIOPHARMACEUTICALS 1.3. Scope of the thesis
especially designed for virus purification are lacking or need further optimization; addition-ally most of the research and development (R&D) has been focused on the chromatographicstep – considered the major bottleneck of the purification train. As a result, the literaturethoroughly evaluating non-chromatographic operations for virus DSP is scarce. This thesisaims to improve the state-of-the-art virus purification by evaluating essential but less studiedseparations – clarification and ultrafiltration – as well as other better characterized DSP steps– membrane chromatography.
Clarification by depth filter is a technology easily scalable, capable of removing solubleimpurites and suspended solids. However limitations such as low filter capacity and low flowrates have been identified [77,82]. In Chapter 3 a novel clarification process based on body feedfiltration (or cake filtration) concept was evaluated. For this purpose di�erent filter aids (DEand synthetic polymer; charged and non-charged) were assessed for clarification of an Ad5bioreactor bulk.
Ultrafiltration is present in all large-volume virus purification schemes. Virus concen-tration and diafiltration is usually performed using hollow fiber UF modules. Despite itsgeneralized use, HF are known to be slower and more prone to fouling when compared withcassette modules. Considering the advantages of cassette UF, a study with R&D UF cassetteprototypes was performed in the first part of Chapter 4. In the second part of the chapter, acomparative evaluation between commercial HF and late-stage cassette devices is described.Two di�erent virus (Ad5, non-enveloped, and RV, enveloped) were used as models to char-acterize membrane MWCO and filter material and its impact on virus recovery, impurityremoval and processing time.
Membrane adsorbers have several advantageous features comparing with the traditionalpacked-bed column chromatography. However, further improvements are required to increasethe adoption of this technology. The last part of this thesis (Chapter 5) reports the use of ascale-down tool to evaluate how conductivity of the mobile phase, ligand density and structureof an IEX membrane a�ect a chromatographic purification of Ad5.
Overall, this thesis aims to evaluate the potential of enhanced and innovative technologiesto improve productivity and reduce cost-of-goods in the whole DSP train.
14

Part II
Materials and
Methods


2Materials and Methods
2.1 Cell lines, culture media and virus strains
The 293 cell line (ATCC CRL-1573) was used for adenovirus production as well as infec-tious virus particles (IP) titration. A recombinant replication-defective adenovirus serotype5 harboring a transgene for the green fluorescent protein (GFP) were used; the virus stockwas kindly provided by Professor Stefan Kochanek, University of Ulm, Germany. Therecombinant RV was produced in 293-derived cell line gene genetically engineered to provideconstitutively the packing functions required for RV assembly as described elsewhere [127].The RV produced is derived from the murine leukemia virus (MLV) with the Gibbon apeleukemia virus (GaLV) ecotropic envelope and harbors a GFP reporter gene. The 293 T cellline (ATCC CRL-11268) was used for infectious RV titration.
The 293 and 293 T cell lines were grown in cell culture flasks (353112, BD Falcon™, USA)with Dulbecco’s Modified Eagle Medium (DMEM, 41966-052, Gibco®, UK) supplementedwith 10 % (V/V) Fetal Bovine Serum (FBS, 10270-106, Gibco®, UK). For the 293 Flex GFPthe medium used was DMEM without phenol red (31053-036, Gibco®, UK), supplementedwith 10 % (V/V) FBS and 4 mM L-Glutamine (25030-024, Gibco®, USA). The 293 cellswere grown in a humidified atmosphere of 5 % CO2 at 37¶C, whereas the Flex 293 and293 T were grown in a 8 % CO2. The cells were routinely propagated twice a week using0.05 % Trypsin-EDTA (25300-104, Gibco®, UK). The cell concentration and viability weredetermined by counting cells on a Fuchs-Rosenthal haemocytometer (Brand, Germany) usingthe dye exclusion method with 0.1 % trypan blue (15250-061, Gibco®, UK).
For the suspension culture system (i. e. bioreactor production, see section 2.2.2) the293 cells adapted to suspension were grown with the commercially available serum-free cul-ture medium Ex-Cell 293 (14570C, SAFC®, USA) supplemented with 4 mM L-Glutamine
17

2. MATERIALS AND METHODS 2.2. Virus production
(25030-024, Gibco®, USA). The cells were routinely propagated twice a week using an inocu-lum of 0.5◊10+6 cell mL-1. Erlenmeyer shake flasks (431255, CORINING, USA) were usedfor suspension cell culture in a humidified atmosphere of 8 % CO2 at 37¶C. Agitation wasprovided by orbital shaking at 110 rpm.
2.2 Virus production
2.2.1 Ad5 stock production
For the small scale virus production, ten 175 cm2-cell culture flasks (353112, BD Falcon™,USA) with 80-90 % confluence were infected with a previously purified and characterized viralstock using a multiplicity of infection (MOI) of 5.
2.2.1.1 CsCl gradient purification
After 48 h, the infected cells were centifuged at 1 500 g for 5 min, ressuspended in lysisbu�er (10 mM TRIS, pH 8.0, 0.1 % (V/V) Triton X-100) and vigorously shaken. The cel-lular debris were removed by centrifugation at 1 000 g for 10 min and the virus-containingsupernatant was collected. This fraction was further purified by two rounds of CsCl ultra-centrifugation (Optima™ LE-80K, SW 41 Ti rotor both BECKMAN COULTER, USA). Thefirst round consisted in a discontinuous CsCl ultracentrifugation (1.25/1.45 kg/L density) at151 000 g for 90 min. The visible virus band was extracted and processed by a continuousCsCl gradient ultracentriguation (1.32 kg/L) at 151 000 g for 18 h. After the second of ul-tracentrifugation, the virus band collected was purified by SEC (HiPrep™ 26/10 Desalting,17-5087-01, GE Healthcare Life Sciences, Sweden) in order to change for the formulationbu�er (10 mM TRIS, pH 8.0, 2 mM MgCl2, 0.5 M trehalose). The purified virus stock wassterilized with 0.2 µm filter (4554, Pall, USA), aliquoted and stored at -80¶C until furtheruse.
2.2.2 Ad5 bioreactor production
The Ad5 production was performed in a 5-L working volume bioreactor (Sartorius Ste-dim Biotech, Germany). The dissolved oxygen was controlled at 50 % air saturation by aN2/O2/air mixture delivered by a sparger. The aeration rate was 0.01 vvm (vessel volumesper minute). The pH-value was controlled at 7.2±0.05 by aeration with CO2 in the gas mix-ture and by base addition (1 M NaHCO3). The temperature was controlled at 37¶C usingan external water-filled jacket. Mixing was provided by two 6-segment Ruston impellers withthe agitation rate controlled between 60 and 210 rpm.
The bioreactor inoculum was 0.5◊10+6 cell mL-1, the cell concentration at infection (CCI)was 1◊10+6 cell mL-1 and a MOI of 5 was used. The bioreactor was harvested 48 hours postinfection (hpi).
18

2. MATERIALS AND METHODS 2.3. Virus purification
2.2.3 RV production
For RV production twenty 175 cm2-cell culture flasks (353112, BD Falcon™, USA) wereused to expand the 293 Flex GFP cell in the serum-supplement medium. When the cellconfluence reached 80-90 % the medium was replaced by 25 mL of serum-free medium. Thecell culture supernatant was collected 24 h after medium exchange.
2.3 Virus purification
2.3.1 Harvest and Clarification
After Ad5 bioreactor harvest, the cells were lysed by adding Triton X-100 (X100,SIGMA-ALDRICH®, Switzerland) to a final concentration of 0.1 % (w/w). Simultane-ously, Benzonase® (101654, Merck Millipore, Germany) was added to a final concentrationof 50 U/mL. The virus-containing bioreactor bulk was incubated at 37¶C for 2 h.
Clarification of Ad5 bulk was performed resourcing to a Sartopore® 2 filter with0.8 + 0.45 µm pore size (5445306G8--OO, Sartorius, Germany). Before filtration the mod-ule was primed with three capsule volumes of TRIS bu�ered saline, pH 8.0 (TBS; T6664,SIGMA-ALDRICH®, Switzerland). The virus-containing bulk was loaded to the filter at aconstant flow rare equivalent to 150 LMH using a Tandem 1082 Pump (Sartorius StedimBiotech, Germany).
Cell lysis and nuclease incubation was not performed for the RV-containing bulk since thethese enveloped virus were collected in the cell culture medium. The RV-containing super-natant was clarified using a 0.45 µm vacuum-driven filter (SCHVU05RE, Merck Millipore,Germany). The filter was conditioned with 500 mL of TBS, pH 8.0 before virus microfiltra-tion.
2.4 Body feed filtration
For the screening four filter aids were tested:
Celpure® C300 (Advanced Mineral™, USA)
Celpure® C1000 (Advanced Mineral™, USA)
Celite® (World Maetrials, USA)
Divergan® RS (BASF, Germany)
All the filter aids were kindly provided by Dr. Franziska Jonas (Downstream ProcessTechnologies, Sartorius Stedim Biotech, Germany)
The screening procedure consisted in incubating 10 g of each of the filter aids with 50 mLof Ad5-containing lysed cell bulk at pH 4.5 and pH 7.0 (the bulk used was not treated withBenzonase® nor clarified in any way). Before adding the lysed cell bulk to the glass beakerswith the filter aids a sample was retrieved, the was measured (MM40+, CRISON, Spain) andthe turbidity was determined (2100Qis Portable Turbidometer, HACH®, Germany). The
19

2. MATERIALS AND METHODS 2.5. Ultrafiltration studies
mixtures were incubated at 20-22¶C under constant and gentle stirring. After 30 min and60 min of incubation the stirring was stopped (allowing the filter aid to settle by gravity) asample was collected.
Upon sample analysis the TP and IP recovery yield (YTP and YIP) were determinedaccordingly with equation 2.1 and 2.2, respectively.
YVP = CVPV
CVP,iVi(2.1)
YIP = CIPV
CIP,iVi(2.2)
Impurity – i. e., DNA and HCP – clearance (%) were also assessed and calculated asdefined by equation 2.3 and 2.4, respectively.
DNA Clearance = 1 ≠ CDNAV
CDNA,iVi(2.3)
HCP Clearance = 1 ≠ CHCPV
CHCP,iVi(2.4)
2.5 Ultrafiltration studies
The ultrafiltration devices were kindly provided by Dr. Tobias Schleuss (Membrane R&D,Sartorius Stedim Biotech, Germany). The membranes modules were set up accordingly withthe manufactures’ instructions. Briefly, a Tandem 1082 Pump (Sartorius Stedim Biotech,Germany) was used to feed the clarified bulk to the membrane device, the retentate wasrecycled to the feed container and the permeate was collected separately. The TMP (seeequation 2.5) was controlled by adjusting the retentate flow rate using a flow restrictionvalve. Sartocon Slice 200 Filter Holder was used (#17525 --- 01, Sartorius Stedim Biotech,Germany) for cassette devices. MasterFlex®14 tubing (MasterFlex Group, Germany) with1.6 mm internal diameter was used. The pressure was monitored at feed inlet, retentateoutlet and permeate outlet by in-line pressure transducers (080-699PSX-5, SciLog®, USA).Retentate temperature was measured with thermocouple sensor (56-4110-05 and PRT-DPM-3T/50, GE Healthcare Life Sciences, Sweden). The feed/retentate and the permeate volumeswere monitored using a technical scale (TE4101, Sartorius Stedim Biotech, Germany).
TMP = Pf + Pr
2 ≠ Pp (2.5)
Before any experiment the membranes were thoroughly rinsed with ultrapure water(Grade 1, as defined in ISO 3696) to eliminate trace preservatives. Membrane permeabil-ity was determined by the normalized water permeability corrected for 20¶C (NWP20¶C,LMH bar-1 © L m-2 h-1 bar-1). The NWP20¶C (equation 2.6) was calculated based on pure
20

2. MATERIALS AND METHODS 2.5. Ultrafiltration studies
water permeate fluxes (JP) measured at five di�erent TMP between 0.4 and 2.0 bar.
NWP20¶C = K
÷= Jp
TMPTCF (2.6)
The NWP was corrected for 20¶C using the temperature correction factor (TCF, equa-tion 2.7) based on water dynamic viscosity (÷) [128].
TCF = ÷T¶C÷20¶C
(2.7)
This measurement was done before the experiment, after the experiment and after CIP.After conditioning the UF system with diafiltration bu�er (20 mM TRIS, pH 8.0, 25 mM
NaCl), 450 mL of clarified feedstock containing Ad5 or RV were concentrated 10-fold and thenwere diafiltered five times. The UF/DF test was performed at a constant pressure of 1.2 barand at a constant feed flow rate (cross-flow) equivalent to a linear velocity (v) of 0.202 m s-1
(see Table 2.1). For the RV ultrafiltration with Type H membrane it was not possible toachieve the TMP of 1.2 bar while maintaining a recirculation flow rate appropriated forTFF. Therefore, exceptionally in this case the performance test was run at a TMP of 0.9 bar.The linear velocity used was kept constant for all experiments in order to have the sametangential flow/force. Unless stated otherwise, the membranes used for RV were coatedbefore UF experiment with 40 mL of 4 g L-1 human serum albumin (HSA) prepareted inbu�er 1. The HSA was recirculated at 120 mL min-1 for 10 min.
Throughout the filtration process samples of the retentate were collected and stored at-80¶C for further analysis.
The permeate flux was recorded by means of gravimetric control and membrane through-put capacity – · , the amount of feed processed within a period of time (t) using a givenmembrane area (A) – was determined according to equation 2.8.
· = Vi
At(2.8)
Also the shear rate at the wall (“̇w) under laminar flow conditions (Reynolds number,Re, < 2100 ) for HF and cassette modules were calculated as defined in equation 2.9 and2.10 [129], respectively.
“̇w = 8v
d= 4Q
nfir3 (2.9)
“̇w = 6v
h= 6Q
wh2 (2.10)
The CIP procedure consisted of washing the UF system with 1 M NaOH at a flow rate of500 mL/min and then a 60-min incubation. After this treatment the system was rinsed withultrapure water until the outlet stream reached pH 7.
For the Ad5 runs, all procedures were conducted at 20–22¶C, while fro RV runs all pro-cedures were performed at 8–14¶C.
21

2. MATERIALS AND METHODS 2.5. Ultrafiltration studies
Table2.1:
Mem
branecharacteristics
andfeed
flowrates
used.
Manufacturer
Mem
braneD
evelopment
stageFilter
material
Filterarea
(cm2)
Module
design
Flowchannel
Feedflow
rate(m
L/min)
Dim
ensions(10 -3
m)
Crosssection(10 -5
m2)
w◊
hr,
n
Com
petitorA
TypeB
b
R&
Dprototype
RC
200C
assette30
◊0.38
NA
1.14138
TypeC
a
TypeD
am
RC
TypeE
b
Type#
2c
PES30
◊0.30
NA
0.90109
Type#
4c
Com
petitorB
HF
3a
R&
Dprototype
PES155
Hollow
fiberN
A0.50,18
1.41171
HF
5b
Com
petitorA
TypeF
dPilot
productionm
RC
200C
assette30
◊0.38
NA
1.14138
TypeH
e
Com
petitorC
HF
7e
Com
mercial
PES225
Hollow
fiberN
A0.50,13
1.02124
RC
:regeneratedcellulose;
mR
C:regenerated
cellulosem
odifiedw
itha
highlyhydrophilic
cross-linking;PES:polyethersulfone;N
A:not
applicable/notavailable;
a,b,c,dand
e:T
heprecise
MW
CO
was
notavailable.
How
everit
was
disclosedthe
relativeM
WC
Ow
ithina
MW
CO
range;a,b
andc
were,respectively,the
prototypesoflow
,medium
andhigh
MW
CO
consideringa
300–1000kD
arange;
dand
ew
ere,respectively,theprototypes
oflowand
highM
WC
Oconsidering
a500–750
kDa
range;w
andh
arethe
cassetteflow
channelwidth
andheight,respectively;
rand
nare
thehollow
fiberinternalradius
andfibers
number,respectively.
22

2. MATERIALS AND METHODS 2.6. Membrane chromatography
2.6 Membrane chromatography
Membrane sheets and 96-well membrane holder were kindly provided by Dr. Louis Villain(Membrane R&D, Sartorius Stedim Biotech, Germany). The membrane adsorbers func-tionalized with a quaternary amine (Q) had three ligand densities and two di�erent surfacestructures, hydrogel-grafted and directly grafted (see Figure 2.1). The hydrogel-grafted mem-
(a) (b)
Figure 2.1: Schematic representation of the two membrane structures: (a) hydrogel-grafted membranewhere the Q ligand (red dots) is immobilized in the tentacle-like structure; and (b) directly graftedmembrane where the ligand is immobilized directly onto the membrane surface. Experimental designspace for the hydrogel-grafted membranes.
brane had ligand densities of 1.7, 2.4 and 3.3 µmol cm-2, while the directly grafted membranehad 0.5, 2.5 and 4.5 µmol cm-2. The small-scale device had a bed volume of 23 µL and500 µL of bu�er or virus (clarified, concentrated and diafiltered by UF) were used. The chro-matography consisted of three steps: equilibration; virus load, and elution. The equilibrationbu�er was 50 mM HEPES, pH 7.5 with di�erent NaCl concentrations (0, 50, 100, 150 and200 mM). The virus feed was diluted 1:2 with concetrated bu�er to match the conductivityof the equilibration bu�er. Elution was performed with 50 mM HEPES, pH 7.5, 1.0 M NaCl.After depositing the equilibration bu�er inside the wells a vacuum of 0.35 bar was appliedto displace the liquid across the membrane bed; the same procedure was applied for virusload and elution steps. The scale-down chromatography was performed in duplicate and thesamples were stored at -80¶C until further analysis.
2.7 Analytical methods
2.7.1 Total virus particles quantification
Total virus particles concentration and size distribution were measured using theNanoSIGHT NS500 (NanoSIGHT Ltd, UK). The samples were diluted in D-PBS (14190-169, Gibco®, UK) so that virus concentration would be in the 10+8–10+9 particles mL-1 – theinstrument’s linear range. For each sample three 60-second videos were acquired and particlesbetween 70 and 130 nm were considered.
2.7.2 Infectious virus particles titration
The infectious virus assay for both Ad5 and RV is based on GFP transgene expressionupon infection (transfection) and flow citometry analysis.
For Ad5 titration, 293 cells were seeded at 0.25◊10+6 cell per well in 24-well flat bottomplates (42475, Nunc, Denmark). After 24 h, the cells from three wells were trypsinized
23

2. MATERIALS AND METHODS 2.7. Analytical methods
and the cell concentration was determined. The cell culture medium was removed from theremaining wells and replaced with 1 mL of viral suspensions (10-1 - 10-6) diluted in freshmedium. After 17 to 20 h, the cells were collected in Dulbecco’s phosphate-bu�ered saline(D-PBS, 14190-169, Gibco®, UK) with 5 % FBS and immediately analyzed by flow cytometry(CyFlow®space, Partec GmbH, Germany) with GFP filters.
For RV titration, 293 T cells were seeded at 0.20◊10+6 cell per well in 24-well flat bottomplates (42475, Nunc, Denmark). After 24 h, the cells from three wells were trypsinized and thecell concentration was determined. The cell culture medium was removed from the remainingwells and replaced with 200 µL of viral suspensions diluted (1/3–1/81) in fresh mediumsupplemented with 8 µg mL-1 of polybrene (H9268, SIGMA-ALDRICH®, Switzerland). Thevirus-containing medium was removed 4 h after infection and replaced with 800 µL of freshmedium.
2.7.3 DNA quantification
Total DNA was quantified using the fluorescence-based Quant-iT™ PicoGreen® assay kit(P7589, Invitrogen™, UK) according to manufacture’s protocol. In order to avoid matrixinterference, the samples were diluted between 2–256-fold with the provided reaction bu�er.The assay took place in a white 96-well microplate (437842, Nunc, Denmark) and the fluo-rescence was measured on a Modulus™ Microplate Multimode Reader (Turner BioSystems,now Promega, USA).
2.7.4 Protein analysis
Total protein was quantified using the BCA Protein Assay Kit (23225, Thermo Fisher Sci-entific, USA) according with the manufacture’s protocol. Bovine serum albumin (BSA) wasused for the calibration curve. In order to avoid matrix interference, the samples were dilutedbetween 2- to 256-fold. The assay took place in a clear 96-well microplate (82.1581, Sarst-edt, Germany) and the absorbance was measured on a SpectraMax 340PC384 AbsorbanceMicroplate Reader (Molecular Devices, USA).
Host cell protein was performed using the HEK 293 HCP ELISA Kit (F650, CygnusTechnologies, USA) following the manufacture’s protocol. The standard curve was doneusing the 293 HCP standards provided. 1/1 000, 1/5 000 and 1/10 000 in order to allowinterpolation. As suggested by the manufacturer the corrected absorbance (Abs) was used(absorbance at 450 nm minus absorbance at 650 nm).
All analytical assays performed were done in triplicate.The protein profile was analyzed by sodium dodecyl sulphate polyacrylamide gel elec-
trophoresis (SDS-PAGE). Pre-casted gels NuPAGE® 4-12% Bis-Tris (NP0321PK2, Novex®,UK) were used. The samples were prepared by protein precipitation and ressuspension inloading mix (prepared accordingly to the manufacture’s instructions) . The samples were pre-cipitated by adding a known amount of protein to an eppendorf containing 1 mL of absoluteethanol (4146052, Carlo Erba Reagents, Italy). After the protein precipitation overnight at-20¶C the samples were centrifuged at 13 000 g for 15 min and the supernatant was removed.The pellet samples were further dried by incubation at 37¶C and then resuspended in the
24

2. MATERIALS AND METHODS 2.7. Analytical methods
loading mix. As molecular weight marker (MWM) 7 µL of SeaBlue Plus2 Pre-Stained Stan-dard (LC5925, Novex®, UK) were loaded. The electrophoresis was performed at constantvoltage of 200 V for 35 min. The gel was stained with InstaBLUE™ (ISB1LUK, Expedeon,UK) for 45 min under gently agitation and excess dye washed with ultrapure water. Digitalimage was acquired with the ChemiDoc™ XRS+ (BIO-RAD, USA).
25

2. MATERIALS AND METHODS 2.7. Analytical methods
26

Part III
Results and
Discussion


3Body Feed Filtration
The lysed bulk turbidity was determined to be 68±3 NTU (average±standard error ofthe mean (SEM)) while wet cell weight (WCW) was 8±1 g L-1. The results presented beloware corrected in order to take into account a concentration factor since it was noticed thatthe incubation volume – after adding the filter aid material – was reduced by 2–3-fold due tomaterial hydration (see Figure A1, in Appendix). The Figure A2 shows the wet filter aid with50 mL of virus bulk after settling for 48 h; up to 70 % of liquid height is filled by the filter aidmaterial. This volumetric concentration is further supported by the analytical assays’ resultswith virus recovery yields above 150 % and 2–3 times more DNA and HCP mass comparingwith the feed bulk (when 50 mL final volumes was considered). This concentration eventwas also confirmed with the total protein quantification assay (data not shown). The specificconcentration factor was defined considering the filter aid and liquid supernatant height.
3.1 Virus recovery
The incubation assays at pH 4.5 resulted in TP recoveries bellow 2 % for the Celpure C300,Celpure C1000 and Celite S filter aids. Moreover, the Celite S material also resulted in lessthan 2 % recovery at pH 7.0. The filter aid/pH conditions with less than 2 % TP recoverywere readily excluded while the remaining were further analyzed.
The Divergan RS filter aid shown the highest TP recoveries (Figure 3.1) among the ma-terials tested – approximately 40 % for the pH 7.0 condition. On the contrary, the Celite Sresulted in the worst performance regardless of incubation time or pH-value. Both Celpurefilter aids yielded TP recoveries ranging from 18 to 25 % at neutral pH. No di�erences werefound in product recovery with increasing incubation time, except for the Divergan RS at
29

3. BODY FEED FILTRATION 3.1. Virus recovery
30 min 60 min0
10
20
30
40
50
Divergan RS
Celpure C300
Celpure C1000
Divergan RS
pH 4.5
pH 7.0
Incubation Time
Tot
al V
irus
Rec
over
y (
%)
Figure 3.1: TP recovery (average±SEM) after incubation during 30/60 minutes for the di�erent filteraids and pH conditions.
pH 4.5. Despite a decrease in Ad5 recovery was observed in this condition, careful inter-pretation of this result is needed. As the pI of the Ad5 is approximately pH 4.5 [36] virusaggregation and precipitation must be considered at this pH.
The IP data (Figure 3.2) confirmed the Divergan RS as the filter aid enabeling the highestvirus recovery. The Divergan RS material at pH 7.0 resulted in 39 % IP recovery after 30-min
30 min 60 min0
10
20
30
40
50
Celpure C300
Celpure C1000
Divergan RS
Incubation Time
Infe
ctiv
e virus
reco
ver
y (
%)
Figure 3.2: IP recovery (average±SEM) after incubation during 30/60 minutes for the di�erent filteraids and pH 7.0.
incubation while the Celpure C300 and C1000 recovered less than 25 % of the infective virus.Contrarily to the TP data, there is a slight decrease in IP recovery with increasing incubationtime. Although Ad5 is considered a quite stable model virus [130,131], the mechanical stresscaused by mixing the filter aid micrometric particles for such a long period of time may be theexplanation for the results obtained. Especially, when considering the Ad structure wherethe protuberant fiber protein – essential for cell adhesion and infection – is exposed more
30

3. BODY FEED FILTRATION 3.2. Impurity removal
than 10 nm out of virus capsid [32].
3.2 Impurity removal
Concerning the DNA clearance (Figure 3.3), the incubation at neutral pH yielded lowerDNA clearance – between 15 and 54 % – comparing with the incubation at pH 4.5, whichenabled considerably higher DNA removal, close to 100 %. The enhanced DNA clearanceat pH 4.5 might be due to low pH-induced precipitation and aggregation with the virusparticles [72]. Celpure C300 showed the best DNA removal capacity at pH 7.0. Although
30 min 60 min0
50
100
Divergan RS
Celpure C300
Celpure C1000
Divergan RS
pH 4.5
pH 7.0
Incubation Time
DN
A c
lear
ance
(%
)
Figure 3.3: DNA clearance (average±SEM) after incubation during 30/60 minutes for the di�erentfilter aids and pH conditions.
this DE is a negatively charged material [132], other types of interactions – like entrapment,flocculation or hydrophobic interaction – might be responsible for the high DNA clearance.A similar phenomenon was observed recently in cation exchange (CEX) chromatography [133].The publication reports the binding of DNA present in a post-Protein A mAb pool underlow conductivity (5 mS cm-1) and its elution upon a conductivity increase to 70 mS cm-1.The Celpure C1000 is also negtively charged, however resulted in lower DNA clearance whichcan be explained by the by the smaller specific area, up to 75 % less of the specific area ofCelpure C300 material [132]. Contrarily, the Divergan RS filter aid is not charged, even so itled to DNA removal rates close to those of Celpure C300. The Divergan RS has a specific areaof ~55 m2 g-1 (estimated based on filter aid density and an average diameter of 90 µm [134]),which is one order of magnitude higher as compared with the Celpure C300. Besides thedi�erent – non-electrostatic – interaction mechanism, the high specific area of Divergan RSmight contribute also for the high DNA clearance.
Considering the HCP clearance (Figure 3.4), the results ranged from 50 to 80 %. SinceHCP is a complex array of proteins with di�erent molecular size, charge, pI and stability, theincubation at acidic pH did not provide substantial HCP clearance, contrary to what wasobserved for DNA. Perhaps this is also why no remarkable di�erence was observed betweenboth Celpure’s DE and the synthetic Divergan RS. Additionally, incubation for a long periodof time did not increase neither HCP nor DNA removal.
31

3. BODY FEED FILTRATION 3.3. Discussion
30 min 60 min0
50
100
Divergan RS
Celpure C300
Celpure C1000
Divergan RS
pH 4.5
pH 7.0
Incubation Time
HC
P c
lear
ance
(%
)
Figure 3.4: HCP clearance (average±SEM) after incubation during 30/60 minutes for the di�erentfilter aids and pH conditions.
3.3 Discussion
The Celite S material was readily excluded as no virus particles were recovered regardlessof incubation time or pH-value. On the contrary, the two other DE-based filter aids enabledvirus recoveries between 18 and 25 % when used at pH 7.0. The major di�erence between theCelite S and the Celpure materials lies in the SiO2 purity and metallic oxides content [132].The Celite S material is a material less pure with a greater metal content when comparedwith the Celpure DE. The DE purity seems to limit virus recovery and should be consideredwhen developing purification strategies such as the BFF.
Low virus recoveries were observed when the incubation was performed at pH 4.5, asexpected since the virus has a acidic pI. However, the results obtained show that the non-charged material might be employed at acidic pH. This could be an advantage if a vaccinationapplication (which does not require infective virus) is envisioned, nevertheless pH and con-ductivity should be further optimized for TP recovery and impurity removal.
The synthetic material Divergan RS resulted in the highest TP and IP recoveries whilemaintaining HCP and DNA removal capacities comparable with the charged Celpure C300.Even so the Divergan RS allowed for less than 50 % of product recovery. The low yields canbe explained by the small-scale set-up and protocol used. The experiment was focused onfilter aid screening therefore the Ad5 bulk was overloaded with DE to a final concentrationof 200 g L-1 – approximately 10-fold higher than those to be used in a scalable filtrationtrial. While overloading is suitable for a initial material selection, it might lead to lower virusrecovery.
32
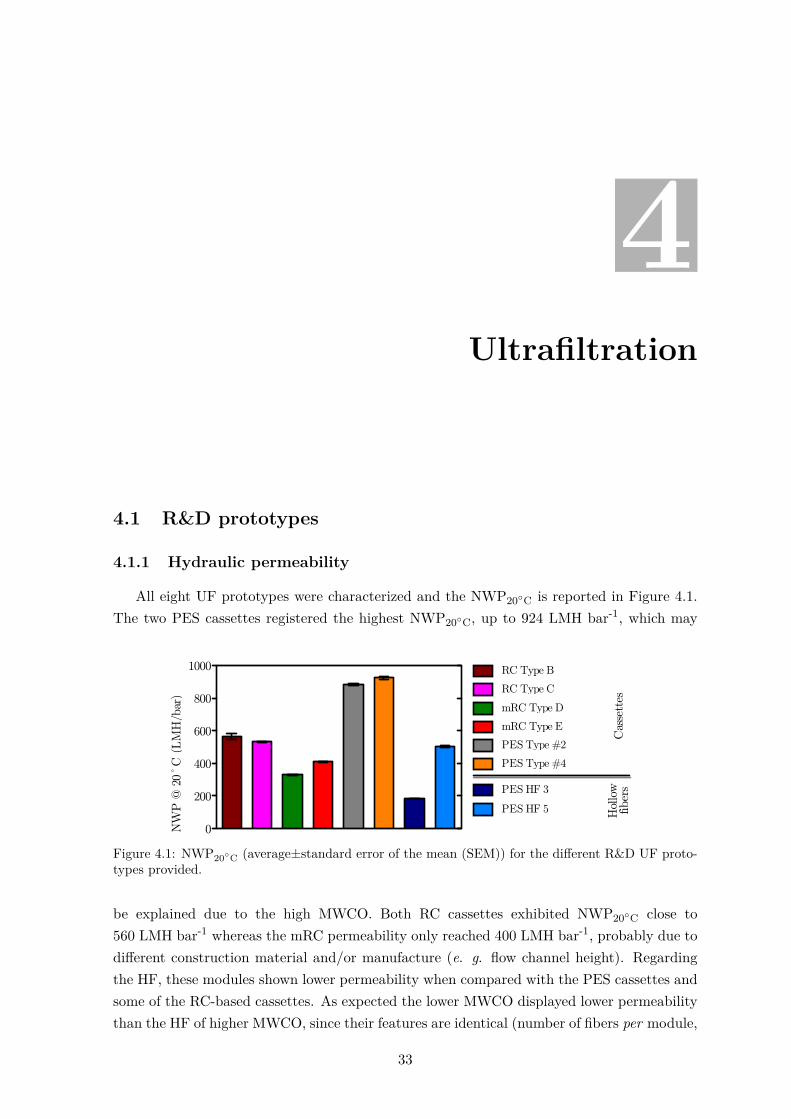
4Ultrafiltration
4.1 R&D prototypes
4.1.1 Hydraulic permeability
All eight UF prototypes were characterized and the NWP20¶C is reported in Figure 4.1.The two PES cassettes registered the highest NWP20¶C, up to 924 LMH bar-1, which may
0
200
400
600
800
1000 RC Type B
RC Type C
mRC Type D
mRC Type E
PES Type #2
PES Type #4
PES HF 3
PES HF 5
Cas
sett
esH
ollo
w
fiber
s
NW
P @
20˚
C (
LM
H/b
ar)
Figure 4.1: NWP20¶C (average±standard error of the mean (SEM)) for the di�erent R&D UF proto-types provided.
be explained due to the high MWCO. Both RC cassettes exhibited NWP20¶C close to560 LMH bar-1 whereas the mRC permeability only reached 400 LMH bar-1, probably due todi�erent construction material and/or manufacture (e. g. flow channel height). Regardingthe HF, these modules shown lower permeability when compared with the PES cassettes andsome of the RC-based cassettes. As expected the lower MWCO displayed lower permeabilitythan the HF of higher MWCO, since their features are identical (number of fibers per module,
33
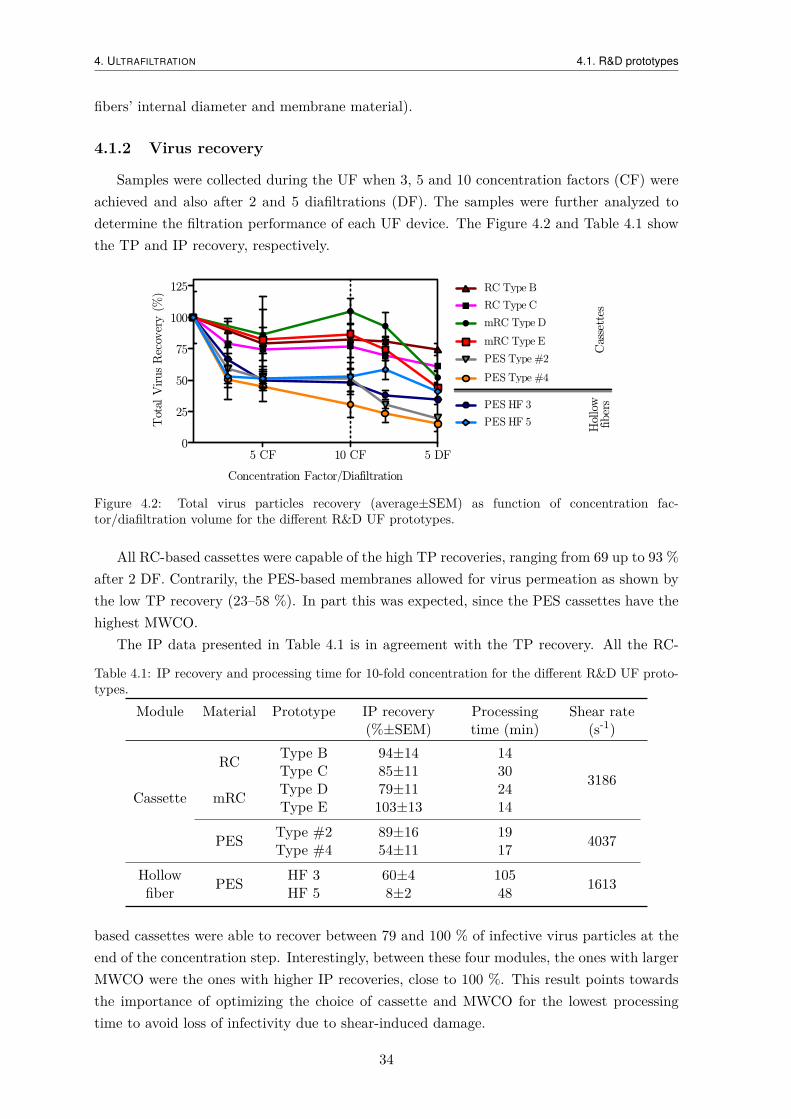
4. ULTRAFILTRATION 4.1. R&D prototypes
fibers’ internal diameter and membrane material).
4.1.2 Virus recovery
Samples were collected during the UF when 3, 5 and 10 concentration factors (CF) wereachieved and also after 2 and 5 diafiltrations (DF). The samples were further analyzed todetermine the filtration performance of each UF device. The Figure 4.2 and Table 4.1 showthe TP and IP recovery, respectively.
5 CF 10 CF 5 DF0
25
50
75
100
125
mRC Type E
PES Type #2
PES Type #4
PES HF 3
mRC Type D
RC Type B
RC Type C
PES HF 5
Cas
sett
esH
ollo
w
fiber
s
Concentration Factor/Diafiltration
Tot
al V
irus
Rec
over
y (
%)
Figure 4.2: Total virus particles recovery (average±SEM) as function of concentration fac-tor/diafiltration volume for the di�erent R&D UF prototypes.
All RC-based cassettes were capable of the high TP recoveries, ranging from 69 up to 93 %after 2 DF. Contrarily, the PES-based membranes allowed for virus permeation as shown bythe low TP recovery (23–58 %). In part this was expected, since the PES cassettes have thehighest MWCO.
The IP data presented in Table 4.1 is in agreement with the TP recovery. All the RC-
Table 4.1: IP recovery and processing time for 10-fold concentration for the di�erent R&D UF proto-types.
Module Material Prototype IP recovery(%±SEM)
Processingtime (min)
Shear rate(s-1)
Cassette
RC Type B 94±14 14
3186Type C 85±11 30
mRC Type D 79±11 24Type E 103±13 14
PES Type #2 89±16 19 4037Type #4 54±11 17Hollow PES HF 3 60±4 105 1613fiber HF 5 8±2 48
based cassettes were able to recover between 79 and 100 % of infective virus particles at theend of the concentration step. Interestingly, between these four modules, the ones with largerMWCO were the ones with higher IP recoveries, close to 100 %. This result points towardsthe importance of optimizing the choice of cassette and MWCO for the lowest processingtime to avoid loss of infectivity due to shear-induced damage.
34

4. ULTRAFILTRATION 4.1. R&D prototypes
Following the same trend observed in TP recovery, the Type #2 cassette allowed for ahigher IP recovery as compared with the PES #4 module. These PES cassettes have thesame membrane material and the same MWCO; however, slight di�erences, such as a broader(or narrower) pore size distribution, could impact the prototype’s virus recovery [84].
The HF prototypes had low recovery of IP. This can be explained by the longer processingtimes. For instance, the HF 3 module took seven times longer than the Type B or Type Eprototypes to perform the same 10-fold concentration. Even so, the HF 3 showed a moderateIP recovery (60±4 %).
4.1.3 Impurity removal
4.1.3.1 Protein clearance
The HCP analysis presented in Figure 4.3 shows that both PES cassettes were ableto remove 86–91 % of the HCP present, as expected due to high MWCO. The remaining
0
25
50
75
100RC Type B
RC Type C
mRC Type D
mRC Type E
PES Type #2
PES Type #4
PES HF 3
PES HF 5
Cas
sett
esH
ollo
w
fiber
sHC
P C
lear
ance
(%
)
Figure 4.3: HCP clearance (average±SEM) after 2 diafiltrations for the di�erent R&D UF prototypes.
prototypes were able to remove between 70 and 80 % of HCP, in agreement with the literatureof UF step [72,95].
All four RC-based UF membranes show a marked enrichment in Ad5 protein bands ascompared with the feed in the SDS-PAGE (Figure 4.4), in agreement with the high TP and IPrecovery yields. This is specially visible with the virus’ major capsid protein (hexon, 109 kDa)and resulted from the successful volumetric concentration and virus retention. Also, the PEShollow fibers led enrichment in hexon protein, however not as much as the RC-based modules.Furthermore, as demonstrated by TP recovery, the PES cassettes tend to retain less virusdue to their high MWCO.
35

4. ULTRAFILTRATION 4.1. R&D prototypes
hexon
kDa
MW
M
Feed
Type B
Type C
Type D
Type E
750 kD
a #2
750 kD
a #4
HF
300 kD
a
HF
500 kD
a
Ad5
CsC
l-pur
ified
188
98
62
49
28
38
6
3
14
Figure 4.4: Total protein profile analyzed by SDS-PAGE after 2 DF in comparison with the feed anda CsCl ultracentrifugation-purified Ad5 standard. Each well was loaded with 15 µg of total protein.
4.1.3.2 DNA clearance
Both PES-based cassettes enabled higher DNA clearance – 85% – than the remainingprototypes (Figure 4.5). The Type B, Type C, Type D, Type E and HF 5 prototypes shown
5 CF 10 CF 5 DF0
25
50
75
100
mRC Type E
PES Type #2
PES Type #4
PES HF 3
mRC Type D
RC Type B
PES HF 5
RC Type C
Cas
sett
esH
ollo
w
fiber
s
Concentration Factor/Diafiltration
DN
A c
lear
ance
(%
)
Figure 4.5: DNA clearance (average±SEM) as function of concentration factor/diafiltration volumefor the di�erent R&D UF prototypes.
intermediate DNA clearances (67–70%) and the HF 3 shown the worst DNA clearance (61 %).Both the HCP and DNA clearance data are in agreement and point out both PES cassettesas the best modules regarding impurity removal. However, considering also TP and IP data,these modules were not as e�cient as the RC-based membranes.
4.1.4 Productivity analysis
The permeate flux over time and throughput (feed processed per membrane area andtime, L m-2 h-1) were also evaluated for all UF prototypes studied (Figure 4.6).
The Figure 4.6(a) shows that all membranes except Type D were able to maintain anessentially stable flux, due to the TMP-constant operation. On the other hand the Type D
36

4. ULTRAFILTRATION 4.1. R&D prototypes
200 400 6000
50
100
150
mRC Type D
mRC Type E
PES Type #2
PES Type #4
PES HF 5
PES HF 3
RC Type B
RC Type C
Cas
sett
esH
ollo
w
fiber
s
(a)
Permeate volume (mL)
Flu
x (
LM
H)
0
20
40
60
80 RC Type B
RC Type C
mRC Type D
mRC Type E
PES Type #2
PES Type #4
PES HF 3
PES HF 5
Cas
sett
esH
ollo
w
fiber
s
(b)
Thro
ugh
put
(L m
-2 h
-1)
Figure 4.6: (a) Permeate flux throughout filtration and (b) throughput capacity for each R&D UFprototype assayed (considering a 10-fold concentration and 2 DF).
shown a marked flux decrease between 300 to 405 mL of permeate volume (between 3 to10 CF). However, complete fouling was not observed. It is also important to point out thatthe two UF modules which displayed superior throughput (Figure 4.6(b)) – RC Type B andmRC Type E – were also the ones showing highest virus recoveries. This combination makesthem modules of high productivity (product recovered per membrane area and time).
4.1.5 Flux Recovery
The after-use flux recovery enables assessment of the degree of irreversible/strongly as-sociated foulants accumulated on the membrane during filtration. On the other hand, theafter-CIP flux recovery permits to evaluate the loss of permeability after a complete cy-cle. This metric is an industrial relevant indicator as it serves as benchmark of membraneperformance, is used to assess performance decay and also cleaning-in-place (CIP) protocole�ectiveness. The flux recoveries (flux over initial flux, J/J0 (–)) are presented in Figure 4.7.
Three membranes (Type B, Type D and Type E) have shown a reduced fouling comparedto the others. These results can be related, in part, with di�erent hydrophilic propertiesof the membranes’ material. In contrast, RC Type C was not able to recover to its initialflux to the same extent as the Type B, possibly due to the lower MWCO. All PES-basedprototypes had low after-use flux recovery. Considering the wide range of MWCO of these
37

4. ULTRAFILTRATION 4.2. Commercial/pilot production devices
After use After CIP0.00
0.25
0.50
0.75
1.00RC Type B
RC Type C
mRC Type D
mRC Type E
PES Type #2
PES Type #4
PES HF 3
PES HF 5
Cas
sett
esH
ollo
w
fiber
s
J/J
0 (—
)
Figure 4.7: Flux recovery (average±SEM) after-use and after-CIP for the di�erent R&D UF prototypes
prototypes, the results suggest that PES UF membranes might be more prone to adsorbingbiomolecules [74,90].
Regarding the after-CIP flux recovery, it was clear that the PES cassettes, the Type Band both mRC cassettes regained their permeability (with flux losses ranging between 7 and11%). Meaning that these UF modules withstood a complete cycle and might be used as arepeated-use device; although the number of cycles allowed was not assessed. The remainingmodules (RC Type C and both PES hollow fibers) shown loss of water permeability after onecycle, and might not be suited for repeated-use device.
4.2 Commercial/pilot production devices
The results obtained with R&D UF prototypes were used to adjust the membrane features.A new set of improved UF membranes produced by a fully scalable manufacturing line wasevaluated for Ad5 and RV ultrafiltration.
4.2.1 Hydraulic permeability
The mRC Type H cassette displayed the highest NWP20¶C – 889 LMH bar-1, Figure 4.8 –possibly due to the high MWCO. As expected the Type F cassette shown lower NWP20¶C
0
200
400
600
800
1000
Type F
Type H
HF 7
NW
P @
20˚
C (
LM
H/b
ar)
Figure 4.8: NWP20¶C (average±SEM) for the di�erent UF devices studied.
– 739 LMH bar-1. The NWP20¶C for the HF 7 was determined to be 630 LMH/bar. The
38
4. ULTRAFILTRATION 4.2. Commercial/pilot production devices
lower permeability of the HF 7 comparing with the same cut-o� cassette might be explainedby di�erences in membrane material and/or module design.
4.2.2 Virus recovery
Samples were collected during the UF when 3, 5 and 10 concentration factors (CF) wereachieved and also after 2 and 5 diafiltrations (DF). The samples were further analyzed todetermine the filtration performance of each UF device.
The Ad5 experiments resulted in TP recoveries ranging from 50 % (Type H) up to 75 %(Type F) after 10-fold concentration (Figure 4.9); however two diafiltration (DF) volumesdecreased the recovery yield to 40 % for all membranes assayed.
5 CF 10 CF 5 DF0
25
50
75
100
125
Type F
Type H
HF 7
Ad5
RV
Type F
Type H
HF 7
HF 7 w/o HSA
Concentration Factor/Diafiltration
Tot
al V
irus
Rec
over
y (
%)
Figure 4.9: Total virus particles recovery (average±SEM) as function of concentration fac-tor/diafiltration volume for the di�erent UF devices.
The RV experiments yielded lower recoveries for all UF devices; Type F (lower MWCO)membrane had the higher TP recovery of 48 %. The remaining membranes were only able torecover between 8 and 14 % of RV particles. It has been suggested that coating membranefilters with HSA leads to lower RV loses [83,93], however in this case the HSA coating did notincrease RV recovery when the PS HF was tested.
The IP data (Table 4.2) shows the same trends observed in TP recovery for both Ad5
39

4. ULTRAFILTRATION 4.2. Commercial/pilot production devices
and RV.
Table 4.2: IP recovery and processing time for 10-fold concentration for the di�erent UF devices.
Virus Module Material DeviceIP recovery(%±SEM)
Processingtime (min)
Shear rate(s-1)
Ad5Cassette mRC
Type F 124.9±12 17.53186
Type H 93.6±16 17.2Hollow Fiber PS HF 7 111.7±13 26.4 1619
RVCassette mRC
Type F 8.9±1 4.43186
Type H 13.5±3 3.8
Hollow Fiber PSHF 7 15.3±3 3.3
1619HF 7 † 15.9±1 3.8
†The UF membrane was not coated with HSA (see Section 2.5, page 20).
The Type F and HF 7 membranes were able to fully recover the infective Ad5 while Type Hmembrane achieved 94 % recovery. As observed for TP recovery, Type H resulted in thelowest recovery, possibly due to its high MWCO. Despite being rated with the same MWCOas the Type H cassette, the HF 7 was able to recover more infective Ad5, which could beexplained by the lower shear rates associated with its operation.
As observed previously, the low RV recoveries were also confirmed by the low IP recoveries,between 9 and 16 %. The only exception was the Type F membrane whose discrepancybetween TP and IP data suggests that virus functionality was lost, possibly due to shear-induced damage.
4.2.3 Impurity removal
4.2.3.1 Protein clearance
The mRC Type F and Type H cassettes removed 67 and 68 % of HCP, respectively, whilethe PS-based HF 7 was able to achieve 86 % HCP clearance (Figure 4.10). The higher HCP
0
25
50
75
100 Type F
Type H
HF 7
Type F
Type H
HF 7
RV
Ad5
HC
P c
lear
ance
(%
)
Figure 4.10: HCP clearance (average±SEM) after 2 diafiltrations for the di�erent UF devices.
protein clearance registered for the HF might be due to the di�erent filter material, whichis more hydrophobic than RC, and thus more prone to adsorption. The protein clearance
40

4. ULTRAFILTRATION 4.2. Commercial/pilot production devices
obtained is in agreement with the available data for the UF step [72,95].For the RV runs the HCP clearance was higher compared with those obtained for Ad5;
in this case 83, 94 and 99 % HCP was obtained for Type F, Type H and HF 7, respectively.These values are slightly higher comparing with has been reported for RV UF [83,135], withprotein clearance rates in the 70–80 % range. The higher protein clearances for the RV runswere expected since no cell lysis step was performed and thus the RV feed contains essentiallysmall proteins present at low concentrations in cell culture supernatant.
The protein profile (Figure 4.11) regarding the Ad5 experiments shows a clear enrichmentin Ad5 proteins’ compared with the feed, which is in agreement with the high virus recoveriesregistered. The volumetric concentration is particularly evident on the adenovirus’ majorcapsid protein band (Hexon, 109 kDa). With the RV UF it is also possible to observe
188
Env
kDa
98
62
49
38
28
14
6
3
MW
M
Feed
Type F
Type H
GE
HF
GE
HF
Ad5
CsC
s-pu
rified
Type H
Type F
Feed
MW
M
Ad5 RV
Hexon
Figure 4.11: Total protein profile analyzed by SDS-PAGE after 2 diafiltration volumes in comparisonwith the feed. The left gel concerns the Ad5 runs and a CsCl ultracentrifugation-purified Ad5 standard,whereas the right gel corresponds to the RV experiments. Each well was loaded with 15 µg of totalprotein.
the concentration and retention of retroviral particles, particularly on the virus’ envelopglycoprotein (Env, 70 kDa) which is enriched comparing with the feed. The slight enrichmentis in accordance with the low recoveries obtained; however it is not possible to distinguishbetween the di�erent membranes.
4.2.3.2 DNA clearance
The DNA analysis performed (Figure 4.12) reveled that lower DNA removal was achievedin Ad5 runs compared with RV experiments. One of the challenges of Adenovirus purificationis host cell DNA removal since the bioprocess comprises a cell lysis step [136] but also becauseit has been shown that DNA can associate with the virus particle resulting in co-purificationof both species [72]. For the Type F and Type H cassettes the DNA clearance after two DF
41

4. ULTRAFILTRATION 4.2. Commercial/pilot production devices
5 CF 10 CF 5 DF0
25
50
75
100 Type F
Type H
HF 7
Type F
Type H
HF 7
Ad5
RV
Concentration Factor/Diafiltration
DN
A c
lear
ance
(%
)
Figure 4.12: DNA clearance (average±SEM) as function of concentration factor/diafiltration volumefor the di�erent UF devices.
was 64 and 60 %, respectively, while the HF 7 was able to remove 82 % of DNA present in theAd5 feed. In the range of MWCO assayed, there was no observed di�erence between mediumand high MWCO cassettes, therefore the higher HCP and DNA clearance observed withPS-based HF 7 membrane might be due to adsorption. Considering the RV experiments, theType H and HF 7 removed 95 and 98 % of the DNA present, respectively, while the Type Fmembrane enabled slightly lower DNA clearance (86 %).
4.2.4 Productivity analysis
As with the previous set of membranes, the permeate flux over time and throughput (feedprocessed per membrane area and time) were evaluated for all UF devices (Figure 4.13). TheFigure 4.13(a) shows that all membranes were able to maintain an essentially stable fluxduring the TMP-constant operation, and no device shows signs of fouling. It is also importantto point out that the higher permeate fluxes achieved for RV are consequence of the clearerstarting material, as stated earlier.
When the UF devices were challenged with the Ad5 clarified bulk it is evident the higherthroughput of the mRC-based membranes compared with the PS-based HF 7 (Figure 4.13(b)).Particularly, the Type F membrane – which combines high throughput capacity with the high-est TP and IP recoveries – is a high productivity module (product recovered per membranearea and time). However, when the clearer RV-containing supernatant was used the advan-tages of module design and filter material are no longer evident. In this case throughputcapacity displayed a similar trend, related to the hydraulic permeability (Figure 4.8).
4.2.5 Flux Recovery
The after-use flux recovery enables assessment of the degree of irreversibly/strongly asso-ciated foulants accumulated on the membrane during filtration. The after-CIP flux recoverypermits to evaluate the loss (or gain) of hydraulic permeability after a complete cycle. The
42
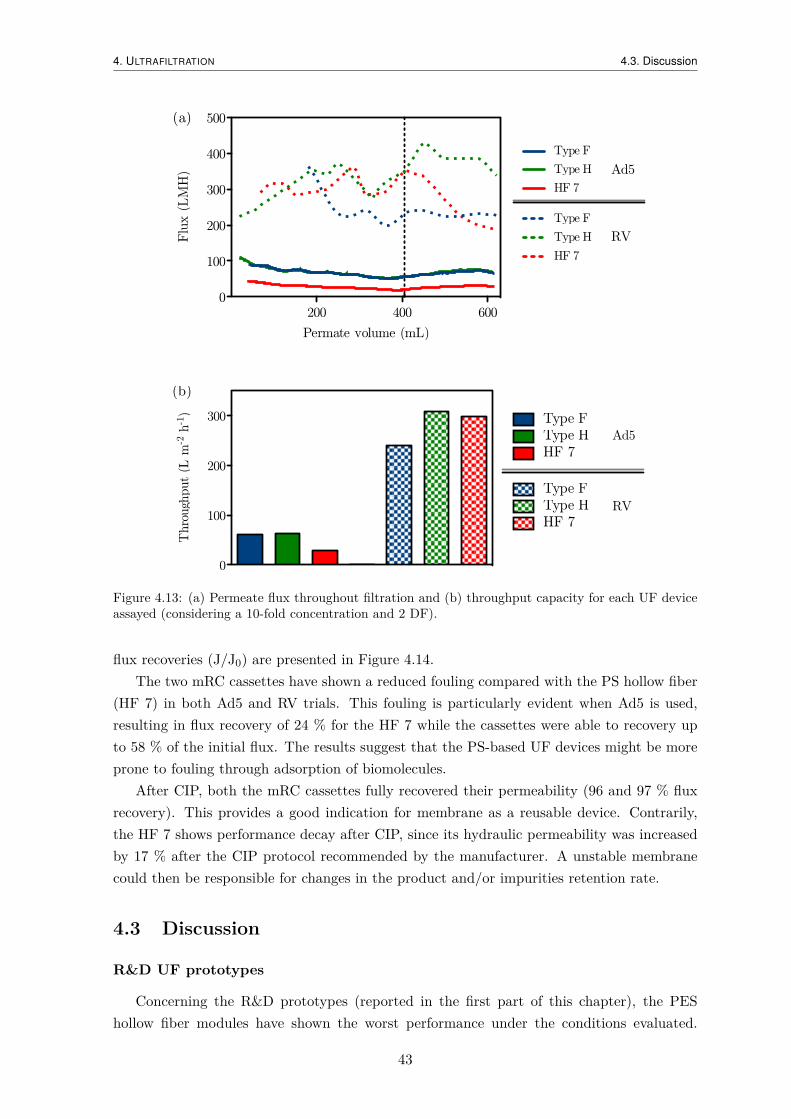
4. ULTRAFILTRATION 4.3. Discussion
200 400 6000
100
200
300
400
500
HF 7
Type H
Type F
HF 7
Type H
Type F
Ad5
RV
(a)
Permate volume (mL)
Flu
x (
LM
H)
0
100
200
300 Type FType HHF 7
Type FType HHF 7
RV
Ad5
(b)
Thro
ugh
put
(L m
-2 h
-1)
Figure 4.13: (a) Permeate flux throughout filtration and (b) throughput capacity for each UF deviceassayed (considering a 10-fold concentration and 2 DF).
flux recoveries (J/J0) are presented in Figure 4.14.The two mRC cassettes have shown a reduced fouling compared with the PS hollow fiber
(HF 7) in both Ad5 and RV trials. This fouling is particularly evident when Ad5 is used,resulting in flux recovery of 24 % for the HF 7 while the cassettes were able to recovery upto 58 % of the initial flux. The results suggest that the PS-based UF devices might be moreprone to fouling through adsorption of biomolecules.
After CIP, both the mRC cassettes fully recovered their permeability (96 and 97 % fluxrecovery). This provides a good indication for membrane as a reusable device. Contrarily,the HF 7 shows performance decay after CIP, since its hydraulic permeability was increasedby 17 % after the CIP protocol recommended by the manufacturer. A unstable membranecould then be responsible for changes in the product and/or impurities retention rate.
4.3 Discussion
R&D UF prototypes
Concerning the R&D prototypes (reported in the first part of this chapter), the PEShollow fiber modules have shown the worst performance under the conditions evaluated.
43
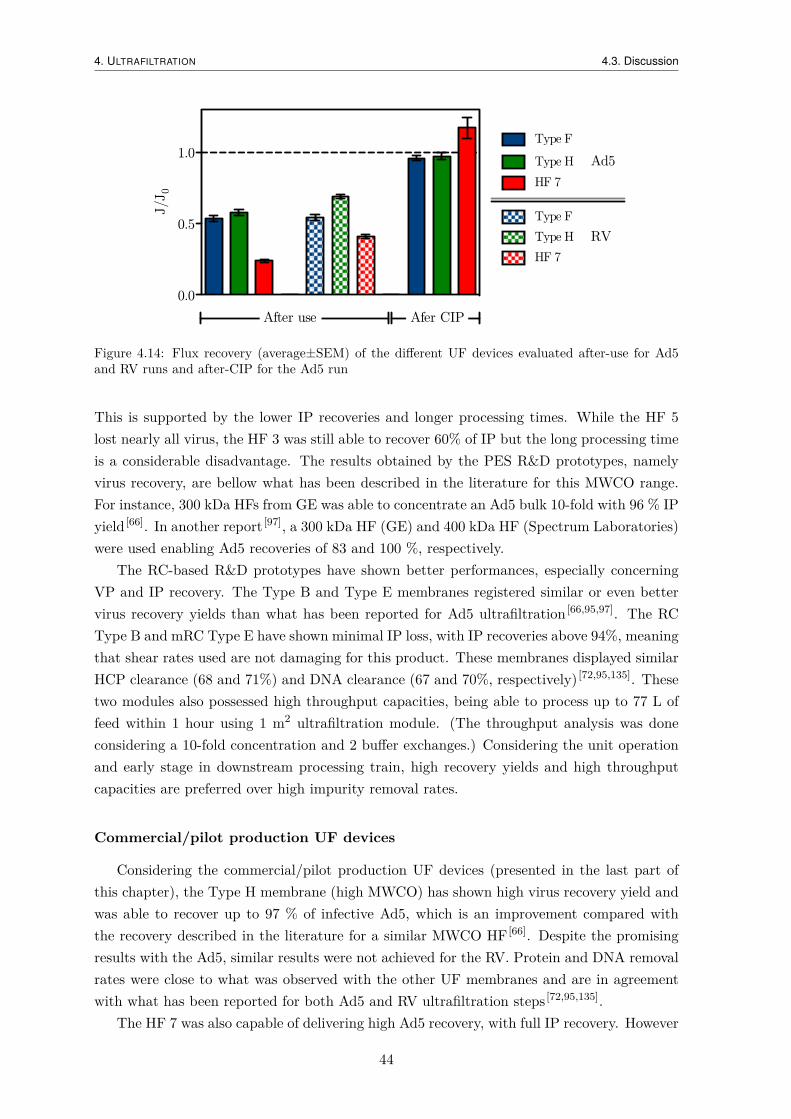
4. ULTRAFILTRATION 4.3. Discussion
0.0
0.5
1.0
HF 7
Type F
Type H
After use Afer CIP
Type F
Type H
HF 7
RV
Ad5J/J
0
Figure 4.14: Flux recovery (average±SEM) of the di�erent UF devices evaluated after-use for Ad5and RV runs and after-CIP for the Ad5 run
This is supported by the lower IP recoveries and longer processing times. While the HF 5lost nearly all virus, the HF 3 was still able to recover 60% of IP but the long processing timeis a considerable disadvantage. The results obtained by the PES R&D prototypes, namelyvirus recovery, are bellow what has been described in the literature for this MWCO range.For instance, 300 kDa HFs from GE was able to concentrate an Ad5 bulk 10-fold with 96 % IPyield [66]. In another report [97], a 300 kDa HF (GE) and 400 kDa HF (Spectrum Laboratories)were used enabling Ad5 recoveries of 83 and 100 %, respectively.
The RC-based R&D prototypes have shown better performances, especially concerningVP and IP recovery. The Type B and Type E membranes registered similar or even bettervirus recovery yields than what has been reported for Ad5 ultrafiltration [66,95,97]. The RCType B and mRC Type E have shown minimal IP loss, with IP recoveries above 94%, meaningthat shear rates used are not damaging for this product. These membranes displayed similarHCP clearance (68 and 71%) and DNA clearance (67 and 70%, respectively) [72,95,135]. Thesetwo modules also possessed high throughput capacities, being able to process up to 77 L offeed within 1 hour using 1 m2 ultrafiltration module. (The throughput analysis was doneconsidering a 10-fold concentration and 2 bu�er exchanges.) Considering the unit operationand early stage in downstream processing train, high recovery yields and high throughputcapacities are preferred over high impurity removal rates.
Commercial/pilot production UF devices
Considering the commercial/pilot production UF devices (presented in the last part ofthis chapter), the Type H membrane (high MWCO) has shown high virus recovery yield andwas able to recover up to 97 % of infective Ad5, which is an improvement compared withthe recovery described in the literature for a similar MWCO HF [66]. Despite the promisingresults with the Ad5, similar results were not achieved for the RV. Protein and DNA removalrates were close to what was observed with the other UF membranes and are in agreementwith what has been reported for both Ad5 and RV ultrafiltration steps [72,95,135].
The HF 7 was also capable of delivering high Ad5 recovery, with full IP recovery. However
44

4. ULTRAFILTRATION 4.3. Discussion
as observed for the Type H cassette, the HF with the same MWCO was not capable of RVconcentration, resulting in low yields. Considering impurity removals, the PS HF seems toenable slightly increased DNA and HCP clearance comparing with mRC cassettes; this wasmore evident with the Ad5 bulk. This increased impurity removal might be due to adsorptionphenomenon rather than a size exclusion mechanism as the filter material’s proprieties aremore hydrophobic [74,90].
The Type F cassette presented the best results among the assayed membranes. This issupported by the complete recovery of infective Ad5, an improvement comparing with whatis described in the literature for 500 kDa HF [66]. Additionally, this was the only device ableto partially retain and concentrate RV. Although the Type F module was able to concentrateRV, the low IP yield suggests that shear-induced damage might be compromising infectiveRV recovery. The results indicated that lower MWCO did not decrease impurity removalwhen comparing between the two mRC cassettes.
Another important feature of the Type F (and H) cassette(s) is their higher throughputcomparing with the HF 7. For instance, Type F module is capable of processing up to 61 Lof Ad5 clarified bulk within 1 h using a 1 m2-membrane while the GE HF can process only29 L with the same time and membrane area (considering a 10-fold concentration and 2 DF).Although the Type F throughput is 20 % lower compared with those obtained for the bestR&D prototype previously evaluated, careful comparison of such values is required since theprevious membranes’ MWCO might be slightly di�erent and the manufacturing process wasdi�erent.
Retrovirus purification is extremely challenging due to the labile nature of the virusparticle and low titers achievable. The results achieved for Type F membrane – concentrationof TP without the corresponding increase in IP titer – suggest that there is loss of virusfunctionality possibly due to shear-induced damage. One possible improvement would beto decrease the shear rate by lowering the feed flow rate (and consequently the TMP inorder to maintain a tangential flow at the membrane’s surface). The literature is scarce onpurification of RV by UF [83,93,135,137], however careful examination allows to identify two otherexplanation the low RV observed. First, MWCO in the 100–500 kDa range are preferred forRV concentration, as observed in this study and supported by the literature [83,135]. Second,the use of high membrane loads (feed volume per membrane area) might also be advantageousgiven the low titers characteristic of RV. The same manuscripts [83,135] report membrane loadsranging from 73 up to 133 L m-2 while in our trials membrane loading was limited to 22.5and 20 L m-2 for the cassettes and HF, respectively. These three factors – shear rate, MWCOand membrane load – might explain, at least partially, the low RV recoveries achieved.
The work performed characterized in-depth several ultrafiltration membranes. The resultsherein presented identify UF membrane modules alternative to the currently available HFdevices for virus purification. Type F (close to 500 kDa) is suggested for Ad5 concentration.This module shows complete IP recovery and impurity removal similar to those described inthe literature. The key advantage of this UF module lies in the substantially shorter pro-cessing times comparing with the other membranes evaluated and described in the literature.Considering the RV, several improvement strategies were suggested based on successful RV
45

4. ULTRAFILTRATION 4.3. Discussion
UF reports available in the literature.
46

5Membrane chromatography
adapted from:Nestola, P., Villain, L., Peixoto, C., Martins, D.L., Alves, P.M.,Carrondo, M.J.T., Mota, J.P.. Impact of grafting on the design of newmembrane adsorbers for virus purification. Biotechnol Bioeng, submitted.
The membrane adsorbers functionalized with a quaternary amine (Q) had three liganddensities and two di�erent surface structures (hydrogel-grafted and directly grafted). A96-well chromatographic system was used to evaluate the impact of these features on themembrane performance.
5.1 Hydrogel-grafted membranes
5.1.1 Virus recovery
Analysis of the flow-through detected less than 5 % of the loaded virus which is in agree-ment with other reports where adenovirus are generally purified in bind/elute mode usingQ-AEX chromatography with hydrogel-grafted membranes [67,80].
Considering the virus recovery after elution with 1 M NaCl, the data displayed in Fig-ure 5.1 show that low conductivity during loading results in recovery yields below 50 %regardless of the ligand density. The high ligand density adsorber (3.3 µmol cm-2) resulted inthe lowest virus recoveries, as observed previously with Baculovirus [119]. The use of mediumligand density membrane (2.4 µmol cm-2) resulted in the highest recovery yields rangingfrom 50 % to 80 %. These recovery yields are in agrrement with what was published forchromatographic purification of Ad5 using Sartobind Q [66].
47

5. MEMBRANE CHROMATOGRAPHY 5.1. Hydrogel-grafted membranes
0 50 100 150 2000
25
50
75
100
1.7 µmol cm-2
3.3 µmol cm-2
2.4 µmol cm-2
NaCl concentration of the load (mM)
Tot
al V
irus
Rec
over
y (
%)
Figure 5.1: TP recovery after elution with 1 M NaCl for the hydrogel-grafted membrane with low,medium and high ligand density.
Ligand density has also been studied for mAb chromatography, were increased liganddensity did not led to improvements in binding capacity and recovery [138]. Therefore, ithas been suggested that there is threshold level above which ligand density does not improvematrix capacity [119,138]. However, the results herein presented show that increasing the liganddensity above a certain threshold level not only did not increase virus recovery but also hada negative impact on virus recovery. This might be explained due to multi-point adsorption– leading to a stronger association between the virus and the membrane – or due to virusentrapment since, hydrogel layer thickness was increased in the highest ligand densities.
5.1.2 Impurity removal
5.1.2.1 Protein clearance
The total protein clearance obtained in the elution showed slight increase with increasedionic strength. As expected, by increasing NaCl concentration of the load was possible toincrease protein clearance for mediun and high ligand densities (Figure 5.2). Also, the proteinclearance increased concomitantly with increases in ligand density. The low protein clearanceobserved in the low ligand density (1.7 µmol cm-2) might be due to co-elution of proteinswith the virus during the elution with 1 M NaCl. This problem can be addressed by theimplementation of a gradient elution to improve resolution [119].
48
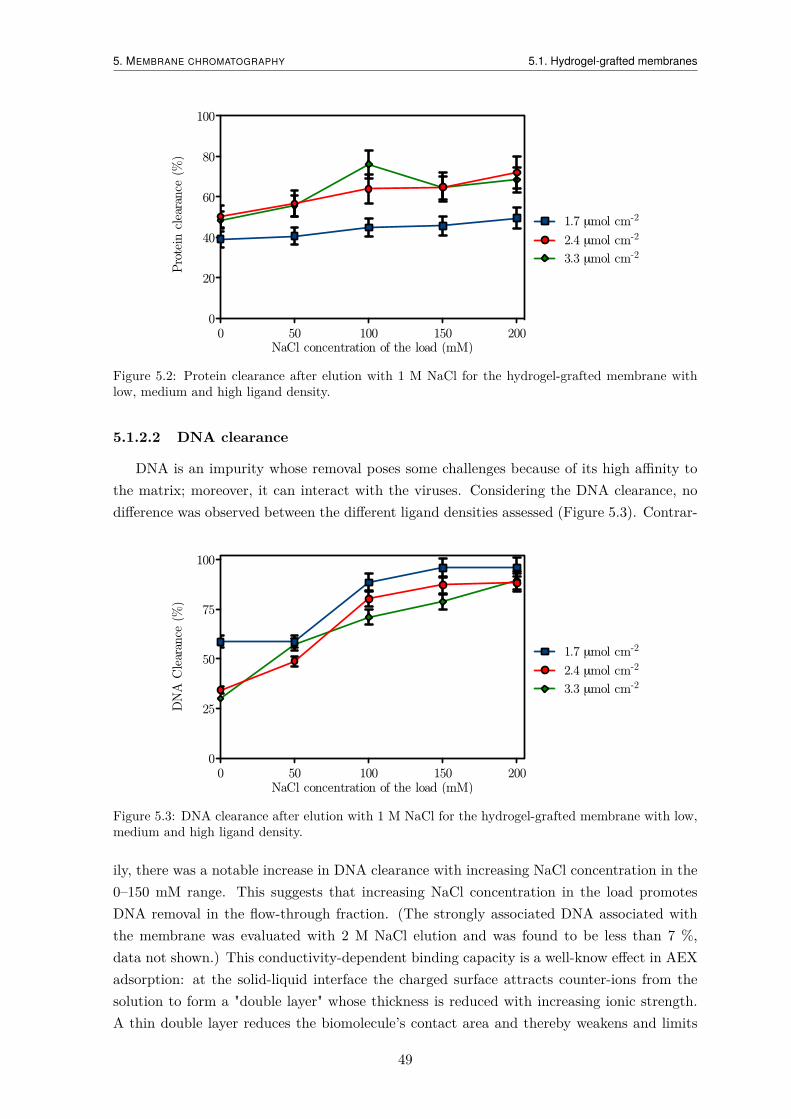
5. MEMBRANE CHROMATOGRAPHY 5.1. Hydrogel-grafted membranes
0 50 100 150 2000
20
40
60
80
100
3.3 µmol cm-2
2.4 µmol cm-2
1.7 µmol cm-2
NaCl concentration of the load (mM)
Pro
tein
cle
aran
ce (
%)
Figure 5.2: Protein clearance after elution with 1 M NaCl for the hydrogel-grafted membrane withlow, medium and high ligand density.
5.1.2.2 DNA clearance
DNA is an impurity whose removal poses some challenges because of its high a�nity tothe matrix; moreover, it can interact with the viruses. Considering the DNA clearance, nodi�erence was observed between the di�erent ligand densities assessed (Figure 5.3). Contrar-
0 50 100 150 2000
25
50
75
100
3.3 µmol cm-2
2.4 µmol cm-2
1.7 µmol cm-2
NaCl concentration of the load (mM)
DN
A C
lear
ance
(%
)
Figure 5.3: DNA clearance after elution with 1 M NaCl for the hydrogel-grafted membrane with low,medium and high ligand density.
ily, there was a notable increase in DNA clearance with increasing NaCl concentration in the0–150 mM range. This suggests that increasing NaCl concentration in the load promotesDNA removal in the flow-through fraction. (The strongly associated DNA associated withthe membrane was evaluated with 2 M NaCl elution and was found to be less than 7 %,data not shown.) This conductivity-dependent binding capacity is a well-know e�ect in AEXadsorption: at the solid-liquid interface the charged surface attracts counter-ions from thesolution to form a "double layer" whose thickness is reduced with increasing ionic strength.A thin double layer reduces the biomolecule’s contact area and thereby weakens and limits
49

5. MEMBRANE CHROMATOGRAPHY 5.2. Directly grafted membranes
the electrostatic interactions between the ion exchange group and the biomolecule resultingin reduced adsorption capacity [139,140].
5.2 Directly grafted membranes
5.2.1 Virus recovery
With the directly grafted membrane virus binding was heavily reduced as can be observedby the high virus recovery in the flow-through and residual amounts eluted with 1 M NaCl(Figure 5.4). This is the opposite of what was observed in the hydrogel-grafet membranes,
0 50 1000
25
50
75
100
125
4.5 µmol cm-2
2.5 µmol cm-2
0.5 µmol cm-2
NaCl concentration of the load (mM)
Tot
al V
irus
Rec
over
y (
%)
(a)
0 50 1000
25
50
75
100
4.5 µmol cm-2
2.5 µmol cm-2
0.5 µmol cm-2
NaCl concentration of the load (mM)
Tot
al V
irus
Rec
over
y (
%)
(b)
Figure 5.4: TP recovery (a) in the flow-though and (b) after elution with 1 M NaCl for the directlygrafted membrane with low, medium and high ligand density.
despite the comparable ligand densities. As discussed previously, low conductivity promotesbiomolecule binding leading to virus recovery in the flow-through between 23 and 66 %without NaCl. When the NaCl was increased to 50–100 mM the virus recovery was improvedup to 100 % for the medium ligand density (2.5 µmol cm-2).
Furthermore, in the experiments with the directly grafted membranes there was a good
50

5. MEMBRANE CHROMATOGRAPHY 5.2. Directly grafted membranes
agreement between the viruses in the flow-through and in the subsequent elution, corrobo-rating the hypothesis that incomplete virus recovery in high ligand density is related withthe hydrogel layer.
5.2.2 Impurity removal
5.2.2.1 Protein clearance
The analysis of total protein concentration in the flow-through did not show major dif-ferences between the 0.5 and 2.5 µmol cm-2 ligand densities (Figure 5.5). The high ligand
0 50 1000
25
50
75
100
2.5 µmol cm-2
0.5 µmol cm-2
4.5 µmol cm-2
NaCl concentration of the load (mM)
Pro
tein
cle
aran
ce (
%)
Figure 5.5: Protein clearance after elution with 1 M NaCl for the directly grafted membrane with low,medium and high ligand density.
density (4.5 µmol cm-2) resulted in protein clearance slightly higher compared with the lowand medium ligand densities assayed, suggesting an increase in protein binding capacity dueto ligand density increase.
5.2.2.2 DNA clearance
In line with the results of HCP removal, loading with low conductivity resulted in higherDNA binding (and removal from flow-through) when compared with 50 and 100 mM of NaCl(Figure 5.6). The high and medium ligand density membranes seem to be more responsiveto NaCl concentration. When using these membranes, conductivity increases led to lowerDNA clearance in the flow-through faction, meaning a decreased DNA binding (as observedpreviously, Figure 5.4). On the contrary, the low ligand density membrane shown a constantDNA clearance (56–58 %) within the NaCl concentration range tested.
Comparing the DNA clearance for both types of membrane structure, the results showthat the hydrogel layer decrease accessibility of the DNA, resulting in high amounts of DNAin flow-through. Whereas the directly grafted membrane enabled DNA binding as proved bythe 56–84 % DNA clearance in flow-though.
51

5. MEMBRANE CHROMATOGRAPHY 5.3. Discussion
0 50 1000
25
50
75
100
4.5 µmol cm-2
2.5 µmol cm-2
0.5 µmol cm-2
NaCl concentration of the load (mM)
DN
A C
lear
ance
(%
)
Figure 5.6: DNA clearance in the flow-through for the directly grafted membrane with low, mediumand high ligand density.
5.3 Discussion
The membrane adsorbers were evaluated in bind/elute as well as flowthrough mode for pu-rification of Ad5 from its process-derived impurities, such as DNA and total protein. A com-plex feed stock derived from bioreactor production was used in order to obtain a more realisticapproach compared to other studies were model proteins or pure products are used [138,141].In addition, the use of scale-down devices, such as the 96-well chromatographic system allowsto screen several factors while characterizing the design space (Figure 5.7)
(a) (b)
Figure 5.7: Experimental design space for the hydrogel-grafted membranes. The panel shows the (a)recovery yield and (b) DNA clearance of the 1 M NaCl eluion for the hydrogel grafted membrane. Adecreased ligand density and increased ionic strength to value of 150 mM NaCl are suitable conditionsfor hydrogel-grafted membranes.
52

5. MEMBRANE CHROMATOGRAPHY 5.3. Discussion
The hydrogel-grafted membranes yield higher virus recoveries than the directly graftedmembranes. Among the hydrogel-grafted membranes, lower and medium ligand densitiesimprove the performance of the purification process. Particularly, the medium ligand density(2.4 µmol cm-2) appears to provide a good comprise between recovery yield (up to 85 %) andimpurity removal (up to 96 % of DNA clearance).
The directly grafted membranes shown low virus binding leading to significant percent-ages of viruses in the flow-through, up to 100 %. Contrarily to the observed with the virus,the absence of hydrogel layer resulted in increased DNA binding and removal from the flow-through. Therefore, further improvements of these kind of membrane (for instance, by in-creasing ligand density) might lead to enhanced DNA removal and optimization of directlygrafted membranes for polishing (flow-through) application.
53

5. MEMBRANE CHROMATOGRAPHY 5.3. Discussion
54

Part IV
Conclusions


6General Discussion and Conclusion
Viruses and VLPs play an important role in the current medical therapies and have anenormous potential for the development of new applications in the fields of vaccination andgene therapy. However, the success of complex biopharmaceuticals deeply depends on thedevelopers/manufacturers’ capacity to deliver clinical-grade lots with a cost-e�ective manu-facturing process. It must also guarantee a scalable and robust production delivering consis-tently the required product quality, safety and purity.
relies greatly on the manufacturing process. This process must guarantee a scalable andcost-e�ective production while achieving consistently the demanded product purity, safetyand quality.
The upstream process has evolved substantially over the last few decades, on the op-posite the downstream processing has been repeatedly identified as the bottleneck in thebiopharmaceutical process [7,142]. Recent e�orts have been made in order to improve thedownstream processing, but its majority focused on the chromatographic separation withinnovative supports [67,115], column designs [120,121], ligands [143] and operation modes [63,122].This work illustrated how new and unexplored technologies can improve the productivityand e�ciency of the entire DSP.
6.1 Debottlenecking the DSP rigth from the beginning
The upstream technology advances enabled high cell densities as part of process intensi-fication e�orts, however this and other improvements have created new challenges for bulkclarification [19,23]. In addition to the high biomass content, the large volumes must be pro-cessed quickly, especially when labile products are considered. The body feed filtration hereevaluated is suggested as an alternative for bulk clarification (Chapter 3). The filter aid
57

6. GENERAL DISCUSSION AND CONCLUSION 6.2. Future work and outlook
trial enabled to select Divergan RS due to its superior Ad5 recovery. It is suggested thatthe non-charged nature of this synthetic polymer combined with its high specific area areresponsible for the superior performance compared with the remaining DE assessed. Furtherdevelopments and integration into a scalable filtration set-up will render body feed filtrationas an alternative to depth filter clarification [77,82].
Ultrafiltration is a unit operation widely used in pilot- and industrial-scale purificationschemes [19,22,106]. Ultrafiltration can be applied to concentrate a bulk and/or to exchangebu�er in a scalable manner. The majority of the literature reports the use of HF moduleswhich are associated with lower shear rates but longer processing times when compared withthe flat-sheet cassette modules. In this work several cassette and HF modules were comparedfor Ad5 and RV concentration and bu�er exchange (Chapter 4). Our results indicate thatlarge cut-o� cassette modules are a suitable to Ad5 concentration with complete IP recoveriesin shorter processing times compared with currently available hollow fibers.
Chromatography, especially IEX chromatography, is a well-established operation for viruspurification due to it separation power and versatility [7,68]. Traditionally chromatography hasbeen performed with packed-bed columns, however new stationary phases, such as membraneadsorbers, have several advantages capable of improving chromatography productivity by de-creasing processing times and bu�er usage. Furthermore, the low production cost enables theuse of membrane adsorbers as single-use devices, avoiding regeneration, CIP and validationprocedures. The work developed in this thesis demonstrates how specific membrane fea-tures (i. e. ligand density and membrane structure) together with load conductivity impactbinding and purification of a Adenovrius model (Chapter 5). Our results demonstrate thatgrafted membrane with a ligand density of 2.4 µmol cm-2 provided the best trade-o� betweenhigh virus recovery and high DNA removal, when operated in bind/elute mode. In addition,the use of a 96-well system enabled a high-throughput screening in a Design of Experiments(DoE) approach.
6.2 Future work and outlook
This thesis’ work led to the identification of innovative technologies capable of improvingthe current viruses DSP, however further optimizations are required. The body feed filtra-tion should be implemented in a scalable set-up in order to confirm this novel technologyas an alternative for clarification. Further developments should target the characterizationof the intrinsic filter aid material permeability (with pure water), conductivity adjustmentsand addition of floculants (domiphen bromide) or precipitants (e. g. (NH4)3SO4) to increasefiltration performance. Additionally, the determination of particle size, size distribution and’–potential of the filter aid material (and virus bulk) would provide valuable information tounderstand the interaction mechanism. Ultrafiltration using large MWCO cassette moduleswas successfully employed to concentrate Ad5, but the low recoveries observed for RV indi-cate that further optimizations are needed specially for low-titer and shear-sensitive viruses.The following work should target the optimization of MWCO, shear rate and membrane load.Also, it should be determined if increasing diafiltration bu�er enables to increase the recoveryyield of this step. Considering the membrane adsorbers used for IEX chromatography, the
58

6. GENERAL DISCUSSION AND CONCLUSION
determination of the dynamic binding capacity for viruses as well as for the main impuritieswould be a valuable information towards a rational process development of the chromato-graphic step. Such information could be later incorporated in the design of continuous orsemi-continuous chromatography operation.
The ultimate goal for DSP is to have a robust purification platform running continuouslydelivering the required purity. Considering this goal, disposable devices (depth filters or ul-trafiltration devices) will be helpful in early steps of the DSP [60,62], however chromatographicseparation still needs further development. In this context, continuous or semi-continuouschromatography routines that have been suggested for mAbs might be applied also for viruspurification [63,144,145]. Besides continuous operation, convective mass transport chromato-graphic supports like membrane adsorbers and monoliths can further enhance the produc-tivity of chromatography [114,115]. Combination of these established technologies with oldseparation technologies, such as precipitation and aqueous two-phase systems, could rendernew and improved DSP schemes; however the feasibility of such revisited technologies mustbe confirmed specifically for virus purification [100,103,116,146].
Following the Quality by Design (QbD) initiative launched by the FDA and Interna-tional Conference on Harmonization (ICH) [147], scale-down tools that enable knowledge-based process development [148,149] and improved analytical assays will be increasingly im-portant [150–153].
59
6. GENERAL DISCUSSION AND CONCLUSION
60

Bibliography
1. Josefsberg, J.O., Buckland, B.. Vaccine process technology. Biotechnol Bioeng 2012;109(6):1443–1460.
2. Walsh, G.. Biopharmaceutical benchmarks 2010. Nat Biotechnol 2010; 28(9):917–924.
3. Declerck, P.. Biologicals and biosimilars: a review of the science and its implications.GaBI J 2012; 1(1):13–16.
4. Burnett, J.R., Hooper, A.J.. Alipogene tiparvovec, an adeno-associated virus encodingthe Ser(447)X variant of the human lipoprotein lipase gene for the treatment of patientswith lipoprotein lipase deficiency. Curr Opin Mol Ther 2009; 11(6):681–691.
5. Roldão, A., Mellado, M.C.M., Castilho, L.R., Carrondo, M.J., Alves, P.M.. Virus-like particles in vaccine development. Expert Rev Vaccines 2010; 9(10):1149–1176.
6. El-Aneed, A.. An overview of current delivery systems in cancer gene therapy. JControl Release 2004; 94(1):1–14.
7. Wol�, M.W., Reichl, U.. Downstream processing of cellculture-derived virus particles.Expert Rev Vaccines 2011; 10(10):1451–1475.
8. Noad, R., Roy, P.. Virus-like particles as immunogens. Trends Microbiol 2003;11(9):438–444.
9. Abdel-Motal, U.M., Guay, H.M., Wigglesworth, K., Welsh, R.M., Galili, U..Immunogenicity of influenza virus vaccine is increased by anti-gal-mediated targetingto antigen-presenting cells. J Virol 2007; 81(17):9131–9141.
10. Wang, W., Lu, B., Zhou, H., Suguitan, A.L., Cheng, X., Subbarao, K., et al.Glycosylation at 158N of the Hemagglutinin Protein and Receptor Binding SpecificitySynergistically A�ect the Antigenicity and Immunogenicity of a Live Attenuated H5N1A/Vietnam/1203/2004 Vaccine Virus in Ferrets. J Virol 2010; 84(13):6570–6577.
61

Bibliography
11. Heilbronn, R., Weger, S.. Viral Vectors for Gene Transfer: Current Status of GeneTherapeutics. In: Schäfer-Korting, M., editor. Handbook of Experimental Pharmacol-ogy. Berlin: Springer Verlag Berlin Heidelberg; 2009, p. 143–170.
12. Bae, K., Choi, J., Jang, Y., Ahn, S., Hur, B.. Innovative vaccine productiontechnologies: the evolution and value of vaccine production technologies. Arch PharmRes 2009; 32(4):465–480.
13. Fahim, R.E.F., Tan, L.U.L., Barreto, L., Thipphawong, J., Jackson, G.E.D..Multivalent DTP-Polio vaccines. European Patent 1762246 A1 2007;.
14. Klade, C., Scharnagl, N.. Japanese encephalitis virus (JEV) and tick-borne encephali-tis virus (TBEV) peptides stimulating human T-cell responses. World Patent 024534A2 2009;.
15. Friedman, P.A., Krah, D.A., Provost, P.J.. Process for attenuated varicella zostervirus vaccine production. European Patent 0573107 B1 1993;.
16. Liu, J., Schwartz, R., Thompson, M., Maranga, L.J.C., HSU, S.S.T., Ghosh, M.,et al. MDCK cell lines supporting viral growth to high titers and bioreactor processusing the same. US Patent 0052717 A1 2013;.
17. de Vocht, M.L., Veenstra, M.. Process for adenovirus purification from high celldensity cultures. US Patent 0202268 A1 2012;.
18. Luitjens, A., van Herk, H.. Method for the production of Ad26 adenoviral vectors.US Patent 0315696 A1 2012;.
19. Altaras, N.E., Aunins, J.G., Evans, R.K., Kamen, A., Konz, J.O., Wolf, J.J..Production and formulation of adenovirus vectors. Adv Biochem Eng Biotechnol 2005;99:193–260.
20. Le Ru, A., Jacob, D., Transfiguracion, J., Ansorge, S., Henry, O., Kamen, A.A..Scalable production of influenza virus in HEK-293 cells for e�cient vaccine manufac-turing. Vaccine 2010; 28(21):3661–3671.
21. Cook, J.C.. Process for purifying human papillomavirus virus-like particles. WorldPatent 2000009671 A1 2000;.
22. Descamps, D., Giannini, S., Lecrenier, N., Stephenne, J., Wettendor�, M.A.C..Vaccine against HPV. US Patent 0189229 A1 2011;.
23. Silva, A.C., Peixoto, C., Lucas, T., Küppers, C., Cruz, P.E., Alves, P.M., et al.Adenovirus vector production and purification. Curr Gene Ther 2010; 10(6):437–455.
24. Kotin, R.M.. Large-scale recombinant adeno-associated virus production. Hum MolGenet 2011; 20(R1):R2–R6.
25. Urabe, M., Ozawa, K., Haast, S.J.P., Hermens, W.T.J.M.C.. Avv vectors producedin insect cells. US Patent 8163543 B2 2013;.
62

Bibliography
26. Coroadinha, A.S., Gama-Norton, L., Amaral, A.I., Hauser, H., Alves, P.M., Cruz,P.E.. Production of retroviral vectors: review. Curr Gene Ther 2010; 10(6):456–473.
27. Rodrigues, A.F., Alves, P.M., Coroadinha, A.S.. Production of Retroviral andLentiviral Gene Therapy Vectors: Challenges in the Manufacturing of Lipid EnvelopedVirus. In: Xu, K., editor. Viral Gene Therapy. INTECH; 2011, p. 15–40.
28. Specifications: test procedures and acceptance criteria for biotechnological/biologicalproducts. ICH Q6B 1999;.
29. Viral safety evaluation of biotechnology products derived from cell lines of human oranimal origin. ICH Q5A(R1) 1999;.
30. Evaluation and recommendation of pharmacopoeial texts for use in the ICH regions.ICH Q4B 2007;.
31. Dolgin, E.. Gene therapies advance, but some see manufacturing challenges. Nat Med2012; 18(12):1718–1719.
32. Stewart, P.L.. Adenovirus structure. In: Curiel, D.T., douglas, J.T., editors. Aden-oviral Vectors for Gene Therapy. San Diego: Academic Press; 2002, p. 1–18.
33. Horne, R.W., Brenner, S., Waterson, A.P., Wildy, P.. The icosahedral form of anadenovirus. J Mol Biol 1959; 1(1):84–86.
34. Ruigrok, R.W., Nermut, M.V., Andree, P.J.. The molecular mass of adenovirus type5 as determined by means of scanning transmission electron microscopy (STEM). JVirol Methods 1984; 9(1):69–78.
35. Russell, W.C.. Adenoviruses: update on structure and function. Journal of GeneralVirology 2009; 90(1):1–20.
36. Trilisky, E.I., Lenho�, A.M.. Sorption processes in ion-exchange chromatography ofviruses. J Chromatogr A 2007; 1142(1):2–12.
37. Roitsch, C., Achstetter, T., Benchaibi, M., Bonfils, E., Cauet, G., Gloeckler, R.,et al. Characterization and quality control of recombinant adenovirus vectors for genetherapy. J Chromatogr B Biomed Sci Appl 2001; 752(2):263–280.
38. Blanche, F., Monegier, B., Faucher, D., Duchesne, M., Audhuy, F., Barbot, A.,et al. Polypeptide composition of an adenovirus type 5 used in cancer gene therapy. JChromatogr A 2001; 921(1):39–48.
39. Rux, J.J., Burnett, R.M.. Adenovirus structure. Hum Gene Ther 2004; 15(12):1167–1176.
40. de Vrij, J., Willemsen, R.A., Lindholm, L., Hoeben, R.C., GIANT Consortium,, Bangma, C.H., et al. Adenovirus-derived vectors for prostate cancer gene therapy.Hum Gene Ther 2010; 21(7):795–805.
63

Bibliography
41. Zhang, Y., Fang, L., Zhang, Q., Zheng, Q., Tong, J., Fu, X., et al. An oncolyticadenovirus regulated by a radiation-inducible promoter selectively mediates hSulf-1gene expression and mutually reinforces antitumor activity of I(131)-metuximab inhepatocellular carcinoma. Mol Oncol 2013; 7(3):346–358.
42. Barouch, D.H.. Novel adenovirus vector-based vaccines for HIV-1. Curr Opin HIVAIDS 2010; 5(5):386–390.
43. Schuldt, N.J., Amalfitano, A.. Malaria vaccines: Focus on adenovirus based vectors.Vaccine 2012; 30(35):5191–5198.
44. Ma, G., Shimada, H., Hiroshima, K., Tada, Y., Suzuki, N., Tagawa, M.. Genemedicine for cancer treatment: Commercially available medicine and accumulated clin-ical data in China. Drug Des Devel Ther 2008; 2:115.
45. Räty, J.K., Pikkarainen, J.T., Wirth, T., Ylä-Herttuala, S.. Gene therapy: the firstapproved gene-based medicines, molecular mechanisms and clinical indications. CurrMol Pharmacol 2008; 1(1):13–23.
46. Barouch, D.H., Nabel, G.J.. Adenovirus vector-based vaccines for human immunod-eficiency virus type 1. Hum Gene Ther 2005; 16(2):149–156.
47. Esparza, J.. Progress in the development of an adenovirus 26 vector platform for HIVvaccines. Expert Rev Vaccines 2013; 12(5):477–480.
48. Giacca, M., Zacchigna, S.. Virus-mediated gene delivery for human gene therapy. JControl Release 2012; 161(2):377–388.
49. Tatsis, N., Ertl, H.C.J.. Adenoviruses as vaccine vectors. Mol Ther 2004; 10(4):616–629.
50. Co�n, J.M.. Structure and classification of Retrovirus. In: Levy, J.a., editor. Theretroviridae. New York: Academic Press; 1992, p. 19–49.
51. Andreadis, S.T., Roth, C.M., Le Doux, J.M., Morgan, J.R., Yarmush, M.L.. Large-Scale Processing of Recombinant Retroviruses for Gene Therapy. Biotechnol Prog 1999;15(1):1–11.
52. Rein, A.. Murine Leukemia Viruses: Objects and Organisms. Adv Virol 2011;2011(1):1–14.
53. Ginn, S.L., Alexander, I.E., Edelstein, M.L., Abedi, M.R., Wixon, J.. Gene therapyclinical trials worldwide to 2012 - an update. J Gene Med 2013; 15(2):65–77.
54. Carrondo, M., Panet, A., Wirth, D., Coroadinha, A.S., Cruz, P., Falk, H., et al.Integrated Strategy for the Production of Therapeutic Retroviral Vectors. Hum GeneTher 2011; 22(3):370–379.
64

Bibliography
55. Eckert, H.G., Kühlcke, K., Schilz, A.J., Lindemann, C., Basara, N., Fauser, A.A.,et al. Clinical scale production of an improved retroviral vector expressing the humanmultidrug resistance 1 gene (MDR1). Bone Marrow Transplant 2000; 25(S2):S114–S117.
56. Przybylowski, M., Hakakha, A., Stefanski, J., Hodges, J., Sadelain, M., Rivière,I.. Production scale-up and validation of packaging cell clearance of clinical-graderetroviral vector stocks produced in Cell Factories. Gene Ther 2006; 13(1):95–100.
57. Wikström, K., Blomberg, P., Islam, K.B.. Clinical grade vector production: analysisof yield, stability, and storage of gmp-produced retroviral vectors for gene therapy.Biotechnol Prog 2004; 20(4):1198–1203.
58. Shukla, A.A., Hubbard, B., Tressel, T., Guhan, S., Low, D.. Downstream processingof monoclonal antibodies—Application of platform approaches. J Chromatogr B 2007;848(1):28–39.
59. Roque, A.C.A., Lowe, C.R., Taipa, M.A.. Antibodies and Genetically EngineeredRelated Molecules: Production and Purification. Biotechnol Prog 2004; 20(3):639–654.
60. Gottschalk, U.. Disposables in downstream processing. Adv Biochem Eng Biotechnol2010; 115:171–183.
61. Kuczewski, M., Schirmer, E., Lain, B., Zarbis-Papastoitsis, G.. A single-use pu-rification process for the production of a monoclonal antibody produced in a PER.C6human cell line. Biotechnol J 2010; 6(1):56–65.
62. Shukla, A.A., Gottschalk, U.. Single-use disposable technologies for biopharmaceuticalmanufacturing. Trends Biotechnol 2013; 31(3):149–156.
63. Godawat, R., Brower, K., Jain, S., Konstantinov, K., Riske, F., Warikoo, V..Periodic counter-current chromatography - design and operational considerations forintegrated and continuous purification of proteins. Biotechnol J 2012; 7(12):1496–1508.
64. Warikoo, V., Godawat, R., Brower, K., Jain, S., Cummings, D., Simons, E.,et al. Integrated continuous production of recombinant therapeutic proteins. BiotechnolBioeng 2012; 109(12):3018–3029.
65. Zhang, S., Thwin, C., Wu, Z., Cho, T., Wilson, D., Caston, L.. Methods forproducing purified adenoviral vectors. US Patent 7510875 B2 2009;.
66. Peixoto, C., Ferreira, T.B., Sousa, M.F.Q., Carrondo, M.J.T., Alves, P.M.. Towardspurification of adenoviral vectors based on membrane technology. Biotechnol Prog 2008;24(6):1290–1296.
67. Fernandes, P., Peixoto, C., Santiago, V.M., Kremer, E.J., Coroadinha, A.S., Alves,P.M.. Bioprocess development for canine adenovirus type 2 vectors. Gene Ther 2012;20(4):353–360.
65

Bibliography
68. Segura, M.M., Kamen, A.A., Garnier, A.. Overview of Current Scalable Methodsfor Purification of Viral Vectors. In: Merten, O.W., Al-Rubeai, M., editors. ViralVectors for Gene Therapy: Methods and Protocols. Totowa, NJ: Humana Press; 2011,p. 89–116.
69. Vicente, T., Peixoto, C., Carrondo, M.J.T., Alves, P.M.. Purification of recombinantbaculoviruses for gene therapy using membrane processes. Gene Ther 2009; 16(6):766–775.
70. Goerke, A.R., To, B.C.S., Lee, A.L., Sagar, S.L., Konz, J.O.. Development of anovel adenovirus purification process utilizing selective precipitation of cellular DNA.Biotechnol Bioeng 2005; 91(1):12–21.
71. Konz, J.O., Lee, A.L., To, B.C.S., Goerke, A.R.. Methods of adenovirus purification.US Patent 0118970 A1 2008;.
72. Konz, J.O., Lee, A.L., Lewis, J.A., Sagar, S.L.. Development of a purificationprocess for adenovirus: controlling virus aggregation to improve the clearance of hostcell DNA. Biotechnol Prog 2005; 21(2):466–472.
73. Russell, E., Wang, A., Rathore, A.S.. Harvest of a Therapeutic Protein Product fromHigh Cell Density Fermentation Broths: Principles and Case Study. In: Shukla, A.A.,Etzel, M.R., Gadam, S., editors. Process Scale Bioseparations for the Biopharmaceu-tical Industry. Boca Raton: CRC Press; 2007, p. 1–58.
74. Liu, H.F., Ma, J., Winter, C., Bayer, R.. Recovery and purification process devel-opment for monoclonal antibody production. MAbs 2010; 2(5):480–499.
75. Kelley, B.. Very Large Scale Monoclonal Antibody Purification: The Case for Con-ventional Unit Operations. Biotechnol Prog 2007; 23:995–1008.
76. Chon, J.H., Zarbis-Papastoitsis, G.. Advances in the production and downstreamprocessing of antibodies. N Biotechnol 2011; 28(5):458–463.
77. Roush, D.J., Lu, Y.. Advances in Primary Recovery: Centrifugation and MembraneTechnology. Biotechnol Prog 2008; 24(3):488–495.
78. Ostreicher, E.A., Arnold, T.E., Conway, R.S.. Charge Modified Filter Media. In:Jornitz, M.W., Meltzer, T.H., editors. Filtration and Purification in the Biopharma-ceutical Industry. Informa Healthcare; 2008, p. 23–46.
79. Kalbfuss, B., Genzel, Y., Wol�, M., Zimmermann, A., Morenweiser, R., Reichl,U.. Harvesting and concentration of human influenza A virus produced in serum-free mammalian cell culture for the production of vaccines. Biotechnol Bioeng 2007;97(1):73–85.
80. Peixoto, C., Sousa, M.F.Q., Silva, A.C., Carrondo, M.J.T., Alves, P.M.. Downstreamprocessing of triple layered rotavirus like particles. J Biotechnol 2007; 127(3):452–461.
66

Bibliography
81. Yigzaw, Y., Piper, R., Tran, M., Shukla, A.A.. Exploitation of the adsorptiveproperties of depth filters for host cell protein removal during monoclonal antibodypurification. Biotechnol Prog 2006; 22(1):288–296.
82. Singh, N., Pizzelli, K., Romero, J.K., Chrostowski, J., Evangelist, G., Hamzik,J., et al. Clarification of recombinant proteins from high cell density mammalian cellculture systems using new improved depth filters. Biotechnol Bioeng 2013; 110(7):1964–1972.
83. Rodrigues, T., Carvalho, A., Carmo, M., Carrondo, M.J.T., Alves, P.M., Cruz,P.E.. Scaleable purification process for gene therapy retroviral vectors. J Gene Med2007; 9(4):233–243.
84. van Reis, R., Zydney, A.. Bioprocess membrane technology. J Memb Sci 2007;297(1-2):16–50.
85. Jonas, F., Diel, B.. Device and method for filtering a liquid sample. World Patent2013034242 A1 2013;.
86. Koehler, K., Tarrach, K., Thiefes, A.. Depth filter layer with inorganic layer doublehydroxide. US Patent 0207196 A1 2011;.
87. Freeman, G.J., McKechnie, M.T.. Filtration and Stabilization of Beers. In: Lea,A.G.H., Piggott, J.R., editors. Fermented Beverage Production. Springer; 2003, p.365–392.
88. Thomassen, Y.E., van ’t Oever, A.G., Vinke, M., Spiekstra, A., Wij�els, R.H.,van der Pol, L.A., et al. Scale-down of the inactivated polio vaccine production process.Biotechnol Bioeng 2013; 110(5):1354–1365.
89. Farid, S.S.. Process economics of industrial monoclonal antibody manufacture. JChromatogr B Analyt Technol Biomed Life Sci 2007; 848(1):8–18.
90. Zydney, A.L.. Membrane technology for purification of therapeutic proteins. BiotechnolBioeng 2009; 103(2):227–230.
91. van Reis, R., Zydney, A.. Membrane processes in biotechnology: An overview.Biotechnol Adv 2006; 24(5):482–492.
92. Segura, M.M., Mangion, M., Gaillet, B., Garnier, A.. New developments in lentiviralvector design, production and purification. Expert Opin Biol Ther 2013; 13(7):987–1011.
93. Bandeira, V.S., Peixoto, C., Rodrigues, A.F., Cruz, P., Alves, P., Coroadinha, A.S.,et al. Downstream Processing of Lentiviral Vectors: releasing bottlenecks. Hum GeneTher Methods 2012; 23(4):255–263.
94. Kamen, A., Henry, O.. Development and optimization of an adenovirus productionprocess. J Gene Med 2004; 6(S1):S184–S192.
67

Bibliography
95. Segura, M.M., Puig, M., Monfar, M., Chillón, M.. Chromatography Purification ofCanine Adenoviral Vectors. Hum Gene Ther Methods 2012; 23(3):182–197.
96. Wickramasinghe, S.R., Kalbfuß, B., Zimmermann, A., Thom, V., Reichl, U.. Tan-gential flow microfiltration and ultrafiltration for human influenza A virus concentrationand purification. Biotechnol Bioeng 2005; 92(2):199–208.
97. Subramanian, S., Altaras, G.M., Chen, J., Hughes, B.S., Zhou, W., Altaras,N.E.. Pilot-Scale Adenovirus Seed Production through Concurrent Virus Release andConcentration by Hollow Fiber Filtration. Biotechnol Prog 2008; 21(3):851–859.
98. Weggeman, M., van Corven, E.J.J.M.. Virus purification methods. European Patent1780269 B1 2005;.
99. Rodrigues, T., Carrondo, M.J.T., Alves, P.M., Cruz, P.E.. Purification of retroviralvectors for clinical application: Biological implications and technological challenges. JBiotechnol 2007; 127(3):520–541.
100. Oelmeier, S.A., Dismer, F., Hubbuch, J.. Application of an aqueous two-phase systemshigh-throughput screening method to evaluate mAb HCP separation. Biotechnol Bioeng2010; 108(1):69–81.
101. Azevedo, A.M., Rosa, P.A.J., Ferreira, I.F., Aires-Barros, M.R.. Optimisation ofaqueous two-phase extraction of human antibodies. J Biotechnol 2007; 132(2):209–217.
102. Gervais, D.P., Pfei�er, K.A.. Antibody purification process by precipitation. USPatent 0204455 A1 2010;.
103. Knevelman, C., Davies, J., Allen, L., Titchener-Hooker, N.J.. High-throughputscreening techniques for rapid PEG-based precipitation of IgG4 mAb from clarified cellculture supernatant. Biotechnol Prog 2009; 26(3):697–705.
104. McDonald, P., Victa, C., Carter-Franklin, J.N., Fahrner, R.. Selective antibodyprecipitation using polyelectrolytes: A novel approach to the purification of monoclonalantibodies. Biotechnol Bioeng 2009; 102(4):1141–1151.
105. Benavides, J., Mena, J.A., Cisneros-Ruiz, M., Ramírez, O.T., Palomares, L.A.,Rito-Palomares, M.. Rotavirus-like particles primary recovery from insect cells inaqueous two-phase systems. J Chromatogr B Analyt Technol Biomed Life Sci 2006;842(1):48–57.
106. Vicente, T., Roldão, A., Peixoto, C., Carrondo, M.J.T., Alves, P.M.. Large-scale production and purification of VLP-based vaccines. J Invertebr Pathol 2011;107(S):S42–S48.
107. Wol�, M.W., Siewert, C., Hansen, S.P., Faber, R., Reichl, U.. Purification of cellculture-derived modified vaccinia ankara virus by pseudo-a�nity membrane adsorbersand hydrophobic interaction chromatography. Biotechnol Bioeng 2010; 107(2):312–320.
68

Bibliography
108. Riske, F., Berard, N., Albee, K., Pan, P., Henderson, M., Adams, K., et al.Development of a platform process for adenovirus purification that removes humanSET and nucleolin and provides high purity vector for gene delivery. Biotechnol Bioeng2013; 110(3):848–856.
109. Shabram, P.W., Giroux, D.D., Goudreau, A.M., Gregory, R.J., Horn, M.T., Huyghe,B.G., et al. Analytical anion-exchange HPLC of recombinant type-5 adenoviral parti-cles. Hum Gene Ther 1997; 8(4):453–465.
110. Konz, J.O., Livingood, R.C., Bett, A.J., Goerke, A.R., Laska, M.E., Sagar, S.L..Serotype specificity of adenovirus purification using anion-exchange chromatography.Hum Gene Ther 2005; 16(11):1346–1353.
111. Kuhn, I., Larsen, B., Gross, C., Hermiston, T.. High-performance liquid chromatog-raphy method for rapid assessment of viral particle number in crude adenoviral lysatesof mixed serotype. Gene Ther 2007; 14(2):180–184.
112. Ghosh, R.. Protein separation using membrane chromatography: opportunities andchallenges. J Chromatogr A 2002; 952(1-2):13–27.
113. Rathore, A.S., Shirke, A.. Recent developments in membrane-based separations inbiotechnology processes: review. Prep Biochem Biotechnol 2011; 41(4):398–421.
114. Orr, V., Zhong, L., Moo-Young, M., Chou, C.P.. Recent advances in bioprocessingapplication of membrane chromatography. Biotechnol Adv 2013; 31(4):450–465.
115. Jungbauer, A., Hahn, R.. Polymethacrylate monoliths for preparative and industrialseparation of biomolecular assemblies. J Chromatogr A 2008; 1184(1-2):62–79.
116. Gottschalk, U., Brorson, K., Shukla, A.A.. Innovation in biomanufacturing: the onlyway forward. Pharm Bioproces 2013; 1(2):141–157.
117. Eglon, M.N., Du�y, A.M., O’Brien, T., Strappe, P.M.. Purification of adenoviralvectors by combined anion exchange and gel filtration chromatography. J Gene Med2009; 11(11):978–989.
118. Weaver, J., Husson, S.M., Murphy, L., Wickramasinghe, S.R.. Anion exchangemembrane adsorbers for flow-through polishing steps: Part II. Virus, host cell protein,DNA clearance, and antibody recovery. Biotechnol Bioeng 2013; 110(2):500–510.
119. Vicente, T., Faber, R., Alves, P.M., Carrondo, M.J.T., Mota, J.P.B.. Impact ofligand density on the optimization of ion-exchange membrane chromatography for viralvector purification. Biotechnol Bioeng 2011; 108(6):1347–1359.
120. Cabanne, C., Raedts, M., Zavadzky, E., Santarelli, X.. Evaluation of radial chro-matography versus axial chromatography, practical approach. J Chromatogr B 2007;845(2):191–199.
69

Bibliography
121. Besselink, T., van der Padt, A., Janssen, A.E.M., Boom, R.M.. Are axial and radialflow chromatography di�erent? J Chromatogr A 2013; 1271(1):105–114.
122. Mahajan, E., George, A., Wolk, B.. Improving a�nity chromatography resin e�ciencyusing semi-continuous chromatography. J Chromatogr A 2012; 1227:154–162.
123. Guiochon, G., Beaver, L.A.. Separation science is the key to successful biopharma-ceuticals. J Chromatogr A 2011; 1218(49):8836–8858.
124. Evans, R.K., Nawrocki, D.K., Isopi, L.A., Williams, D.M., Casimiro, D.R., Chin,S., et al. Development of stable liquid formulations for adenovirus-based vaccines. JPharm Sci 2004; 93(10):2458–2475.
125. Cruz, P.E., Silva, A.C., Roldao, A., Carmo, M., Carrondo, M.J.T., Alves, P.M..Screening of Novel Excipients for Improving the Stability of Retroviral and AdenoviralVectors. Biotechnol Prog 2006; 22(2):568–576.
126. Burden, C.S., Jin, J., Podgornik, A., Bracewell, D.G.. A monolith purification processfor virus-like particles from yeast homogenate. J Chromatogr B 2012; 880:82–89.
127. Coroadinha, A.S., Schucht, R., Gama-Norton, L., Wirth, D., Hauser, H., Carrondo,M.J.T.. The use of recombinase mediated cassette exchange in retroviral vector pro-ducer cell lines: Predictability and e�ciency by transgene exchange. J Biotechnol 2006;124(2):457–468.
128. Kestin, J., Sokolov, M., Wakeham, W.A.. Viscosity of Liquid Water in the Range-8ºC to 150ºC. J Phys Chem Ref Data 1978; 7(3):941–948.
129. Cheryan, M.. Performance and engineering models. In: Cheryan, M., editor. Ultrafil-tration and Microfiltration Handbook. Lancaster: Taylor & Francis; 1998, p. 113–170.
130. Kennedy, M.A., Parks, R.J.. Adenovirus Virion Stability and the Viral Genome: SizeMatters. Mol Ther 2009; 17(10):1664–1666.
131. Rexroad, J., Evans, R.K., Middaugh, C.R.. E�ect of pH and ionic strength on thephysical stability of adenovirus type 5. Biotechnol Bioeng 2005; 95(2):237–247.
132. Comparing Conventional Diatomite and Celpure® Filter Aids,http://www.advancedminerals.com/pdf/AMC02_Compare_Conv._F._Aid_Celpure.pdf. accessed 20th August 2013;.
133. Liu, H.F., McCooey, B., Duarte, T., Myers, D.E., Hudson, T., Amanullah, A., et al.Exploration of overloaded cation exchange chromatography for monoclonal antibodypurification. J Chromatogr A 2011; 1218(39):6943–6952.
134. About Divergan, http://www.crosspure.basf.com/web/global/crosspure/en_GB/about_divergan/index. accessed 20th August 2013;.
70
Bibliography
135. Kuiper, M., Sanches, R.M., Walford, J.A., Slater, N.K.H.. Purification of a func-tional gene therapy vector derived from Moloney murine leukaemia virus using mem-brane filtration and ceramic hydroxyapatite chromatography. Biotechnol Bioeng 2002;80(4):445–453.
136. Silva, A.C., Simão, D., Sousa, M.F.Q., Peixoto, C., Cruz, P., Carrondo, M.J.T.,et al. Production and purification of Ad vectors: current status and future needs forAdenovirus vector production. In: Cohen-Haguenauer, O., editor. The CliniBook:Clinical gene transfer state of the art. Paris: EDK; 2012, p. 245–250.
137. Cruz, P.E., Goncalves, D., Almeida, J., Moreira, J.L., Carrondo, M.J.T.. ModelingRetrovirus Production for Gene Therapy. 2. Integrated Optimization of Bioreaction andDownstream Processing. Biotechnol Prog 2000; 16(3):350–357.
138. Hardin, A.M., Harinarayan, C., Malmquist, G., Axén, A., van Reis, R.. Ionexchange chromatography of monoclonal antibodies: e�ect of resin ligand density ondynamic binding capacity. J Chromatogr A 2009; 1216(20):4366–4371.
139. Okada, T.. Interpretation of Ion-Exchange Chromatographic Retention Based on anElectrical Double-Layer Model. Environ Sci Technol 1998; 70(9):1692–1700.
140. Pujar, N.S., Zydney, A.L.. Electrostatic e�ects on protein partitioning in size-exclusionchromatography and membrane ultrafiltration. J Chromatogr A 1998; 796(2):229–238.
141. Tatárová, I., Dreve�ák, P., Kosior, A., Polakovi�, M.. Equilibrium and kinetics ofprotein binding on ion-exchange cellulose membranes with grafted polymer layer. ChemPap 2013; 67(12):1–10.
142. Gagnon, P.. Technology trends in antibody purification. J Chromatogr A 2012;1221:57–70.
143. Riordan, W., Heilmann, S., Brorson, K., Seshadri, K., He, Y., Etzel, M.. De-sign of salt-tolerant membrane adsorbers for viral clearance. Biotechnol Bioeng 2009;103(5):920–929.
144. Napadensky, B., Shinkazh, O., Teella, A., Zydney, A.L.. Continuous CountercurrentTangential Chromatography for Monoclonal Antibody Purification. Sep Sci Technol2013; 48(9):1289–1297.
145. Aumann, L., Morbidelli, M.. A continuous multicolumn countercurrent solvent gra-dient purification (MCSGP) process. Biotechnol Bioeng 2007; 98(5):1043–1055.
146. Maranga, L., Rueda, P., Antonis, A.F.G., Vela, C., Langeveld, J.P.M., Casal, J.I.,et al. Large scale production and downstream processing of a recombinant porcineparvovirus vaccine. Appl Microbiol Biotechnol 2002; 59(1):45–50.
147. Elliott, P., Billingham, S., Bi, J., Zhang, H.. Quality by design for biopharma-ceuticals: a historical review and guide for implementation. Pharm Bioproces 2013;1(1):105–122.
71

Bibliography
148. Vicente, T., Mota, J.P.B., Peixoto, C., Alves, P.M., Carrondo, M.J.T.. Rational de-sign and optimization of downstream processes of virus particles for biopharmaceuticalapplications: Current advances. Biotechnol Adv 2011; 29(6):869–878.
149. Wiendahl, M., Schulze Wierling, P., Nielsen, J., Fomsgaard Christensen, D., Krarup,J., Staby, A., et al. High Throughput Screening for the Design and Optimizationof Chromatographic Processes – Miniaturization, Automation and Parallelization ofBreakthrough and Elution Studies. Chem Eng Technol 2008; 31(6):893–903.
150. Schenauer, M.R., Flynn, G.C., Goetze, A.M.. Identification and quantification ofhost cell protein impurities in biotherapeutics using mass spectrometry. Anal Biochem2012; 428(2):150–157.
151. Berrill, A., Ho, S.V., Bracewell, D.G.. Mass spectrometry to describe product andcontaminant adsorption properties for bioprocess development. Biotechnol Bioeng 2011;108(8):1862–1871.
152. Thompson, C.M., Petiot, E., Lennaertz, A., Henry, O., Kamen, A.A.. Analyticaltechnologies for influenza virus-like particle candidate vaccines: challenges and emerg-ing approaches. Virol J 2013; 10(1):141.
153. Downard, K.M., Morrissey, B., Schwahn, A.B.. Mass spectrometry analysis of theinfluenza virus. Mass Spectrom Rev 2009; 28(1):35–49.
72

Appendix


Figure A1: Amount of the di�erent filter aids used in dry state.
Figure A2: Volume filled by the wet filter aid with 50 mL of virus bulk after settling for 48 hours.
75