pure.uva.nl · Jolanda Maaskant Jolanda Maaskant Medication safety in pediatric care Uitnodiging...
265
UvA-DARE is a service provided by the library of the University of Amsterdam (http://dare.uva.nl) UvA-DARE (Digital Academic Repository) Medication safety in pediatric care Maaskant, J.M. Link to publication Citation for published version (APA): Maaskant, J. M. (2016). Medication safety in pediatric care. General rights It is not permitted to download or to forward/distribute the text or part of it without the consent of the author(s) and/or copyright holder(s), other than for strictly personal, individual use, unless the work is under an open content license (like Creative Commons). Disclaimer/Complaints regulations If you believe that digital publication of certain material infringes any of your rights or (privacy) interests, please let the Library know, stating your reasons. In case of a legitimate complaint, the Library will make the material inaccessible and/or remove it from the website. Please Ask the Library: https://uba.uva.nl/en/contact, or a letter to: Library of the University of Amsterdam, Secretariat, Singel 425, 1012 WP Amsterdam, The Netherlands. You will be contacted as soon as possible. Download date: 14 Apr 2020
Transcript of pure.uva.nl · Jolanda Maaskant Jolanda Maaskant Medication safety in pediatric care Uitnodiging...
UvA-DARE is a service provided by the library of the University of Amsterdam (http://dare.uva.nl)
UvA-DARE (Digital Academic Repository)
Medication safety in pediatric care
Maaskant, J.M.
Link to publication
Citation for published version (APA):Maaskant, J. M. (2016). Medication safety in pediatric care.
General rightsIt is not permitted to download or to forward/distribute the text or part of it without the consent of the author(s) and/or copyright holder(s),other than for strictly personal, individual use, unless the work is under an open content license (like Creative Commons).
Disclaimer/Complaints regulationsIf you believe that digital publication of certain material infringes any of your rights or (privacy) interests, please let the Library know, statingyour reasons. In case of a legitimate complaint, the Library will make the material inaccessible and/or remove it from the website. Please Askthe Library: https://uba.uva.nl/en/contact, or a letter to: Library of the University of Amsterdam, Secretariat, Singel 425, 1012 WP Amsterdam,The Netherlands. You will be contacted as soon as possible.
Download date: 14 Apr 2020
Jolanda Maaskant
Jolanda Maaskant
Medication safety in pediatric care
Uitnodiging voor het bijwonen van de openbare verdediging
van het proefschrift
Medication safety in pediatric care
door Jolanda Maaskant
Vrijdag 23 september 2016om 13:00 uur
Aula van de Universiteit (Oude Lutherse Kerk)
Singel 411 1012 XM Amsterdam
Gelegenheid tot feliciteren na afloop van de promotie.
Jolanda MaaskantLanseloetstraat 41-21055 BC Amsterdam
[email protected] 06 45558002
Paranimfen:Nyncke Bouma
[email protected] 53360619
Frans [email protected]
06 22761561

Medication safety in pediatric care
Jolanda Marianne Maaskant
Medication safety in pediatric care
ISBN: 978-94-6299-402-7
Cover: Maurik StompsLayout: Nikki Vermeulen - Ridderprint BVPrinting: Ridderprint BV - www.ridderprint.nl
© 2016 Jolanda Marianne Maaskant
All rights reserved. No part of this publication may be reproduced or transmitted in any form, by any means, electronic or mechanical, without prior written permission of the author, or where appropriate, of the publisher of the articles.
Medication safety in pediatric care
ACADEMISCH PROEFSCHRIFT
ter verkrijging van de graad van doctoraan de Universiteit van Amsterdamop gezag van de Rector Magnificus
prof. dr. ir. K.I.J. Maexten overstaan van een door het College voor Promoties ingestelde commissie,
in het openbaar te verdedigen in de Aula der Universiteitop vrijdag 23 september 2016, te 13:00 uur
door
Jolanda Marianne Maaskant
geboren te Dordrecht
PROMOTIECOMMISSIE
Promotor Prof. Dr. W.M.C van Aalderen Universiteit van AmsterdamCopromotor Dr. H. Vermeulen Universiteit van Amsterdam
Overige leden Prof. Dr. J.J. de Gier Rijksuniversiteit Groningen Prof. Dr. J.B. van Goudoever Universiteit van Amsterdam Prof. Dr. C. Lucas Universiteit van Amsterdam Prof. Dr. W.J.M. Scholte op Reimer Universiteit van Amsterdam Prof. Dr. D. Tibboel Erasmus Universiteit Rotterdam Prof. Dr. M. de Visser Universiteit van Amsterdam Prof. Dr. C. Wagner Vrije Universiteit
Faculteit der Geneeskunde
CONTENTS
Chapter 1 Introduction. 7
Chapter 2 Preventable errors with non-opioid analgesics and anti-emetic 19 drugs may increase burden in surgical pediatric patients: a cross-sectional study. European Journal of Pediatric Surgery 2014;24:381-388.
Chapter 3 Contributory factors leading to medication errors in 35 pediatric patients: a qualitative study. Submitted.
Chapter 4 High-alert medications for pediatric patients: 57 an international modified Delphi study. Expert Opinion on Drug Safety 2013;12:805-814.
Chapter 5 Interventions for reducing medication errors in children 77 in hospital: a systematic review. Cochrane Database of Systematic Reviews 2015, Issue 3.
Chapter 6 Medication review and feedback by a clinical pharmacist 129 decrease medication errors at the PICU: an interrupted time series analysis. Submitted.
Chapter 7 The trigger tool as a method to measure harmful medication 147 errors in children: a diagnostic accuracy study. Journal of Patient Safety 2015, epub. ahead of print.
Chapter 8 The clinimetric properties of the COMFORT scale: 163 a systematic review. European Journal of Pain 2016, accepted.
Chapter 9 Safety interventions, safety culture and priorities for 197 the future in a pediatric hospital: a 5-year cohort study. Submitted.
Chapter 10 Summary and general discussion. 215
Appendices Nederlandse samenvatting. 229 List of co-authors. 243 PhD portfolio. 249 International publications. 253 Dankwoord. 257

Chapter 1
Introduction

9
Introduction
Chap
ter 1
PATIENT SAFETY
Patient safety has been high on the international agenda since the Institute of Medicine report “To err is human” [1]. The risks for patients described in this report are confirmed in many studies from various countries, that show incidence rates of preventable adverse events ranging from 1% to 9% of all admissions in hospitals [2-7]. Although most of preventable adverse events do not result in patient harm, still 1% to 9% causes significant harm and 1% to 3% contributes to death [3-7]. Since the extent of the safety problem became visible, many countries formed institutes to support and monitor patient safety improvements. Examples are the National Patient Safety Foundation (NPSF) in the Unites States of America, the National Patient Safety Agency (NPSA) in the United Kingdom and the Australian Patient Safety Foundation (APSF). Large scale patient safety initiatives have started, such as the “100,000 Live Campaign” and the “Safer Patient Initiative” [8,9]. Patient safety has become an important issue in the Netherlands as well. Based on an advice report about risk management in Dutch hospitals, a patient safety management system (VMS, Veiligheidsmanagement systeem) has been developed [10]. Since 2007 all Dutch hospitals have started to implement this system [11,12].
MEDICATION SAFETY
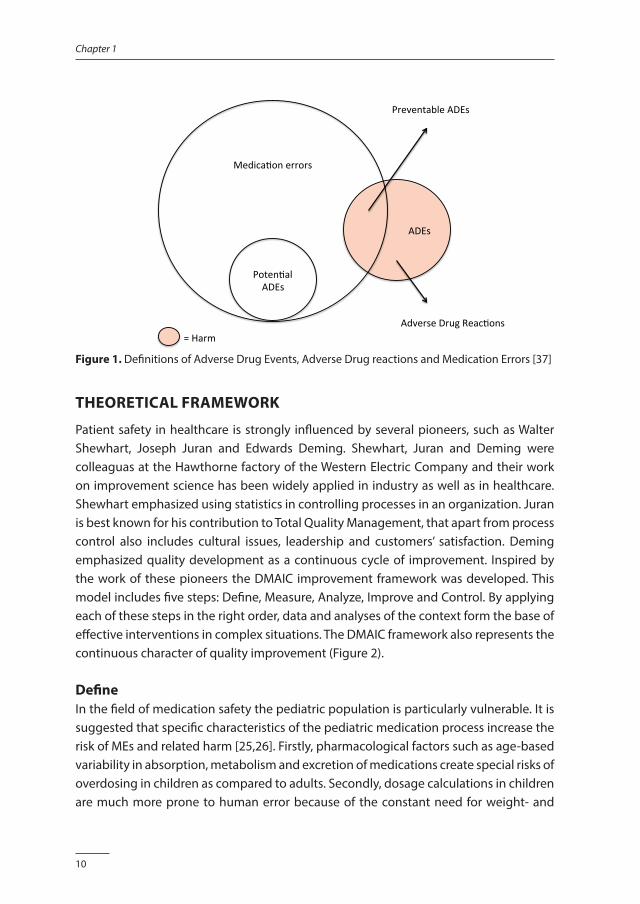
Within the field of patient safety the medication process is identified as a key area of risk. This is based on research that shows that 8% to 27% of the preventable adverse events are related to medication [2,3,6,13]. Patient harm as a result of medication is called an Adverse Drug Event (ADE). ADEs include adverse drug reactions (ADRs) and medication errors (MEs). An ADR is defined as “any response to a drug which is noxious, unintended and which occurs at doses normally used for prophylaxis, diagnosis or therapy of the disease” [14]. A ME is defined as “any preventable event that may cause or lead to inappropriate medication use or patient harm while the medication is in the control of the healthcare professional, patient or consumer” (NCC MERP) [15]. The difference between ADEs, ADRs and MEs is visualized in Figure 1. It is estimated that 30% to 40% of the ADEs that affects hospitalized patients are preventable and must be considered MEs [16-18]. Studies have shown that 3% to 10% of such errors result in significant harm [18-21]. MEs are also associated with outcomes such as additional length of stay, readmissions and increased costs [18,19,21-24].
10
Chapter 1
ADEs
Medica,onerrors
Poten,alADEs
PreventableADEs
AdverseDrugReac,ons=Harm
Figure 1. Definitions of Adverse Drug Events, Adverse Drug reactions and Medication Errors [37]
THEORETICAL FRAMEWORK
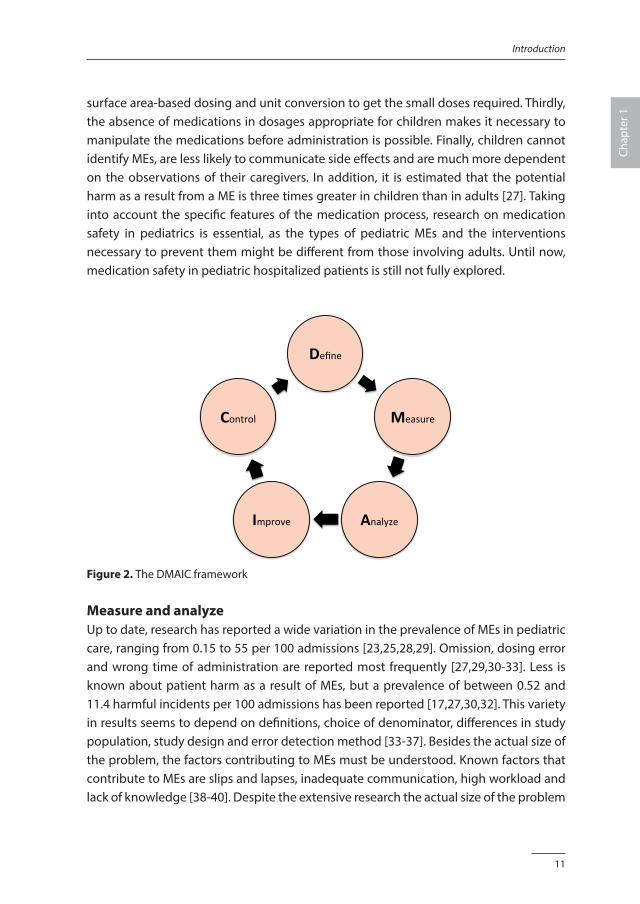
Patient safety in healthcare is strongly influenced by several pioneers, such as Walter Shewhart, Joseph Juran and Edwards Deming. Shewhart, Juran and Deming were colleaguas at the Hawthorne factory of the Western Electric Company and their work on improvement science has been widely applied in industry as well as in healthcare. Shewhart emphasized using statistics in controlling processes in an organization. Juran is best known for his contribution to Total Quality Management, that apart from process control also includes cultural issues, leadership and customers’ satisfaction. Deming emphasized quality development as a continuous cycle of improvement. Inspired by the work of these pioneers the DMAIC improvement framework was developed. This model includes five steps: Define, Measure, Analyze, Improve and Control. By applying each of these steps in the right order, data and analyses of the context form the base of effective interventions in complex situations. The DMAIC framework also represents the continuous character of quality improvement (Figure 2).
DefineIn the field of medication safety the pediatric population is particularly vulnerable. It is suggested that specific characteristics of the pediatric medication process increase the risk of MEs and related harm [25,26]. Firstly, pharmacological factors such as age-based variability in absorption, metabolism and excretion of medications create special risks of overdosing in children as compared to adults. Secondly, dosage calculations in children are much more prone to human error because of the constant need for weight- and
11
Introduction
Chap
ter 1
surface area-based dosing and unit conversion to get the small doses required. Thirdly, the absence of medications in dosages appropriate for children makes it necessary to manipulate the medications before administration is possible. Finally, children cannot identify MEs, are less likely to communicate side effects and are much more dependent on the observations of their caregivers. In addition, it is estimated that the potential harm as a result from a ME is three times greater in children than in adults [27]. Taking into account the specific features of the medication process, research on medication safety in pediatrics is essential, as the types of pediatric MEs and the interventions necessary to prevent them might be different from those involving adults. Until now, medication safety in pediatric hospitalized patients is still not fully explored.
Define
Measure
AnalyzeImprove
Control
Figure 2. The DMAIC framework
Measure and analyzeUp to date, research has reported a wide variation in the prevalence of MEs in pediatric care, ranging from 0.15 to 55 per 100 admissions [23,25,28,29]. Omission, dosing error and wrong time of administration are reported most frequently [27,29,30-33]. Less is known about patient harm as a result of MEs, but a prevalence of between 0.52 and 11.4 harmful incidents per 100 admissions has been reported [17,27,30,32]. This variety in results seems to depend on definitions, choice of denominator, differences in study population, study design and error detection method [33-37]. Besides the actual size of the problem, the factors contributing to MEs must be understood. Known factors that contribute to MEs are slips and lapses, inadequate communication, high workload and lack of knowledge [38-40]. Despite the extensive research the actual size of the problem
12
Chapter 1
stays unclear and an in-depth understanding of the various contributory factors, taking into account the interdisciplinary character of the medication process, is lacking.
ImproveBased on the sense of urgency that was created on medication safety, healthcare professionals have, from their own perspectives, developed and implemented various interventions to improve the medication process. These interventions can be categorized as delivery arrangements and implementation strategies [41]. In the first category, most publications describe the effectiveness of Computerized Physician Order Systems with or without Clinical Decision Support to prevent prescribing errors [42,43]. Furthermore a wide range of interventions in this category are proposed, i.e. storage facilities, dosage calculation sheets and smart pumps technology [44,45]. Implementation strategies include interventions targeted at healthcare professionals, like the supportive tasks of a pharmacist on clinical wards, interdisciplinary teamwork, education and the involvement of families [44-46]. Most interventions are a reaction on incidents or success stories from other hospitals and their effectiveness is disputable as little evidence exists regarding whether these interventions reduce MEs [47,48]. A recent example is Tall Man lettering to prevent “look-alike sound-alike” errors. This technique a widespread implemented despite the incomplete and conflicting evidence [49,50].
ControlAfter an intervention has proven to be effective, an iterative process of evaluation is necessary to achieve evidence of its effectiveness in a specific context [51,52]. Therefore, in the fifth step of the DMAIC cycle, it is crucial to be able to measure medication safety with tools that are valid and reliable. In addition, the measurement tools must be accurate for measuring MEs in the context of the unique pediatric hospital care. However, measuring MEs is difficult and time-consuming and the various methods seem to influence the results [34,36,37]. Also establishing medication-related harm is challenging in children, particularly in the pre-verbal age. For example, suboptimal medication might result in discomfort, that in pre-verbal children can only be established with the help of an observational tool, that must be valid and reliable. Up to date the performance of the existing measurement tools to establish MEs and related patient harm is unclear.
13
Introduction
Chap
ter 1
AIM AND OUTLINE OF THIS THESIS
With the research presented in this thesis, we aimed to contribute to the knowledge, ultimately to improve medication safety and prevent medication related harm in pediatric patients in hospital. Specific objectives were:1. to gain knowledge on the prevalence, nature and impact of medication errors, and
factors that contribute to medication errors;2. to attribute to the existing evidence on interventions to improve medication safety;3. to explore measurement tools to monitor medication safety.
We take the first steps of the DMAIC cyclus in chapter 2 and 3 of this thesis. In chapter 2, we describe a cross-sectional study that explored the prevalence, type and the severity of patient harm due to MEs in an academic pediatric population. In chapter 3 we present a qualitative study that contributes further to an understanding of the contributory factors that may lead to MEs as experienced by the key professionals: doctors, nurses and pharmacists. To move forward to improvements, we conducted three studies to help clinical practice to increase medication safety. The first study describes the development of a list of high-alert medication. Therefore, we conducted an international modified Delphi study and validated the results with reports on medication incidents in children based on national data. Because children are particularly vulnerable to MEs, such a list particularly for children might help to develop focused strategies to prevent harm. This study is described in chapter 4. The second study in the “improvement step” is a systematic review of the existing evidence to determine the effectiveness of interventions to reduce MEs in hospitalized children: chapter 5. Although all hospitalized pediatric patients are vulnerable, children admitted to the Pediatric Intensive Care Unit (PICU) are even more exposed to harm. In that setting, MEs can be fatal, especially when high-alert medications are involved. In chapter 6 we describe the results of an interrupted time series study that examined the effectiveness of a multi-faceted intervention by a clinical pharmacist on a PICU. The fifth step of the DMAIC cycle emphasizes monitoring patient safety with measurement tools that are valid and reliable. It is suggested that a trigger tool may be an effective and time-saving strategy to measure MEs, but its measurement performance is unclear. Therefore, we studied the diagnostic accuracy of an existing pediatric medication-focused trigger tool in detecting harmful MEs. This study is described in chapter 7. It is also important to be able to establish patient harm and discomfort. The COMFORT scale is a well-known measurement tool, that describes distress and pain in children of different ages, with different health conditions and in different clinical contexts. However, formal assessment of the methodological quality of these studies has not been undertaken. Therefore, we performed a systematic review to study the clinimetric properties of the
14
Chapter 1
COMFORT scale: chapter 8. In chapter 9 we describe a longitudinal study in which we investigated whether the safety culture changed during a five years period of active safety management in our pediatric hospital. This thesis closes with a summary of the findings and a general discussion in chapter 10.
15
Introduction
Chap
ter 1
REFERENCES1. Kohn LT, Corrigan JM, Donaldson MS. To err is human; building a safer health system. Washington DC:
National Academy Press, 2000.
2. Baines R, Langelaan M, de Bruijne M, et al. How effective are patient safety initiatives? A retrospective patient review study changes to patient safety over time. BMJ Qual Saf 2015;24:561-571.
3. Baker GR, Norton PG, Flintoft V, et al. The Canadian Adverse Events Study: the incidence of adverse events among hospital patients in Canada. CMAJ 2004;170:1678-1686.
4. Brennan TA, Leape LL, Laird NM, et al. Incidence of adverse events and negligence in hospitalized patients: results of the Harvard Medical Practice Study 1: 1991. Qual Saf Health Care 2004;13:145-151.
5. Davis P, Lay-Yee R, Briant R, et al. Adverse events in New Zealand public hospitals 1: occurence and impact. N Z Med J 2002;115:U271.
6. Soop M, Fryksmark U, Koster M, et al. The incidence of adverse events in Swedish hospitals: a retrospective medical record review study. Int J Qual Health Care 2009;21:285-291.
7. Vincent C, Neale G, Woloshynowyck M. Adverse events in British hospitals: preliminary retrospective record review. BMJ 2001;322:517-519.
8. Benning A, Dixon-Woods M, Nwulu U, et al. Multiple component patient safety intervention in English hospitals: controlled evaluation of second phase. BMJ 2011;342:d199.
9. Berwick DM, Calkins DR, McCannon CJ, et al. The 100,000 lives campain: setting a goal and a deadline for improving health care quality. JAMA 2006;295:324-327.
10. Willems R. Hier werk je veilig of je werkt hier niet. Sneller beter - de veiligheid in de zorg. [Here you work safely, or do not work here. Better faster - safety in health care]. Shell Netherlands, 2004.
11. de Blok C, Koster E, Schilp J, et al. Implementatie VMS Veiligheidsprogramma. Evaluatieonderzoek in Nederlandse Ziekenhuizen. NIVEL/EMGO: Utrecht/Amsterdam. Available: www.nivel.nl, accessed December 2015.
12. Vereniging van Nederlandse Ziekenhuizen (NVZ), Orde van Medisch Specialisten (OMS), Landelijk Expertisecentrum Verpleging en Verzorging (LEVV), Verpleegkundigen en Verzorgende Nederland (VVN), Nederlandse Federatie van Universitair Medische Centra (NFU). Veiligheidsprogramma voorkom schade, werk veilig in de Nederlandse ziekenhuizen [Safety program prevent harm, work safely in Dutch Hospitals]. 2007.
13. Davis P, Lay-Yee R, Briant R, et al. Adverse events in New Zealand public hospitals 2: preventability and clinical context. N Z Med J 2003;116:U624.
14. World Health Organization. Conceptial Framework for the International Classification for Patient Safety, Final Technical Report, version 1.1; Available: www.who.int/patientsafety/implementation/taxonomy/en, accessed December 2015.
15. National Coordinating Council for Medication Error Reporting and Prevention (NCC MERP). Available: www.nccmerp.org, accessed March 2016.
16. von Laue NC, Schwappach DL, Koeck CM. The epidemiology of preventable adverse drug events: a review of the literature. Wien Klin Wochenschr 2003;115:407-415.
17. Kunac DL, Kennedy J, Austin N, et al. Incidence, preventability, and impact of Adverse Drug Events (ADEs) and potential ADEs in hospitalized children in New Zealand: a prospective observational cohort study. Paediatr Drugs 2009;11:153-160.
18. Zegers M, de Bruijne MC, Wagner C, et al. Adverse events and potentially preventable deaths in Dutch hospitals: results of a retrospective patient record review study. Qual Saf Health Care 2009;18:297-302.
19. Kale A, Keohane CA, Maviglia S, et al. Adverse drug events caused by serious medication administration errors. BMJ Qual Saf 2012;21:933-938.
20. Landrigan CP, Parry GJ, Bones CB, et al. Temporal trends in rates of patient harm resulting from medical care. N Engl J Med 2010;363:2124-2134.
16
Chapter 1
21. de Vries EN, Ramrattan MA, Smorenburg SM, et al. The incidence and nature of in-hospital adverse events: a systematic review. Qual Saf Health Care 2008;17:216-223.
22. Choi I, Lee S, Flynn L, et al: Incidence and treatment costs attributable to medication errors in hospitalized patients. Res Social Adm Pharm 2015, August (epub. ahead of print).
23. Lewis, PJ, Dornan T, Taylor D, et al. Prevalence, incidence and nature of prescribing errors in hospital inpatients: a systematic review. Drug Saf 2009;32:379-389.
24. Kongkaew C, Hann M, Mandal J, et al. Risk factors for hospital admissions associated with adverse drug events. Pharmacotherapy 2013;33:827-837.
25. Miller MR, Robinson KA, Lubomski LH, et al. Medication errors in pediatric care: a systematic review of epidemiology and an evaluation of evidence supporting reduction strategy recommendations. Qual Saf Health Care 2007;16:116-126.
26. Wong IC, Wong LY, Cranswick NE. Minimising medication errors in children. Arch Dis Child 2009 94:161-164.
27. Kaushal R, Bates DW, Landrigan C, et al. Medication errors and adverse drug events in pediatric inpatients. JAMA 2001;285:2114-2120.
28. Ghaleb MA, Barber N, Franklin BD, et al. The incidence and nature of prescribing and medication administration errors in pediatric inpatients. Arch Dis Child 2010;95:113-118.
29. Otero P, Leyton A, Mariani G, et al. Medication errors in pediatric inpatients: prevalence and results of a prevention program. Pediatrics 2008;122:e737-e743.
30. Ferranti J, Horvath MM, Cozart H, et al. Re-evaluating the safety profile of pediatrics: a comparison of computerized adverse drug event surveillance and voluntary reporting in the pediatric environment. Pediatrics 2008;121:e1201-e1207.
31. Ghaleb MA, Barber N, Franklin BD, et al. Systematic review of medication errors in pediatric patients. Ann Pharmacother 2006;40:1766-1776.
32. Holdsworth MT, Fichtl RE, Behta M, et al. Incidence and impact of adverse drug events in pediatric inpatients. Arch Pediatr Adolesc Med 2003;157:60-65.
33. Lisby M, Nielsen LP, Brock B, et al. How are medication errors defined? A systematic literature review of definitions and characteristics. Int J Qual Health Care 2010;22:507-518.
34. Franklin BD, Vincent C, Schachter M, et al. The incidence of prescribing errors in hospital inpatients: an overview of the research methods. Drug Saf 2005;28:891-900.
35. Garfield S, Reynolds M, Dermont L, et al. Measuring the severity of prescribing errors: a systematic review. Drug Saf 2013;36:1151-1157.
36. Meyer-Massetti C, Cheng CM, Schwappach DL, et al. Systematic review of medication safety assessment methods. Am J Health Syst Pharm 2011;68:227-240.
37. Morimoto T, Gandhi TK, Seger AC, et al. Adverse drug events and medication errors: detection and classification methods. Qual Saf Health Care 2004;13:306-314.
38. Brady AM, Malone AM, Fleming S. A literature review of the individual and systems factors that contribute to medication errors in nursing practice. J Nurs Manag 2009;17:679-697.
39. Keers RN, Williams SD, Cooke J, et al. Causes of medication administration errors in hospitals: a systematic review of quantitative and qualitative evidence. Drug Saf 2013;36:1045-1067.
40. Tully MP, Ashcroft DM, Dornan T, et al. The causes and factors associated with prescribing errors in hospital patients: a systematic review, Drug Saf 2009;32:819-836.
41. Effective Practice and Organisation of Care (EPOC). EPOC Taxonomy; 2015. Available: https://epoc.cochrane.org/epoc-taxonomy, accessed March 2016.
42. Eslami S, de Keizer NF, Abu-Hanna A. The impact of computerized physician medication order entry in hospitalized patients: a systematic review. Int J Med Inform 2008;77:365-376.
17
Introduction
Chap
ter 1
43. Rosse van F, Maat B, Rademaker CM, et al. The effect of computerized physician order entry on medication prescription errors and clinical outcome in pediatric and intensive care: a systematic review. Pediatrics 2009;123:1184-1190.
44. Buck ML, Hofer KN, McCarthy MW. Improving Paediatrics Medication Safety Part 1: research on medication errors and recommendations from the Joint Commission. Pediatr Pharm 2008;14:1-6.
45. American Academy of Paediatrics. Prevention of medication errors in the paediatric inpatient setting. Pediatrics 2003;112:431-436.
46. Sanghera N, Chan P, Khaki ZF, et al. Interventions of hospital pharmacists in improving drug therapy in children. Drug Saf 2006;29:1031-1047.
47. Shojania KG, Grisham JM. Evidence-based quality improvement: the state of the science. Health Aff (Millwood) 2005;24:138-150.
48. Cass H. Reducing paediatric medication error through quality improvement networks; where evidence meets pragmatism. Arch Dis Child 2016, January (epub. ahead of print).
49. Lambert BL, Schroeder SR, Galanter WL. Does Tall Man lettering prevent drug name confusion errors? Incomplete and conflicting evidence suggest need for definitive study. BMJ Qual Saf 2015, December (epub. ahead of print).
50. Zhong W, Feinstein JA, Patel NS, et al. Tall Man lettering and potential prescription errors: a time series analysis of 42 children’s hospitals in the USA over 9 years. BMJ Qual Saf 2015, November (epub. ahead of print).
51. Craig P, Dieppe P, Macintyre S, et al. Developing and evaluating complex interventions: the new Medical Research Council guidance. Int J Nurs Stud 2013;50:587-592.
52. Shojania KG. Conventional evaluations of improvement interventions more trials or just more tribulations? BMJ Qual Saf 2013;22:881-884.

Chapter 2
Preventable errors with non-opioid analgesics and anti-emetic drugs may increase burden
in surgical pediatric patients: a cross-sectional study
Jolanda MaaskantDiederik Bosman
Petra van Rijn-BikkerWim van AalderenHester Vermeulen
European Journal of Pediatric Surgery 2014;24:381-388.
20
Chapter 2
ABSTRACT
IntroductionMany hospitalized patients are affected by medication errors (MEs) that may cause discomfort, harm and even death. Especially, children are considered to be at high risk of experiencing harm due to MEs. More insight into the prevalence, type and severity of harm caused by MEs could help reduce the frequency of these harmful events. The primary objectives of our study were to establish the prevalence of different types of MEs and the severity of harm caused by MEs in hospitalized children from birth to 18 years of age. In addition, we investigated correlations between harmful MEs and characteristics of the patients, the medication and the medication process. MethodsIn this cross-sectional study, we identified MEs by reviewing clinical records, making direct observations, monitoring pharmacy logs and reviewing voluntary incident reports. Subsequently, the MEs were classified according to type of error, medication group and stage of the medication process. Pediatricians rated the severity of the observed harm. ResultsWe collected data from 426 hospitalized children admitted during August to October 2011. A total of 322 MEs were identified, of which 39 caused patient harm. Harmful events were mainly due to wrong time (41%). Pediatricians rated the observed harm as minor in 77% of the incidents and significant in 23%. None of the harmful MEs resulted in permanent harm or was considered life threatening or fatal. Patients admitted for a surgical procedure were at higher risk for a harmful event compared to patients admitted for nonsurgical reasons (adjusted odds ratio 2.79, 95% CI 1.35-5.80). Non-opioid analgesics and anti-emetic drugs accounted for 67% of the harmful MEs. Harmful MEs occurred most frequently during medication prescription (28%) and administration (62%).
ConclusionSurgical pediatric patients seem to be at high risk for harmful MEs. Although the harm was considered minor in most cases, it still caused discomfort for the patients, and the high prevalence is a source of concern. Interventions to prevent the MEs should focus on the prescription and administration of non-opioid analgesics and anti-emetic drugs.
21
Prevalence, types and harm
Chap
ter 2
INTRODUCTION
Medication errors (MEs) are a major problem in healthcare. Between 6 and 9% of all hospitalized patients are confronted with an adverse event, of which 15% are medication-related [1,2]. In this study the following definition is used: “A medication error is any preventable event that may cause or lead to inappropriate medication use or patient harm while the medication is in the control of the healthcare professional, patient, or consumer. Such events may be related to professional practice, healthcare products, procedures, and systems, including prescribing; order communication; product labeling, packaging, and nomenclature; compounding; dispensing; distribution; administration; education; monitoring; and use” [3]. Although more than half of the MEs cause no harm or minor harm, previous studies found that 3-10% of these errors resulted in permanent disability or contributed to mortality [1,2,4]. It is estimated that 30-40% of harmful events are preventable, underlining the urgency of improved medication procedures [2,5,6]. Previous research has shown a wide variation in reported prevalence of preventable MEs, ranging from 0.15 to 55 per 100 admissions [7-12]. Omission, dosing error and wrong time of administration are reported most frequently [7,10,13-16]. Less is known about harm as a result of MEs, but a prevalence between 0.52 and 11.4 harmful incidents per 100 admissions has been reported [5,14-16]. Children are at especially high risk of harm due to MEs because such errors are potentially much more hazardous to them than to adults [15,17]. Previous interventions to prevent MEs have led to only limited improvements. However, if we are able to identify situations in the medication process with a high probability of causing harm, then more effective strategies could be developed and patient harm could be prevented. Given the above background, we addressed the following research questions: (a) what is the prevalence of various types of MEs, (b) what is the severity of harm due to MEs in hospitalized children from birth to 18 years of age and (c) do harmful MEs correlate with patient characteristics, type of medication and medication process?
METHODS
Setting and sampleThe study took place at Emma Children’s Hospital, which is part of the Academic Medical Center and is affiliated with the University of Amsterdam, the Netherlands. Emma Children’s Hospital has 130 beds and provides both regular and highly-specialized intramural medical care to children from birth to 18 years of age. We conducted our study on three general pediatric wards, a surgical ward and an oncology ward. Patients who were admitted to one of these wards with at least one medication prescription were eligible. We excluded patients with a hospital admission shorter than 24 hours.
22
Chapter 2
The Institutional Review Board of the Academic Medical Center in Amsterdam decided that ethical approval of this study was not required according to the Dutch Medical Ethics Law.
DesignIn this cross-sectional study, we retrospectively collected data of patients admitted during August to October 2011. We estimated our sample size based on the results of Kunac et al. [5]. Assuming a prevalence of harmful MEs of 7.3 with a 95% confidence interval of 2.5 on both sides, we required a sample of 415 patients.
Prevalence and type of MEs To establish the prevalence of different types of MEs, we used four different methods. Firstly, the clinical records of discharged patients were reviewed for MEs by one of the investigators. To ensure an unbiased sample, patients were chosen randomly. Patient characteristics and evidence of MEs were extracted from the medical and nursing progress notes, medication orders and discharge summaries. Secondly, we made direct observations at the wards once per week for 12 consecutive weeks. The specific days and wards were chosen randomly. The observations were disguised: nurses were aware of the study, but did not know its actual purpose. Thirdly, all pharmacy logs were reviewed for any irregularities or alerts in prescriptions. When a ME was suspected, the medical and nursing records were reviewed. Fourthly, the voluntary incident reporting system was reviewed for MEs reported during the study period. All incident reports that involved MEs were analyzed, and the medical and nursing files were reviewed for additional information or clarification where necessary. We used a structured data collection form to collect the data on patient characteristics, types of MEs and patient harm, based on the definitions and categories described by the National Coordinating Council for Medication Error Reporting and Prevention (NCC MERP, see Appendix). The prevalence of harmful MEs was defined as the number of harmful MEs divided by the total number of patients included in the study and multiplied by 100.
Severity of harm To determine the severity of the identified MEs, we presented two pediatricians with clinical scenarios, including short descriptions of the MEs, the age of the patients, the diagnoses and medications involved. We asked them to classify the MEs according to the predefined NCC MERP categories (see Appendix).
23
Prevalence, types and harm
Chap
ter 2
ReliabilityData from a random sample of 25% of the clinical records were collected by two reviewers independently, and interobserver reliability was calculated on the number of MEs identified. In addition, the severity of the harmful MEs was classified by two pediatricians independently, and the interobserver reliability of the classification was determined.
AnalysisDescriptive statistics were used to summarize patient demographics. If normally distributed, continuous values were expressed as mean and standard deviation (SD); otherwise median and interquartile range (IQR) were used. Logistic regression analysis, Chi2 or Fisher’s exact test were conducted to explore associations. Statistical uncertainty was expressed by 95% confidence interval (95% CI) and the level of significance used was 0.05. Reliability was calculated by Cohen’s Kappa. All analyses were performed using SPSS software (PASW statistics version 18.0, IBM, Armonk, NY, USA).
RESULTS
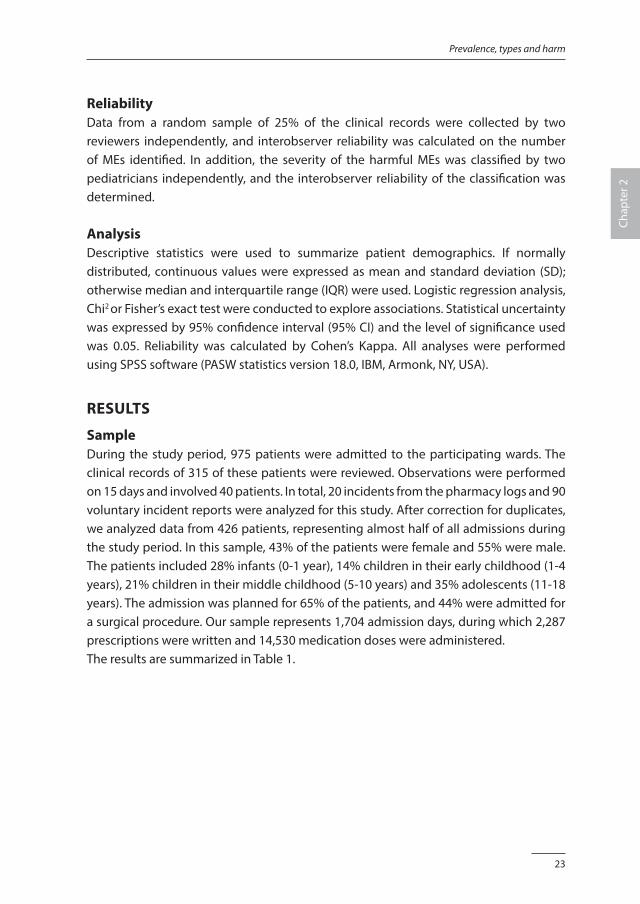
SampleDuring the study period, 975 patients were admitted to the participating wards. The clinical records of 315 of these patients were reviewed. Observations were performed on 15 days and involved 40 patients. In total, 20 incidents from the pharmacy logs and 90 voluntary incident reports were analyzed for this study. After correction for duplicates, we analyzed data from 426 patients, representing almost half of all admissions during the study period. In this sample, 43% of the patients were female and 55% were male. The patients included 28% infants (0-1 year), 14% children in their early childhood (1-4 years), 21% children in their middle childhood (5-10 years) and 35% adolescents (11-18 years). The admission was planned for 65% of the patients, and 44% were admitted for a surgical procedure. Our sample represents 1,704 admission days, during which 2,287 prescriptions were written and 14,530 medication doses were administered. The results are summarized in Table 1.
24
Chapter 2
Table 1. Patients’ characteristics
Sample, n = 426 Total group, n = 975 p value
n % n %
Gender 0.968a
male 239 56 547 56
Age category 0.004a,c
infancy (0-1 yrs.) 122 29 198 20
early childhood (1-4 yrs.) 62 15 180 18
middle childhood (5-10 yrs.) 90 21 228 23
adolescence (11-18 yrs.) 152 36 369 38
Specialism 0.139a
oncology 101 24 223 23
pediatrics 80 19 197 20
surgery 62 15 179 18
orthopedics 40 9 67 7
ear, nose and throat 36 8 58 6
other 107 25 251 26
Surgery 0.265a
yes 187 44 395 41
Planned admission 0.054a
yes 277 65 584 60
Length of stay 0.000b,c
median (IQR) 4.0 (5) 3.0 (4)
a Pearson Chi-square test, b Mann-Whitney U test, c statistically significant.ME: Medication Error, CI: Confidence Interval
Prevalence and types of MEs In the records for 236 patients we found at least one ME (55%, 95% CI 51-60). A total of 322 MEs were identified, of which 39 had caused patient harm. In total 37 patients were affected by these harmful MEs (9%, 95% CI 6-11), and 2 patients experienced 2 harmful events. Harmful MEs occurred at a rate of 9.2 per 100 patients, 2.3 per 100 admission days, 1.7 per 100 prescriptions and 0.3 per 100 doses administered. The results are summarized in Table 2. Harmful events were mainly due to overdosing (8%), underdosing (5%) and omissions (10%) at the prescription stage. During medication administration, wrong time (41%) and omissions (15%) were the most common types of harmful.

25
Prevalence, types and harm
Chap
ter 2
Table 2. Prevalence of medication errors
ME per 100Total
no. of MEs 95% CI Potentially harmful MEs 95% CI Harmful
MEs 95% CI
n = 322 n = 283 n = 39
patients 75.6 71.5-79.7 66.4 61.9-70.9 9.2 6.6-12.3
admission days 18.9 17.0-20.8 16.6 14.8-18.4 2.3 1.6-3.1
prescriptions 14.1 12.7-15.5 12.4 11.0-13.7 1.7 1.2-2.3
doses administered 2.2 2.0-2.5 2.0 1.7-2.2 0.3 0.2-0.4
ME: Medication Error, CI: Confidence Interval
Severity of harmPediatricians classified the observed harm as minor (category E) in 77% (30 of 39) of the MEs and significant (category F) in 23% (9 of 39). None of the observed harmful MEs resulted in permanent harm or was considered life threatening or fatal.
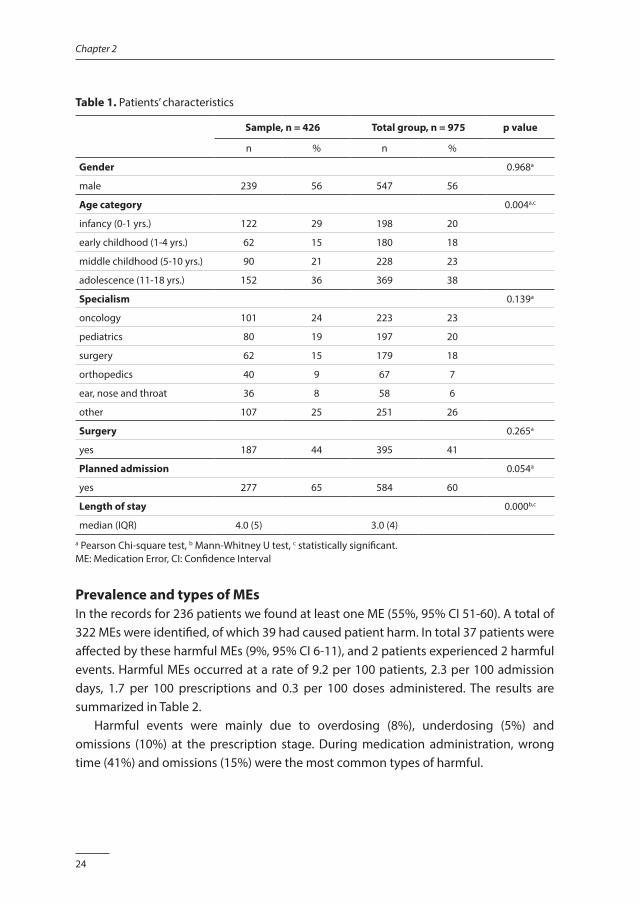
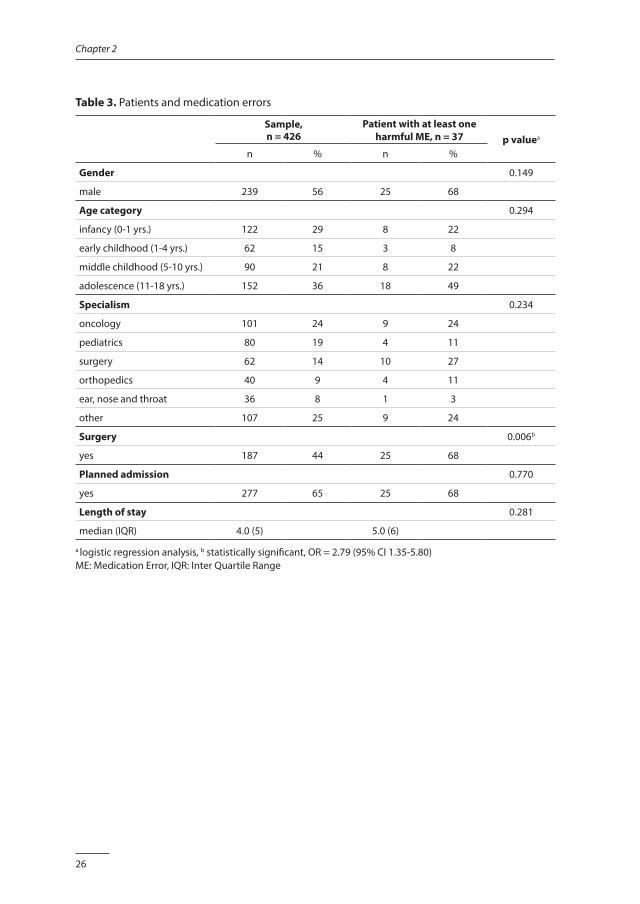
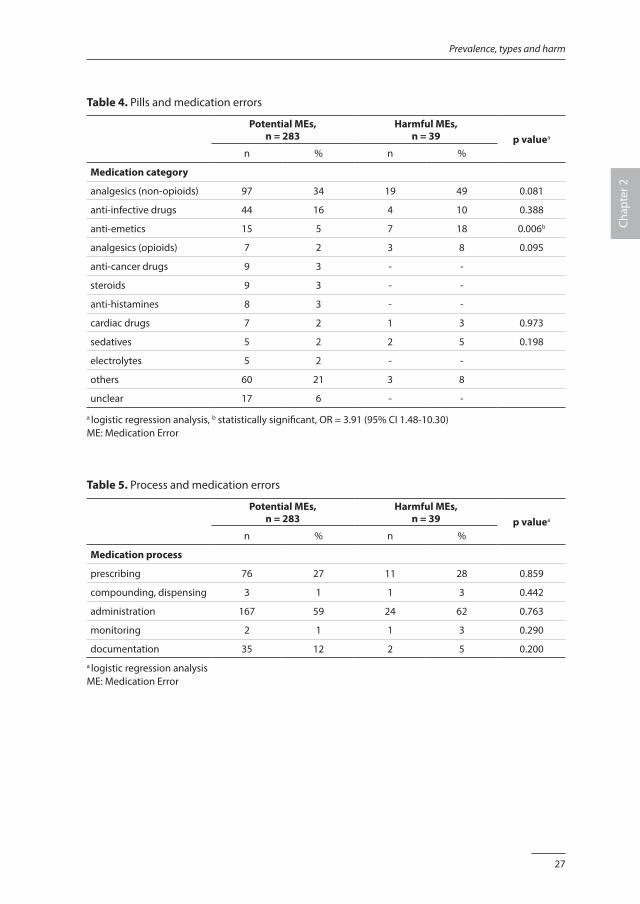
Associations between patients at risk, medication and processesPatients admitted for a surgical procedure were at higher risk for a harmful ME, compared to patients admitted for nonsurgical reasons. After correction for baseline imbalances, surgical patients were significantly associated with harmful MEs: adjusted odds ratio (OR) 2.79, 95% CI 1.35-5.80, p value 0.006. Non-opioid analgesics were most frequently associated with MEs (36%, 116 of 322), followed by anti-infective medications (15%, 48 of 322). Non-opioid analgesics also accounted for most harmful MEs (49%, 19 of 39), followed by anti-emetic drugs (18%, 7 of 39). Medication exposure resulting in a potential ME or harmful ME was similar among the medication categories, except for anti-emetic drugs, that resulted in more frequent harm: OR 3.91, 95% CI 1.48-10.30, p value 0.006. MEs occurred most frequently during medication administration (59%, 191 of 322) and prescription (33%, 87 of 322). Similar results were found for harmful MEs during medication administration (62%, 24 of 39) and prescription (28%, 11 of 39). The results are summarized in Tables 3, 4 and 5.
Reliability The overall agreement rate for the data collection was 62% for the clinical records and 66% for the classification of harm. The weighted Kappa for data collection was 0.56, which indicates a moderate level of agreement. The weighted Kappa for classification harm was 0.64, which is a good level of agreement.
26
Chapter 2
Table 3. Patients and medication errors
Sample, n = 426
Patient with at least one harmful ME, n = 37 p valuea
n % n %
Gender 0.149
male 239 56 25 68
Age category 0.294
infancy (0-1 yrs.) 122 29 8 22
early childhood (1-4 yrs.) 62 15 3 8
middle childhood (5-10 yrs.) 90 21 8 22
adolescence (11-18 yrs.) 152 36 18 49
Specialism 0.234
oncology 101 24 9 24
pediatrics 80 19 4 11
surgery 62 14 10 27
orthopedics 40 9 4 11
ear, nose and throat 36 8 1 3
other 107 25 9 24
Surgery 0.006b
yes 187 44 25 68
Planned admission 0.770
yes 277 65 25 68
Length of stay 0.281
median (IQR) 4.0 (5) 5.0 (6)
a logistic regression analysis, b statistically significant, OR = 2.79 (95% CI 1.35-5.80) ME: Medication Error, IQR: Inter Quartile Range
27
Prevalence, types and harm
Chap
ter 2
Table 4. Pills and medication errors
Potential MEs, n = 283
Harmful MEs, n = 39 p valuea
n % n %
Medication category
analgesics (non-opioids) 97 34 19 49 0.081
anti-infective drugs 44 16 4 10 0.388
anti-emetics 15 5 7 18 0.006b
analgesics (opioids) 7 2 3 8 0.095
anti-cancer drugs 9 3 - -
steroids 9 3 - -
anti-histamines 8 3 - -
cardiac drugs 7 2 1 3 0.973
sedatives 5 2 2 5 0.198
electrolytes 5 2 - -
others 60 21 3 8
unclear 17 6 - -
a logistic regression analysis, b statistically significant, OR = 3.91 (95% CI 1.48-10.30) ME: Medication Error
Table 5. Process and medication errors
Potential MEs, n = 283
Harmful MEs, n = 39 p valuea
n % n %
Medication process
prescribing 76 27 11 28 0.859
compounding, dispensing 3 1 1 3 0.442
administration 167 59 24 62 0.763
monitoring 2 1 1 3 0.290
documentation 35 12 2 5 0.200a logistic regression analysisME: Medication Error
28
Chapter 2
DISCUSSION
The results of our study indicate a high prevalence of harmful MEs, mainly resulting from omissions, dosing errors and wrong time of administration. Most of the harm to patients was minor. We found a positive correlation between patients after surgery and harmful MEs. Non-opioid analgesics and anti-emetic drugs are responsible for most harmful MEs, while prescription and administration are the most error-prone stages in the medication process.
Prevalence and types of MEsThe prevalence of harmful MEs in our study is higher compared to previous publications. Although the previously reported prevalence varies considerably, ranging from 0.15 to 55 MEs per 100 admissions, this is far lower than the 75.6 MEs per 100 admissions that we found [7-9,12]. Also, the rate of harmful MEs per 100 patients that we found is higher than the number reported previously [14-16], with the exception of Kunac et al. [5]. This deviation from previous studies might be explained by the different definitions used [18]. In our study, MEs that caused patient harm, even if it was minor, were classified as harmful. These broad definitions might have increased our prevalence rates. Also, the multiple methods we used to detect MEs might have influenced our results [19,20]. In our study, omissions, dosing errors and wrong time of administration are the most frequent types of error. Omissions and dosing errors during both prescription and administration have been previously reported [7,12,14-16]. Also, wrong time of administration was identified as a high-prevalence ME in previous studies [7,10,15,21]. However, the time of administration and its classification as a ME is subject to debate. Especially in pediatric care, the decision on medication time is based not only on the optimal effect of the medication, but also on the meal times and sleep schedules of the children. We defined a deviation in administration time of more than one hour from the prescribed time as a ME in our study, but this might still indicate good quality care if the specific situation of the child is considered. In most cases we could not determine the consequences of a ME for individual patients. For example, wrong time of an anti-infective medication never resulted in an infection or fever, but it might have decreased the therapeutic effect and induced bacterial resistance. These MEs were classified as potentially harmful. Signs and symptoms like pain and nausea were much more obvious as direct consequences of a suboptimal medication process, and were classified as harmful events.
29
Prevalence, types and harm
Chap
ter 2
High-risk patients Our finding that surgical patients are significantly more prone to harmful MEs was reported in one previous study [5]. Significant more harmful MEs in infants (<1 year) and in children admitted to an oncology ward are described, but our study does not confirm these findings [10,22]. Moreover, our study does not indicate a positive association between the length of stay and MEs, as reported by Holdsworth et al. [14]. These differences might be explained by the differences in samples. For example, we excluded infants admitted to the neonatology intensive care unit, a population that is more prone to harmful MEs due to weights and conditions that change rapidly [23].
High-risk medicationsOpioids, antibiotics and sedatives were reported as causing harmful MEs in several studies [14,15,24]. Also, steroids, cardiac drugs, anti-cancer drugs and electrolytes have been associated with harmful MEs [14,24]. The association that we found between patient harm and non-opioid analgesics and anti-emetic drugs has not been reported previously. Again, this difference in outcome might be explained by differences in the definitions and classification that were used.
High-risk processesOur finding that most MEs and harmful MEs occur most often during medication prescription and administration is supported by previous research [8,10,11,15,24].
LimitationsWe did not review the clinical records of all patients admitted to the participating wards during the study period, but took a sample. To prevent selection bias, clinical records as well as the observation days and wards were chosen randomly. However, our sample did not represent the age categories accurately, with relatively more infants in our sample compared to the total admitted group. Also, the length of stay of the patients in our sample was shorter than the average length of stay of all admissions during the study period. Our finding that age and length of stay are not risk factors for MEs must therefore be interpreted with caution. Despite our multi-faceted approach to data collection, we might have failed to detect all MEs. For example, the direct observations in this study were limited to day shifts, while more MEs have been reported during evening and night shifts [21,25]. In addition, we did not attempt to detect inappropriate drug choice or deviation in dosages as a result of the unavailability of pediatric formularies. This might have resulted in an underestimation of the prevalence of MEs in our study.
30
Chapter 2
During the observations, the nurses were aware of the study but did not know its true purpose. Although a Hawthorne effect does not seem to affect results significantly, we cannot rule out an effect on our findings [26]. The scope of the study was limited to general pediatric wards, excluding the intensive care unit, neonatology intensive care unit and daycare. Therefore, the results of our study cannot be generalized to all pediatric wards. In addition, we studied MEs at only one university hospital, which limits the extrapolation of our results.
Applications and suggestions for future researchSeveral studies have demonstrated a reduction in MEs after the introduction of a computerized physician order entry system (CPOE) and computerized clinical decision support [27-29]. The use of barcode technology in the medication administration process looks promising [30]. Based on the results of our study, these interventions should concentrate on non-opioid analgesics and anti-emetics. Prevention strategies such as double checking, education programs, the use of a unit dose dispensing system, dedicated nurses and the involvement of parents could possibly reduce MEs, but robust evidence is limited [8,23,31,32]. Future research should focus on the effectiveness of these interventions on patient-relevant outcomes like pain and nausea.
CONCLUSION
Surgical pediatric patients seem to be at high risk for harmful MEs. Although in most cases the harm is minor, it still results in discomfort for the patients, and its high prevalence is a source of concern. Interventions to prevent the MEs should focus on the prescription and administration of non-opioid analgesics and anti-emetic drugs.
FundingNeither this research project nor the authors received any grant from any agency in the public, commercial or not-for-profit sector.
31
Prevalence, types and harm
Chap
ter 2
REFERENCES1. de Vries EN, Ramrattan MA, Smorenburg SM, et al. The incidence and nature of in-hospital adverse events:
a systematic review. Qual Saf Health Care 2008;17:216-223.
2. Zegers M, de Bruijne MC, Wagner C, et al. Adverse events and potentially preventable deaths in Dutch hospitals: results of a retrospective patient record review study. Qual Saf Health Care 2009;18:297-302.
3. National Coordinating Council for Medication Error Reporting and Prevention (NCC MERP). Available: www.nccmerp.org, accessed May 2012.
4. Kale A, Keohane CA, Maviglia S, et al. Adverse drug events caused by serious medication administration. BMJ Qual Saf 2012;21:933-938.
5. Kunac DL, Kennedy J, Austin N, et al. Incidence, preventability, and impact of Adverse Drug Events (ADEs) and potential ADEs in hospitalized children in New Zealand: a prospective observational cohort study. Paediatr Drugs 2009;11:153-160.
6. von Laue NC, Schwappach DL, Koeck CM. The epidemiology of preventable adverse drug events: a review of the literature. Wien Klin Wochenschr 2003;115:407-415.
7. Ghaleb MA, Barber N, Franklin BD, et al. Systematic review of medication errors in pediatric patients. Ann Pharmacother 2006;40:1766-1776.
8. Miller MR, Robinson KA, Lubomski LH, et al. Medication errors in paediatric care: a systematic review of epidemiology and an evaluation of evidence supporting reduction strategy recommendations. Qual Saf Health Care 2007;16:116-126.
9. Lewis PJ, Dornan T, Taylor D, et al. Prevalence, incidence and nature of prescribing errors in hospital inpatients: a systematic review. Drug Saf 2009;32:379-389.
10. Otero P, Leyton A, Mariani G, et al. Medication errors in pediatric inpatients: prevalence and results of a prevention program. Pediatrics 2008;122:e737-e743.
11. Ghaleb MA, Barber N, Franklin BD, et al. The incidence and nature of prescribing and medication administration errors in paediatric inpatients. Arch Dis Child 2010;95:113-118.
12. Rashed AN, Neubert A, Tomlin S, et al. Epidemiology and potential associated risk factors of drug-related problems in hospitalised children in the United Kingdom and Saudi Arabia. Eur J Clin Pharmacol 2012;68:1657-1666.
13. Lisby M, Nielsen LP, Brock B, et al. How should medication errors be defined? Development and test of a definition. Scand J Public Health 2012;40:203-210.
14. Holdsworth MT, Fichtl RE, Behta M, et al. Incidence and impact of adverse drug events in pediatric inpatients. Arch Pediatr Adolesc Med 2003;157:60-65.
15. Kaushal R, Bates DW, Landrigan C, et al. Medication errors and adverse drug events in pediatric inpatients. JAMA 2001;285:2114-2120.
16. Ferranti J, Horvath MM, Cozart H, et al. Reevaluating the safety profile of pediatrics: a comparison of computerized adverse drug event surveillance and voluntary reporting in the pediatric environment. Pediatrics 2008;121:e1201-e1207.
17. Cowley E, Roger R, Cousins D. Medication errors in children: a descriptive summary of medication error reports submitted to the United States Pharmacopeia. Current Therapeutic Research 2001;62:627-640.
18. Lisby M, Nielsen LP, Brock B, et al. How are medication errors defined? A systematic literature review of definitions and characteristics. Int J Qual Health Care 2010;22:507-518.
19. Meyer-Massetti C, Cheng CM, Schwappach DL, et al. Systematic review of medication safety assessment methods. Am J Health Syst Pharm 2011;68:227-240.
20. Morimoto T, Gandhi TK, Seger AC, et al. Adverse drug events and medication errors: detection and classification methods. Qual Saf Health Care 2004;13:306-314.
21. Kozer E, Scolnik D, Macpherson A, et al. Variables associated with medication errors in pediatric emergency medicine. Pediatrics 2002;110:737-742.
32
Chapter 2
22. Chua SS, Chua HM, Omar A. Drug administration errors in paediatric wards: a direct observation approach. Eur J Pediatr 2010;169:603-611.
23. Chedoe I, Molendijk HA, Dittrich ST, et al. Incidence and nature of medication errors in neonatal intensive care with strategies to improve safety: a review of the current literature. Drug Saf 2007;30:503-513.
24. Wong IC, Ghaleb MA, Franklin BD, et al. Incidence and nature of dosing errors in paediatric medications: a systematic review. Drug Saf 2004;27:661-670.
25. Miller AD, Piro CC, Rudisill CN, et al. Nighttime and weekend medication error rates in an inpatient pediatric population. Ann Pharmacother 2010;44:1739-1746.
26. Dean B, Barber N. Validity and reliability of observational methods for studying medication administration errors. Am J Health Syst Pharm 2001;58:54-59.
27. Kaushal R, Shojania KG, Bates DW. Effects of computerized physician order entry and clinical decision support systems on medication safety: a systematic review. Arch Intern Med 2003;163:1409-1416.
28. Eslami S, de Keizer NF, Abu-Hanna A. The impact of computerized physician medication order entry in hospitalized patients-a systematic review. Int J Med Inform 2008;77:365-376.
29. Durieux P, Trinquart L, Colombet I, et al. Computerized advice on drug dosage to improve prescribing practice. Cochrane Database Syst Rev 2008, Issue 3. Art. No.: CD002894. DOI: 10.1002/14651858.CD002894.pub2.
30. Poon EG, Keohane CA, Yoon CS, et al. Effect of bar-code technology on the safety of medication administration. N Engl J Med 2010;362:1698-1707.
31. Conroy S, Sweis D, Planner C, et al. Interventions to reduce dosing errors in children: a systematic review of the literature. Drug Saf 2007;30:1111-1125.
32. Alsulami Z, Conroy S, Choonara I. Double checking the administration of medicines: what is the evidence? A systematic review. Arch Dis Child 2012;97:833-837.
33
Prevalence, types and harm
Chap
ter 2
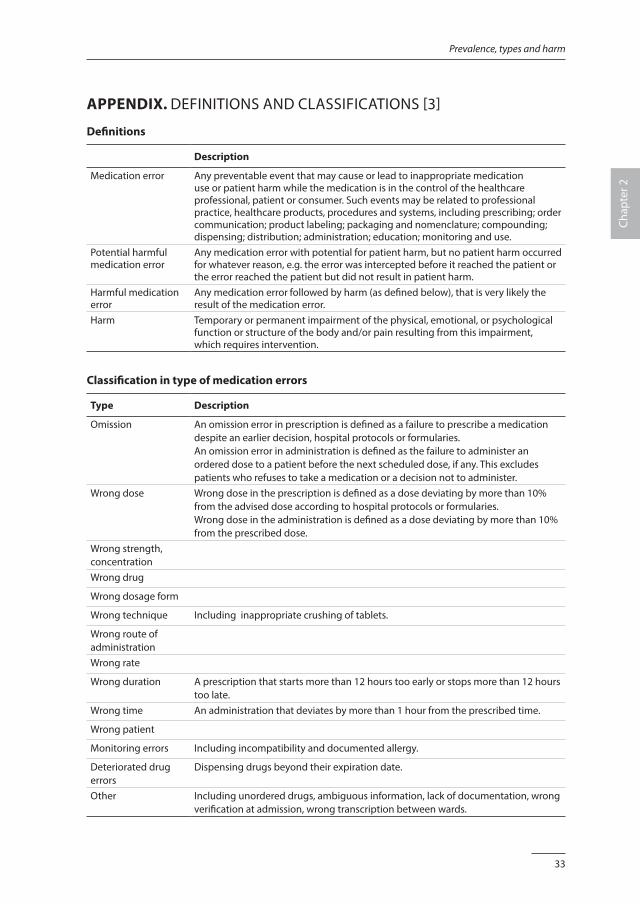
APPENDIX. DEFINITIONS AND CLASSIFICATIONS [3]
Definitions
Description
Medication error Any preventable event that may cause or lead to inappropriate medication use or patient harm while the medication is in the control of the healthcare professional, patient or consumer. Such events may be related to professional practice, healthcare products, procedures and systems, including prescribing; order communication; product labeling; packaging and nomenclature; compounding; dispensing; distribution; administration; education; monitoring and use.
Potential harmful medication error
Any medication error with potential for patient harm, but no patient harm occurred for whatever reason, e.g. the error was intercepted before it reached the patient or the error reached the patient but did not result in patient harm.
Harmful medication error
Any medication error followed by harm (as defined below), that is very likely the result of the medication error.
Harm Temporary or permanent impairment of the physical, emotional, or psychological function or structure of the body and/or pain resulting from this impairment, which requires intervention.
Classification in type of medication errors
Type Description
Omission An omission error in prescription is defined as a failure to prescribe a medication despite an earlier decision, hospital protocols or formularies. An omission error in administration is defined as the failure to administer an ordered dose to a patient before the next scheduled dose, if any. This excludes patients who refuses to take a medication or a decision not to administer.
Wrong dose Wrong dose in the prescription is defined as a dose deviating by more than 10% from the advised dose according to hospital protocols or formularies. Wrong dose in the administration is defined as a dose deviating by more than 10% from the prescribed dose.
Wrong strength, concentrationWrong drug
Wrong dosage form
Wrong technique Including inappropriate crushing of tablets.
Wrong route of administrationWrong rate
Wrong duration A prescription that starts more than 12 hours too early or stops more than 12 hours too late.
Wrong time An administration that deviates by more than 1 hour from the prescribed time.
Wrong patient
Monitoring errors Including incompatibility and documented allergy.
Deteriorated drug errors
Dispensing drugs beyond their expiration date.
Other Including unordered drugs, ambiguous information, lack of documentation, wrong verification at admission, wrong transcription between wards.
34
Chapter 2
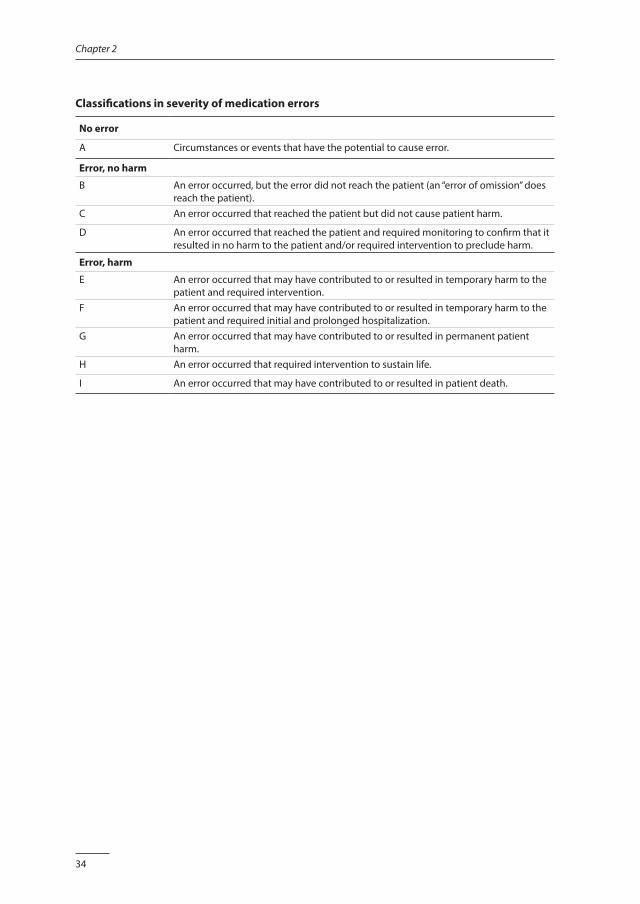
Classifications in severity of medication errors
No error
A Circumstances or events that have the potential to cause error.
Error, no harm
B An error occurred, but the error did not reach the patient (an “error of omission” does reach the patient).
C An error occurred that reached the patient but did not cause patient harm.
D An error occurred that reached the patient and required monitoring to confirm that it resulted in no harm to the patient and/or required intervention to preclude harm.
Error, harm
E An error occurred that may have contributed to or resulted in temporary harm to the patient and required intervention.
F An error occurred that may have contributed to or resulted in temporary harm to the patient and required initial and prolonged hospitalization.
G An error occurred that may have contributed to or resulted in permanent patient harm.
H An error occurred that required intervention to sustain life.
I An error occurred that may have contributed to or resulted in patient death.
Chapter 3
Contributory factors leading to medication errors in pediatric patients:
a qualitative study
Jolanda MaaskantCatharina van Oostveen
Marian SmeulersPetra van Rijn-Bikker
Hester Vermeulen
Submitted.
36
Chapter 3
ABSTRACT
IntroductionKeeping patients safe is a priority for hospitals worldwide and the medication process has been identified as a key area of risk. Despite a growing knowledge on medication safety, effective interventions to prevent medication errors are still limited. To move forward in the field of medication safety, we conducted a qualitative study with the aim to explore the contributory factors that may lead to medication errors as experienced by doctors, nurses and pharmacists, in an academic pediatric hospital.
MethodsWe collected our data from focus group discussions. These discussions were coded by three researchers, who therefore read the transcripts independently in an iterative way, keeping the research question in mind. After completing the initial coding, the researchers sorted the emerged codes into similar contextual categories. Finally, the categories were developed further into interpretative main themes.
ResultsFour main themes emerged: “lack of coherent teamwork”, “suboptimal working process”, “inability to work safely” and “culture”. Culture appeared to be a central element, linking the three themes. Especially organisational issues were considered to contribute to unsafe patient care. The participants expressed feelings of frustration, confusion and uncertainty, but also resignation was present.
ConclusionOur results highlight the need for interventions on organizational level. Essential is creating an organizational culture that gives priority to medication safety and is supported by leadership as well as by the healthcare professionals.
37
Contributory factors
Chap
ter 3
INTRODUCTION
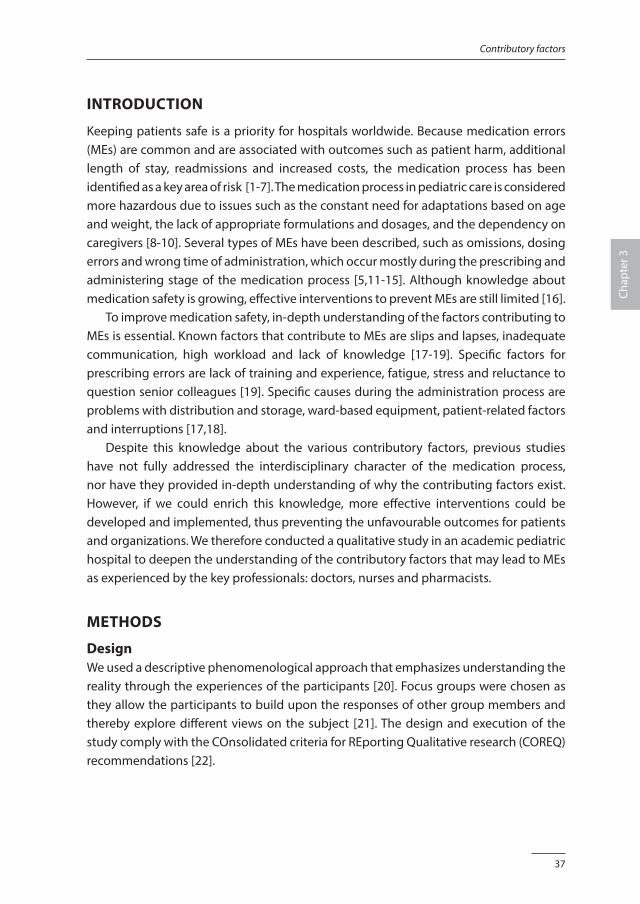
Keeping patients safe is a priority for hospitals worldwide. Because medication errors (MEs) are common and are associated with outcomes such as patient harm, additional length of stay, readmissions and increased costs, the medication process has been identified as a key area of risk [1-7]. The medication process in pediatric care is considered more hazardous due to issues such as the constant need for adaptations based on age and weight, the lack of appropriate formulations and dosages, and the dependency on caregivers [8-10]. Several types of MEs have been described, such as omissions, dosing errors and wrong time of administration, which occur mostly during the prescribing and administering stage of the medication process [5,11-15]. Although knowledge about medication safety is growing, effective interventions to prevent MEs are still limited [16]. To improve medication safety, in-depth understanding of the factors contributing to MEs is essential. Known factors that contribute to MEs are slips and lapses, inadequate communication, high workload and lack of knowledge [17-19]. Specific factors for prescribing errors are lack of training and experience, fatigue, stress and reluctance to question senior colleagues [19]. Specific causes during the administration process are problems with distribution and storage, ward-based equipment, patient-related factors and interruptions [17,18]. Despite this knowledge about the various contributory factors, previous studies have not fully addressed the interdisciplinary character of the medication process, nor have they provided in-depth understanding of why the contributing factors exist. However, if we could enrich this knowledge, more effective interventions could be developed and implemented, thus preventing the unfavourable outcomes for patients and organizations. We therefore conducted a qualitative study in an academic pediatric hospital to deepen the understanding of the contributory factors that may lead to MEs as experienced by the key professionals: doctors, nurses and pharmacists.
METHODS
DesignWe used a descriptive phenomenological approach that emphasizes understanding the reality through the experiences of the participants [20]. Focus groups were chosen as they allow the participants to build upon the responses of other group members and thereby explore different views on the subject [21]. The design and execution of the study comply with the COnsolidated criteria for REporting Qualitative research (COREQ) recommendations [22].
38
Chapter 3
SettingThe study took place at Emma Children’s Hospital, which is part of the Academic Medical Center and affiliated with the University of Amsterdam. In this pediatric hospital, children from birth to the age of 18 years are treated on three general pediatric wards, an oncology ward, a pediatric intensive care unit (PICU) and a neonatology intensive care unit (NICU). On these wards, all medication is prescribed in computerized physician order entry systems (CPOE). The CPOE used on the non-intensive care wards is called Medicator, while Patient Data Management System (PDMS) is used on the intensive care units. The nurse transfers a copy of the prescription to a patient’s medication chart and signs this chart after each administration. It is standard practice to double-check all intravenous medications and a limited group of high-risk medications. Frequently used medications are stored in a locked area on each ward, from which medications are administered to the patients. The hospital formulary is available online. A pharmacist checks the prescriptions for children on a daily basis, and the pediatrician is contacted in case of irregularities or questions about dose or deviating matters. Pharmacists are available for advice, but do not participate in ward rounds. When a ME occurs, it is reported in a computerized incident reporting system with the option to report anonymously. Ward-based safety teams, which consist of pediatricians and nurses, are responsible for systematically collecting and reviewing these incidents. They report the findings to the ward leaders. All healthcare professionals are strongly encouraged to report incidents and they are assured that the purpose of incident reporting is not to assign blame, but to ultimately prevent unsafe situations. The leaders of the hospital and wards are healthcare professionals, representing a strategy known as “professional in the lead”, which aims to connect the worlds of healthcare professionals and managers. Since 2012, the Academic Medical Center is held by the Joint Commission International accreditation certificate.
Personal characteristics of the researchersTwo researchers performed the data collection (JM and HV). Both researchers are registered nurses and clinical epidemiologists, with a longstanding experience in tertiary healthcare. The participants were aware that this study was part of the PhD research of the first author. The researchers had no formal hierarchical relationship with the participants that may inhibit frank discussion. The coding was supported by a registered nurse and physiotherapist, both with academic degrees and experience in qualitative research (CvO and MS).
39
Contributory factors
Chap
ter 3
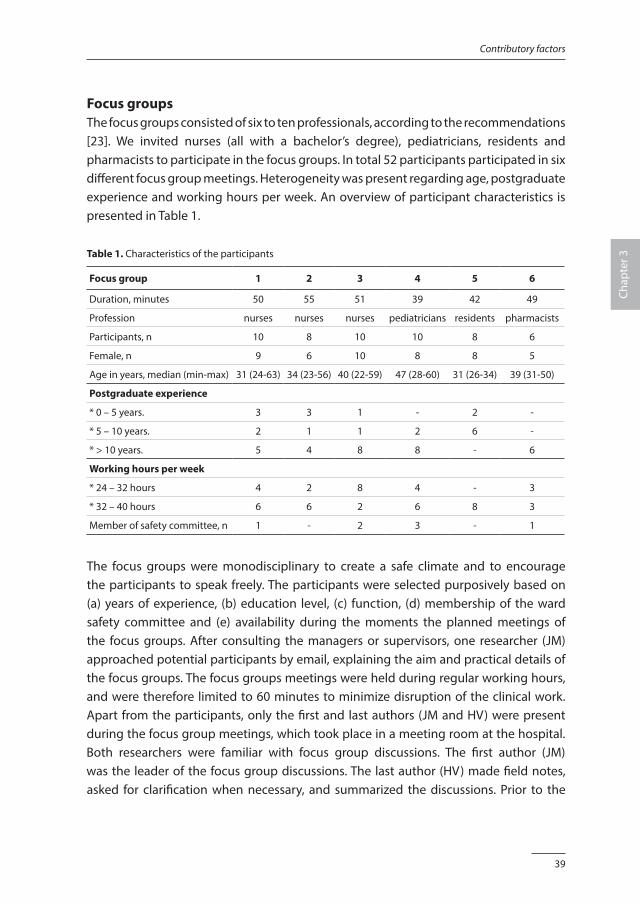
Focus groupsThe focus groups consisted of six to ten professionals, according to the recommendations [23]. We invited nurses (all with a bachelor’s degree), pediatricians, residents and pharmacists to participate in the focus groups. In total 52 participants participated in six different focus group meetings. Heterogeneity was present regarding age, postgraduate experience and working hours per week. An overview of participant characteristics is presented in Table 1.
Table 1. Characteristics of the participants
Focus group 1 2 3 4 5 6
Duration, minutes 50 55 51 39 42 49
Profession nurses nurses nurses pediatricians residents pharmacists
Participants, n 10 8 10 10 8 6
Female, n 9 6 10 8 8 5
Age in years, median (min-max) 31 (24-63) 34 (23-56) 40 (22-59) 47 (28-60) 31 (26-34) 39 (31-50)
Postgraduate experience
* 0 – 5 years. 3 3 1 - 2 -
* 5 – 10 years. 2 1 1 2 6 -
* > 10 years. 5 4 8 8 - 6
Working hours per week
* 24 – 32 hours 4 2 8 4 - 3
* 32 – 40 hours 6 6 2 6 8 3
Member of safety committee, n 1 - 2 3 - 1
The focus groups were monodisciplinary to create a safe climate and to encourage the participants to speak freely. The participants were selected purposively based on (a) years of experience, (b) education level, (c) function, (d) membership of the ward safety committee and (e) availability during the moments the planned meetings of the focus groups. After consulting the managers or supervisors, one researcher (JM) approached potential participants by email, explaining the aim and practical details of the focus groups. The focus groups meetings were held during regular working hours, and were therefore limited to 60 minutes to minimize disruption of the clinical work. Apart from the participants, only the first and last authors (JM and HV) were present during the focus group meetings, which took place in a meeting room at the hospital. Both researchers were familiar with focus group discussions. The first author (JM) was the leader of the focus group discussions. The last author (HV) made field notes, asked for clarification when necessary, and summarized the discussions. Prior to the
40
Chapter 3
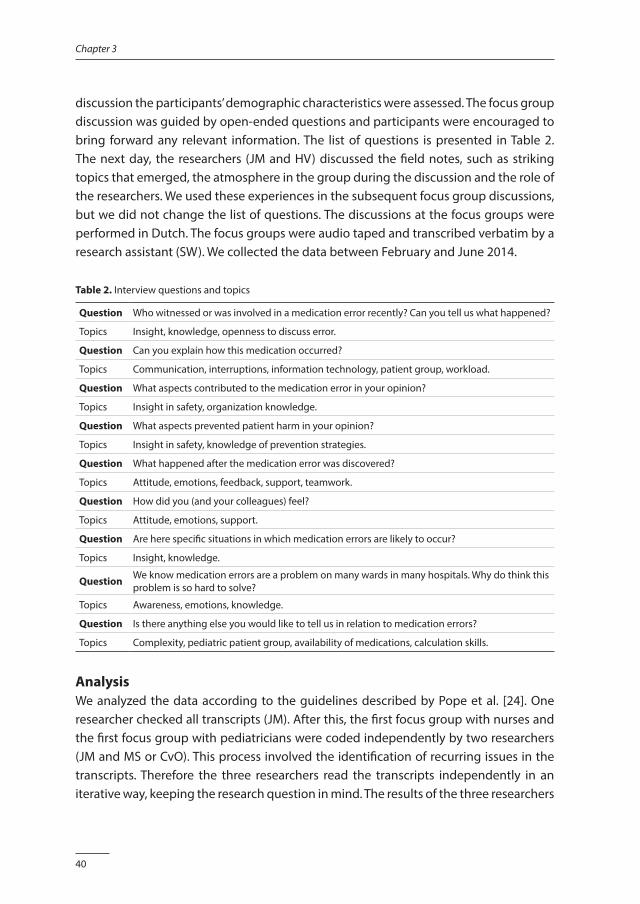
discussion the participants’ demographic characteristics were assessed. The focus group discussion was guided by open-ended questions and participants were encouraged to bring forward any relevant information. The list of questions is presented in Table 2. The next day, the researchers (JM and HV) discussed the field notes, such as striking topics that emerged, the atmosphere in the group during the discussion and the role of the researchers. We used these experiences in the subsequent focus group discussions, but we did not change the list of questions. The discussions at the focus groups were performed in Dutch. The focus groups were audio taped and transcribed verbatim by a research assistant (SW). We collected the data between February and June 2014.
Table 2. Interview questions and topics
Question Who witnessed or was involved in a medication error recently? Can you tell us what happened?
Topics Insight, knowledge, openness to discuss error.
Question Can you explain how this medication occurred?
Topics Communication, interruptions, information technology, patient group, workload.
Question What aspects contributed to the medication error in your opinion?
Topics Insight in safety, organization knowledge.
Question What aspects prevented patient harm in your opinion?
Topics Insight in safety, knowledge of prevention strategies.
Question What happened after the medication error was discovered?
Topics Attitude, emotions, feedback, support, teamwork.
Question How did you (and your colleagues) feel?
Topics Attitude, emotions, support.
Question Are here specific situations in which medication errors are likely to occur?
Topics Insight, knowledge.
Question We know medication errors are a problem on many wards in many hospitals. Why do think this problem is so hard to solve?
Topics Awareness, emotions, knowledge.
Question Is there anything else you would like to tell us in relation to medication errors?
Topics Complexity, pediatric patient group, availability of medications, calculation skills.
AnalysisWe analyzed the data according to the guidelines described by Pope et al. [24]. One researcher checked all transcripts (JM). After this, the first focus group with nurses and the first focus group with pediatricians were coded independently by two researchers (JM and MS or CvO). This process involved the identification of recurring issues in the transcripts. Therefore the three researchers read the transcripts independently in an iterative way, keeping the research question in mind. The results of the three researchers
41
Contributory factors
Chap
ter 3
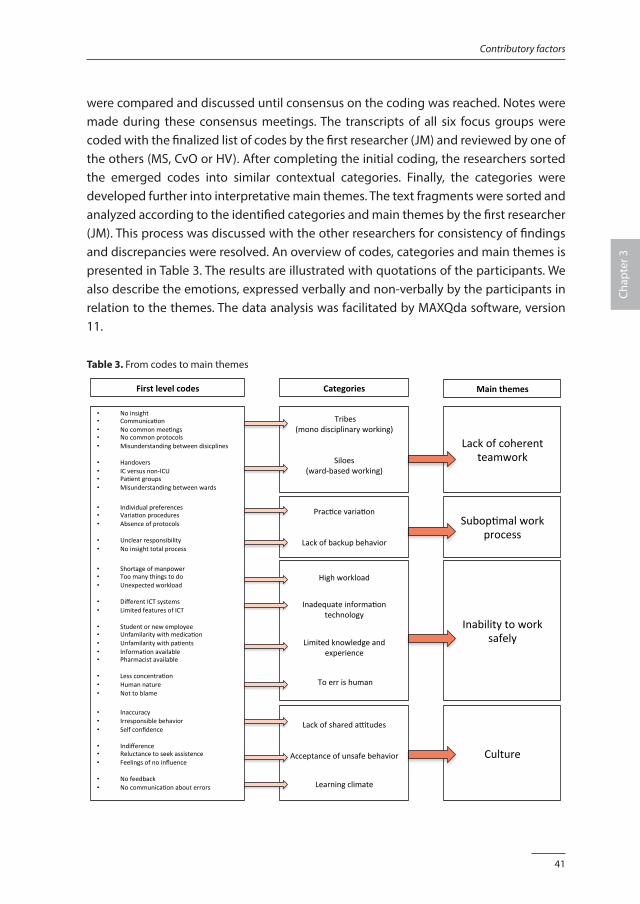
were compared and discussed until consensus on the coding was reached. Notes were made during these consensus meetings. The transcripts of all six focus groups were coded with the finalized list of codes by the first researcher (JM) and reviewed by one of the others (MS, CvO or HV). After completing the initial coding, the researchers sorted the emerged codes into similar contextual categories. Finally, the categories were developed further into interpretative main themes. The text fragments were sorted and analyzed according to the identified categories and main themes by the first researcher (JM). This process was discussed with the other researchers for consistency of findings and discrepancies were resolved. An overview of codes, categories and main themes is presented in Table 3. The results are illustrated with quotations of the participants. We also describe the emotions, expressed verbally and non-verbally by the participants in relation to the themes. The data analysis was facilitated by MAXQda software, version 11.
Table 3. From codes to main themes
ofcoherentteamwork
Subop/malworkprocess
Inabilitytoworksafely
Culture
• Noinsight• Communica/on• Nocommonmee/ngs• Nocommonprotocols• Misunderstandingbetweendisicplines• Handovers• ICversusnon-ICU• Pa/entgroups• Misunderstandingbetweenwards
• Individualpreferences• Varia/onprocedures• Absenceofprotocols• Unclearresponsibility• Noinsighttotalprocess• Shortageofmanpower• Toomanythingstodo• Unexpectedworkload• DifferentICTsystems• LimitedfeaturesofICT• Studentornewemployee• Unfamilaritywithmedica/on• Unfamilaritywithpa/ents• Informa/onavailable• Pharmacistavailable• Lessconcentra/on• Humannature• Nottoblame• Inaccuracy• Irresponsiblebehavior• Selfconfidence
• Indifference• Reluctancetoseekassistence• Feelingsofnoinfluence
• Nofeedback• Nocommunica/onabouterrors
Tribes(monodisciplinaryworking)
Siloes(ward-basedworking)
Prac/cevaria/on
Lackofbackupbehavior
Highworkload
Inadequateinforma/ontechnology
Limitedknowledgeandexperience
Toerrishuman
LackofsharedaPtudes
Acceptanceofunsafebehavior
Learningclimate
Lack
Firstlevelcodes Categories Mainthemes
42
Chapter 3
ValidationTechniques for validation as described by Mays et al. guided the validation process in our study [25]. We documented all the stages of the study and its procedures to achieve transparency and coherence regarding the study data and the interpretations. Crosschecking the analyses among the researchers as described above increased validation of the data. After the analyses, a summary of the preliminary results was sent to the participants to verify the content and interpretation of our findings (member check). Several participants checked the results and confirmed that they were accurate with only a few textual corrections. The feedback was discussed among the researchers, after which the analyses were finalized. We asked two reviewers (BS and EV), who were not familiar with the study and without access to the original transcripts, to provide an assessment of the process and conclusions. They contributed to optimizing the description of the methodology and challenged us to choose quotes that illustrate the themes most accurately.
Ethical considerationsThe Institutional Review Board of the Academic Medical Center determined that the protocol did not require medical ethical approval according to the Dutch Medical Ethics law. All participants provided informed consent for participation in the focus groups and audio taping the discussions. All data were analyzed and reported anonymously.
RESULTS
Four themes emerged from the analyses of the focus group discussions: “lack of coherent teamwork”, “suboptimal work process”, “inability to work safely” and “culture”. During the analysis it became clear that “culture” was a central subject, linking all three themes. The themes are described below, with quotations of the participants.
1. Lack of coherent teamworkIn all focus group discussions the participants reported that patient care should incorporate the expertise of healthcare professionals from multiple disciplines. However, it was recognized that patient care is fragmented in daily practice. We identified that care is organized in two ways: “monodisciplinary” and “ward-based”. The healthcare professionals appear to work within tribes (disciplines) and siloes (wards).
1.1. Tribes (monodisciplinary working) Nurses and pharmacists particularly emphasized the lack of interdisciplinary teamwork. They experienced that other professionals have limited insight into their work processes
43
Contributory factors
Chap
ter 3
and believe this is a problem in relation to medication safety. We noticed feelings of disbelief, as if the participants do not understand why other disciplines are not familiar with their work process.
Regularly, I explain to the doctors how the prescriptions are processed in our administration. And most of the time they are really surprised. They have no idea; really they have got no clue!(FG 1 nurses, R6)
All professionals mentioned that they make work instructions for their part of the medication process: doctors for prescribing, nurses for the administration and pharmacists for the preparation. These instructions are discussed in monodisciplinary meetings and described in monodisciplinary protocols, and there is no interdisciplinary information exchange or coordination.
That [aspect] is described in our protocols, but I don’t know if it is also mentioned in their protocols or written down somewhere else.(FG 6 pharmacists, R6)
1.2. Siloes (ward-based working)Participants of all focus groups recognized that daily work is organized per individual ward, resulting in heterogeneity in work processes between the wards.
Last week a colleague from another ward came to help, and when preparing a new infusion with electrolytes, he said: “Have you gone mad! It is much safer to ….”(FG 3 nurses, R8)
In the discussion this was justified by emphasizing the unique characteristics of the patients, leading to specific ward-based rules. However, it was acknowledged that the differing work processes cause problems when a patient is transferred to another ward, or for departments like the pharmacy that provide services to several wards. When this results in an actual ME, the healthcare professionals feel upset.
This patient was transferred from the PICU, and we did not have written information. So medication was stopped and started according to - well, how we are accustomed to doing it. Later we found out this was not correct, and the child was readmitted to the PICU. Terrible! (FG 3 nurses, R8)
44
Chapter 3
Feelings of frustration were expressed when the heterogeneity created additional, unnecessary work.
At time of arrival on the ward, the medication of the child is most of the time not clear, no overview, so there is a lot to sort out, which is not very convenient. To be honest: very annoying!
(FG 5 residents, R4)
2. Suboptimal work processesThe participants indicated that the medication process itself is error prone due to the complexity and the interdependencies between the disciplines involved. In addition they mentioned that the lack of ready-to-administer medications for pediatric patients further increases the complexity, but this is felt as inevitable. They also recognized that the medication process is characterized by inefficiency due to the way the work processes are organized. We defined two reported topics: “practice variation” and “lack of backup behavior”. Although the participants expressed a strong desire to improve, they felt incapable of doing so. Nurses and pharmacists felt they spend a lot of time fixing malfunctioning processes, mostly with ad-hoc measures.
2.1. Practice variationThe issue of practice variation emerged in all focus group discussions. It was agreed that this variation is the result of lack of coherent teamwork. In addition, the lack of clear procedures was mentioned in all focus group discussions.
When the results of the antibiotic level are deviating, sometimes I get a phone call, but sometimes not. I really do not understand why not; we should always be warned if a result is odd.(FG 5 residents, R3)
Practice variation was explained in the broader context of the organizational characteristics, i.e. the hospital is described as an informal organization in which individual preferences about how work is organized and care is provided are accepted. Although this aspect is appreciated, it was agreed that it also causes undesirable variation of work practices. Participants often felt confused and unsecure.
It does happen that a surgeon, during the procedure, decides what to prescribe. Most of the time this is not documented or…. well, maybe in the nursing files, I think…… It seems to me a personal preference. Then it easily goes wrong.(FG 4 pediatricians, R4 and R8)
45
Contributory factors
Chap
ter 3
2.2. Lack of backup behaviorPediatricians and residents recognized that in daily practice the specialization in care leads to fragmentation and inefficiency of the care provided. They struggle with tasks and responsibilities in relation to other medical specialists and they feel reluctant to make decisions on medication when the patient is taking care of by a medical specialist.
We, pediatricians, should be the coordinators of care, but half of the patients are in the care of a different specialist and sometimes multiple specialists. I am not going to change their prescriptions! So should I contact the neurologist for the anti-epileptic drugs and the cardiologist for the … and so on and so on?(FG 5 residents, R4)
The participants feel as if the primarily responsible specialist is not able to anticipate the needs of pediatricians and residents to safeguard medication safety (backup behavior). Pediatricians and residents recognize their own lack of knowledge and experience, but this is not always acknowledged in the work processes.
The anesthetic medication, postoperative. It does not make sense, we make those prescriptions. We do not have the experience and still we accept the responsibility. We are forced to make those prescriptions, without having the expertise. That does not feel ”senang”!(FG 4 pediatricians, R9 and R10)
3. Inability to work safely Several issues were mentioned that created situations in which the participants feel it is simply impossible to work safely. “High workload”, “inadequate information technology” and “limited knowledge and experience” were considered a threat to patient safety. But there was also debate about the human nature, which is not perfect (“to err is human”).
3.1. High workloadParticipants identified workload as an important factor that compromises patient safety. Residents and nurses in particular stated they could do better if more time was available, e.g. for performing checks.
If I would have plenty of time, then I could think thoroughly about the dosages of medication, check the protocols. But that is not the reality; there are always so many tasks that have to be done at the same time. (FG 5 residents, R3)
46
Chapter 3
Despite the fact that they are aware of risks, they feel the workload forces them into situations in which they cannot work according to the established medication safety practices.
I know, it is not an excuse, but we are often so busy! And then you know the next shift is arriving any minute, so the documentation has to be finished and there is still a lot on your list that has to be done. No way, I am going to check the medications; there is simply not enough time. (FG 1 nurses, R1)
Pharmacists did not report safety risks in the direct patient care, but they expressed a strong desire to support physicians and nurses, e.g. in protocol development, and feel unable to put this into practice due to shortage of time. Feelings of frustration and acceptance were both present.
Of course we want to cooperate, for example in the development of medication protocols for the wards. It is not that we do not want to; we just do not have the manpower. (FG 6 pharmacists, R4)
3.2. Inadequate information technologyAlthough the hospital has implemented Computerized Physician Order Entry (CPOE), the participants all believe that they do not benefit as much as might be expected from this technology. The limited functionality of the CPOE is considered a barrier instead of a facilitator to a safe medication process.
If you start looking in Medicator, you get an enormous list of medications, most of them not relevant. But you have to go through them first to pick the right prescription, while you are on a busy consultation shift. Well, then I think “hop, hop, click”, and hopefully it will end up right. (FG 4 pediatricians, R5)
In addition, a recurrent item that emerged from all focus group discussions was the presence of different ICT systems that are used in the medication process: Medicator on the non-intensive care wards and PDMS on the intensive care units. In particular, the residents found this very confusing as they work on all wards and therefore have to familiarize themselves with all the different systems. All participants recognized this situation as very unsafe.
47
Contributory factors
Chap
ter 3
In PDMS the prescription is a daily dose, while in Medicator we prescribe the dose for a single gift. Very tricky!(FG 5 residents, R2)
The healthcare professionals feel unsecure; although they work according to the protocols and guidelines, they are not sure the process will go as planned.
Prescriptions are only written down in Medicator, also when they are stopped or changed. We do not have any possibility to check, we just get the printouts. These are numbered, so based on those numbers you have to figure out what you are supposed to do. I simply start guessing: maybe this is what they want? It is like playing cards.(FG 1 nurses, R7)
2.3. Limited knowledge and/or experienceKnowledge and experience were discussed in all focus group discussions. Doctors and nurses acknowledged their pharmaceutical knowledge is limited. They also mentioned national guidelines and local protocols are sufficiently accessable and pharmacists are available for consultation. These sources are used, but only when the professionals feel the need to do so.
We had this incident with Digoxin; it was changed from oral to intravenous, I think because the child went for an operation. But the dosage was not changed, you know, and intravenous is a different dosage. That was lack of knowledge, simply not knowing. (FG 4 pediatricians, R4)
In addition, the pharmacist mentioned the absence of knowledge about medication, especially for children.
In pediatrics, a lot is still not clear. Dosages for example, especially for children younger than one year, the infants. There is very little evidence available.(FG 6 pharmacists, R7)
The lack of experience was mentioned by all participants, and was considered a safety risk because experience is believed to be an important barrier to MEs.
Last week I saw this prescription, and I thought “Huh? That dosage is strange for a child of only a few kilograms”. And indeed the dosage was far too high, and I noticed because I know this medication. (FG 5 residents, R1)
48
Chapter 3
2.4. Resignation to “to err is human”The participants believe that, generally speaking, it is impossible for a human being to work flawlessly all the time. A ME might occur even when it is clear what has to be done and the working conditions are perfect, simply because to err is human.
On our ward we had this incident with a wrong infusion rate. We double checked it and also the next shift did not notice. So stupid, we simply did not recognize the mistake, as if we were blind for it! Those things happen. (FG 3 nurses, R7)
3. CultureOrganizational culture can be defined as the shared perceptions, beliefs and attitudes about patient safety. In the focus group discussions several elements of the organizational culture were brought forward that compromise patient safety. In addition to the aforementioned teamwork problem, which is an important aspect of culture, we identified three additional issues: “lack of shared attitude”, “acceptance of unsafe behavior” and “learning climate”.
3.1. Lack of shared attitudeThe participants recognized differences in the use of medication protocols, advice seeking behavior and accuracy. A shared attitude toward medication safety seems to be absent and personal differences in attitude and behavior are considered normal.
Not every doctor keeps his records in Medicator up-to-date. But that is what we agreed upon, I think it is even mandatory. I know, but some of them refuse to do it, and they keep writing it down in the patient’s notes. (FG 3 residents, R4 and R5)
The participants also acknowledged that not all healthcare professionals are doing their utmost to achieve safe practices.
I know, I know, we agreed to check all medications at the end of our shift, but you know it is hard to follow all the rules and often I am tired and just want to go home.(FG 1 nurses, R10)
3.2. Acceptance of unsafe situationsWe noticed some degree of acceptance, as if the participants have accepted hazardous situations as normal daily practice.
49
Contributory factors
Chap
ter 3
The post-operative medication handover is always unclear, but it has been this way for a long time. That is the way it is.(FG 4 pediatricians, R3)
Most of these participants had little trouble naming factors that they believe contribute to MEs. Many also noted that these factors apply to themselves. However, when discussing these contributing factors, there was often a good deal of reluctance for participants to take responsibility for their own or other’s behavior that result in a ME.
I know I sometimes leave out the double check. Although I intend to always … and recently I made a medication error. But that was in a situation… I mean, there were only two of us and at that moment I really could not disturb my colleague.(FG 2 nurses, R6)
3.3. Learning climateAn important aspect of safety culture is the ability of an organization to identify errors and use them to implement safety measures. The participants understand improvements strategies, like feedback and incident reporting, but they do not seem to expect much improvement from using them.
We report medication errors, we sometimes analyze and discuss them as well, and then we continue as we always did. We do not learn from the errors we make.(FG 6 pharmacist, R5)
The healthcare professionals mentioned they report MEs, but they seem to doubt whether this information is used to create improvements, resulting in feelings of frustration.
It has been discussed so many, many times, but it does not change. Very frustrating!(FG 3 nurses, R9)
DISCUSSION
Based on the focus group discussions with pediatricians, residents, nurses and pharmacists we deepened the understanding of unsafe medication practices by conducting a qualitative analysis of the contributory factors that may lead to MEs. Four main themes emerged: “lack of coherent teamwork”, “suboptimal work process”, “inability to work safely” and “culture”. Culture appeared to be a central element, that
50
Chapter 3
links all three themes. The participants expressed feelings of not only frustration, confusion and uncertainty, but also of resignation. Our finding that lack of coherent teamwork is perceived as a contributory factor to unsafe medical practices is supported by several studies [26-28]. Indeed, teamwork is considered critically important in a dynamic hospital environment. Teams make fewer mistakes than individuals, especially when all team members understand their responsibilities, and those of other team members [29,30]. Unfortunately, teamwork and cooperation are not automatic and specific efforts are needed to “eliminate working on islands” [31,32]. In a social network analysis it became apparent that information sharing and advice seeking across professions was limited [31]. This conclusion was confirmed by qualitative research showing that doctors, nurses and pharmacists largely work alongside each other rather than with each other [32]. Therefore, healthcare organizations need to create an organization culture that emphasizes teamwork at various levels: across professions to eliminate tribes, and across wards and departments to break down siloes [33]. The lack of coherent teamwork resulted in differing work processes within disciplines and wards, without coordination between them. During all focus group discussions, it became clear that the participants experienced this situation as suboptimal. An organization-wide focus on process improvement may be of interest to address this problem. Evidence has shown that process-based organizations have a moderate but significant positive effect on efficiency in hospitals [34,35]. For example, Lean Six Sigma is a well-known method to redesign processes and has been successful in improving medication safety [36-38]. However, to actually achieve these positive effects, it is of major importance to motivate participation of all disciplines and create an adequate organizational culture [35,39]. The responses of the participants revealed they felt unable to work safely. This was perceived as a result of the aforementioned suboptimal work processes. Workload was an important issue in the focus groups with the residents, nurses and pharmacists. This is consistent with previous studies that identified high perceived workload as an error-provoking condition in the prescribing and administration stage of the medication process [17-19]. However, a systematic review on workload in pharmacists’ practice showed a lack of robust evidence indicating threats to patient safety caused by a high workload [40]. This is consistent with our findings that pharmacists feel constrained in supporting doctors and nurses in medication management, but do not report direct patient safety concerns caused by their workload. In addition, the participants felt unable to work safely due to lack of knowledge, although they emphasized that pharmaceutical information is available. This is in line with several publications that report lack of pharmacological knowledge as an important contributory factor to MEs [17-19].
51
Contributory factors
Chap
ter 3
The medication process becomes even more complex in pediatric care. Knowledge on the operational mechanism of medication in children is limited, pediatric patients require a constant need for adaptations based on age and weight [8], while appropriate formulations and dosage forms for children are often not available [9,10]. Consequently, additional steps in the medication process like calculations, crushing or splitting of tablets are necessary, resulting in additional potential MEs [41,42]. Surprisingly, those specific pediatric issues were hardly mentioned in the focus group discussions. The contributory factors leading to MEs, summarized in the aforementioned main themes boil down to one central theme: culture. Organizational culture can be defined as the shared perceptions, beliefs and attitudes about patient safety. These are considered valid by the healthcare professionals and are therefore a strong incentive for their behavior. Our results indicate that the healthcare professionals are aware of unsafe situations, but they seem to accept this as a characteristic of the organization. The existing hospital culture motto “professional in the lead” results in limited centralized and hierarchical leadership, which the participants of the focus groups believed was the right philosophy. They acknowledged that this created a lot of freedom in decision making and developing new ideas, which was highly appreciated. However, our results show that the disadvantages were recognized as well: variation and lack of coherent teamwork, leading to suboptimal work processes and the inability to work safely. Organizations should pay attention to this contradiction during the implementation of a safety program by combining top-down activities, such as creating a clear vision and resource support, with bottom-up activities to value local initiatives by the healthcare professionals [43]. A strong statement from the leaders that MEs are unacceptable and always must be discussed in order to learn from them, might contribute to a safe culture.
Methodological considerationsWe used focus groups to collect data. A limitation of this approach is that the participants might be reluctant to discuss errors they made or witnessed. However, we emphasized confidentiality and anonymity, and thus collected information that appeared to be open and honest. The accuracy of our study may have been affected by the researchers’ influence and pre-existing opinions. Being aware of this phenomenon, we performed several steps during the research process to ensure validity and credibility. After each focus group, the leader of the discussion made field notes and documented personal accounts, questions and emotions. The field notes were used to reflect on the role and influence of the researchers and subjectivities. In addition, during the analysis we continually used the original transcripts to identify and reflect on our own opinions and subjective interpretations. Finally, we performed a member check and the participants confirmed our interpretations.
52
Chapter 3
Implication for practiceHealthcare professionals play a crucial role in the prevention of MEs in order to provide safe patient care. Hospital management must help them by creating optimal conditions. Priority should be given to issues known to contribute to better safety outcomes, like adequate staffing [44-46] and information technology [47,48]. The existing ward-based safety teams should organize interdisciplinary safety meetings to give the key players insight into the total medication process and the role of each healthcare professional in this process. These meetings can also be used to analyze MEs, provide feedback and discuss solutions. In addition, leadership walk arounds must be organized, as they have been proven to be effective in creating a positive safety culture [49,50]. These walk arounds enable clinical leaders to discuss safety issues with the frontline healthcare professionals and demonstrate commitment. The walk arounds should emphasizes the total medication process and not be limited to a single ward or discipline. It is worthwhile to pay attention to the principles that characterize High Reliability Organizations. These organizations with a culture highly sensitive to safety have proven successful in various hazardous industries and are thought to be effective in hospitals as well [51]. Although our study was performed at only one academic pediatric hospital, the key messages may be transferable to hospitals with similar contexts. To facilitate the reader we have provided a thick description of the setting and participants. The organizations with many similarities will likely recognize the results from this study.
CONCLUSION
This study explored contributory factors that may lead to medication errors in pediatric care. Four main themes emerged: “lack of coherent teamwork”, “suboptimal work process”, “inability to work safely” and “culture”. Culture appeared to be a central element, linking all three themes. Our results highlight the need for interventions on the organizational level, with a focus on interdisciplinary teamwork and re-design of the medication process. An essential aspect is to create an organizational culture that gives priority to medication safety and is supported by both healthcare management and healthcare professionals.
AcknowledgementsWe would like to thank Simone Wolking (SW) for supporting the transcriptions and Bea Spek (BS) and Erik Vermeulen (EV) for their reflection on the study.
FundingNeither this research project nor the authors received any grant from any agency in the public, commercial or not-for-profit sector.
53
Contributory factors
Chap
ter 3
REFERENCES1. Choi I, Lee S, Flynn L, et al. Incidence and treatment costs attributable to medication errors in hospitalized
patients. Res Social Adm Pharm 2015; DOI:org/10.1016/j.sapharm.2015.08.006 (epub. ahead of print)
2. Ghaleb MA, Barber N, Franklin BD, et al. The incidence and nature of prescribing and medication administration errors in pediatric inpatients. Arch Dis Child 2010;95:113-118.
3. Kongkaew C, Hann M, Mandal J, et al. Risk factors for hospital admissions associated with adverse drug events. Pharmacotherapy 2013;33:827-837.
4. Lewis PJ, Dornan T, Taylor D, et al. Prevalence, incidence and nature of prescribing errors in hospital inpatients: a systematic review. Drug Saf 2009;32:379-389.
5. Maaskant JM, Bosman D, van Rijn-Bikker P, et al. Preventable errors with non-opioid analgesics and anti-emetic drugs increase burden in hospitalized children. Eur J Pediatr Surg 2014;24:381-388.
6. Miller MR, Robinson KA, Lubomski LH, et al. Medication errors in pediatric care: a systematic review of epidemiology and an evaluation of evidence supporting reduction strategy recommendations. Qual Saf Health Care 2007;16:116-126.
7. Zegers M, de Bruijne MC, Wagner C, et al. Adverse events and potentially preventable deaths in Dutch hospitals: results of a retrospective patient record review study. Qual Saf Health Care 2009;18:297-302.
8. Santell JP, Hicks RW, McMeekin J, et al. Medication errors: experiences of the United States Pharmacopeia (USP) MEDMARX reporting system. J Clin Pharmacol 2003;43:760-777.
9. Uppal N, Yasseen B, Seto W, et al. Drug formulations that require less than 0.1 ml of stock solutions to prepare doses for infants and children. CMAJ 2011;183:e246-e248.
10. Wong IC, Wong LY, Cranswick NE. Minimising medication errors in children. Arch Dis Child 2009;94:161-164.
11. Ferranti J, Horvath MM, Cozart H, et al. Reevaluating the safety profile of pediatrics: a comparison of computerized adverse drug event surveillance and voluntary reporting in the pediatric environment. Pediatrics 2008;121:e1201-e1207.
12. Ghaleb MA, Barber N, Franklin BD, et al. Systematic review of medication errors in pediatric patients. Ann Pharmacother 2006;40:1766-1776.
13. Holdsworth MT, Fichtl RE, Behta M, et al. Incidence and impact of adverse drug events in pediatric inpatients. Arch Paediatr Adolesc Med 2003;157:60-65.
14. Kaushal R, Bates DW, Landrigan C, et al. Medication errors and adverse drug events in pediatric inpatients. JAMA 2001;285:2114-2120.
15. Otero P, Leyton A, Mariani G, et al. Medication errors in pediatric inpatients: prevalence and results of a prevention program. Pediatrics 2008;122:e737-e743.
16. Maaskant JM, Vermeulen H, Apampa B, et al. Interventions for reducing medication errors in children in hospital. Cochrane Database Syst Rev 2015, Issue 3. Art. No: CD006208. DOI: 10.1002/14651858.CD006208.pub3.
17. Brady AM, Malone AM, Fleming S. A literature review of the individual and systems factors that contribute to medication errors in nursing practice. J Nurs Manag 2009;17:679-697.
18. Keers RN, Williams SD, Cooke J, et al. Causes of medication administration errors in hospitals: a systematic review of quantitative and qualitative evidence. Drug Saf 2013;36:1045-1067.
19. Tully MP, Ashcroft DM, Dornan T, et al. The causes and factors associated with prescribing errors in hospital patients: a systematic review. Drug Saf 2009;32:819-836.
20. Creswell JW. Research Design: Qualitative, Quantitative and Mixed Methods Approaches. Third edition. Sage Publications Inc., Thousand Oaks, California, United States of America, 2009.
21. Boeije H. Analysis in qualitative research. Sage Publications Inc., Thousand Oaks, California, United States of America, 2009.
54
Chapter 3
22. Tong A, Sainsbury P, Craig J. Consolidated criteria for reporting qualitative research (COREQ): a 32-item checklist for interviews and focus groups. Int J Qual Health Care 2007;19:349-357.
23. King N, Horrocks C. Interviews in qualitative research. Sage Publications Inc., London, United Kingdom, 2010.
24. Pope C, Ziebland S, Mays N. Qualitative research in health care: analyzing qualitative data. BMJ 2000;320:114-116.
25. Mays N, Pope C. Qualitative research in health care: assessing quality in qualitative research. BMJ 2000;320:50-52.
26. Baggs JG, Schmitt MH, Musklin AI, et al. The association between nurse-physician collaboration and patient outcomes in three intensive care units. Crit Care Med 1999;27:1992-1998.
27. Baker DP, Gustafson S, Beaubein J, et al. Medical teamwork and patient safety: the evidence based relation. Available: www.ahrq.gov/research/findings/final-reports/medteam, accessed July 2015.
28. Manser T. Teamwork and patient safety in dynamic domains of healthcare: A review of the literature. Acta Anaesthesiol Scan 2009;53:143-151.
29. Weaver S, Rosen M, Diaz Granados D, et al. Does teamwork improve performance in the operating room? A multilevel evaluation. Jt Comm J Qual Patient Saf 2010;36:133-142.
30. Weller J, Boyd M, Cumin D. Teams, tribes and patient safety; overcoming barriers to effective teamwork in healthcare. Postgrad Med 2014;90:149-154.
31. Creswick N, Westbrook JI. Who do hospital physicians and nurses go to for advice about medications? A social network analysis and examination of prescribing error rates. J Patient Saf 2015;11:152-159.
32. Rixon S, Braaf S, Williams A, et al. Pharmacists’ interprofessional communication about medications in specialty hospital settings. Health Commun 2015;30:1065-1075.
33. Edmondson AC. Teaming: How organizations learn, innovate, and compete in the knowledge economy. First edition. Harvard Business School, Jossey Bass, United States of America, 2012.
34. Scott I. What are the most effective strategies for improving quality and safety of health care? Intern Med J 2009;39:389-400.
35. Vera A, Kuntz L. Process-based organization design and hospital efficiency. Health Care Manage Rev 2007;32:55-65.
36. Aboumatar HJ, Winner L, Davis R, et al. Applying Lean Sigma Solutions to Mistake-Proof the Chemotherapy Preparation Process. Jt Comm J Qual Patient Saf 2010;36:79-86.
37. Ching JM, Long C, Williams BL, et al. Using Lean to Improve Medication Administration Safety: In Search of the “Perfect Dose”. Jt Comm J Qual Patient Saf 2013;39:195-204.
38. Newell TL, Steinmetz-Malato LL, van Dyke DL. Applying Toyota production system techniques for medication delivery: improving hospital safety and efficiency. J Healthc Qual 2011;33:15-22.
39. Wang MC, Hyun JK, Harrison MI, et al. Redesign health systems for quality: lessons from emerging practices. Jt Comm J Qual Patient Saf 2006;32:599-611.
40. Hassell K, Seston EM, Schafheutle EI, et al. Workload in community pharmacies in the UK and its impact on patient safety and pharmacists’ well-being: a review of the evidence. Health Soc Care Community 2011;19:561-675.
41. Bertsche T, Bertsche A, Krieg EM, et al. Prospective pilot intervention study to prevent medication errors in drugs administered to children by mouth or gastric tube: a programme for nurses, physicians and parents. Qual Saf Health Care 2010;19:e26.
42. Richey RH, Craig JV, Shah UU, et al. MODRIC - manipulation of drugs in children. Int J Pharm 2013;457:339-341.
43. Stewart GL, Manges KA, Ward MM. Empowering sustained patient safety, the benefit of combining top-down and bottom-up approaches. J Nursing Care Qual 2015;30:240-246.
55
Contributory factors
Chap
ter 3
44. Aiken LH, Sloane DM, Bruynzeel L., et al. Nursing staffing and education and hospital mortality in nine European countries: a retrospective observational study. Lancet 2014;383:1824-1830.
45. Wilson S, Bremner A, Hauck Y, et al. The effect of nurse staffing on clinical outcomes of children in hospital: a systematic review. Int J Evid-Based Healthc 2011;9:97-121.
46. Wilcox ME, Chong CA, Niven DJ, et al. Do intensivist staffing patterns influence hospital mortality following ICU admission? A systematic review and meta-analyses. Crit Care Med 2013;41:2253-2274.
47. Eslami S, de Keizer NF, Abu-Hanna A. The impact of computerized physician medication order entry in hospitalized patients: a systematic review. Int J Med Inform 2008;77:365-376.
48. Poon EG, Keohane CA, Yoon CS, et al. Effect of bar-code technology on the safety of medication administration. N Engl J Med 2010;362:1698-1707.
49. Morello RT, Lowthian JA, Barker AL, et al. Strategies for improving patient safety culture in hospitals: a systematic review. BMJ Qual Saf 2003;22:11-18.
50. Weaver SJ, Lubomksi LH, Wilson RF, et al. Promoting a culture of safety as a patient safety strategy. A systematic review. Ann Intern Med 2013;158:369-374.
51. Hines S, Luna K, Lofthus J, et al. Becoming a High Reliability Organization: Operational Advice for Hospital Leaders. AHRQ Publication No. 08-0022. Agency for Healthcare Research and Quality, Available: www.ahrq.gov, accessed November 2015.

Chapter 4
High-alert medications for pediatric patients: an international modified Delphi study
Jolanda MaaskantAnne Eskes
Petra van Rijn-BikkerDiederik Bosman
Wim van AalderenHester Vermeulen
Expert Opinion on Drug Safety 2013;12:805-814.
58
Chapter 4
ABSTRACT
IntroductionThe available knowledge about high-alert medications for children is limited. Because children are particularly vulnerable to medication errors, a list of high-alert medication specifically for children would help to develop effective strategies to prevent patient harm. The objective of this study was to generate an internationally accepted list of high-alert medications for a pediatric inpatient population from birth to 18 years old.
MethodsWe conducted an international modified Delphi study and validated the results with reports on medication incidents in children based on national data.
ResultsThe rating panel consisted of 34 experts from 13 countries. In total, 14 medications and 4 medication classes were included with the predefined level of consensus of 75%. The high-alert medications were: amiodarone, digoxin, dopamine, epinephrine, fentanyl, gentamycin, heparin, insulin, morphine, norepinephrine, phenytoin, potassium, propofol and tacrolimus. The high-alert medication classes included in the final list were: chemotherapeutic drugs, immunosuppressive medications, lipid/total parenteral nutrition and opioids.
ConclusionAn international group of experts defined 14 medications and 4 medication classes as high-alert for children. This list might be helpful as a starting point for individual hospitals to develop their own high-alert list tailored to their unique situation.

59
High-alert medications
Chap
ter 4
INTRODUCTION
Patient harm as a result of medication errors (MEs) is one of the most common type of adverse events in hospitalized patients [1]. Although MEs do not always cause patient harm, studies have shown that 3-10% of such errors result in significant harm or even contribute to death [1-4]. Children are believed to be at especially high risk of harm due to MEs; according to estimates, MEs result in harm in children about three times more often than in adults [5]. Therefore, the safe use of medication in children requires even more precautions than in adult patients. It is important to note that not all adverse drug events are the result of MEs, and are thus not preventable, but it is estimated that about half of them are [2,6,7]. Nevertheless, until now interventions have led to only limited improvements, and MEs continue to threaten patient safety [8]. Medications are very diverse and have a wide range of risk profiles. Those with a heightened risk of causing patient harm are known as high-alert medications; they have serious consequences for patients when misused [9]. Attention for high-alert medications is stressed by several leading organizations like the Institute of Healthcare Improvement (IHI), Joint Commission International (JCI) and the Institute of Safe Medication Practice (ISMP) [9-11]. A list of high-alert medications for the general patient population has been developed by the ISMP, based on error reports and expert opinions [9]. The available knowledge about high-alert medications for children is limited. Analyses of pediatric medication errors voluntary reported in the USA and Canada have resulted in two slightly different lists [12,13]. Although studies on MEs sometimes report the medications involved, they seldom report the ones that must be considered high-alert. Moreover, studies that reported on high-alert medications in pediatric and neonatal intensive care units did not result in a uniform list [14,15]. Because children are particularly vulnerable to MEs, in clinical practice a list of high-alert medications specifically for children would help to develop and implement more effective strategies to prevent patient harm. Therefore, we aimed to generate an internationally accepted list of high-alert medications for an inpatient pediatric population. The target group included all children from birth until 18 years old without any underlying disease or syndrome.
60
Chapter 4
METHODS
Study designOur study consisted of two parts. Firstly, we reviewed the literature to generate a preliminary list of high-alert medications for children. Secondly, we used the modified Delphi technique, which is considered to be an effective way to obtain consensus within a group of experts [16]. High-alert medications are defined as medications that are considered to cause patient harm when misused due either to a narrow therapeutic window or to serious adverse events in the past. Harmful and unintended responses to medications, at normal dosages and proper use, known as adverse drug reactions or side effects, are excluded from this definition. The Institutional Review Board of the Academic Medical Center in Amsterdam reviewed the protocol and judged that it was not subject to medical ethical approval according to the Dutch Medical Ethics Law. All responses were analyzed and reported anonymously.
Review of literature reporting high-alert medicationWe reviewed the literature to generate a list of possible high-alert medications. For this purpose we systematically searched the Cochrane Library, MEDLINE and EMBASE to identify studies published until 1 February 2012. We included all publications that aimed to describe high-alert medications because they were identified or considered to be harmful in hospitalized children from birth to 18 years old. No limitations were applied to study design, publication date or language. We excluded publications investigating safety profiles of predefined medications. We conducted a purely descriptive review and therefore did not assess the publications on study quality. The results of this review were used as the starting point for the Delphi rounds.
Expert groupProspective members of the international expert group were identified through literature review, websites of medication safety organizations and recommendations from known experts in the field. In addition, we applied the following inclusion criteria: healthcare professionals were qualified as experts if (a) they had at least 5-years post-qualification experience in pediatrics, (b) were educated to postgraduate level and (c) were willing to participate. We included pediatricians, neonatologists, anesthetists, pharmacists and pediatric nurses. To improve the generalizability and usefulness of our final list, we aimed to create a sample of representative experts, homogeneous in the field of medication safety issues, but from various geographical regions. We aimed to include at least 30 experts to assure sufficient expertise and representativeness, even if attrition occurred [17]. We sent a letter by email to the experts to explain the aim
61
High-alert medications
Chap
ter 4
of the study and the study design, and to request their participation. After informed consent, the experts received three web-based questionnaires, one for each Delphi round. We also collected data on the experts, such as their profession, education, years of experience and employment or designation. To prevent attrition, we aimed at a quick turnaround time, used personalized emails, reminded non-responding experts by email and gave deadlines [18].
Data collectionData were collected by questionnaire, one for each round. The questionnaires were pretested in a pilot study. To this end, we sent the web-based questionnaires to a pediatrician, a neonatologist, a pharmacist and a nurse. We asked them to comment on the content, clarity and phrasing of the questions as well as the layout of the questionnaire. The comments were used to improve the questionnaires. The participating experts received the link for the online questionnaire by email, using a commercial available survey tool (SurveyMonkey, Inc. Europe, Sarl, Luxembourg). The three questionnaires were distributed in May, June and July 2012. The questionnaires included instructions for completion. The experts were asked to respond within three weeks. Up to two reminders were sent per round to non-responders. The second and third questionnaires were send within one week after the previous round was finished. During all rounds the experts were asked to rate their opinions on a 5-point Likert scale: “strongly disagree”, “disagree”, “neutral”, “agree” and “strongly agree”. Because no standard threshold for consensus exists [19], we used the following definition: at least 75% of the experts rated a medication as high-alert with “agree” or “strongly agree”. Consequently, if at least 75% of the experts rated “disagree” or “strongly disagree”, then the corresponding medication was excluded from further discussion.
Delphi roundsThe first questionnaire consisted of three parts. The first part posed questions about the baseline characteristics of the experts. In the second part we presented a list of possible high-alert medications generated from the literature review. We presented the list alphabetically and included a brief summary of the relevant literature. The first question was to rate the medication as high-alert. In addition, we collected information regarding the patient age groups, routes of administration and the organ systems in which adverse events might occur in case of misuse. This additional information was collected only during the first round. In the third part of the questionnaire, the experts were asked to add any medications or medication classes that they considered to be high-alert if they were not included on the initial list. The experts were given the option of supporting their choices with scientific evidence, incident reports or experience.
62
Chapter 4
Medications on which consensus was reached in Delphi round 1, based on the 75% level of agreement, were not discussed again in Delphi round 2. Medications on which no consensus was reached, together with the additional medications suggested in Delphi round 1, were included in the second questionnaire. Once again, the list of medications was alphabetical. The medications rated in the first round were listed with the group response results, described as percentages of the experts’ scores on the 5-point Likert scale. We asked the experts to rate each medication on which no consensus was reached, as well as the newly added medications. Medications on which consensus was reached in Delphi round 2 were not discussed again in Delphi round 3. Also, the medications that had been rated by the experts in the first two rounds were not presented again in Delphi round 3. We asked the experts to once again rate the medications that remained from Delphi round 2. We presented the list in alphabetical order. The experts were asked to rate the medication as high-alert according the 5-point Likert scale, as in previous rounds.
Validation We validated our results with reports on medication incidents in children. For this purpose, we used data from the Dutch incident registration (Foundation Portal for Patient Safety/CMR). CMR is a nonprofit organization devoted entirely to the nationwide registration and prevention of adverse events in healthcare, using a voluntary incident reporting system. These incident reports are used to learn about errors, understand their causes, and share this information with healthcare professionals across the country. ME prevention and safe medication use is a main focus of the organization.
AnalysisDescriptive statistics were used to report our results. We expressed the level of agreement in percentages of same answers to each question. Medications rated as “strongly agree” or “agree” by at least 75% of the experts were included in the final list. We excluded medications that were rated as “strongly disagree” or “disagree” by 75% of the experts. To analyze the change in answers towards consensus, we described the dispersion of the results in standard deviations (SD) and ranges. All analyses were performed using SPSS software (PASW statistics version 18.0, IBM, Armonk, NY, USA).
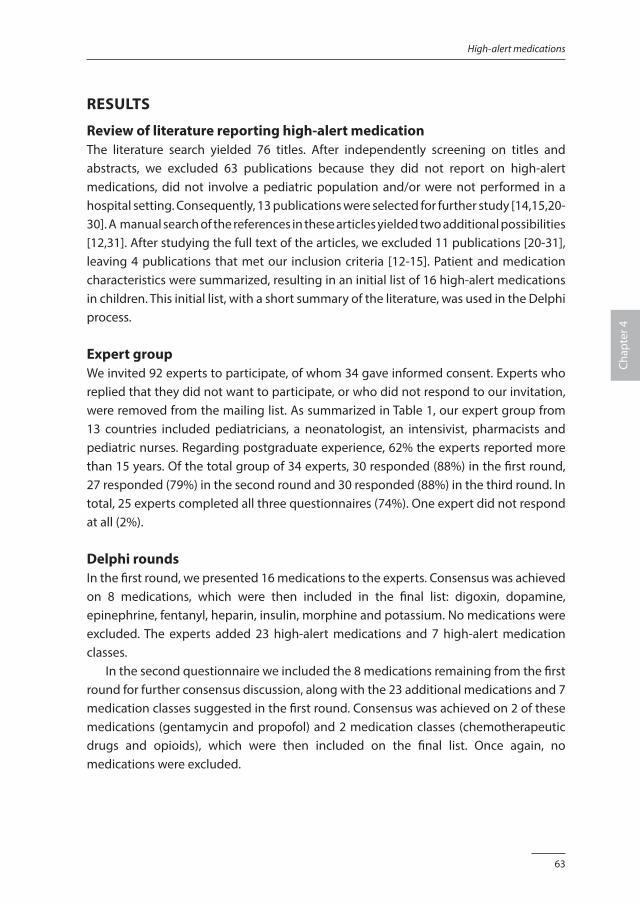
63
High-alert medications
Chap
ter 4
RESULTS
Review of literature reporting high-alert medicationThe literature search yielded 76 titles. After independently screening on titles and abstracts, we excluded 63 publications because they did not report on high-alert medications, did not involve a pediatric population and/or were not performed in a hospital setting. Consequently, 13 publications were selected for further study [14,15,20-30]. A manual search of the references in these articles yielded two additional possibilities [12,31]. After studying the full text of the articles, we excluded 11 publications [20-31], leaving 4 publications that met our inclusion criteria [12-15]. Patient and medication characteristics were summarized, resulting in an initial list of 16 high-alert medications in children. This initial list, with a short summary of the literature, was used in the Delphi process.
Expert groupWe invited 92 experts to participate, of whom 34 gave informed consent. Experts who replied that they did not want to participate, or who did not respond to our invitation, were removed from the mailing list. As summarized in Table 1, our expert group from 13 countries included pediatricians, a neonatologist, an intensivist, pharmacists and pediatric nurses. Regarding postgraduate experience, 62% the experts reported more than 15 years. Of the total group of 34 experts, 30 responded (88%) in the first round, 27 responded (79%) in the second round and 30 responded (88%) in the third round. In total, 25 experts completed all three questionnaires (74%). One expert did not respond at all (2%).
Delphi roundsIn the first round, we presented 16 medications to the experts. Consensus was achieved on 8 medications, which were then included in the final list: digoxin, dopamine, epinephrine, fentanyl, heparin, insulin, morphine and potassium. No medications were excluded. The experts added 23 high-alert medications and 7 high-alert medication classes. In the second questionnaire we included the 8 medications remaining from the first round for further consensus discussion, along with the 23 additional medications and 7 medication classes suggested in the first round. Consensus was achieved on 2 of these medications (gentamycin and propofol) and 2 medication classes (chemotherapeutic drugs and opioids), which were then included on the final list. Once again, no medications were excluded.
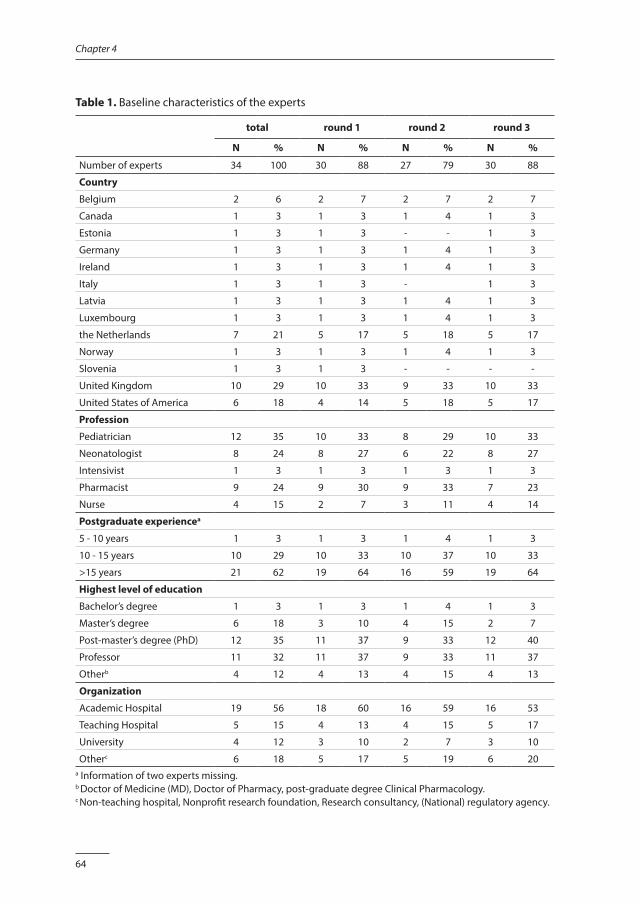
64
Chapter 4
Table 1. Baseline characteristics of the experts
total round 1 round 2 round 3
N % N % N % N %
Number of experts 34 100 30 88 27 79 30 88
Country
Belgium 2 6 2 7 2 7 2 7
Canada 1 3 1 3 1 4 1 3
Estonia 1 3 1 3 - - 1 3
Germany 1 3 1 3 1 4 1 3
Ireland 1 3 1 3 1 4 1 3
Italy 1 3 1 3 - 1 3
Latvia 1 3 1 3 1 4 1 3
Luxembourg 1 3 1 3 1 4 1 3
the Netherlands 7 21 5 17 5 18 5 17
Norway 1 3 1 3 1 4 1 3
Slovenia 1 3 1 3 - - - -
United Kingdom 10 29 10 33 9 33 10 33
United States of America 6 18 4 14 5 18 5 17
Profession
Pediatrician 12 35 10 33 8 29 10 33
Neonatologist 8 24 8 27 6 22 8 27
Intensivist 1 3 1 3 1 3 1 3
Pharmacist 9 24 9 30 9 33 7 23
Nurse 4 15 2 7 3 11 4 14
Postgraduate experiencea
5 - 10 years 1 3 1 3 1 4 1 3
10 - 15 years 10 29 10 33 10 37 10 33
>15 years 21 62 19 64 16 59 19 64
Highest level of education
Bachelor’s degree 1 3 1 3 1 4 1 3
Master’s degree 6 18 3 10 4 15 2 7
Post-master’s degree (PhD) 12 35 11 37 9 33 12 40
Professor 11 32 11 37 9 33 11 37
Otherb 4 12 4 13 4 15 4 13
Organization
Academic Hospital 19 56 18 60 16 59 16 53
Teaching Hospital 5 15 4 13 4 15 5 17
University 4 12 3 10 2 7 3 10
Otherc 6 18 5 17 5 19 6 20a Information of two experts missing.b Doctor of Medicine (MD), Doctor of Pharmacy, post-graduate degree Clinical Pharmacology.c Non-teaching hospital, Nonprofit research foundation, Research consultancy, (National) regulatory agency.
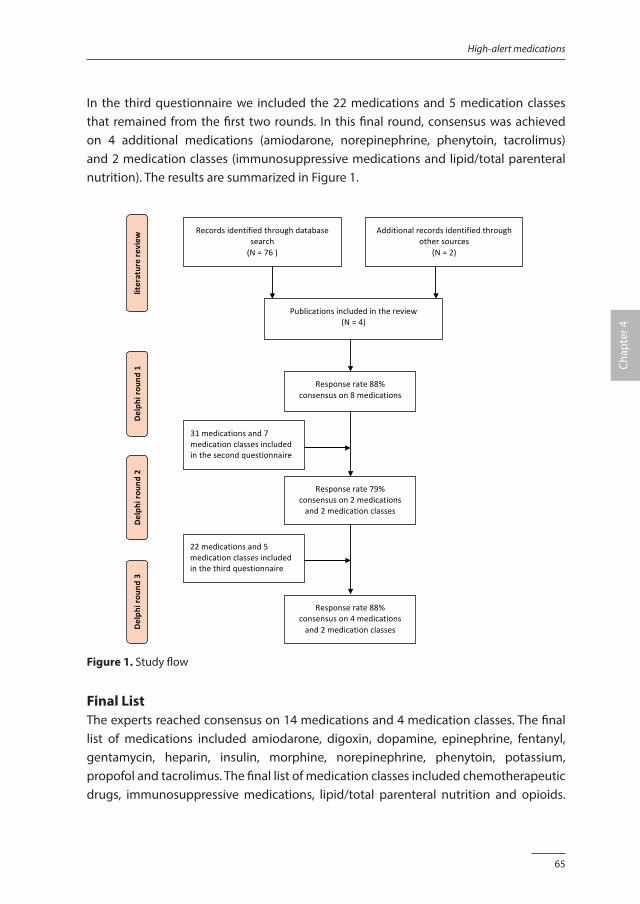
65
High-alert medications
Chap
ter 4
In the third questionnaire we included the 22 medications and 5 medication classes that remained from the first two rounds. In this final round, consensus was achieved on 4 additional medications (amiodarone, norepinephrine, phenytoin, tacrolimus) and 2 medication classes (immunosuppressive medications and lipid/total parenteral nutrition). The results are summarized in Figure 1.
Figure1.Studyflow
literaturereview
Delph
irou
nd1
Delph
irou
nd2
Delph
irou
nd3
Recordsidentifiedthroughdatabasesearch(N=76)
Additionalrecordsidentifiedthroughothersources
(N=2)
Publicationsincludedinthereview(N=4)
Responserate88%consensuson8medications
Responserate79%consensuson2medicationsand2medicationclasses
31medicationsand7medicationclassesincludedinthesecondquestionnaire( )
Responserate88%consensuson4medicationsand2medicationclasses
22medicationsand5medicationclassesincludedinthethirdquestionnaire( )
Figure 1. Study flow
Final ListThe experts reached consensus on 14 medications and 4 medication classes. The final list of medications included amiodarone, digoxin, dopamine, epinephrine, fentanyl, gentamycin, heparin, insulin, morphine, norepinephrine, phenytoin, potassium, propofol and tacrolimus. The final list of medication classes included chemotherapeutic drugs, immunosuppressive medications, lipid/total parenteral nutrition and opioids.
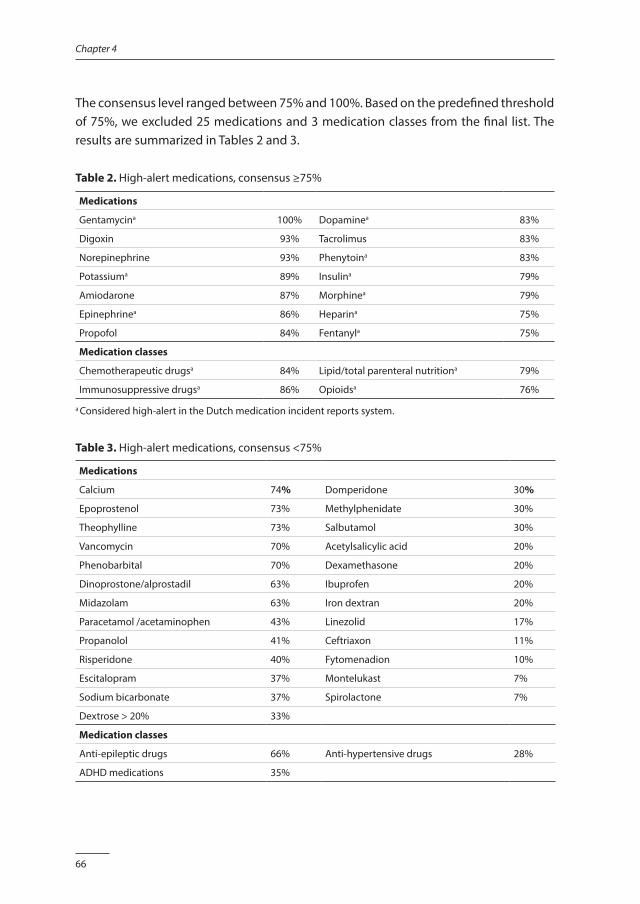
66
Chapter 4
The consensus level ranged between 75% and 100%. Based on the predefined threshold of 75%, we excluded 25 medications and 3 medication classes from the final list. The results are summarized in Tables 2 and 3.
Table 2. High-alert medications, consensus ≥75%
Medications
Gentamycina 100% Dopaminea 83%
Digoxin 93% Tacrolimus 83%
Norepinephrine 93% Phenytoina 83%
Potassiuma 89% Insulina 79%
Amiodarone 87% Morphinea 79%
Epinephrinea 86% Heparina 75%
Propofol 84% Fentanyla 75%
Medication classes
Chemotherapeutic drugsa 84% Lipid/total parenteral nutritiona 79%
Immunosuppressive drugsa 86% Opioidsa 76%
a Considered high-alert in the Dutch medication incident reports system.
Table 3. High-alert medications, consensus <75%
Medications
Calcium 74% Domperidone 30%
Epoprostenol 73% Methylphenidate 30%
Theophylline 73% Salbutamol 30%
Vancomycin 70% Acetylsalicylic acid 20%
Phenobarbital 70% Dexamethasone 20%
Dinoprostone/alprostadil 63% Ibuprofen 20%
Midazolam 63% Iron dextran 20%
Paracetamol /acetaminophen 43% Linezolid 17%
Propanolol 41% Ceftriaxon 11%
Risperidone 40% Fytomenadion 10%
Escitalopram 37% Montelukast 7%
Sodium bicarbonate 37% Spirolactone 7%
Dextrose > 20% 33%
Medication classes
Anti-epileptic drugs 66% Anti-hypertensive drugs 28%
ADHD medications 35%
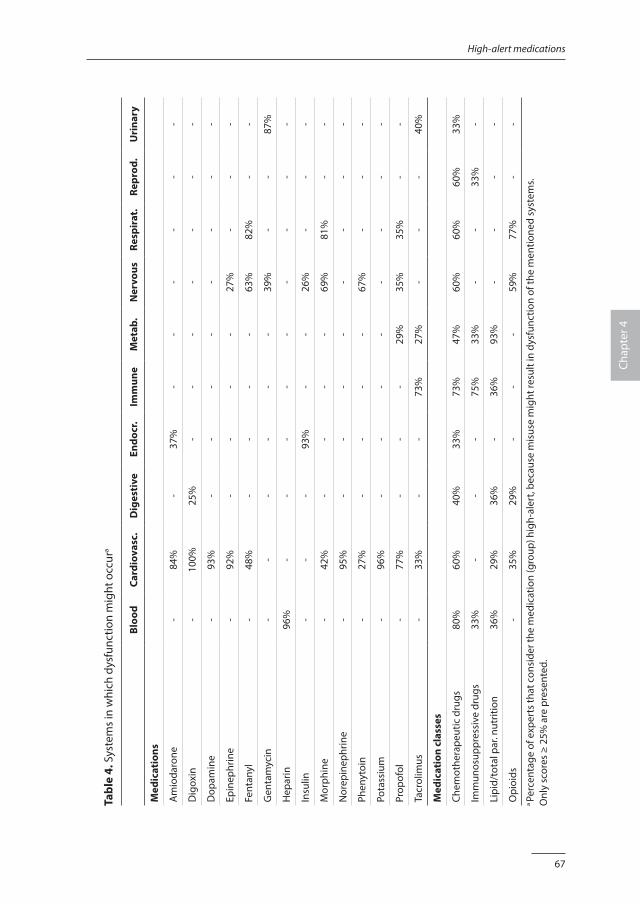
67
High-alert medications
Chap
ter 4
Tabl
e 4.
Sys
tem
s in
whi
ch d
ysfu
nctio
n m
ight
occ
ura
Bloo
d Ca
rdio
vasc
. D
iges
tive
En
docr
.Im
mun
e M
etab
.N
ervo
us
Resp
irat
.Re
prod
. U
rina
ry
Med
icat
ions
Am
ioda
rone
-84
%-
37%
--
--
--
Dig
oxin
-10
0%25
%-
--
--
--
Dop
amin
e-
93%
--
--
--
--
Epin
ephr
ine
-92
%-
--
-27
%-
--
Fent
anyl
-48
%-
--
-63
%82
%-
-
Gen
tam
ycin
--
--
--
39%
--
87%
Hep
arin
96%
--
--
--
--
-
Insu
lin-
--
93%
--
26%
--
-
Mor
phin
e-
42%
--
--
69%
81%
--
Nor
epin
ephr
ine
-95
%-
--
--
--
-
Phen
ytoi
n-
27%
--
--
67%
--
-
Pota
ssiu
m-
96%
--
--
--
--
Prop
ofol
-77
%-
--
29%
35%
35%
--
Tacr
olim
us-
33%
--
73%
27%
--
-40
%
Med
icat
ion
clas
ses
Chem
othe
rape
utic
dru
gs80
%60
%40
%33
%73
%47
%60
%60
%60
%33
%
Imm
unos
uppr
essi
ve d
rugs
33%
--
-75
%33
%-
-33
%-
Lipi
d/to
tal p
ar. n
utrit
ion
36%
29%
36%
-36
%93
%-
--
-
Opi
oids
-35
%29
%-
--
59%
77%
--
a Pe
rcen
tage
of e
xper
ts th
at c
onsi
der t
he m
edic
atio
n (g
roup
) hig
h-al
ert,
beca
use
mis
use
mig
ht re
sult
in d
ysfu
nctio
n of
the
men
tione
d sy
stem
s.O
nly
scor
es ≥
25%
are
pre
sent
ed.
68
Chapter 4
Additional informationThe experts considered the listed medications to high-alert for all routes of administration, but considered intravenous administration as an increased risk for patients. Regarding the age of the patients, most experts considered the included medications to be high-alert for all ages. Neonates and infants were believed to be at higher risk than older children. The experts also indicated the organ systems which are most affected in case of misuse. These results are summarized in Table 4. We analyzed the process of reaching consensus by comparing the dispersion of the results between the first and second experts’ opinions. The mean SD changed from 0.98 to 0.75 and the mean range changed from 3.29 to 2.89. This indicates that during the Delphi process the variation in the opinions decreased and the consensus increased.
ValidationWe analyzed all medication incident reports for children from 43 hospitals in the Netherlands, submitted to the CMR in the period April 2010 – September 2012. In total 1064 reports were analyzed regarding medication and patient harm related to the incidents. Of the 18 medications and medication classes on the high-alert list, 4 (22%) were confirmed with incidents that resulted in serious temporary harm or worse, while 9 (50%) were confirmed with incidents that were considered potentially harmful , i.e. they could have resulted in serious temporary harm or worse.
DISCUSSION
In this Delphi study, experts from 13 countries generated a list of high-alert medications for a pediatric inpatient population. Such medications are considered to cause patient harm when misused due either to a narrow therapeutic window or to serious adverse events in the past. Our finding that epinephrine [4,9,14], norepinephrine [9] and dopamine [9,12,14,15] should be considered as high-alert medications for children is consistent with previous publications. We also found a high level of consensus on the medication class opioids [9,32,33], and more specifically for the medications morphine [4,32] and fentanyl [12-15]. In addition, the medications digoxin [4,9,14,15,34], heparin [4,9,12,14,15,35], insulin [9,12-15] and potassium [9,12-14,36] have been reported as high-alert in several publications. Chemotherapeutic drugs [9], total parenteral nutrition [4,9,37], amiodarone [9] and propofol [9] were also identified previously as high-alert, and fatal incidents were reported on tacrolimus and phenytoin [4]. However, we did not find any publications that described gentamycin and the medication class immunosuppressive drugs as high-alert. Despite the fact that salbutamol [12,13], ceftriaxone [12] and
69
High-alert medications
Chap
ter 4
propanolol [15] have been reported as high-alert medications for children, we reached only limited consensus on these medications in our study. We compared the medications defined as high-alert in our study to the list of high-alert medications of the ISMP. Out of the 14 medications on our list, 11 are also on the ISMP list. Moreover, 3 of the high-alert medication classes on our list are similar to the medication classes on the ISMP list [9]. The limited consensus on several medications might be explained by the international character of the expert group, reflecting different medication practices in their countries of origin. Therefore, it is important to realize that many factors contribute to the risk profile of a medication, such as the toxic features, the availability of more than one preparation or dose strength of the same medication, the availability of preparations for different routes of administration of a same medication, dosages that require conversion of unit, calculations or serial dilutions. The high-alert classification is also dependent on dosage, the familiarity of the healthcare professionals with the medication and the possibility of careful monitoring. These situations might differ in various countries, resulting in different risk profiles for the same medication. Consequently, despite the absence of full consensus, it is still worthwhile to evaluate the risk profiles of the excluded medications on a national and institutional level. The list, resulting from this study, should be used only as a starting point as individual hospitals develop their own high-alert list. Therefore, we stress a careful local review of how the list relates to specific risks for a hospital. Error reports, literature on medication safety and national incidents registrations (if available) should be used to review the hospital list on a regular base [11]. Delphi processWe performed an international modified Delphi study to reach consensus on a subject on which empirical evidence is difficult to collect. In this situation, the Delphi technique is a validated and accepted methodology, because it gives equal weight to the opinion of each expert and avoids domination by one expert in the consensus process [19]. In addition, the Delphi method allows anonymous participation of experts across various countries and with different backgrounds [19]. Although our study consisted of three rounds, medications and medication classes were only presented to the experts twice. To explore the change in opinions towards consensus, we followed the recommendations of Holey et al. and determined the standard deviations and ranges that express the group agreement in each round [38]. The decrease in standard deviations and ranges between the first and second expert ratings indicates a trend towards consensus. Nevertheless, another round might have increased the consensus even more.
70
Chapter 4
Low response rates in research using questionnaires are a recognized problem, and response rates lower than 70% should be investigated for potential non-response bias [39]. Fortunately, we reached high response rates in every round and therefore consider our results to be robust. Possible reasons for the high response rate may be the explicit consent for participation, resulting in a panel of experts who recognized the importance of the topic and considered themselves to be partners in the study. Also, the quick turnaround time, the clear timeframe and the personalized reminders might have kept the experts interested. Because no standard threshold for consensus was available [19], we based the 75% threshold in this study on face validity of the results of the first round. Our final results show that this threshold is disputable, with consensus levels just under or just above the predefined threshold. Therefore, we presented all medications with this level of consensus, allowing healthcare professionals to consider the list in their specific situations. ExpertsThe heterogeneity of the experts in terms of profession and country of origin made it potentially more difficult to achieve consensus. However, the selection was based on what we judged appropriate for an adequate, international representation, which we believe strengthens our findings. Although we tried to have all continents represented, the experts in the final group predominantly came from the USA or European countries. Most participants originated from the United Kingdom (29%), the Netherlands (21%) or the USA (18%). Experts from Asia, South America, Africa and Oceania were absent in our study. This could limit the generalizability of our results. ValidationNo standard exists to establish the validity of the Delphi method, but the assumed validity is part of the Delphi process itself, due to successive rounds (concurrent validity) and by achieving consensus within a group of experts (content validity) [40,41]. In addition, we increased the credibility of our results by comparing them with national medication incidents in children that resulted in patient harm or were reported as potential harmful.
Applications and suggestions for future researchCreating a list of high-alert medication alone does not prevent patient harm. However, knowing which medications pose serious risks to children allows healthcare organizations to develop and implement risk-reduction interventions. These interventions should focus on additional safeguards throughout the entire medication process for high-alert
71
High-alert medications
Chap
ter 4
medications and pay attention to the specific safety threats for children. Several studies have demonstrated a reduction in MEs after the introduction of a computerized physician order entry system (CPOE) [42-44] and computerized clinical decision support [42,45]. An additional strategy to reduce prescribing errors could be to limit access to high-alert medication to special trained and experiences staff, a measure that can be implemented by special authorizations in CPOE. Furthermore the prescribing stage of high-alert medication should be supported by standardized prescriptions, a weight-based dosage calculator and preventing overdosage by implementing maximum dosing. In the administering stage risk reduction might be achieved by barcode technology [46,47], that also should be limited to special authorized staff in case of high-alert medication. Additional risk-reduction measures in the administering stage are described as “fail safes”, for example smart pumps or different syringes for oral and intravenous tubes [48]. The involvement of clinical pharmacists has proven to increase medication safety [49,50]. They can play an essential role in the medication process of high-alert medication by performing the preparation of high-alert medication and providing staff with timely consultation. Clinical pharmacist also should initiate standardization and monitoring high-alert medications. Double checking is assumed to reduce MEs and is nowadays standard nursing policy [51]. Indeed, nursing staff believe that double checking, if done properly, increases medication safety. Unfortunately, practical problems hamper the double checking process, for example interruptions, staff shortages or an emergency situation, and some nurses prefer double checking limited to high-risk patients and high-alert medications [51,52]. Prevention strategies such as the use of a unit dose dispensing system, dedicated nurses and the involvement of parents might contribute to medication safety, but robust evidence is limited [53-55]. Obviously, a fair number of risk-reduction strategies are described, although some are considered more effective than others [48]. For example, maximizing access to information and limited access to high-alert medication seem to be better safeguards than education and the use of reminders [48]. A combination of different strategies is recommended to reach an optimal effect, include all stages of the medication process and reach all healthcare professionals involved [10,48]. In addition, interventions like executive walk rounds and communication tools, aiming to create a positive patient safety culture should be considered, as this has been reported to be associated with enhanced patient safety [56,57]. Successful implementation of ISMP recommended high-alert interventions into clinical practice have been reported [26,52]. The next step will be to underpin these interventions and their implementation with evidence, based on sound methodology [58]. Our list of high-alert medications should be viewed as a dynamic list that needs regular updates. New medications, new formularies and growing knowledge on
72
Chapter 4
medication safety for children might have implications for the list presented in our study. Sharing knowledge of harmful incidents, for example via national incidents registrations, should be used as a valuable supplement to scientific research.
CONCLUSION
In a three-round Delphi study, consensus was reached on 14 medications and 4 medication classes that are considered high-alert for children. Medications and medication classes on which consensus was less than our threshold of 75% still might be handled as high-alert, depending on local situations. Our results might be helpful as a starting point as individual hospitals develop their own high-alert list.
AcknowledgementsWe would like to thank the experts for taking part in the Delphi procedures (Appendix). We also thank Elvira Zwart for helping us to identify experts and Arianne van Rhijn and David Opstelten for their support with the validation.
FundingNeither this research project nor the authors received any grant from any agency in the public, commercial or not-for-profit sector.
73
High-alert medications
Chap
ter 4
REFERENCES1. de Vries EN, Ramrattan MA, Smorenburg SM, et al. The incidence and nature of in-hospital adverse events:
a systematic review. Qual Saf Health Care 2008;17:216-223.
2. Zegers M, de Bruijne MC, Wagner C, et al. Adverse events and potentially preventable deaths in Dutch hospitals: results of a retrospective patient record review study. Qual Saf Health Care 2009;18:297-302.
3. Kale A, Keohane CA, Maviglia S, et al. Adverse drug events caused by serious medication administration errors. BMJ Qual Saf 2012;21:933-938.
4. Cousins D, Clarkson A, Conroy S, et al. Medication errors in children - an eight year review using press reports. Paed Perinat Drug Ther 2002;5:52-58.
5. Kaushal R, Bates DW, Landrigan C, et al. Medication errors and adverse drug events in pediatric inpatients. JAMA 2001;285:2114-2120.
6. von Laue NC, Schwappach DL, Koeck CM. The epidemiology of preventable adverse drug events: a review of the literature. Wien Klin Wochenschr 2003;115:407-415.
7. Kunac DL, Kennedy J, Austin N, et al. Incidence, preventability, and impact of Adverse Drug Events (ADEs) and potential ADEs in hospitalized children in New Zealand: a prospective observational cohort study. Paediatr Drugs 2009;11:153-160.
8. Landrigan CP, Parry GJ, Bones CB, et al. Temporal trends in rates of patient harm resulting from medical care. N Engl J Med 2010;363:2124-2134.
9. Institute for Safe Medication Practices. High Alert Medications. Available: www.ismp.org/tools/institutionalhighAlert.asp, accessed June 2013.
10. Federico F. Preventing harm from high-alert medications. Jt Comm J Qual Patient Saf 2007;33:537-542.
11. Joint Commission International Accreditation Standards for Hospitals (including standards for academic medical center hospitals), 4the edition, Joint Commission Resources, Oakbrook Terrace, Illinois 60181, United States of America, 2012.
12. Santell JP, Hicks R. Medication errors involving pediatric patients. Jt Comm J Qual Patient Saf 2005;31:348-353.
13. Colquhoun M, Orrbine E, Sheppard I, et al. National collaborative: Top five drugs reported as causing harm through medication error in pediatrics. Dynamics 2009;20:20-22.
14. Franke HA, Woods DM, Holl JL. High-alert medications in the pediatric intensive care unit. Pediatr Crit Care Med 2009;10:85-90.
15. Stavroudis TA, Shore AD, Morlock L, et al. NICU medication errors: identifying a risk profile for medication errors in the neonatal intensive care unit. J Perinatol 2010;30:459-468.
16. Jones J, Hunter D. Consensus methods for medical and health services research. BMJ 1995;311:376-380.
17. Akins RB, Tolson H, Cole BR. Stability of response characteristics of a Delphi panel: application of bootstrap data expansion. BMC Med Res Methodol 2005;5:37-49.
18. Edwards PJ, Roberts I, Clarke MJ, et al. Methods to increase response to postal and electronic questionnaires. Cochrane Database Syst Rev 2009, Issue 3. Art. No.: MR000008. DOI: 10.1002/14651858.MR000008.pub4.
19. Keeney S, Hasson F, McKenna H. Consulting the oracle: ten lessons from using the Delphi technique in nursing research. J Adv Nurs 2006;53:205-212.
20. Alexander DC, Bundy DG, Shore AD, et al. Cardiovascular medication errors in children. Pediatrics 2009;124:324-332.
21. Blix HS, Viktil KK, Reikvam A, et al. The majority of hospitalised patients have drug-related problems: results from a prospective study in general hospitals. Eur J Clin Pharmacol 2004;60:651-658.
22. Brown M. Medication safety issues in the emergency department. Crit Care Nurs Clin North Am 2005;17:65-69.
23. Ferranti J, Horvath MM, Cozart H, et al. Reevaluating the safety profile of pediatrics: a comparison of computerized adverse drug event surveillance and voluntary reporting in the pediatric environment. Pediatrics 2008;121:e1201-e1207.
74
Chapter 4
24. Rinke ML, Shore AD, Morlock L, et al. Characteristics of pediatric chemotherapy medication errors in a national error reporting database. Cancer 2007;110:186-195.
25. Trinkle R, Wu JK. Errors involving pediatric patients receiving chemotherapy: a literature review. Med Pediatr Oncol 1996;26:344-351.
26. Tham E, Calmes HM, Poppy A, et al. Sustaining and spreading the reduction of adverse drug events in a multicenter collaborative. Pediatrics 2011;128:e438-e445.
27. Juntti-Patinen L, Neuvonen PJ. Drug-related deaths in a university central hospital. Eur J Clin Pharmacol 2002;58:479-482.
28. Silva MD, Rosa MB, Franklin BD, et al. Concomitant prescribing and dispensing errors at a Brazilian hospital: a descriptive study. Clinics (Sao Paulo) 2011;66:1691-1697.
29. Billman G. Evidence-based improvements prevent high-risk errors. Harm isn’t random. J Nurs Adm 2004;34:7-8 (suppl).
30. Johnston PE, France DJ, Byrne DW, et al. Assessment of adverse drug events among patients in a tertiary care medical center. Am J Health Syst Pharm 2006;63:2218-2227.
31. Bar-Oz B, Levichek Z, Koren G. Medications that can be fatal for a toddler with one tablet or teaspoonful: a 2004 update. Paediatr Drugs 2004;6:123-126.
32. Doherty C, McDonnell C. Tenfold medication errors: 5 years’ experience at a university-affiliated pediatric hospital. Pediatrics 2012;129:916-924.
33. Morton NS, Errera A. APA national audit of pediatric opioid infusions. Paediatr Anaesth 2010;20:119-125.
34. Afroukh N, Vasselon-Raina M, Hida H. Medication errors: analysis of a digoxin overdose case in neonatology unit. Archives de Pediatrie 2011;18:1076-1080.
35. Binder L, Wilson DF. Heparin overdose scare in 14 babies at Texas hospital. Healthcare Benchmarks Qual Improv 2008;15:89-90.
36. Grissinger M. Potassium chloride injection still poses threats to patients. Pharmacy and Therapeutics 2011;36:241, 302.
37. Hicks RW, Becker SC, Chuo J. A summary of NICU fat emulsion medication errors and nursing services: data from MEDMARX. Adv Neonatal Care 2007;7:299-308.
38. Holey EA, Feeley JL, Dixon J, et al. An exploration of the use of simple statistics to measure consensus and stability in Delphi studies. BMC Med Res Methodol 2007;7:52-62.
39. Bose J. Non response bias analyses at the National Center for Education Statistics. National Center for Education Statistics, Washington DC, Unites States of America, 2001.
40. Hasson F, Keeney S, McKenna H. Research guidelines for the Delphi survey technique. J Adv Nurs 2000;32:1008-1015.
41. Streiner DL, Norman GR. Health measurement scales: a practical guide to their development and use. Oxford: Oxford University Press, United Kingdom, 2002.
42. Kaushal R, Shojania KG, Bates DW, et al. Effects of computerized physician order entry and clinical decision support systems on medication safety: a systematic review. Arch Intern Med 2003;163:1409-1416.
43. Eslami S, de Keizer NF, Abu-Hanna A. The impact of computerized physician medication order entry in hospitalized patients: a systematic review. Int J Med Inform 2008;77:365-376.
44. Walsh KE, Landrigan CP, Adams WG, et al. Effect of computer order entry on prevention of serious medication errors in hospitalized children. Pediatrics 2008;121:e421-e427.
45. Durieux P, Trinquart L, Colombet I, et al. Computerized advice on drug dosage to improve prescribing practice. Cochrane Database Syst Rev 2008, Issue 3. Art. No.: CD002894. DOI: 10.1002/14651858.CD002894.pub2
46. Poon EG, Keohane CA, Yoon CS, et al. Effect of bar-code technology on the safety of medication administration. N Engl J Med 2010;362:1698-1707.
75
High-alert medications
Chap
ter 4
47. Morriss FH, Abramowitz PW, Nelson SP, et al. Effectiveness of a barcode medication administration system in reducing preventable adverse drug events in a neonatal intensive care unit: a prospective cohort study. J Pediatr 2009;154:363-368.
48. ISMP. Your high-alert medication list, relatively useless without associated risk reduction strategies. Available: www.ismp.org/newletters/acutecare, accessed June 2013.
49. Kaushal R, Bates DW, Abramson EL, et al. Unit-based clinical pharmacists’ prevention of serious medication errors in pediatric inpatients. Am J Health Syst Pharm 2008;65:1254-1260.
50. Zhang C, Zhang L, Huang L, et al. Clinical pharmacists on medical care of pediatric inpatients: a single-center randomized controlled trial. PLoS ONE [Electronic Resource] 2001;7:e30856.
51. Alsulami Z, Conroy S, Choonara I, et al. Double checking the administration of medicines: what is the evidence? A systematic review. Arch Dis Child 2012;97:833-837.
52. Graham S, Clopp MP, Kostek N, et al. Implementation of a high-alert medication program. Perm J 2008;12:15-22.
53. Miller MR, Robinson KA, Lubomski LH, et al. Medication errors in paediatric care: a systematic review of epidemiology and an evaluation of evidence supporting reduction strategy recommendations. Qual Saf Health Care 2007;16:116-126.
54. Chedoe I, Molendijk HA, Dittrich ST, et al. Incidence and nature of medication errors in neonatal intensive care with strategies to improve safety: a review of the current literature. Drug Saf 2007;30:503-513.
55. Conroy S, Sweis D, Planner C, et al. Interventions to reduce dosing errors in children: a systematic review of the literature. Drug Saf 2007;30:1111-1125.
56. Morello RT, Lowthian JA, Barker AL, et al. Strategies for improving patient safety culture in hospitals: a systematic review. BMJ Qual Saf 2013;22:11-18.
57. Weaver SJ, Lubomski LH, Wilson RF, et al. Promoting a culture of safety as a patient safety strategy: a systematic review. Ann of Intern Med 2013;158:369-374 (suppl).
58. Fan E, Laupacis A, Pronovost PJ, et al. How to use an article about quality improvement. JAMA 2010;304:2279-2287.
76
Chapter 4
APPENDIX. EXPERTS PARTICIPATING IN THE DELPHI ROUNDS
K Allegaert (University Hospitals Leuven), JN van den Anker (George Washington University School of Medicine and Health Sciences, Johns Hopkins University School of Medicine, Erasmus Medical Center-Sophia Children’s Hospital), D Apele-Feimane (State Agency of Medicines of Latvia, European Medicine Agency), CE de Beaufort (Clinique Pediatrique Luxembourg), l ten Berg-Lammers (Academic Medical Center Amsterdam), SM Chapman (Great Ormond Street Hospital for Children NHS Foundation Trust), AC Ceci (University of Bari), K Connolly (European Medicine Agency), MJ Doman (Plymouth University), FK Engels (Erasmus Medical Center-Sophia Children’s Hospital), F Federico (Institute for Healthcare Improvement), HA Franke (University of Arizona, University of Arizona Healthcare Network, Tucson Medical Center), M Ghaleb (University of Hertfordshire), JB van Goudoever (Emma Children’s Hospital - Academic Medical Center Amsterdam, VU Medical Center), KM Gura (Boston Children’s Hospital, Massachusetts College of Pharmacy & Health Sciences), M de Hoog (Erasmus Medical Center-Sophia Children’s Hospital), SM Jarvis (Bristol Royal Hospital for Children), J Jazbec (Medical Centre Ljubljana), MN Lub- de Hooge (University Medical Center Groningen), I Lutsar (University of Tartu), E la Mache (European Medicine Agency), J Mante (Great Ormond Street Hospital for Children), MR Miller (Johns Hopkins University), A Neubert (University Hospital Erlangen), K Norga (Antwerp University Hospital), AJ Nunn (Liverpool John Moores University) , M Offringa (Child Health Evaluative Sciences, Research Institute, The Hospital for Sick Children), H Rabe (Brighton & Sussex Medical School, Brighton & Sussex University Hospital), BA Semmekrot (Canisius-Wilhelmina Hospital Nijmegen), A Soe (Medway Maritime Hospital Kent) , S Thayyil (University College Hospital London), TW de Vries (Medical Centre Leeuwarden), SW Wang (Statens Legemiddelverk, Norwegian Medicines Agency).
Chapter 5
Interventions for reducing medication errors in children in hospital: a systematic review
Jolanda Maaskant Hester Vermeulen Bugewe Apampa Bernard Fernando Maisoon Ghaleb
Antje Neubert Sudhin Thayyil
Aung Soe
Adapted from Cochrane Database of Systematic Reviews 2015, Issue 3.
78
Chapter 5
ABSTRACT
IntroductionMany hospitalized patients are affected by medication errors (MEs) that may cause discomfort, harm and even death. Children are at especially high risk of harm as the result of MEs because such errors are potentially more hazardous to them than to adults. Until now, interventions to reduce MEs have led to only limited improvements. The objective of this study was to determine the effectiveness of interventions aimed at reducing MEs and related harm in hospitalized children.
MethodsWe searched 12 databases, six grey literature sources and two trial registries. In addition, we hand searched selected journals, contacted researchers and scanned reference lists of relevant reviews. The searches were conducted in November 2013 and November 2014. We applied neither language nor date limits. We included randomized controlled trials, controlled before-after studies and interrupted time series. Participants were healthcare professionals authorized to prescribe, dispense or administer medications. Outcome measures included MEs, (potential) patient harm, resource utilization and unintended consequences of the interventions. Two review authors independently selected studies, extracted data and assessed study quality. We evaluated the risk of bias and used the Grades of Recommendation, Assessment, Development and Evaluation (GRADE) approach to assess the quality of the body of evidence.
ResultsWe included seven studies describing five different interventions: participation of a clinical pharmacist (n = 2), a computerized physician order entry system (n = 2), a barcode medication administration system (n = 1), a structured prescribing form (n = 1) and a check & correct checklist in combination with feedback (n = 1). Clinical and methodological heterogeneity between studies precluded meta-analyses. Although some interventions described in this review show a decrease in MEs, the results are not consistent, and none of the studies resulted in a significant reduction in patient harm. The overall quality and strength of the evidence are low.
ConclusionCurrent evidence on effective interventions to prevent MEs in a pediatric population in hospital is limited. Comparative studies with robust study designs are needed to investigate interventions including components that focus on specific pediatric safety issues.
79
Interventions for reducing medication errors
Chap
ter 5
INTRODUCTION
An adverse drug event (ADE) is an unwanted occurrence after exposure to a drug that is not necessarily caused by the drug itself [1]. Adverse drug events include adverse drug reactions (ADRs) and medication errors (MEs). An ADR is defined as any response to a drug that is noxious and unintended and that occurs at doses normally used for prevention, diagnosis or therapy of a disease [1]. ADRs may result from an exaggerated response to a drug (e.g. bronchospasm with beta blockers) or from an idiosyncratic reaction to a drug (e.g. penicillin allergy) [2]. No uniform definition of a ME is currently being used, despite efforts to develop an international definition [3-5], but most studies use the definition of the National Coordinating Council for Medication Error Reporting and Prevention (NCC MERP) [6]. The NCC MERP defines a ME as “any preventable event that may cause or lead to inappropriate medication use or patient harm while the medication is in the control of the healthcare professional, patient or consumer” [7]. MEs are one of the most frequent causes of adverse events in hospitalized patients [8,9]. The Institute of Medicine estimates that, on average, hospitalized patients are subject to at least one ME per day [10]. Although human error is often the immediate cause of MEs, most errors are due to system failures precipitated by the increasing complexity of patient care [11,12]. In fact, ADEs can be described as an emergent property of a particularly complex healthcare system such as a hospital or a pediatric ward within a hospital [8]. A systematic review of the incidence and nature of MEs in pediatric patients shows a wide distribution in results [13]. These results might be explained by variation in definitions, choice of denominator, study population or study design and the error detection method used [6,14-17]. Despite variability in the incidence of MEs, children still are considered to be at higher risk of experiencing an ADE. Kaushal et al. found that the frequency of potentially harmful MEs was three times higher in pediatric patients than in adults [18]. Pharmacological factors such as age-based variability in absorption, metabolism and excretion of drugs pose special vulnerabilities to the risk of overdosing among children as compared with adults. Dosage calculations in children are much more prone to human error because of the constant need for weight and surface area-based dosing and unit conversion to reflect the very small doses required [19]. Therefore, types of pediatric MEs and the interventions necessary to prevent them are different from those involving adults. In a primary care setting, the processes involved in medication use can be quite different from those seen in a hospital setting. For example, prescribing in primary care may involve diverse personnel operating from different sites with differing accountabilities. This review, therefore, examined MEs in children in a hospital setting only.
80
Chapter 5
ObjectivesTo determine the effectiveness of interventions aimed at reducing MEs and related harm in hospitalized children.
METHODS
Criteria for considering studies for this review.Types of studiesRandomized controlled trials (RCT), controlled clinical trials (CCT), controlled before-after (CBA) studies and interrupted time series (ITS) studies. We used the definitions in the Cochrane Handbook for Systematic Reviews of Interventions [20].
Randomized controlled trial (RCT)A study in which “the author(s) state explicitly (usually by some variant of the term “random” to describe the allocation procedure used) that the groups compared in the trial were established by random allocation...” (Box 6.3.a).
Controlled clinical trial (CCT)“A study in which the intervention’s assignment is either quasi-random (for example when assignment is based on date of birth or medical record number) or the trial does not state explicitly that the trial was randomized, but randomization cannot be ruled out” (Box 6.3.a).
Controlled before-after study (CBA)“A study in which observations are made before and after the implementation of an intervention, both in a group that receives the intervention and in a control group that does not” (Box 13.1.a).
Interrupted time series study (ITS)“A study that uses observations at multiple time points before and after an intervention (the interruption). The design attempts to detect whether the intervention has had an effect significantly greater than any underlying trend over time” (Box 13.1.a).
We included CBA studies only if they had contemporaneous data collection, appropriate choice of control site and a minimum of two interventions and two control sites [20]. ITS studies were only included when they described a clearly defined point in time when the intervention occurred and at least three data points before and three data points after the intervention [20]. We included unpublished studies, and we imposed no limitations on language or date of publication.
81
Interventions for reducing medication errors
Chap
ter 5
Types of participantsHealthcare professionalsWe included studies of healthcare professionals who are authorized to prescribe, dispense or administer medications, and who are involved in the provision of hospital care to children (≤ 18 years). We excluded studies reporting misuse of medication by participants (e.g. suicide with use of medication, compliance issues).
SettingStudies based in all settings that provide clinical care to children in hospital: inpatient care (in secondary or tertiary units, intensive care units, operation theatres), outpatient care and accident and emergency department care.
Types of interventionsWe included interventions applied in hospital care to improve patient safety in terms of MEs. Studies might describe one intervention or a package of interventions that we refer to as multi-faceted. We did not include interventions designed solely to change the volume of prescribing (e.g. reducing vancomycin dosage in neonatal units, increasing surfactant dosage in neonatal respiratory distress syndrome). We categorized interventions according to the Cochrane EPOC taxonomy of interventions: professional, financial, organizational or regulatory interventions [20].
Types of outcome measuresPrimary outcome measures· Occurence of MEs as proportions of participants, admission days, prescriptions and
administrations.· Occurrence of (potentially) harmful MEs as proportions of participants, admission
days, prescriptions and administrations, defined as categories E t/m I (NCC MERP). MEs can cause serious harm and are potentially lethal [21,22]. Reduction in (potential) harm is therefore also an important outcome measure for this review.
Secondary outcome measures· Resource utilization (costs and length of stay in hospital). MEs are associated with
extended length of admission and higher associated costs [23-25]. We therefore reviewed resource utilization in terms of length of stay in hospital and costs.
· Unintended consequences of the intervention. It is possible that whilst overall MEs may be reduced by the use of various technological interventions, especially with computerized ordering, serious adverse effects may not be reduced and could even be increased by elimination of the human barrier. Therefore, these outcomes were examined separately.
82
Chapter 5
Comparison groups were given any other intervention, no intervention or usual care. Because different definitions were used to describe MEs, we explicitly cite the definitions used in the studies included in this review.
Search methods for identification of studiesMichelle Fiander, Trials Search Coordinator (TSC) for the EPOC group, developed search strategies in consultation with the review authors. The TSC searched the Cochrane Database of Systematic Reviews and the Database of Abstracts of Reviews of Effects (DARE) for related systematic reviews, and the databases listed below for primary studies. Searches were conducted in November 2013, and an update of searches in the main databases was conducted in November 2014. Two methodological search filters were used to limit retrieval to appropriate study designs: the Cochrane Highly Sensitive Search Strategy (sensitivity- and precision-maximizing version, 2008 revision) to identify randomized trials, and an EPOC methodology filter to identify non-RCT designs. Neither date nor language restrictions were used. Duplicates were removed from the databases electronically.
Databases· Evidence-Based Medicine (EBM) Reviews, Cochrane Central Register of Controlled
Trials (November 2014), Ovid SP.· Cochrane Central Register of Controlled Trials (CENTRAL) (2014, Issue 11), Wiley.· EBM Reviews, Health Technology Assessment (3rd Quarter 2014), Ovid SP.· EBM Reviews, National Health Service (NHS) Economic Evaluation Database (3rd
Quarter 2014), Ovid SP.· MEDLINE (1947-), In-Process and other non-indexed citations (1946-2014), Ovid SP.· MEDLINE Daily Update (November 2014), Ovid SP.· EMBASE (1947-2014), Ovid SP.· CINAHL (Cumulative Index to Nursing and Allied Health Literature) (1980-),
EbscoHost.· EPOC Group, Specialised Register.· ProQuest Dissertations & Theses Full Text.· ProQuest Nursing & Allied Health database.· PsycInfo (1806-), Ovid SP.· Conference Proceedings Citation Index-Science (CPCI-S) (1990-2014), Web of
Science.· Conference Proceedings Citation Index-Social Science & Humanities (CPCI-SSH)
(1990-2014), Web of Science.
83
Interventions for reducing medication errors
Chap
ter 5
Grey literatureWe conducted a grey literature search to identify studies not indexed in the databases listed above. Sources included the sites listed below.· Agency for Healthcare Research and Quality (AHRQ) at www.ahrq.gov/.· Grey Literature Report (New York Academy of Medicine) at http://greylit.org/.· Joanna Briggs Institute at http://www.joannabriggs.edu.au/Search.aspx.· National Institute for Health and Clinical Excellence (NICE) at www.nice.org.uk/.· National Research Register (NRR) Archive (up to 2007) at http://www.nihr.ac.uk/
Pages/NRRArchive.aspx.· Open Grey at http://www.opengrey.eu/.
Trial registriesWe searched the following registries:· ClinicalTrials.gov, US National Institutes of Health (NIH) at http://clinicaltrials.gov/.· International Clinical Trials Registry Platform (ICTRP), World Health Organization
(WHO) at http://www.who.int/ictrp/en/.
We also hand searched reference lists of all included studies, relevant systematic reviews and other relevant publications, and contacted authors of relevant studies or reviews to clarify reported published information and to seek unpublished data.
Data collection and analysisScreeningTwo review authors (JM and HV) independently screened the search results at three levels: titles, abstracts to assess which studies satisfied the inclusion criteria and full-text copies of papers that were potentially relevant. If we could not assess the paper for relevance based on title or abstract, we obtained the full text. JM and HV also examined grey literature and trial registries independently. We resolved discrepancies in the process of screening by discussion or referred to the arbitrator (AS). Data from research published in duplicate were included only once.
Data abstractionTwo review authors (JM and HV) working independently extracted data from each article using the EPOC data collection checklist [26]. We resolved discrepancies by discussion or referred to the arbitrator (AS). We contacted investigators for missing data.
84
Chapter 5
QualityAssessment of the risk of bias in included studiesQuality assessment for included studies was supported by suggested risk of bias criteria for EPOC reviews [27]. For included RCTs and CBAs, we used the following criteria: allocation sequence, concealment of allocation, similar baseline outcome measurements, similar baseline characteristics, completeness of outcome data, blinding, protection against contamination, freedom from selective outcome reporting and anything else that might underestimate or overestimate the results. For ITS studies, we used the following criteria: protection against secular changes, prespecification of the shape of the intervention, data collection independent of the intervention, blinding, completeness of the dataset, freedom from selective outcome reporting and any other factors that might have underestimated or overestimated the results (e.g. an explicit rationale for the number and spacing of data points, appropriate time-series analysis) [28].For all included studies, we explicitly evaluated the reliability of outcomes. Obtaining reliable outcome measure(s) for MEs is dependent on the method used. Full review of participant files is considered more sensitive than, for example, voluntary incident reports [16,17]. In the literature, a multi-faceted approach is recommended [29]. In the included studies, we found full review of participant records, voluntary incident reports and a combination. This might have influenced the study findings. A different way to assess the reliability of the outcome is the interrater reliability expressed in kappa’s. EPOC defines a threshold of 0.80. In this systematic review, we combined these two elements. When a study reported full review of participants records or a combination of full review and voluntary incident reports, plus a kappa > 0.80, we considered this study as having low risk of bias for this criterion. When study report full review of participant records or a combination of full review and voluntary incident reports, plus a kappa < 0.80, we considered this criterion as showing high risk of bias. When a study used only voluntary incident reports to assess outcome measures, we considered this study always as having high risk of bias for this criterion. Two review authors (JM and HV) assessed risk of bias independently and resolved discrepancies by discussion. An arbitrator (AS) was available for consultation in the case of persistent disagreement.
Assessment of reporting biasA thorough search of the grey literature and contact with known experts in the field reduced the influence of publication bias on our review.
85
Interventions for reducing medication errors
Chap
ter 5
ReportingWe tabulated data in natural units for each study. We report (pre-intervention and post-intervention) means or proportions when results were available for both intervention and control groups from RCTs and CBAs. We calculated the absolute change from baseline with the 95% confidence limit. For ITS studies, we report the main outcomes in natural units with two indicators of effects of the intervention: change in the level of outcome immediately after the intervention, and change in the slope of the regression lines.
Analytical approachPrimary analysisWe based the primary analyses on consideration of outcome measures. When studies reported more than one measure for each endpoint, we extracted the outcome measures meeting the aims of our review. We present the results for all comparisons using a standard method of presentation, when possible. For comparisons of RCTs and CBAs, we planned to report for each study design the median, the interquartile range and/or the range of effect sizes across included studies. However, the studies were heterogeneous in terms of methods of analysis used. Therefore, we present the results as presented by study authors. We contacted the first study author for clarification or additional information, when necessary.Secondary analysisWe planned secondary analyses to explore the consistency of the primary analyses with other types of endpoints. We planned to standardize effect sizes for continuous measures by dividing the difference in mean scores between intervention and control groups in each study through an estimate of the (pooled) standard deviation. However, this was never appropriate in the included studies.
Methods for reanalysisWe aimed to present the results in a comparable way and therefore re-analyzed included RCTs and CBAs, when possible, by recalculating results using the appropriate unit of analysis. We contacted the authors of such studies for clarification, when necessary. We reported heterogeneity of included studies in terms of settings, interventions, outcome assessments and outcome measures. We considered statistical meta-analysis only for studies that were similar in these terms. We examined data from ITS studies with unit of analysis errors according to EPOC guidelines.
86
Chapter 5
Summary of findingsWe used the GRADE approach to assess the quality of the body of evidence for outcomes, to interpret results and to draw conclusions about the effects (benefits, potential harms and costs) of different interventions, including size of effect and quality of the evidence for outcomes for which evidence was found [30,31]. We present evidence summaries for the main comparisons of the review in a “Summary of findings” table.
Ongoing studiesWe describe ongoing studies, detailing the primary author, research question(s), methods and outcome measures, and provide an estimate of the reporting date.
RESULTS
Description of studiesResults of the searchSearches of the main electronic databases led to identification of 5,182 titles. After independent examination of titles and abstracts by JM and HV, 90 titles and abstracts were left for further discussion. We decided on 28 articles potentially eligible for the review, given the predefined inclusion criteria. We excluded 18 studies after full-text assessment and found that seven studies met the inclusion criteria of the review and of the Cochrane EPOC group. We contacted the authors of three remaining studies for additional information, resulting in exclusion of all three studies. Hand searching of the references listed in the seven included studies, as well as of systematic reviews, reviews and overviews that we found in searches of the main electronic databases, did not yield new studies. A search of the grey literature and of trials registries also did not yield new articles, but we included one ongoing study that is potentially eligible for the review in the future. We provide an overview of the selection process in Figure 1. We present the Medline search strategy in Appendix 1. The full search strategy has been published in the Cochrane Database of Systematic Reviews.
Included studiesSee Appendix 2-8: Characteristics of included studies.
Methods (design)We included in this review two RCTs [32,33], two ITS studies [34,35] and three CBAs [36-38].
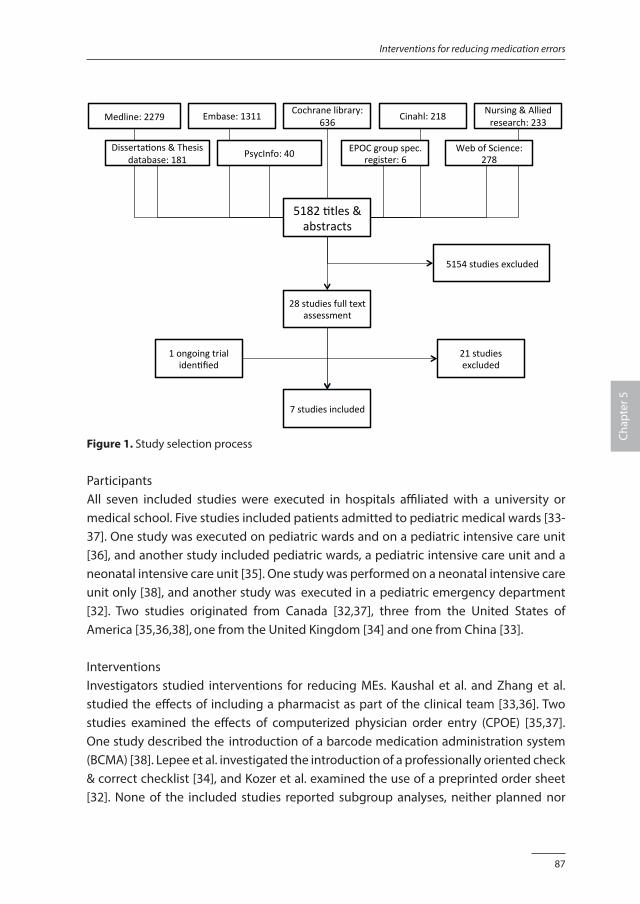
87
Interventions for reducing medication errors
Chap
ter 5
Medline:2279
Disserta1ons&Thesis
database:181
Embase:1311
Cochranelibrary:
636
Cinahl:218
Nursing&Alliedresearch:233
PsycInfo:40
EPOCgroupspec.register:6
WebofScience:278
51821tles&abstracts
7studiesincluded
28studiesfulltextassessment
1ongoingtrialiden1fied
21studiesexcluded
5154studiesexcluded
Figure 1. Study selection process
ParticipantsAll seven included studies were executed in hospitals affiliated with a university or medical school. Five studies included patients admitted to pediatric medical wards [33-37]. One study was executed on pediatric wards and on a pediatric intensive care unit [36], and another study included pediatric wards, a pediatric intensive care unit and a neonatal intensive care unit [35]. One study was performed on a neonatal intensive care unit only [38], and another study was executed in a pediatric emergency department [32]. Two studies originated from Canada [32,37], three from the United States of America [35,36,38], one from the United Kingdom [34] and one from China [33].
InterventionsInvestigators studied interventions for reducing MEs. Kaushal et al. and Zhang et al. studied the effects of including a pharmacist as part of the clinical team [33,36]. Two studies examined the effects of computerized physician order entry (CPOE) [35,37]. One study described the introduction of a barcode medication administration system (BCMA) [38]. Lepee et al. investigated the introduction of a professionally oriented check & correct checklist [34], and Kozer et al. examined the use of a preprinted order sheet [32]. None of the included studies reported subgroup analyses, neither planned nor
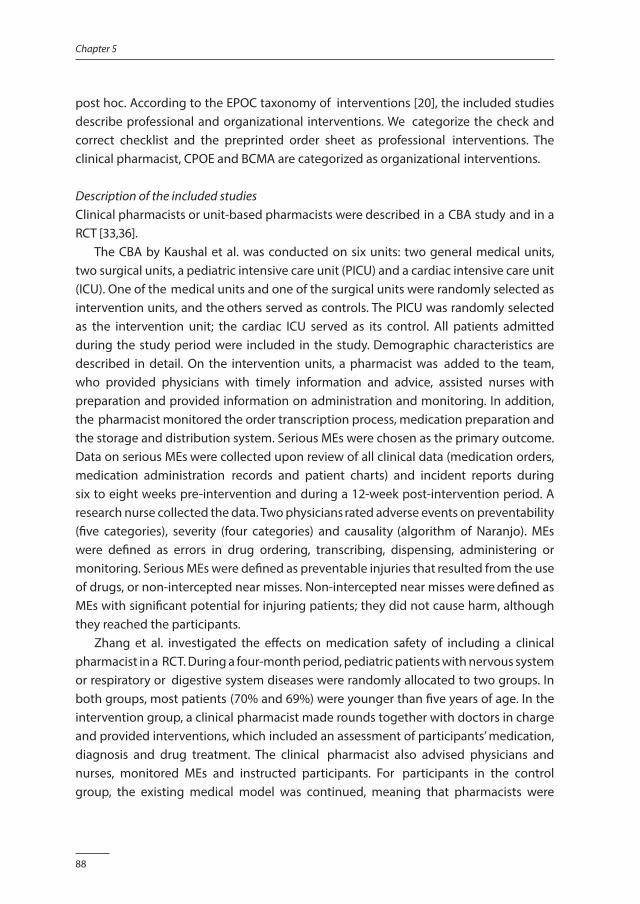
88
Chapter 5
post hoc. According to the EPOC taxonomy of interventions [20], the included studies describe professional and organizational interventions. We categorize the check and correct checklist and the preprinted order sheet as professional interventions. The clinical pharmacist, CPOE and BCMA are categorized as organizational interventions.
Description of the included studiesClinical pharmacists or unit-based pharmacists were described in a CBA study and in a RCT [33,36]. The CBA by Kaushal et al. was conducted on six units: two general medical units, two surgical units, a pediatric intensive care unit (PICU) and a cardiac intensive care unit (ICU). One of the medical units and one of the surgical units were randomly selected as intervention units, and the others served as controls. The PICU was randomly selected as the intervention unit; the cardiac ICU served as its control. All patients admitted during the study period were included in the study. Demographic characteristics are described in detail. On the intervention units, a pharmacist was added to the team, who provided physicians with timely information and advice, assisted nurses with preparation and provided information on administration and monitoring. In addition, the pharmacist monitored the order transcription process, medication preparation and the storage and distribution system. Serious MEs were chosen as the primary outcome. Data on serious MEs were collected upon review of all clinical data (medication orders, medication administration records and patient charts) and incident reports during six to eight weeks pre-intervention and during a 12-week post-intervention period. A research nurse collected the data. Two physicians rated adverse events on preventability (five categories), severity (four categories) and causality (algorithm of Naranjo). MEs were defined as errors in drug ordering, transcribing, dispensing, administering or monitoring. Serious MEs were defined as preventable injuries that resulted from the use of drugs, or non-intercepted near misses. Non-intercepted near misses were defined as MEs with significant potential for injuring patients; they did not cause harm, although they reached the participants. Zhang et al. investigated the effects on medication safety of including a clinical pharmacist in a RCT. During a four-month period, pediatric patients with nervous system or respiratory or digestive system diseases were randomly allocated to two groups. In both groups, most patients (70% and 69%) were younger than five years of age. In the intervention group, a clinical pharmacist made rounds together with doctors in charge and provided interventions, which included an assessment of participants’ medication, diagnosis and drug treatment. The clinical pharmacist also advised physicians and nurses, monitored MEs and instructed participants. For participants in the control group, the existing medical model was continued, meaning that pharmacists were
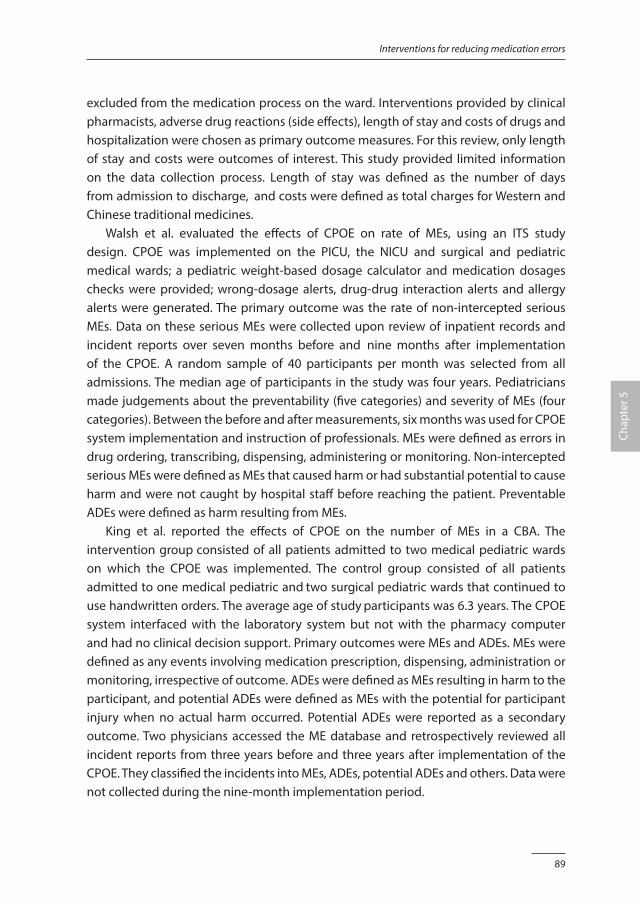
89
Interventions for reducing medication errors
Chap
ter 5
excluded from the medication process on the ward. Interventions provided by clinical pharmacists, adverse drug reactions (side effects), length of stay and costs of drugs and hospitalization were chosen as primary outcome measures. For this review, only length of stay and costs were outcomes of interest. This study provided limited information on the data collection process. Length of stay was defined as the number of days from admission to discharge, and costs were defined as total charges for Western and Chinese traditional medicines. Walsh et al. evaluated the effects of CPOE on rate of MEs, using an ITS study design. CPOE was implemented on the PICU, the NICU and surgical and pediatric medical wards; a pediatric weight-based dosage calculator and medication dosages checks were provided; wrong-dosage alerts, drug-drug interaction alerts and allergy alerts were generated. The primary outcome was the rate of non-intercepted serious MEs. Data on these serious MEs were collected upon review of inpatient records and incident reports over seven months before and nine months after implementation of the CPOE. A random sample of 40 participants per month was selected from all admissions. The median age of participants in the study was four years. Pediatricians made judgements about the preventability (five categories) and severity of MEs (four categories). Between the before and after measurements, six months was used for CPOE system implementation and instruction of professionals. MEs were defined as errors in drug ordering, transcribing, dispensing, administering or monitoring. Non-intercepted serious MEs were defined as MEs that caused harm or had substantial potential to cause harm and were not caught by hospital staff before reaching the patient. Preventable ADEs were defined as harm resulting from MEs. King et al. reported the effects of CPOE on the number of MEs in a CBA. The intervention group consisted of all patients admitted to two medical pediatric wards on which the CPOE was implemented. The control group consisted of all patients admitted to one medical pediatric and two surgical pediatric wards that continued to use handwritten orders. The average age of study participants was 6.3 years. The CPOE system interfaced with the laboratory system but not with the pharmacy computer and had no clinical decision support. Primary outcomes were MEs and ADEs. MEs were defined as any events involving medication prescription, dispensing, administration or monitoring, irrespective of outcome. ADEs were defined as MEs resulting in harm to the participant, and potential ADEs were defined as MEs with the potential for participant injury when no actual harm occurred. Potential ADEs were reported as a secondary outcome. Two physicians accessed the ME database and retrospectively reviewed all incident reports from three years before and three years after implementation of the CPOE. They classified the incidents into MEs, ADEs, potential ADEs and others. Data were not collected during the nine-month implementation period.
90
Chapter 5
The CBA by Morriss et al. investigated the effects of a BCMA on MEs in a NICU. The BCMA supported the process of drug administration by verifying the drug, dose, route, time and frequency and participant identification after scanning the barcode on the participant’s wristband and the unit-dose medication. During the first 19 weeks of the study, none of the beds were equipped with a BCMA system. During a second period of 12 weeks, half of randomly chosen beds on two similar units were equipped (two intervention groups), with the other half acting as controls (two control groups). In the last period of the study, lasting 19 weeks, all beds were equipped with the BCMA system. All patients admitted during the study periods were participants. The gestational age of participants was 34.5 (standard deviation 4.8) weeks. Primary outcomes were targeted preventable ADEs. Effects on MEs and potential ADEs were also reported. MEs were defined as errors in drug ordering, transcribing, dispensing, administering or monitoring. A preventable ADE was defined as harm to a participant resulting from a ME. A potential ADE was defined as a ME that could have harmed a participant but did not because it was intercepted, or because the participant did not experience harm. Targeted preventable ADEs were defined as MEs that were expected to be prevented by the BCMA system. Data were collected from medical records and incident reports by two pediatric nurse practitioners. A team that consisted of a neonatologist, two pharmacists and a pediatric clinical pharmacist made final judgements about the preventability and severity of MEs using the classification of the National Coordinating Council for Medication Error Reporting and Prevention (NCC MERP). Data were not collected during a four-week implementation period. Lepee et al. assessed the effects of a check & correct checklist on prescriptions for patients admitted on two pediatric wards, using an ITS study design. This checklist was used in the presence of the patient, during ward rounds. A member of the team reviewed the prescription chart using the check & correct checklist and gave immediate feedback on any shortfalls to the other members of the team. Corrections and short teaching comments were made before the end of the round. The study does not report on participant characteristics. The primary outcome was the rate of technical prescribing errors. In addition, data on clinical prescribing errors were collected (secondary outcomes). A technical prescribing error was defined as unclear or missing information on the prescription. A clinical prescribing error was defined as an unintentional significant reduction in the probability that a treatment would be timely and effective, or an increase in risk of harm, when compared with more generally accepted practice, as a result of a prescribing decision or a prescription writing process. To identify technical errors, a student pharmacist screened all inpatient drug charts during two months before and two months after implementation of the checklist. The ward pharmacist identified clinical errors. No data were collected during a one-week implementation
91
Interventions for reducing medication errors
Chap
ter 5
period. The quality of documentation in the medical notes was assessed concurrently and acted as a control measurement. The objective of the RCT conducted by Kozer et al. was to assess the effects of a structured, pre-printed medication order sheet on prescriptions for pediatric patients visiting an emergency department. The study does not report on participant characteristics. During a one-month period, days were randomly allocated to the intervention group or to the control group. During intervention days, a structured, pre-printed medication order sheet was used for all visiting patients. On control days, the regular blank order sheet was used. Endpoints included the numbers of medication prescribing errors and potentially harmful MEs. MEs were defined as a drug regimen different from that recommended (dose difference ≥ 20%, deviation ≥ 2 hours from the recommended interval between doses and wrong unit or route of administration). Potentially harmful MEs were defined as MEs that could have caused significant or severe harm to participants. To identify these errors, two medical students reviewed all participant charts. After data collection, two pediatric emergency physicians reviewed the database and decided on the severity of the error, using three categories.
Excluded studiesWe excluded 21 studies that did not meet the inclusion criteria. Ten studies were executed in non-clinical test situations [39-48]. We excluded three studies because they investigated MEs in home situations [41,47,48]. One study did not specifically aim to prevent MEs [49]. We excluded six studies because they turned out to be CBAs without the required number of intervention or control groups [50-55]. We excluded three studies because no data on hospitalized children were presented [56-58]. One study was published only in abstract form [59].
Risk of bias in included studiesSee Appendix 2-8: Characteristics of included studies.
Quality assessmentWe report the methodological quality of the included studies in narrative format and in a risk of bias summary (Figure 2).
Risk of bias in included studiesThe CBA by Kaushal et al. describes the effects of including a clinical pharmacist. Intervention and control units were randomly selected. Participants in the pre-intervention group were similar to those in the post-intervention group. The process of data collection with blinding was performed accurately and is described in detail. The
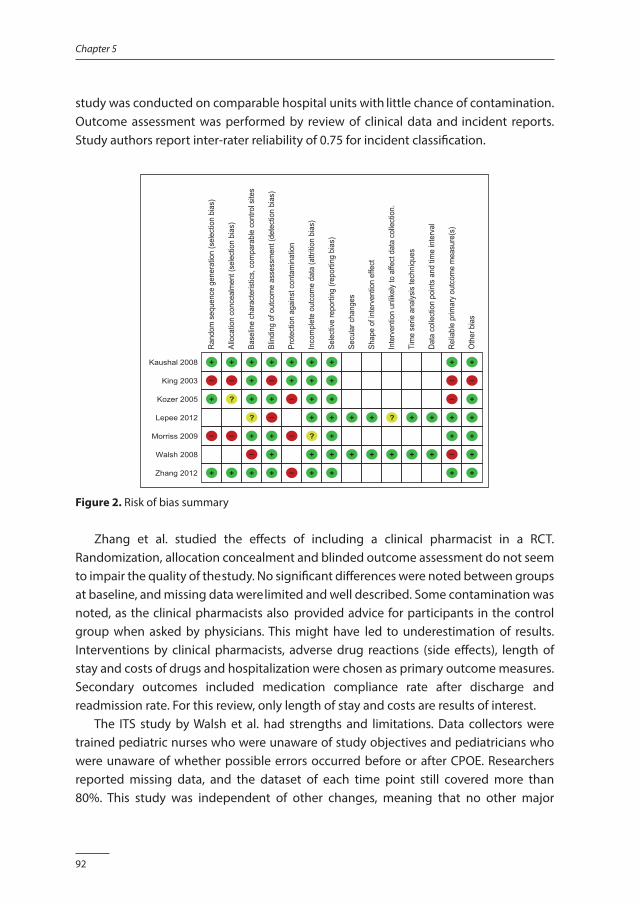
92
Chapter 5
study was conducted on comparable hospital units with little chance of contamination. Outcome assessment was performed by review of clinical data and incident reports. Study authors report inter-rater reliability of 0.75 for incident classification.
Rand
om s
eque
nce
gene
ratio
n (s
elec
tion
bias
)
Kaushal 2008 +
King 2003 –
Kozer 2005 +
Lepee 2012
Morriss 2009 –
Walsh 2008
Zhang 2012 +
Allo
catio
n co
ncea
lmen
t (se
lect
ion
bias
)
+
–
?
–
+
Base
line
char
acte
ristic
s, c
ompa
rabl
e co
ntro
l site
s
+
+
+
?
+
–
+
Blin
ding
of o
utco
me
asse
ssm
ent (
dete
ctio
n bi
as)
+
–
+
–
+
+
+
Prot
ectio
n ag
ains
t con
tam
inat
ion
+
+
–
–
–
Inco
mpl
ete
outc
ome
data
(attr
ition
bias
)
+
+
+
+
?
+
+
Sele
ctive
repo
rting
(rep
ortin
g bi
as)
+
+
+
+
+
+
+
Secu
lar c
hang
es
+
+
Shap
e of
inte
rven
tion
effe
ct
+
+
Inte
rven
tion
unlik
ely
to a
ffect
dat
a co
llect
ion.
?
+
Tim
e se
rie a
nalys
is te
chni
ques
+
+
Data
col
lect
ion
poin
ts a
nd ti
me
inte
rval
+
+Re
liabl
e pr
imar
y ou
tcom
e m
easu
re(s
)
+
–
–
+
+
–
+O
ther
bia
s
+
–
+
+
+
+
+
Figure 2. Risk of bias summary
Zhang et al. studied the effects of including a clinical pharmacist in a RCT. Randomization, allocation concealment and blinded outcome assessment do not seem to impair the quality of the study. No significant differences were noted between groups at baseline, and missing data were limited and well described. Some contamination was noted, as the clinical pharmacists also provided advice for participants in the control group when asked by physicians. This might have led to underestimation of results. Interventions by clinical pharmacists, adverse drug reactions (side effects), length of stay and costs of drugs and hospitalization were chosen as primary outcome measures. Secondary outcomes included medication compliance rate after discharge and readmission rate. For this review, only length of stay and costs are results of interest. The ITS study by Walsh et al. had strengths and limitations. Data collectors were trained pediatric nurses who were unaware of study objectives and pediatricians who were unaware of whether possible errors occurred before or after CPOE. Researchers reported missing data, and the dataset of each time point still covered more than 80%. This study was independent of other changes, meaning that no other major
93
Interventions for reducing medication errors
Chap
ter 5
organizational developments during the study period could have influenced study results. The shape of the intervention effect was prespecified, and identical months were included in the pre-CPOE and post-CPOE periods to control for seasonal effects. Risk of bias regarding whether the intervention affected data collection was low, as methods used for data collection before and after the intervention were the same. Time series analysis techniques were used to correct for changes over time, other than the intervention. Also sufficient numbers of data collection points were chosen (seven before and nine after the intervention). We report two criteria that might cause high risk of bias. Inter-rater reliability for pediatricians’ judgements was calculated, resulting in inter-rater reliability for judgements about classification of a possible ME of 0.7, severity of the error of 0.4 and preventability of the error of 0.8. These results might affect the reliability of the primary endpoints. Also, the number of NICU admissions had increased in the post-intervention period, and this might have inflated the effects of CPOE because the rate of MEs in the NICU was less than in other units. The CBA by King et al. had strengths and limitations. Participant characteristics were similar in the pre-intervention and post-intervention periods and between intervention and control wards. Each ward was clinically independent, so contamination is not expected. Also, the incident reporting system, which served as the main source of outcomes, was constant during the study period. In this retrospective study, intervention and control wards were not randomly chosen, and no blinding was applied. However, only the incident reporting system was used to collect outcome measures with an inter-rater reliability of 0.64, which might have resulted in less reliable results. In addition, study authors described a decline in ADEs in the pre-intervention period, probably as the result of other interventions provided to increase medication safety. The CBA by Morriss et al. had strengths and limitations. Small differences in baseline characteristics were noted in the number of twins and in nursing capacity, but adjustments were made for these in the analyses. Blinded professionals performed outcome assessment. Outcome assessment was performed using a combination of review of medical records and voluntary incident reports, and an inter-rater reliability of 0.82 was reported for detection of MEs. However, intervention and control beds were not randomly selected. Another main threat described in this study is possible contamination: beds with the BCMA system and beds without the BCMA installed were in the same sections of the NICU. This might have resulted in underestimation of the results. Lepee et al. studied the effects of a check & correct checklist in an ITS study. Data collection was performed twice a week through review of all inpatient files. The study was independent of other changes; this is shown by the concurrent control variable. The dataset of each time point covered at least 80% of all participants, and the shape
94
Chapter 5
of the intervention effect was prespecified. Risk of bias was low regarding whether the intervention affected data collection, as methods used for data collection before and after the intervention were the same. Time series analysis techniques were used to correct for changes over time, other than the intervention. Inter-rater reliability was examined for the primary outcome (technical error), resulting in a kappa of 0.91. Evaluators were not blinded as to whether the data were pre-intervention or post-intervention, but because the endpoint was defined as measurable and objective, there was probably no influence on the results. The number of data points and the time interval chosen in the study were based on maximizing the quantity of data that could be collected within available resources (additional information obtained from the study author). Kozer et al. studied the effects of a structured order sheet in a RCT. Randomization and blinded outcome assessment did not seem to impair the quality of the study. Allocation concealment was not described. No significant differences between groups were noted at baseline, and missing data were limited. Possible contamination was noted between intervention and control groups, as the same professionals worked with the structured order sheet on intervention days, as well as with the regular sheet on days chosen as controls. This might have led to underestimation of the results. We also report high risk of bias concerning the reliability of the primary outcomes because only the adverse event reporting system was used. No kappa’s were reported.
Effects of interventionsSee Table 1: Summary of findings.
Heterogeneity and data synthesisFive different interventions were evaluated in the seven included studies. Two studies explored the effects of clinical pharmacists [33,36] but showed clinical and methodological heterogeneity. For example, two different study designs were used; primary endpoints and populations were comparable only in part, and researchers used different methods to obtain primary outcome data. Two studies described the effects of CPOE [35,37]. Again, differences in endpoints, methods of data collection, populations and study design were noted. As a result of this heterogeneity, data synthesis was impossible.
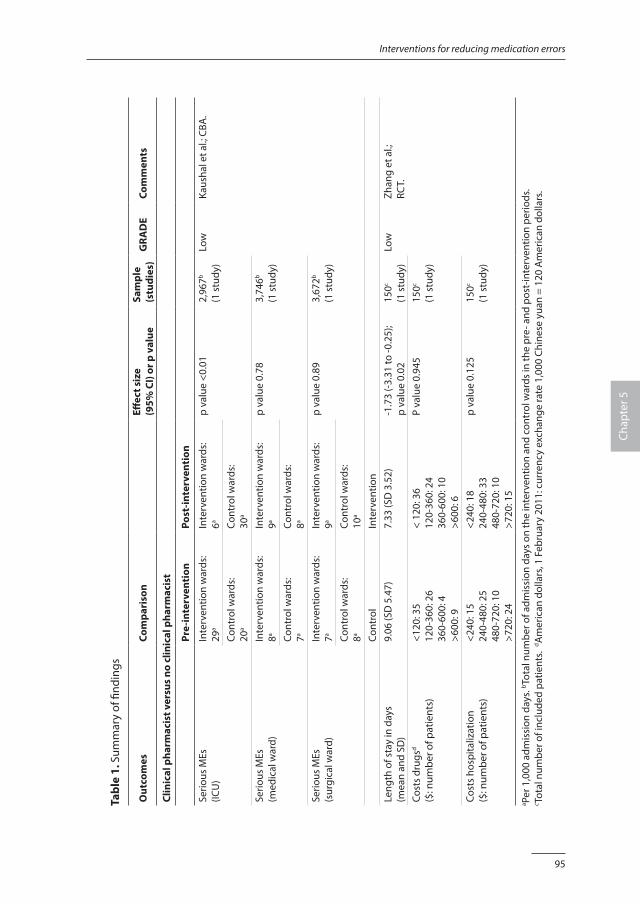
95
Interventions for reducing medication errors
Chap
ter 5
Tabl
e 1.
Sum
mar
y of
find
ings
Out
com
esCo
mpa
riso
nEff
ect s
ize
(9
5% C
I) or
p v
alue
Sam
ple
(stu
dies
)G
RAD
ECo
mm
ents
Clin
ical
pha
rmac
ist v
ersu
s no
clin
ical
pha
rmac
ist
Pre-
inte
rven
tion
Post
-inte
rven
tion
Serio
us M
Es(IC
U)
Inte
rven
tion
war
ds:
29a
Inte
rven
tion
war
ds:
6ap
valu
e <0
.01
2,96
7b
(1 s
tudy
)Lo
wKa
usha
l et a
l.; C
BA.
Cont
rol w
ards
:20
aCo
ntro
l war
ds:
30a
Serio
us M
Es(m
edic
al w
ard)
Inte
rven
tion
war
ds:
8aIn
terv
entio
n w
ards
:9a
p va
lue
0.78
3,74
6b
(1 s
tudy
)Co
ntro
l war
ds:
7aCo
ntro
l war
ds:
8a
Serio
us M
Es(s
urgi
cal w
ard)
Inte
rven
tion
war
ds:
7aIn
terv
entio
n w
ards
:9a
p va
lue
0.89
3,67
2b
(1 s
tudy
)Co
ntro
l war
ds:
8aCo
ntro
l war
ds:
10a
Cont
rol
Inte
rven
tion
Leng
th o
f sta
y in
day
s(m
ean
and
SD)
9.06
(SD
5.4
7)7.
33 (S
D 3
.52)
-1.7
3 (-3
.31
to -0
.25)
; p
valu
e 0.
0215
0c
(1 s
tudy
)Lo
wZh
ang
et a
l.;
RCT.
Cost
s dr
ugsd
($: n
umbe
r of p
atie
nts)
<120
: 35
120-
360:
26
360-
600:
4>6
00: 9
< 12
0: 3
612
0-36
0: 2
436
0-60
0: 1
0>6
00: 6
P va
lue
0.94
515
0c
(1 s
tudy
)
Cost
s ho
spita
lizat
ion
($: n
umbe
r of p
atie
nts)
<240
: 15
240-
480:
25
480-
720:
10
>720
: 24
<240
: 18
240-
480:
33
480-
720:
10
>720
: 15
p va
lue
0.12
515
0c
(1 s
tudy
)
a Per 1
,000
adm
issi
on d
ays.
b Tota
l num
ber o
f adm
issi
on d
ays
on th
e in
terv
entio
n an
d co
ntro
l war
ds in
the
pre-
and
pos
t-in
terv
entio
n pe
riods
.c To
tal n
umbe
r of i
nclu
ded
patie
nts.
d Am
eric
an d
olla
rs, 1
Feb
ruar
y 20
11: c
urre
ncy
exch
ange
rate
1,0
00 C
hine
se y
uan
= 12
0 A
mer
ican
dol
lars
.
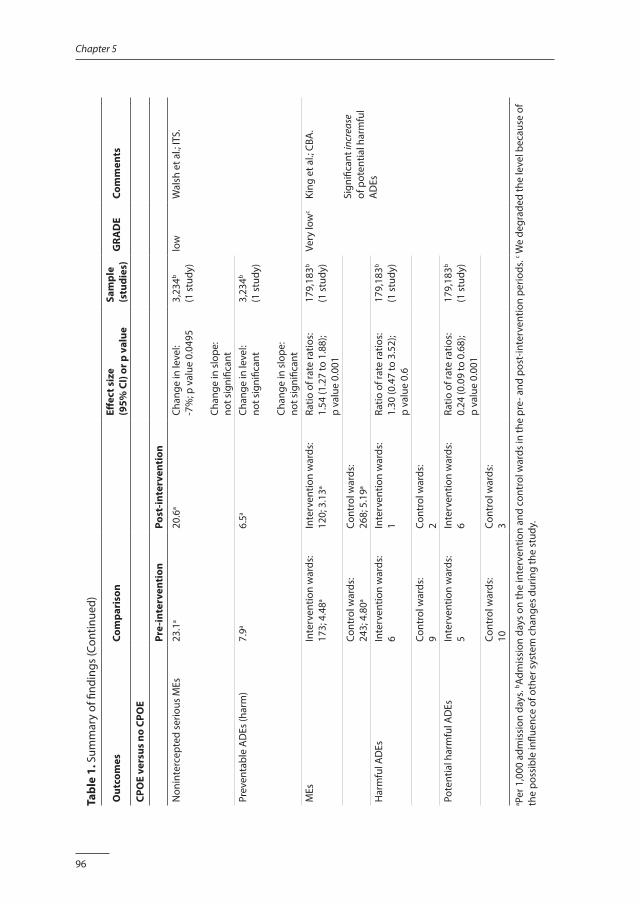
96
Chapter 5
Tabl
e 1.
Sum
mar
y of
find
ings
(Con
tinue
d)
Out
com
esCo
mpa
riso
nEff
ect s
ize
(9
5% C
I) or
p v
alue
Sam
ple
(stu
dies
)G
RAD
ECo
mm
ents
CPO
E ve
rsus
no
CPO
E
Pre-
inte
rven
tion
Post
-inte
rven
tion
Non
inte
rcep
ted
serio
us M
Es23
.1a
20.6
aCh
ange
in le
vel:
-7%
; p v
alue
0.0
495
Chan
ge in
slo
pe:
not s
igni
fican
t
3,23
4b
(1 s
tudy
)lo
wW
alsh
et a
l.; IT
S.
Prev
enta
ble
AD
Es (h
arm
)7.
9a6.
5aCh
ange
in le
vel:
not s
igni
fican
t
Chan
ge in
slo
pe:
not s
igni
fican
t
3,23
4b
(1 s
tudy
)
MEs
Inte
rven
tion
war
ds:
173;
4.4
8aIn
terv
entio
n w
ards
: 12
0; 3
.13a
Ratio
of r
ate
ratio
s:1.
54 (1
.27
to 1
.88)
; p
valu
e 0.
001
179,
183b
(1 s
tudy
)Ve
ry lo
wc
King
et a
l.; C
BA.
Sign
ifica
nt in
crea
se
of p
oten
tial h
arm
ful
AD
Es
Cont
rol w
ards
:24
3; 4
.80a
Cont
rol w
ards
:26
8; 5
.19a
Har
mfu
l AD
EsIn
terv
entio
n w
ards
:6
Inte
rven
tion
war
ds:
1Ra
tio o
f rat
e ra
tios:
1.30
(0.4
7 to
3.5
2);
p va
lue
0.6
179,
183b
(1 s
tudy
)
Cont
rol w
ards
:9
Cont
rol w
ards
:2
Pote
ntia
l har
mfu
l AD
EsIn
terv
entio
n w
ards
:5
Inte
rven
tion
war
ds:
6Ra
tio o
f rat
e ra
tios:
0.24
(0.0
9 to
0.6
8);
p va
lue
0.00
1
179,
183b
(1 s
tudy
)
Cont
rol w
ards
:10
Cont
rol w
ards
:3
a Per 1
,000
adm
issi
on d
ays.
b Adm
issi
on d
ays
on th
e in
terv
entio
n an
d co
ntro
l war
ds in
the
pre-
and
pos
t-in
terv
entio
n pe
riods
. c We
degr
aded
the
leve
l bec
ause
of
the
poss
ible
influ
ence
of o
ther
sys
tem
cha
nges
dur
ing
the
stud
y.
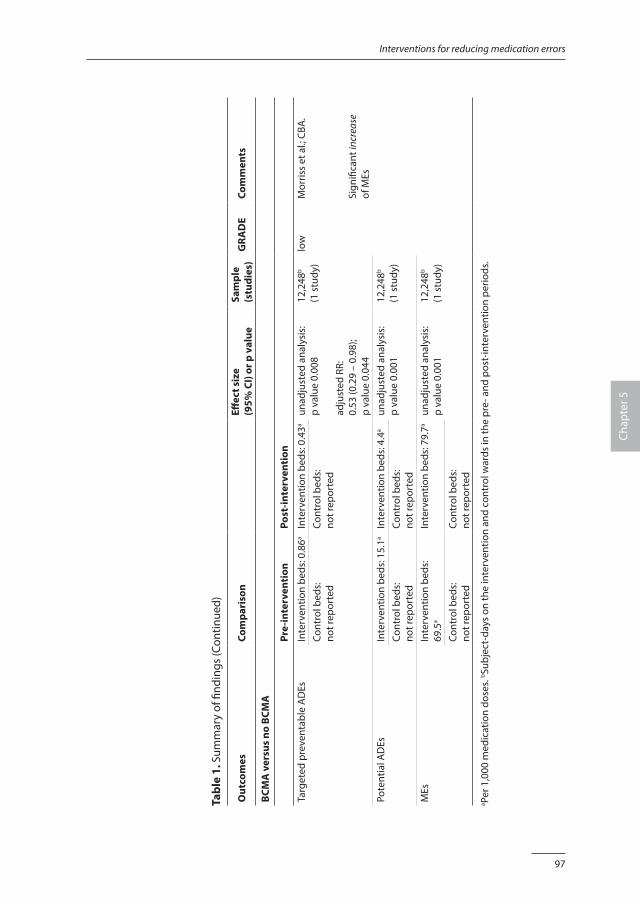
97
Interventions for reducing medication errors
Chap
ter 5
Tabl
e 1.
Sum
mar
y of
find
ings
(Con
tinue
d)
Out
com
esCo
mpa
riso
nEff
ect s
ize
(9
5% C
I) or
p v
alue
Sam
ple
(stu
dies
)G
RAD
ECo
mm
ents
BCM
A v
ersu
s no
BCM
A
Pre-
inte
rven
tion
Post
-inte
rven
tion
Targ
eted
pre
vent
able
AD
EsIn
terv
entio
n be
ds: 0
.86a
Inte
rven
tion
beds
: 0.4
3aun
adju
sted
ana
lysi
s:p
valu
e 0.
008
adju
sted
RR:
0.53
(0.2
9 –
0.98
); p
valu
e 0.
044
12,2
48b
(1 s
tudy
)lo
wM
orris
s et
al.;
CBA
.
Sign
ifica
nt in
crea
se
of M
Es
Cont
rol b
eds:
not r
epor
ted
Cont
rol b
eds:
not r
epor
ted
Pote
ntia
l AD
EsIn
terv
entio
n be
ds: 1
5.1a
Inte
rven
tion
beds
: 4.4
aun
adju
sted
ana
lysi
s:p
valu
e 0.
001
12,2
48b
(1 s
tudy
)Co
ntro
l bed
s:no
t rep
orte
dCo
ntro
l bed
s:no
t rep
orte
dM
EsIn
terv
entio
n be
ds:
69.5
aIn
terv
entio
n be
ds: 7
9.7a
unad
just
ed a
naly
sis:
p va
lue
0.00
112
,248
b
(1 s
tudy
)Co
ntro
l bed
s:no
t rep
orte
dCo
ntro
l bed
s:no
t rep
orte
da Pe
r 1,0
00 m
edic
atio
n do
ses.
b Subj
ect-
days
on
the
inte
rven
tion
and
cont
rol w
ards
in th
e pr
e- a
nd p
ost-
inte
rven
tion
perio
ds.
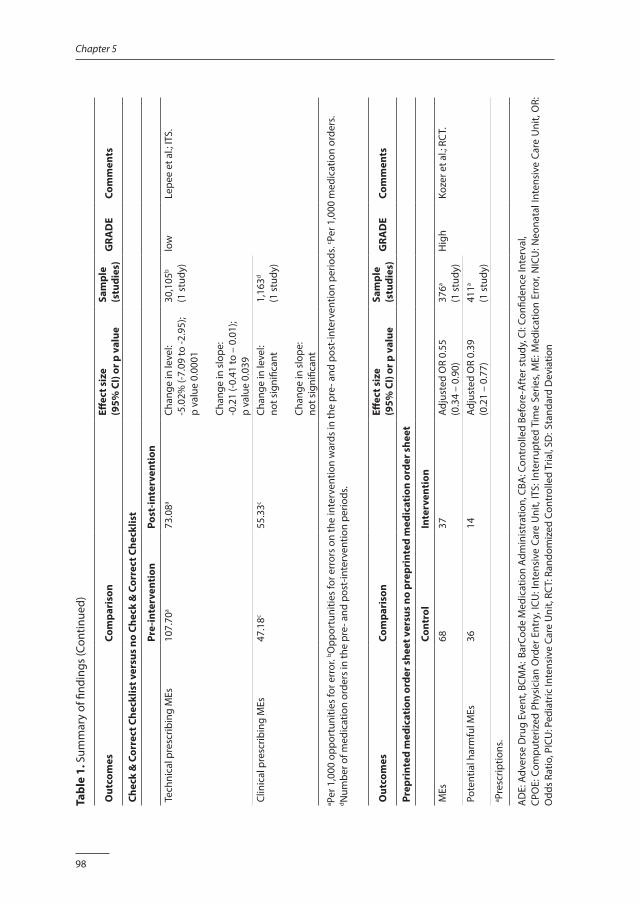
98
Chapter 5
Tabl
e 1.
Sum
mar
y of
find
ings
(Con
tinue
d)
Out
com
esCo
mpa
riso
nEff
ect s
ize
(9
5% C
I) or
p v
alue
Sam
ple
(stu
dies
)G
RAD
ECo
mm
ents
Chec
k &
Cor
rect
Che
cklis
t ver
sus
no C
heck
& C
orre
ct C
heck
list
Pre-
inte
rven
tion
Post
-inte
rven
tion
Tech
nica
l pre
scrib
ing
MEs
107.
70a
73.0
8aCh
ange
in le
vel:
-5.0
2% (-
7.09
to -2
.95)
; p
valu
e 0.
0001
Chan
ge in
slo
pe:
-0.2
1 (-0
.41
to –
0.0
1);
p va
lue
0.03
9
30,1
05b
(1 s
tudy
)lo
wLe
pee
et a
l.; IT
S.
Clin
ical
pre
scrib
ing
MEs
47.1
8c55
.33c
Chan
ge in
leve
l:no
t sig
nific
ant
Chan
ge in
slo
pe:
not s
igni
fican
t
1,16
3d
(1 s
tudy
)
a Per 1
,000
opp
ortu
nitie
s fo
r err
or. b O
ppor
tuni
ties
for e
rror
s on
the
inte
rven
tion
war
ds in
the
pre-
and
pos
t-in
terv
entio
n pe
riods
. c Per 1
,000
med
icat
ion
orde
rs.
d Num
ber o
f med
icat
ion
orde
rs in
the
pre-
and
pos
t-in
terv
entio
n pe
riods
.
Out
com
esCo
mpa
riso
nEff
ect s
ize
(9
5% C
I) or
p v
alue
Sam
ple
(stu
dies
)G
RAD
ECo
mm
ents
Prep
rint
ed m
edic
atio
n or
der s
heet
ver
sus
no p
repr
inte
d m
edic
atio
n or
der s
heet
Cont
rol
Inte
rven
tion
MEs
6837
Adju
sted
OR
0.55
(0.3
4 –
0.90
)37
6a
(1 s
tudy
)H
igh
Koze
r et a
l.; R
CT.
Pote
ntia
l har
mfu
l MEs
3614
Adju
sted
OR
0.39
(0.2
1 –
0.77
)41
1a
(1 s
tudy
)a Pr
escr
iptio
ns.
AD
E: A
dver
se D
rug
Even
t, BC
MA
: Bar
Code
Med
icat
ion
Adm
inis
trat
ion,
CBA
: Con
trol
led
Befo
re-A
fter
stu
dy, C
I: Co
nfide
nce
Inte
rval
, CP
OE:
Com
pute
rized
Phy
sici
an O
rder
Ent
ry, I
CU: I
nten
sive
Car
e U
nit,
ITS:
Inte
rrup
ted
Tim
e Se
ries,
ME:
Med
icat
ion
Erro
r, N
ICU
: Neo
nata
l Int
ensi
ve C
are
Uni
t, O
R:
Odd
s Ra
tio, P
ICU
: Ped
iatr
ic In
tens
ive
Care
Uni
t, RC
T: R
ando
miz
ed C
ontr
olle
d Tr
ial,
SD: S
tand
ard
Dev
iatio
n
99
Interventions for reducing medication errors
Chap
ter 5
Effects of interventions as reported in included studiesThe study by Kaushal et al. described the effects of including a unit-based clinical pharmacist with a CBA study design. During the study period, a total of 4,863 admissions with 10,385 admission days were studied in ICU wards, general medical wards and general surgical wards. Serious MEs were chosen as the primary outcome. The baseline rate of serious MEs in the pediatric ICU was 29 per 1,000 admission days. After the clinical pharmacist was introduced, the pediatric ICU rate dropped to 6 per 1,000 admission days. Study authors report a statistically significant difference between the pediatric ICU (intervention unit) and the cardiac ICU (control unit) after the unit-based clinical pharmacist was introduced (p value < 0.01). On the general medical ward and the general surgical wards, results were not significant. The RCT by Zhang et al. reported on the effects of including a clinical pharmacist. Data on 150 participants were analyzed. For this review, only length of stay and costs were results of interest. On the wards where a clinical pharmacist was part of the team, length of stay decreased from 9.06 to 7.33 days (p value 0.02). This reduction was seen mainly in patients with a respiratory system disease. Costs of both drugs and hospitalization did not change (p value 0.945 and p value 0.125). The ITS study by Walsh et al. described the effects of CPOE. During the study period, a total of 627 admissions with 3,234 admission days and 12,672 medications were analyzed. The rate of non-intercepted serious MEs was chosen as the primary outcome. The incidence of non-intercepted serious MEs was 23.1 per 1,000 admission days in the pre-intervention period and 20.6 per 1,000 admission days in the post-CPOE period. Time series regression analysis indicated a 7% drop in rates of non-intercepted serious MEs (p value 0.0495) after implementation of CPOE. No change was seen in slopes of regression lines before and after the intervention. The incidence of harm as a result of error (preventable ADEs) was 7.9 per 1,000 admission days in the pre-intervention period and 6.5 per 1,000 admission days in the post-CPOE period. Study authors reported that time series regression analyses showed no differences. The study author when contacted did not reveal additional quantitative information. The CBA study by King et al. described the effects of CPOE. During the study period, a total of 36,103 participants and 179,183 admission days were studied. Primary outcomes were MEs and ADEs (injuries as a result of error). In the pre-CPOE period, 173 MEs (4.48 per 1,000 admission days) were discovered on the intervention wards and 243 (4.80 per 1,000 admission days) on the control wards. In the post-CPOE period, the incidence of MEs was 120 (3.13 per 1,000 admission days) on the intervention wards and 268 (5.19 per 1,000 admission days) on the control wards. The change in rate ratios of MEs after implementation of CPOE is expressed as odds ratio (OR) 1.54 (95% CI 1.27 to 1.88). Also potential ADEs were reduced after CPOE implementation: OR 0.24 (95% CI 0.09 to 0.68).
100
Chapter 5
The study by Morriss et al. described the effects of BCMA using a CBA study design. During the study period, a total of 958 admissions, representing 12,248 patient-days and 92,398 medication doses, were studied. Primary outcomes were targeted preventable ADEs, and secondary outcomes were potential ADEs and MEs. Unadjusted analysis shows a reduction in targeted preventable ADEs. Potential ADEs were also decreased. In contrast, MEs were increased after implementation of BCMA. Study authors used a generalized estimating equation (GEE) to adjust for non-linearity and additional co-variates. Results of the GEE show a relative risk of targeted preventable ADEs in the intervention group of 0.53 (95% CI 0.29 to 0.98). Adjusted results for MEs are not reported. The study by Lepee et al. reported on the effectiveness of the check & correct checklist for prescribing errors using an ITS study design. During the study period, a total of 1,887 medication orders, comprising 30,105 opportunities for technical errors and 1,163 for clinical errors, were studied. Two outcomes were defined: technical prescription writing errors (technical errors) and prescribing errors involving clinical decision making (clinical errors). Data were analyzed using segmented regression analysis, corrected for overall documentation quality of medical records, which was chosen as a concurrent control measurement. This analysis revealed a decrease of 5% in the technical error rate (95% CI -7.09% to -2.95%) after the intervention. A decrease in the trend was also reported: -0.21 (95% CI -0.41 to -0.01). Regarding clinical MEs, study authors reported no effect. The RCT by Kozer et al. reported on the effects of a structured, pre-printed medication order sheet on prescriptions for patients visiting a pediatric emergency department. During the month of the study, data from 2,058 participants were obtained. A total of 411 medications were prescribed on the regular form, and 376 medications were prescribed on the new form. Two outcomes were reported: the total numbers of medication prescribing errors and MEs that were considered significantly or severely harmful. MEs were identified in 68 prescriptions when the regular form was used and in 37 prescriptions on the new form. Analysis revealed a reduction in MEs: adjusted OR 0.55 (95% CI 0.34 to 0.90). Potentially harmful MEs (significant and severe errors) were reduced from 36 when the regular form was used to 14 on the days when the new form was used. This reduction was substantial: adjusted OR 0.39 (95% CI 0.21 to 0.77).
DISCUSSION
Summary of main resultsCurrently evidence is limited on interventions that are effective in preventing MEs in a pediatric population in hospital. We included seven studies describing five different interventions: a clinical pharmacist, CPOE, BCMA, a structured prescribing form and a check & correct checklist in combination with feedback. Clinical and methodological heterogeneity between studies precluded meta-analyses. Although some interventions
101
Interventions for reducing medication errors
Chap
ter 5
described in this review show a decrease in MEs, results are not consistent, and none of the studies reported a significant reduction in patient harm. Based on the GRADE approach, overall quality and strength of the evidence are low.
Overall completeness and applicability of evidenceWe aimed to create an overview concerning the effectiveness of interventions to reduce MEs and related harm in children. Because medication safety in pediatric care is different from that in adult care, interventions preferably include components that focus on specific pediatric safety issues, for example, clinical decision support, calculation aids and dosage control. This review describes five different interventions from seven studies, which were evaluated according to the EPOC criteria. Firstly, a clinical pharmacist might serve as a valuable contribution at different stages of the medication process. Both Kaushal et al. and Zhang et al. described the contributions of a clinical pharmacist, for example, in advising doctors on drug selection and dosage, advising nurses on preparation and administration and providing monitoring and education [33,36]. Kaushal et al. mentioned the level of education and skills of the clinical pharmacist [36]. Secondly, information technology might play an important role in medication safety. The recommended system includes CPOE and BCMA, because each system targets specific types of MEs. In pediatric care, a CPOE is required that is sufficiently flexible to respond to rapid and specific changes that occur in children, and continuous adaptation to weight changes must be possible [60]. The CPOE described by Walsh et al. includes specific pediatric features (e.g. weight-based dosage calculator, automatic dosage checks), but King et al. describes a CPOE system without clinical decision support and with no interface with the pharmacy. Morriss et al. studied a BCMA system, but it remains unclear whether this was connected with CPOE. Lepee et al. implemented a check & correct checklist to identify technical and clinical errors in prescriptions. Included in this intervention were immediate feedback and instruction to the team during ward rounds. The instruction might have highlighted specific features of pediatric pharmaceutical care, such as weight-based dosages or routes of administration. Structured prescribing forms might improve prescribing practices in general, as shown by Kozer et al. In conclusion, although all seven studies aimed to improve medication safety for children, not all interventions targeted specific pediatric safety issues. All studies are coming from North America or Europe, except one that originates from China. Also, all are conducted in tertiary university medical centers, some in highly specialized pediatric wards. This might impact the generalizability of findings. Other strategies are used to decrease MEs, such as avoidance of verbal orders, verbal orders read back, medication reconciliation, double check and patient (parent)
102
Chapter 5
active participation in care. This review shows that only a handful of medication safety strategies are being studied with robust study designs.
Quality of the evidenceBased on study design, we graded the quality of the two included randomized controlled trials [32,33] and four observational studies [34-36,38] as “low”. We degraded one observational study to “very low”, because results could not be distinguished from other system changes during the study period [37].
Potential biases in the review processWe followed the EPOC group guidelines for conducting the review, which included performing a very sensitive search of the databases, as well as the grey literature. However, publication bias remains a potential (but unknown) source of bias.
Agreements and disagreements with existing knowledgeWe are aware of other reviews that have evaluated the effectiveness of interventions in preventing MEs in pediatric care. Sanghera et al. conducted a systematic review examining whether interventions by clinical pharmacists improve medication safety in children [61], and Chedoe et al. reviewed the literature to identify strategies to improve medication safety in neonatal intensive care, while including the contribution of a clinical pharmacist [62]. In both reviews, included studies were observational studies without controls (before-after studies or case series). All studies reported significant improvements and concluded that a clinical pharmacist plays an important role in detecting and preventing MEs. The two studies on this subject included in our systematic review support in part the conclusions based on existing evidence [33,36]. As described before, Kaushal et al. showed a significant decrease in serious MEs with a full-time clinical pharmacist in a PICU, but not on pediatric medical wards. Zhang et al. showed a decrease in length of stay, but not in costs; however these results might be underestimated by contamination between intervention and control groups. The effect of CPOE has been summarized in three systematic reviews [62-64]. Again, most of the included studies were observational studies; only the research conducted by King et al. used a controlled before-after design. Most studies report a beneficial effect of CPOE on MEs, but mixed effects on patient harm are reported. Also new errors (e.g. typographical mistakes, poor design of screens) seemed to appear with the use of CPOE [65-67]. One study reported an increase in mortality rate after implementation of CPOE in a PICU [68], but this finding was not confirmed [69,70]. Computerized clinical decision support as part of CPOE shows multiple functionalities, and the effect on patient care is inconsistent or unknown [71]. The two studies on this subject included in our systematic review
103
Interventions for reducing medication errors
Chap
ter 5
support the mixed results shown in the existing evidence. Walsh et al. described a just significant (p value 0.495) decrease in non-intercepted serious MEs but no reduction in preventable harm. King et al. showed a significant decrease in MEs but no reduction in harmful ADEs and even an increase in potentially harmful ADEs. These results are not surprising, as the constant need for weight- and surface area-based dosing and unit conversion is the key risk for children, and this risk might only be diminished by a CPOE with specific pediatric features, which was the case in only some of the included studies. Rinke et al. conducted a systematic review to study interventions to reduce pediatric MEs [72]. Study authors aimed to be as inclusive as possible and therefore used definitions that are broader than the definitions used by the Cochrane EPOC review group. This resulted in the inclusion of 63 studies, which the study authors considered as 52 ITS and eight CBA studies. Studies investigated the effects on MEs of the following interventions: CPOE (n = 26), education (n = 20), preprinted order sheets (n = 9), protocol implementation (n = 8), reporting of error rates (n = 7) and pharmacist participation (n = 5). Four studies are included in our systematic review as well [32,35,36,38]. This review shows that multiple interventions revealed statistically significant results, but many studies show high risk of bias. The observations of Rinke et al. are congruent with our conclusions, namely, that evidence on preventing pediatric MEs is seriously hampered by non-uniform definitions, data collection methods and outcome measures. Manias et al. published a systematic review to study interventions provided to reduce MEs in PICUs [73]. In total, 34 studies were included. Apart from one study [36], all were before-after studies without a comparative, concurrent study group. Six types of interventions were studied: CPOE (n = 8), intravenous systems (n = 5), education (n = 11), protocols and guidelines (n = 2), pharmacist involvement (n = 3) and decision support (n = 5). Although the study authors report statistically significant results from meta-analyses for CPOE, intravenous systems and education, they conclude that the evidence remains limited because of variation in definitions and data collection and because of the low quality of the studies. Again, this conclusion is congruent with our observations.
HeterogeneityDespite efforts toward standardization [3-5], we found differences in the definitions of a ME and harm (numerator data) and in study populations (denominator data), creating heterogeneity in the results presented in these studies. For example, numerator data are presented as MEs, serious MEs, technical MEs, harmful MEs or potentially harmful MEs, preventable ADEs or potential ADEs. Denominator data are presented as participants, 1,000 admission days, 1,000 prescriptions or 1,000 gifts. Not all studies categorized MEs by severity of outcome for participants, or different scales were used. This variety in definitions and classifications made accurate comparison of results impossible.
104
Chapter 5
CONCLUSION
Implications for practiceOrganizations implementing interventions to improve medication safety for hospitalized children must be aware that the evidence endorsing these interventions is limited both in volume and in methodological quality. Although some interventions described in this review show a decrease in MEs, the results are not conclusive, and benefits for patients in terms of less harm remain unclear. The relevance of these results should be weighted in the organizational context.
Implications for researchEvidenceAppropriately powered and methodologically sound studies are needed before evidence-based recommendations can be made. Researchers should use the most robust design possible to minimize bias and maximize generalizability. The standard RCT methodology may not be well suited to answering questions concerning medication safety in the light of social and organizational contexts and their changes over time. Cluster-randomized trials, factorial designs or non-randomized designs like interrupted time series must be considered [74,75].
PopulationMEs are hazardous for all patients, but children are believed to be at exceptionally high risk of harm from such errors. Neonates, infants and surgical pediatric patients are believed to be at higher risk of harm than other children. In addition, medications are very diverse and have a wide range of risk profiles, and MEs do not always cause patient harm. Those with a heightened risk of causing patient harm are known as high-alert medications; their misuse has serious consequences for patients. Therefore it is strongly recommended that research on medication safety should include high-risk populations and high-alert medications. As existing evidence originates from highly specialized pediatric wards in tertiary university medical centers, research from smaller hospitals with fewer resources is welcome.
Intervention and comparisonTo improve medication safety in pediatric care, interventions must include components that focus on specific pediatric safety issues, for example, clinical decision support, calculation aids, alerts in cases of underdosage or overdosage, educational interventions and close monitoring. Apart from technical innovations like CPOE and BCMA, non-technical calculation aids and alerts must be subjects of investigation to support
105
Interventions for reducing medication errors
Chap
ter 5
professionals in countries where high-tech applications are not feasible. Attention must be focused on comparable participant groups or study sites.
OutcomeIn evaluating safety, patient harm caused by MEs or potentially harmful MEs is more relevant than MEs alone, because errors do not necessarily result in patient harm. Future studies should include (potentially) harmful MEs as main outcome measures. Efforts must be made to ensure uniform definitions of MEs and harm.
Time stampGiven the vulnerability of pediatric patients in hospital, medication safety should be high on every research agenda.
AcknowledgementsThe authors would like to thank Alain Mayhew and Michelle Fiander for ongoing support provided during the development of this systematic review. We also express our gratitude to the people who critically appraised the final manuscript: Robin Ferner, Orlaith Burke, Francois Cachat, Pierre Durieux, Julia Worswick and Bernard Burnand.
FundingNeither this research project nor the authors received any grant from any agency in the public, commercial or not-for-profit sector.
106
Chapter 5
REFERENCES
1. World Health Organization. Conceptial Framework for the International Classification for Patient Safety. Final Technical Report 2009 [Version 1.1]. Available: www.who.int/patientsafety/implementation/taxonomy/en, accessed November 2014.
2. Oren E, Shaffer ER, Guglielmo BJ. Impact of emerging technologies on medication errors and adverse drug events. Am J Health Syst Pharm 2003;60:1447-1458.
3. Lisby M, Nielsen LP, Brock B, et al. How should medication errors be defined? Development and test of a definition. Scand J Public Health 2012;40:203-210.
4. Miller MR, Robinson KA, Lubomski LH, et al. Medication errors in pediatric care: a systematic review of epidemiology and an evaluation of evidence supporting reduction strategy recommendations. Qual Saf Health Care 2007;16:116-126.
5. Yu KH, Nation RL, Dooley MJ. Multiplicity of medication safety terms, definitions and functional meanings: when is enough enough? Qual Saf Health Care 2005;14:358-363.
6. Lisby M, Nielsen LP, Brock B, et al. How are medication errors defined? A systematic literature review of definitions and characteristics. Int J Qual Health Care 2010;22:507-518.
7. National Coordinating Council for Medication Error Reporting and Prevention. About medication errors: what is a medication error? Available: www.nccmerp.org/about-medication-errors, accessed March 2012.
8. Tam VC. Frequency, type and clinical importance of medication history errors at admission to hospital: a systematic review. CMAJ 2005;173:510-515.
9. de Vries EN, Ramrattan MA, Smorenburg SM, et al. The incidence and nature of in-hospital adverse events: a systematic review. Qual Saf Health Care 2008;16:216-223.
10. Aspden P, Wolcott JA, Bootman L, et al. Prevention Medication Errors: Quality Chasm Series. Washington DC: The National Academic Press, 2007.
11. Davidhizar R, Lonser G. Medication errors: what case managers can do. Hosp Case Manag 2002;10:77-80.
12. Stucky ER. Prevention of medication errors in the pediatric inpatient setting. Pediatrics 2003;112:431-436.
13. Ghaleb MA, Barber N, Franklin BD, et al. Systematic review of medication errors in pediatric patients. Ann Pharmacother 2006;40:1766-1776.
14. Franklin B, Vincent C, Schachter M, et al. The incidence of prescribing errors in hospital inpatients: an overview of the research methods. Drug Saf 2005;28:891-900.
15. Garfield S, Reynolds M, Dermont L, et al. Measuring the severity of prescribing errors: a systematic review. Drug Saf 2013;36:1151-1157.
16. Meyer-Massetti C, Cheng CM, Schwappach DL, et al. Systematic review of medication safety assessment methods. Am J Health Syst Pharm 2011;68:227-240.
17. Morimoto T, Gandhi TK, Seger AC, et al. Adverse drug events and medication errors: detection and classification methods. Qual Saf Health Care 2004;13:306-314.
18. Kaushal R, Bates DW, Landrigan C, et al. Medication errors and adverse drug events in pediatric inpatients. JAMA 2001;285:2114-2120.
19. Santell JP. Medication errors: experience of the United States Pharmacopeia (USP) MEDMARX reporting system. J Clin Pharmacol 2003;43:760-767.
20. Higgins J, Green S (editors). Cochrane Handbook for Systematic Reviews of Interventions. New York: Wiley- Blackwell, Version 5.1.0 [updated March 2011].
21. Cousins D, Clarkson A, Conroy S, et al. Medication errors in children - an eight year review using press reports. Pediatr Perinat Drug Therapy 2002;5:52-58.
22. Kale A, Keohane CA, Maviglia S, et al. Adverse drug events caused by serious medication administration errors. BMJ Qual Saf 2012;21:933-938.
107
Interventions for reducing medication errors
Chap
ter 5
23. Hug BL, Keohane C, Seger DL, et al. The costs of adverse drug events in community hospitals. Jt Comm J Qual Patient Saf 2012;38:120-126.
24. Samp JC, Touchette DR, Marinac JS, et al. Economic evaluation of the impact of medication errors reported by US clinical pharmacists. Pharmacotherapy 2014;34:350-357.
25. Weingart SN, Wilson R, Gibberd RW, et al. Epidemiology of medical error - education and debate. BMJ 2000;320:774-777.
26. The Data Collection Checklist. Cochrane Effective Practice and Organisation of Care Review Group 2002. Available: www.epoc.ottawa.ca/checklist2002.doc, accessed November 2014.
27. Effective Practice, Organisation of Care (EPOC). Suggested risk of bias criteria for EPOC reviews. EPOC Resources for Review Authors. Vol. Oslo: Norwegian Knowledge Centre for the Health Services; 2014. Available: http://epoc.cochrane.org/epoc–specific–resources–review–authors, accessed November 2014.
28. Ramsay AI, Turner S, Cavell G, et al. Governing patient safety: lessons learned from a mixed methods evaluation of implementing a ward-level medication safety scorecard in two English NHS hospitals. BMJ Qual Saf 2014;23:136-146.
29. Olsen S, Neale G, Schwab K, et al. Hospital staff should use more than one method to detect adverse events and potential adverse events: incident reporting, pharmacist surveillance and local real-time record review may all have a place. Qual Saf Health Care 2007;16:40-44.
30. Guyatt GH, Oxman AD, Vist GE, et al. GRADE: an emerging consensus on rating quality of evidence and strength of recommendations. BMJ 2008;336:924-926.
31. Schunemann H, Hill S, Guyatt G, et al. The GRADE approach and Bradford Hill’s criteria for causation. J Epidemiol Comm H 2011;65:392-395.
32. Kozer E, Scolnik D, Macpherson A, et al., Using a preprinted order sheet to reduce prescription errors in pediatric emergency department: a randomized controlled trial. Pediatrics 2005;116:1299-1302.
33. Zhang C, Zhang L, Huang L, et al. Clinical pharmacists on medical care of pediatric inpatients: a single-center randomized controlled trial. PloS One 2001;7:e30856.
34. Lepee C, Klaber RE, Benn J, et al. The use of consultant-led ward round checklist to improve pediatric prescribing: an interrupted time series study. Eur J Pediatr 2012;171:1239-1245.
35. Walsh KE, Landrigan CP, Adamas WG, et al. Effect of computer order entry on prevention of serious medication errors in hospitalised children. Pediatrics 2008;121:e421-e427.
36. Morriss FH, Abramowitz PW, Nelson SP, et al. Effectiveness of a barcode medication administration system in reducing preventable adverse drug events in a neonatal intensive care unit: a prospective cohort study. J Pediatr 2009;154:363-368.
37. Kaushal R, Bates DW, Abramson EL, et al. Unit-based clinical pharmacists’ prevention of serious medication errors in pediatric inpatients. Am J Health Syst Pharm 2008;65:1254-1260.
38. King WJ, Paice N, Rangrej J, et al. The effect of computerized physician order entry on medication errors and adverse drug events in pediatric inpatients. Pediatrics 2003;112:506-509.
39. Balaguer Santamaria JA, Fernandex Ballart JD, Escribano SJ. Usefulness of a software package to reduce medication errors in neonatal care. Anales Espanoles de Pediatria 2001;55:541-545.
40. Burgess CC. Comparison of the effectiveness of traditional nursing medication administration with the Color Coding Kids system in a sample of undergraduate nursing students. Dissertation University of North Carolina 2009.
41. Frush KS, Luo XM, Hutchinson P, et al. Evaluation of a method to reduce over-the-counter medication dosing error. Arch Pediatr Adolesc Med 2004;158:620-624.
42. Frush K, Hohenhaus S, Luo X, et al. Evaluation of a web-based education program on reducing medication error: a multicenter, randomized controlled trial. Pediatr Emerg Care 2006;22:62-70.
43. Hixson R, Gandhi M, Holton F. A randomised trial to evaluate prescribing accuracy when using the Pediatric Analgesia Wheel. Arch Dis Child 2009;94:268-272.
108
Chapter 5
44. Hohenhaus SM, Cadwell SM, Stone-Griffith S, et al. Assessment of emergency nursing practice during critical pediatric medication administration in a simulated resuscitation using the “Color Coding Kids Hospital System”. AENJ 2008;30:233-241.
45. Vaidya V, Sowan AK, Mills ME, et al. Evaluating the safety and efficiency of a CPOE system for continuous medication infusions in a pediatric ICU. AMIA Symposium Proceedings 2006;1128.
46. Yamamoto L, Kanemori J. Comparing errors in ED computer-assisted vs conventional pediatric drug dosing and administration. Am J Emerg Med 2010;28:588-592.
47. Yin HS, Dreyer BP, van Schaick SL, et al. Randomized controlled trial of a pictogram-based intervention to reduce liquid medication dosing errors and improve adherence among caregivers and young children. Arch Pediatr Adolesc Med 2008;162:814-822.
48. Yin HS, Medelsohn AL, Fierman A, et al. Use of a pictographic diagram to decrease parent dosing errors with infant acetaminophen: a health literacy perspective. Academic Pediatrics 2011;11:50-57.
49. Cunningham S, Logan C, Lockerbie L, et al. Effect of an integrated care pathway on acute asthma/wheeze in children attending hospital: cluster randomized trial. J Pediatr 2008;152:315-320.
50. Burmester MK, Dionne R, Thiagarajan RR, et al. Interventions to reduce medication prescribing errors in a pediatric cardiac intensive care unit. Intensive Care Medicine 2008;34:1083-1090.
51. Dehghan-Nayeri N, Bayat F, Salehi T, et al. The effectiveness of risk management program on pediatric nurses’ medication error. Iranian Journal on Nursing and Midwifery Research 2013;18:371-377.
52. Gazarian M, Graudins LV. Long-term reduction in adverse drug events: an evidence-based improvement model. Pediatrics 2012;129:e1334–e1342.
53. Nguyen HT, Pham HT, Vo DK, et al. The effect of a clinical pharmacist-led training programme on intravenous medication errors: a controlled before and after study. BMJ Qual Saf 2014;23:319-324.
54. Niemann D, Bertsche A, Meyrath D, et al. Drug handling in a pediatric intensive care unit: can errors be prevented by a three-step intervention. Klinische Padiatrie 2014;226:62-67.
55. Niemann D, Bertsche A, Meyrath D, et al. A prospective three-step intervention study to prevent medication errors in drug handling in pediatric care. J Clin Nurs 2014, June (epub. ahead of print).
56. Ching JM, Williams BL, Idemoto LM, et al. Using lean “automation with a human touch” to improve medication safety: a step closer to the perfect dose. Jt Comm J Qual Patient Saf 2014;40:341-350.
57. Elsaid K, Truong T, Monckeberg M, et al. Impact of electronic chemotherapy order forms on prescribing errors at an urban medical center: results from an interrupted time-series analysis. Int J Qual Health Care 2013;25:656-663.
58. Ramsay CR, Matowe L, Grilli R, et al. Interrupted time series designs in health technology assessment: lessons from two systematic reviews of behavior change strategies. Int J Technol Assess Health Care 2003;19:613-623.
59. Senner A, Byrne L, Fischmann A, et al. A simple intervention targeting patient safety at the bedside. Journal of Oncology Pharmacy Practice Conference 2010;16:6-7 (suppl).
60. Johnson KB, Lehmann CU, Council on Clinical Information Technology. Electronic prescribing in pediatrics: towards safer and more effective medication management. Pediatrics 2013;131:1350-1356.
61. Sanghera N, Chan P, Khaki ZF, et al. Interventions of hospital pharmacists in improving drug therapy in children. Drug Saf 2006;29:1031-1047.
62. Chedoe I, Molendijk HA, Dittrich ST, et al. Incidence and nature of medication errors in neonatal intensive care with strategies to improve safety. Drug Saf 2007;30:503-513.
63. Conroy S, Sweis D, Planner C, et al. Interventions to reduce dosing errors in children: a systematic review of the literature. Drug Saf 2007;30:1111-1125.
64. van Rosse F, Maat B, Rademaker CM, et al. The effect of computerized physician order entry on medication prescription errors and clinical outcome in pediatric and intensive care: a systematic review. Pediatrics 2009;123:1184-1190.
109
Interventions for reducing medication errors
Chap
ter 5
65. Cheung KC, van der Veen W, Bouvy ML, et al. Classification of medication incidents associated with information technology. JAMIA 2014;21:e63-e70 (E1).
66. Koppel R, Metlay JP, Cohen A, et al. Role of computerized physician order entry systems in facilitating medication errors. JAMA 2005;293:1197-1203.
67. Walsh KE, Adams WG, Bauchner H, et al. Medication errors related to computerized order entry for children. Pediatrics 2006;118:1872-1879.
68. Han YY, Carcillo JA, Venkataraman ST, et al. Unexpected increased mortality rate after implementation of a commercially sold computerized physician order entry system. Pediatrics 2005;116:1506-1512 (erratum in Pediatrics 2006;117:594).
69. Del Baccaro MA, Jeffries HE, Eisenberg MA, et al. Computerized provider order entry implementation: no association with increased mortality rates in an intensive care unit. Pediatrics 2006;118:290-295.
70. Keene A, Ashton L, Shure D, et al. Mortality before and after initiation of a computerized physician order entry system in a critically ill pediatric population. PCCM 2007;8:268-271.
71. Stultz JS, Nahata MC. Computerized clinical decision support for medication prescribing and utilization in pediatrics. JAMIA 2012;19:942-953.
72. Rinke ML, Bundy DG, Valesquez CA, et al. Interventions to reduce pediatric medication errors: a systematic review. Pediatrics 2014;134:338-360.
73. Manias E, Kinney S, Cranswick N, et al. Interventions to reduce medication errors in pediatric intensive care. Ann Pharmacother 2014;48:1313-1331.
74. Eccles M, Grimshaw J, Campbell M, et al. Research designs for studies evaluating the effectiveness of change and improvement strategies. Qual Saf Health Care 2003;12:47-52.
75. Fan E, Laupacis A, Pronovost PJ, et al. How to use an article about quality improvement. JAMA 2010;304:2279-2287.
110
Chapter 5
APPENDIX 1. MEDLINE SEARCH STRATEGY
Ovid MEDLINE(R) In-Process & Other Non-Indexed Citations and Ovid MEDLINE(R) <1946 to Present>, Ovid MEDLINE(R) Daily Update <October 29, 2013>
1 (preventable adverse drug or medication related adverse event?).ti. [Screen all] (37) 2 Medication errors/ or Inappropriate Prescribing/ (10960)3 (medication safety or medication incident? or medication error?).ti,ab. (3989)4 ((pharmacist? or prescrib$ or prescription? or dispens$ or dosing) adj2 (error? or
mistake? or miscalculat$)).ti,ab. (1404) 5 (medication? adj2 misadventure?).ti,ab. (40)6 ((inappropriate adj3 (prescription? or medication?)) or ((appropriat$ or inappropriat$
or optimal) adj2 prescrib$)).ti,ab. (2743) 7 effective prescribing practice?.ti,ab. (6)8 medication reconciliation/ [...done to avoid medication errors.] (264) 9 (quality improv$ and (prescrib$ or prescript$ or dosing)).ti. (32)10 ((weight-based or surface-based or weight independent) adj2 (prescrib$ or dose or
dosing or dosage?)).ti,ab. and (safety or error?).ti,hw. (59)11 ((drug? or medication? or medicine? or dose or dosage? or dosing) adj2 wrong$).
ti,ab. (402) 12 (medication? adj2 (reconciliation? or audit? or quality improvement)).ti. (269)13 (accident$ adj2 overdose?).ti,ab. (450) 14 (near miss or near misses).ti,ab. (1266)15 ((excess$ or inadequat$) adj2 (dosage? or dose? or dosing)).ti,ab. (2207)16 (“medication related” adj2 (problem? or issue? or hospitali?ation? or mortal$ or
morbid$ or illness$ or condition?)).ti,ab. (299) 17 Medical Order Entry Systems/ and (prescript$ or prescrib$).ti,hw. (374)18 Decision Support Systems, Clinical/ and (prescrib*.ti,hw. or medication?.ti. or *drug
therapy/) (327) 19 “Drug Therapy, Computer-Assisted”/ and (safety or error?).ti. (125)20 Electronic prescribing/ and (safety or error? or improv$).ti. (115)21 (prevent$ and (error? or (adverse adj2 event?))).ti. and (dosing or drug? or medication?
or prescript$ or prescrib$).ti,hw. (505) 22 ((drug? or medication? or prescrib$) adj3 error?).ti. and ((prevent$ or reduce? or
reducing).ti. or pc.fs.) (1090)23 “Pharmaceutical Preparations”/ae and (prevent$.ti. or (prevention or preventing).
hw.) (187)
111
Interventions for reducing medication errors
Chap
ter 5
24 (Pharmaceutical preparations/ or Drug Therapy/ or exp Drug Administration Routes/ or exp Drug administration schedule/ or exp drug delivery systems/ or drug dosage calculations/ or exp drug prescriptions/ or exp drug therapy, Combination/ or Drug Therapy, Computer-assisted/) and (error? or mistake or mistakes or prevent$ adverse).ti. (1418)
25 (Medication Systems, Hospital/ or Pharmacy Service, Hospital/) and ((error? or mistake or mistakes or prevent$ adverse).ti. or ((prevent$ or reduce? or reducing) adj2 (error? or adverse event? or adverse drug event? or medication related problem?)).ab.) (921)
26 (exp therapeutic uses/ or exp anti-infective agents/ or exp anti-bacterial agents/) and (((prevent$ or reduce? or reducing) and (error? or (adverse$ adj3 event?))) or (inappropriat$ adj2 “use”)).ti. (358)
27 Medical errors/pc and (medication? or drug?).ti,ab. (415)28 (exp therapeutic uses/ or exp anti-infective agents/ or exp anti-bacterial agents/) and
Medical Errors/ (403)29 (Pharmaceutical preparations/ or Drug Therapy/ or exp Drug Administration Routes/
or exp Drug administration schedule/ or exp drug delivery systems/ or drug dosage calculations/ or exp drug prescriptions/ or exp drug therapy, Combination/ or Drug Therapy, Computer-assisted/) and Medical Errors/ (369)
30 (prevent$ adverse drug or (causes adj2 (prescri$ error? or medication? error?)) or medication related adverse).ti,ab. (396)
31 Medication errors/pc or Inappropriate Prescribing/pc (4775)32 or/2-31 [Med Errors] (21118)33 exp Hospitals/ (200382)34 perioperative care/ or intraoperative care/ or postoperative care/ or perioperative
period/ or intraoperative period/ or postoperative period/ or preoperative period/ or Pain, Postoperative/ (140684)
35 exp Hospitalization/ (159154)36 exp Personnel, Hospital/ (77788)37 hospital$.ti. or (“in hospital?” or hospitali$).ab. (379338) 38 or/33-37 [Hosptials, Hospitalization General] (753824)39 Intensive Care Units, Pediatric/ or Intensive Care, Neonatal/ or Intensive Care Units,
Neonatal/ or Hospitals, Pediatric/ (25940) 40 Pediatric Nursing/ or Neonatal Nursing/ or Neonatology/ or Perinatology/ (18628)41 ((p?ediatric? or children? or neonatal or infant?) adj3 (hospital? or ICU or intensive
care or care unit or department?)).ti,ab. (53874) 42 or/39-41 [Pediatric Hospitals] (80991)43 exp child/ or adolescent/ (2429627)
112
Chapter 5
44 (child or children or child? or newborn? or p?ediatric? or infant? or neonate? or teenager? or teens or adolescent? or baby or babies).ti,ab. (1397185)
45 Pediatrics/ or Adolescent Medicine/ (40945)46 Neonatology/ or Perinatology/ (3531)47 or/43-46 [Child/Pediatrics] (3004657)48 exp Adults/ (5618048)49 exp Residential Facilities/ (43206)50 (elderly or nursing home?).ti,ab. or geriatric?.ti,ab,hw. or adult?.ti. (456222) 51 or/48-50 [Adults, Elderly, Nursing Homes non-hospital facilities] (5759432)52 (cocaine or cannabis or marijuana or drug abuse or street drug?).ti,ab,hw. [Terms to
exclude] (70327) 53 32 and 38 and 47 [Med Errors & Hospitals & Child/Pediatrics] (761)54 (32 and 42) not 53 [Med Errors & Pediatric Units/Hospitals] (338)55 (32 and 38) not 51 not (or/53-54) [Med Errors & Hospitals not Adults] (2471) 56 (or/53-55) not 52 [Results before Filters--illicit drug terms excluded] (3566)57 (randomized controlled trial or controlled clinical trial).pt. or randomized.ab. or
clinical trials as topic.sh. or randomly.ab. or trial.ti. (897270)58 exp animals/ not humans.sh. (4055578)59 57 not 58 [Cochrane RCT Filter 6.4.d Sens/Precision Maximizing--placebo removed]
(833187)60 intervention?.ti. or (intervention? adj6 (clinician? or collaborat$ or community or
complex or DESIGN$ or doctor? or educational or family doctor? or family physician? or family practitioner? or financial or GP or general practice? or hospital? or impact? or improv$ or individuali?e? or individuali?ing or interdisciplin$ or multicomponent or multi-component or multidisciplin$ or multi-disciplin$ or multifacet$ or multi-facet$ or multimodal$ or multi-modal$ or personali?e? or personali?ing or pharmacies or pharmacist? or pharmacy or physician? or practitioner? or prescrib$ or prescription? or primary care or professional$ or provider? or regulatory or regulatory or tailor$ or target$ or team$ or usual care)).ab. (166583)
61 (pre-intervention? or preintervention? or “pre intervention?” or post-intervention? or postintervention? or “post intervention?”).ti,ab.[added 2.4] (10314)
62 (hospital$ or patient?).hw. and (study or studies or care or health$ or practitioner? or provider? or physician? or nurse? or nursing or doctor?).ti,hw. (721910)
63 demonstration project?.ti,ab. (1989)64 (pre-post or “pre test$” or pretest$ or posttest$ or “post test$” or (pre adj5 post)).ti,ab.
(65937) 65 (pre-workshop or post-workshop or (before adj3 workshop) or (after adj3 workshop)).
ti,ab. (610)
113
Interventions for reducing medication errors
Chap
ter 5
66 trial.ti. or ((study adj3 aim?) or “our study”).ab. (635247)67 (before adj10 (after or during)).ti,ab. (363594)68 (“quasi-experiment$” or quasiexperiment$ or “quasi random$” or quasirandom$
or “quasi control$” or quasicontrol$ or ((quasi$ or experimental) adj3 (method$ or study or trial or design$))).ti,ab,hw. [ML] (104652)
69 (“time series” adj2 interrupt$).ti,ab,hw. [ML] (1192)70 (time points adj3 (over or multiple or three or four or five or six or seven or eight or
nine or ten or eleven or twelve or month$ or hour? Or day? Or “moren than”)).ab. (9441)
71 pilot.ti (40033)72 Pilot projects/ [ML] (84176)73 (clinical trial or controlled clinical trial or multicenter study).pt. [ML] (650503) 74 (multicentre or multicenter or multi-centre or multi-center).ti. (29891)75 random$.ti,ab. or controlled.ti. (781262)76 (control adj3 (area or cohort? or compare? or condition or design or group? or
intervention? or participant? or study)).ab. not (controlled clinical trial or randomized controlled trial).pt. [ML] (413431)
77 “comment on”.cm. or review.ti,pt. or randomized controlled trial.pt. [ML] (2964738)78 (rat or rats or cow or cows or chicken? or horse or horses or mice or mouse or bovine
or animal?).ti. (1370441) 79 exp animals/ not humans.sh. [ML] (4055578)80 (or/60-76) not (or/77-79) [EPOC Methods Filter 2.4 Medline] (2156894)
Results from search conducted October 201381 56 and 59 [RCT Results] (182)82 (56 and 80) not 81 [EPOC Filter Results] (2131)83 ((1 and (or/42,47)) or (1 not 51)) not (or/81-82) [KW Results] (11)84 “2013”.ep,ed,yr. (789818)85 (“201211$” or “201212$”).ed,ep. [Nov-Dec 2012] (259202)86 (or/81-83) and (or/84-85) [Update results Nov 2012 to Oct 29, 2013] (144)
Results from search conducted October 20128156 and 59 [RCT Results] (145)82 (56 and 80) not 81 [EPOC Filter Results] (1837)83 ((1 and (or/42,47)) or (1 not 51)) not (or/81-82) [KW Results] (13)
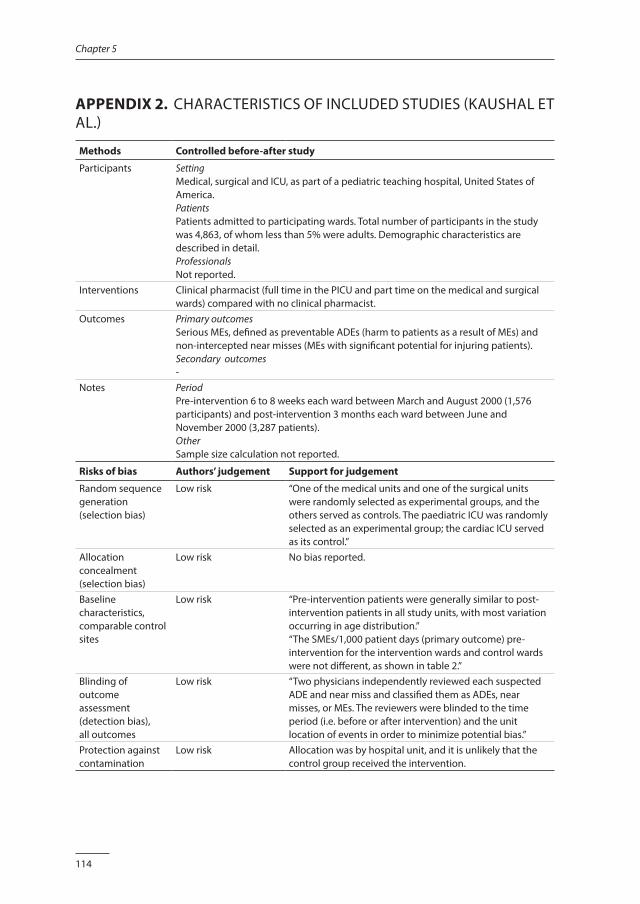
114
Chapter 5
APPENDIX 2. CHARACTERISTICS OF INCLUDED STUDIES (KAUSHAL ET AL.)
Methods Controlled before-after study
Participants SettingMedical, surgical and ICU, as part of a pediatric teaching hospital, United States of America.PatientsPatients admitted to participating wards. Total number of participants in the study was 4,863, of whom less than 5% were adults. Demographic characteristics are described in detail.ProfessionalsNot reported.
Interventions Clinical pharmacist (full time in the PICU and part time on the medical and surgical wards) compared with no clinical pharmacist.
Outcomes Primary outcomesSerious MEs, defined as preventable ADEs (harm to patients as a result of MEs) and non-intercepted near misses (MEs with significant potential for injuring patients).Secondary outcomes-
Notes PeriodPre-intervention 6 to 8 weeks each ward between March and August 2000 (1,576 participants) and post-intervention 3 months each ward between June and November 2000 (3,287 patients).OtherSample size calculation not reported.
Risks of bias Authors’ judgement Support for judgement
Random sequence generation (selection bias)
Low risk “One of the medical units and one of the surgical units were randomly selected as experimental groups, and the others served as controls. The paediatric ICU was randomly selected as an experimental group; the cardiac ICU served as its control.”
Allocation concealment (selection bias)
Low risk No bias reported.
Baseline characteristics, comparable control sites
Low risk “Pre-intervention patients were generally similar to post-intervention patients in all study units, with most variation occurring in age distribution.”“The SMEs/1,000 patient days (primary outcome) pre-intervention for the intervention wards and control wards were not different, as shown in table 2.”
Blinding of outcome assessment (detection bias),all outcomes
Low risk “Two physicians independently reviewed each suspected ADE and near miss and classified them as ADEs, near misses, or MEs. The reviewers were blinded to the time period (i.e. before or after intervention) and the unit location of events in order to minimize potential bias.”
Protection against contamination
Low risk Allocation was by hospital unit, and it is unlikely that the control group received the intervention.
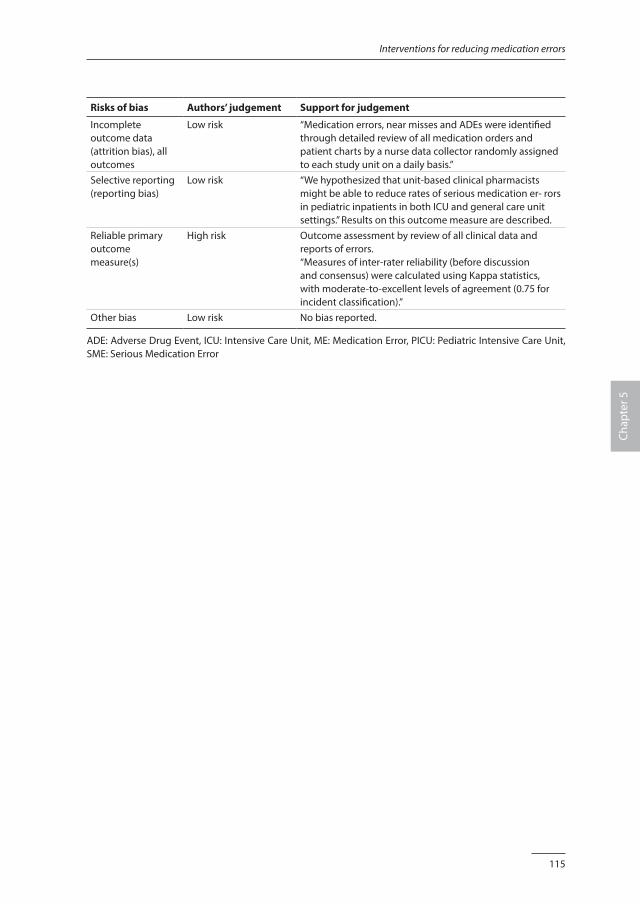
115
Interventions for reducing medication errors
Chap
ter 5
Risks of bias Authors’ judgement Support for judgement
Incomplete outcome data (attrition bias), all outcomes
Low risk “Medication errors, near misses and ADEs were identified through detailed review of all medication orders and patient charts by a nurse data collector randomly assigned to each study unit on a daily basis.”
Selective reporting (reporting bias)
Low risk “We hypothesized that unit-based clinical pharmacists might be able to reduce rates of serious medication er- rors in pediatric inpatients in both ICU and general care unit settings.” Results on this outcome measure are described.
Reliable primary outcome measure(s)
High risk Outcome assessment by review of all clinical data and reports of errors.“Measures of inter-rater reliability (before discussion and consensus) were calculated using Kappa statistics, with moderate-to-excellent levels of agreement (0.75 for incident classification).”
Other bias Low risk No bias reported.
ADE: Adverse Drug Event, ICU: Intensive Care Unit, ME: Medication Error, PICU: Pediatric Intensive Care Unit, SME: Serious Medication Error
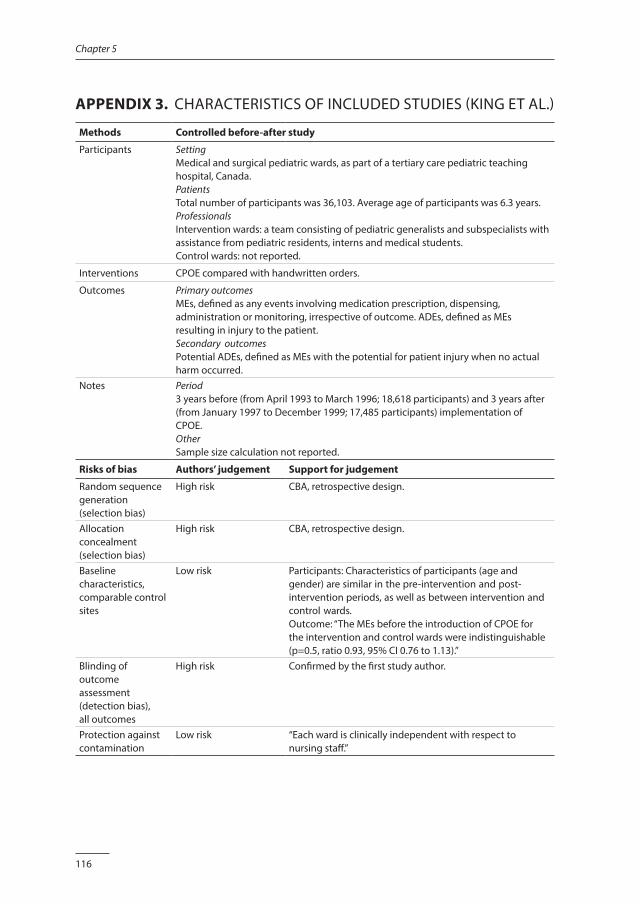
116
Chapter 5
APPENDIX 3. CHARACTERISTICS OF INCLUDED STUDIES (KING ET AL.)
Methods Controlled before-after study
Participants SettingMedical and surgical pediatric wards, as part of a tertiary care pediatric teaching hospital, Canada.PatientsTotal number of participants was 36,103. Average age of participants was 6.3 years.ProfessionalsIntervention wards: a team consisting of pediatric generalists and subspecialists with assistance from pediatric residents, interns and medical students.Control wards: not reported.
Interventions CPOE compared with handwritten orders.
Outcomes Primary outcomesMEs, defined as any events involving medication prescription, dispensing, administration or monitoring, irrespective of outcome. ADEs, defined as MEs resulting in injury to the patient.Secondary outcomesPotential ADEs, defined as MEs with the potential for patient injury when no actual harm occurred.
Notes Period3 years before (from April 1993 to March 1996; 18,618 participants) and 3 years after (from January 1997 to December 1999; 17,485 participants) implementation of CPOE. OtherSample size calculation not reported.
Risks of bias Authors’ judgement Support for judgement
Random sequence generation (selection bias)
High risk CBA, retrospective design.
Allocation concealment (selection bias)
High risk CBA, retrospective design.
Baseline characteristics, comparable control sites
Low risk Participants: Characteristics of participants (age and gender) are similar in the pre-intervention and post-intervention periods, as well as between intervention and control wards.Outcome: “The MEs before the introduction of CPOE for the intervention and control wards were indistinguishable (p=0.5, ratio 0.93, 95% CI 0.76 to 1.13).”
Blinding of outcome assessment (detection bias),all outcomes
High risk Confirmed by the first study author.
Protection against contamination
Low risk “Each ward is clinically independent with respect to nursing staff.”
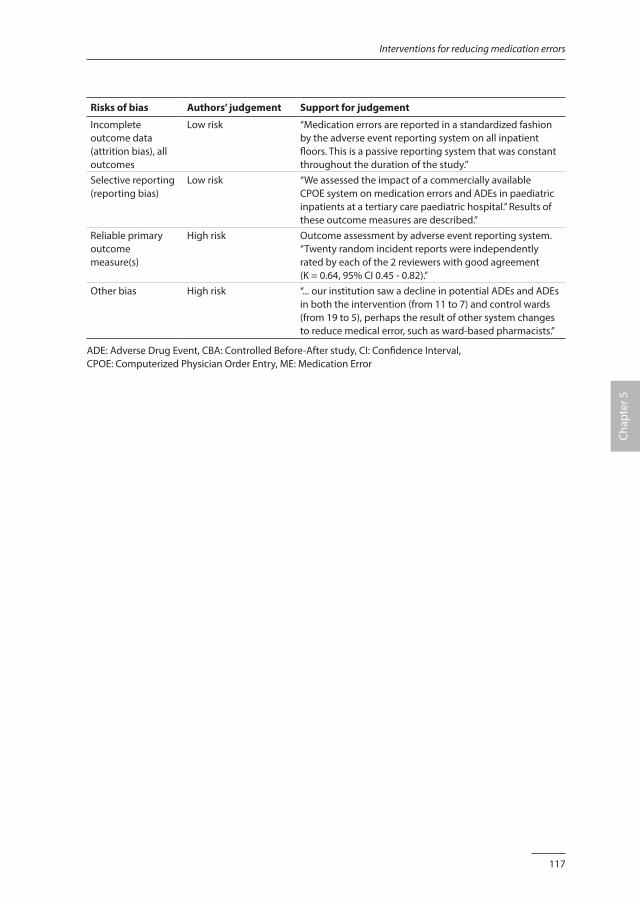
117
Interventions for reducing medication errors
Chap
ter 5
Risks of bias Authors’ judgement Support for judgement
Incomplete outcome data (attrition bias), all outcomes
Low risk “Medication errors are reported in a standardized fashion by the adverse event reporting system on all inpatient floors. This is a passive reporting system that was constant throughout the duration of the study.”
Selective reporting (reporting bias)
Low risk “We assessed the impact of a commercially available CPOE system on medication errors and ADEs in paediatric inpatients at a tertiary care paediatric hospital.” Results of these outcome measures are described.”
Reliable primary outcome measure(s)
High risk Outcome assessment by adverse event reporting system. “Twenty random incident reports were independently rated by each of the 2 reviewers with good agreement (K = 0.64, 95% CI 0.45 - 0.82).”
Other bias High risk “... our institution saw a decline in potential ADEs and ADEs in both the intervention (from 11 to 7) and control wards (from 19 to 5), perhaps the result of other system changes to reduce medical error, such as ward-based pharmacists.”
ADE: Adverse Drug Event, CBA: Controlled Before-After study, CI: Confidence Interval, CPOE: Computerized Physician Order Entry, ME: Medication Error
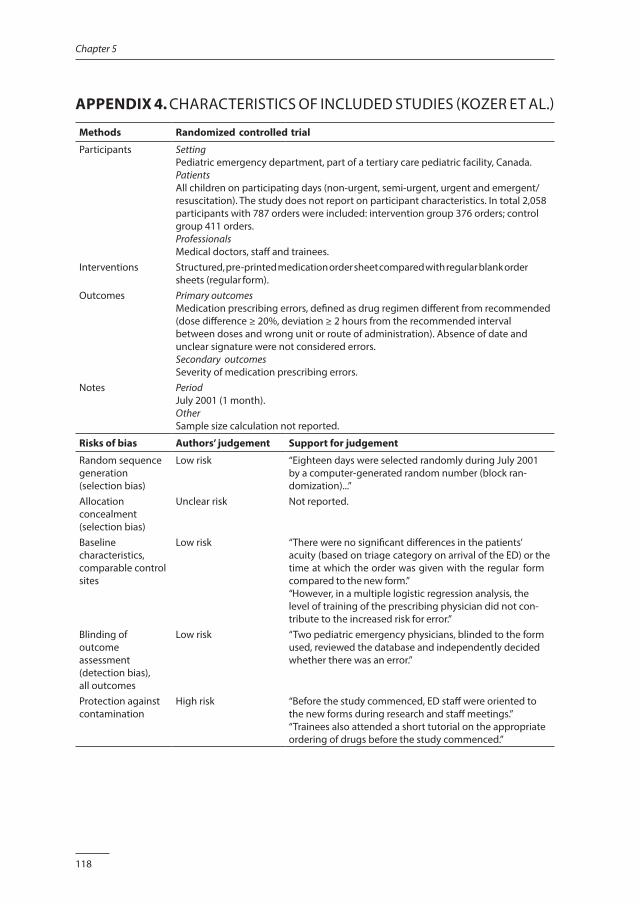
118
Chapter 5
APPENDIX 4. CHARACTERISTICS OF INCLUDED STUDIES (KOZER ET AL.)
Methods Randomized controlled trial
Participants SettingPediatric emergency department, part of a tertiary care pediatric facility, Canada.PatientsAll children on participating days (non-urgent, semi-urgent, urgent and emergent/resuscitation). The study does not report on participant characteristics. In total 2,058 participants with 787 orders were included: intervention group 376 orders; control group 411 orders.ProfessionalsMedical doctors, staff and trainees.
Interventions Structured, pre-printed medication order sheet compared with regular blank order sheets (regular form).
Outcomes Primary outcomesMedication prescribing errors, defined as drug regimen different from recommended (dose difference ≥ 20%, deviation ≥ 2 hours from the recommended interval between doses and wrong unit or route of administration). Absence of date and unclear signature were not considered errors.Secondary outcomesSeverity of medication prescribing errors.
Notes PeriodJuly 2001 (1 month).OtherSample size calculation not reported.
Risks of bias Authors’ judgement Support for judgement
Random sequence generation (selection bias)
Low risk “Eighteen days were selected randomly during July 2001 by a computer-generated random number (block ran- domization)...”
Allocation concealment (selection bias)
Unclear risk Not reported.
Baseline characteristics, comparable control sites
Low risk “There were no significant differences in the patients’ acuity (based on triage category on arrival of the ED) or the time at which the order was given with the regular form compared to the new form.”“However, in a multiple logistic regression analysis, the level of training of the prescribing physician did not con- tribute to the increased risk for error.”
Blinding of outcome assessment (detection bias),all outcomes
Low risk “Two pediatric emergency physicians, blinded to the form used, reviewed the database and independently decided whether there was an error.”
Protection against contamination
High risk “Before the study commenced, ED staff were oriented to the new forms during research and staff meetings.” “Trainees also attended a short tutorial on the appropriate ordering of drugs before the study commenced.”
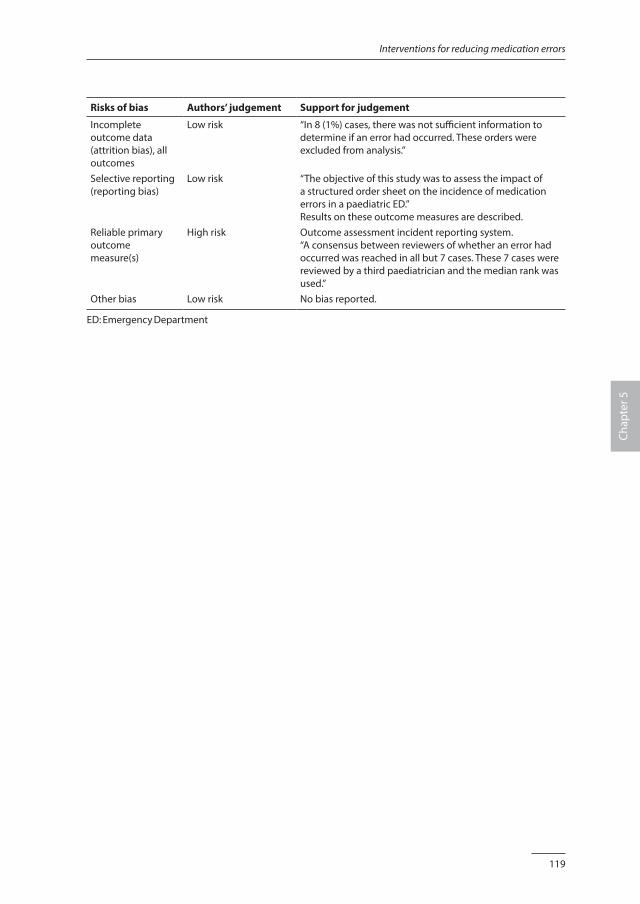
119
Interventions for reducing medication errors
Chap
ter 5
Risks of bias Authors’ judgement Support for judgement
Incomplete outcome data (attrition bias), all outcomes
Low risk “In 8 (1%) cases, there was not sufficient information to determine if an error had occurred. These orders were excluded from analysis.”
Selective reporting (reporting bias)
Low risk “The objective of this study was to assess the impact of a structured order sheet on the incidence of medication errors in a paediatric ED.”Results on these outcome measures are described.
Reliable primary outcome measure(s)
High risk Outcome assessment incident reporting system.“A consensus between reviewers of whether an error had occurred was reached in all but 7 cases. These 7 cases were reviewed by a third paediatrician and the median rank was used.”
Other bias Low risk No bias reported.
ED: Emergency Department
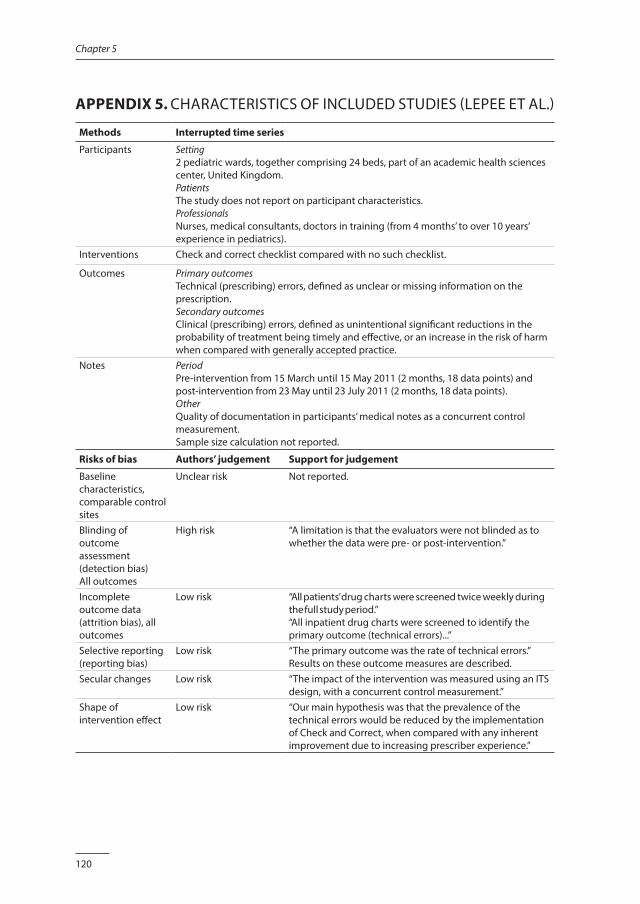
120
Chapter 5
APPENDIX 5. CHARACTERISTICS OF INCLUDED STUDIES (LEPEE ET AL.)
Methods Interrupted time series
Participants Setting2 pediatric wards, together comprising 24 beds, part of an academic health sciences center, United Kingdom.PatientsThe study does not report on participant characteristics.ProfessionalsNurses, medical consultants, doctors in training (from 4 months’ to over 10 years’ experience in pediatrics).
Interventions Check and correct checklist compared with no such checklist.
Outcomes Primary outcomesTechnical (prescribing) errors, defined as unclear or missing information on the prescription.Secondary outcomesClinical (prescribing) errors, defined as unintentional significant reductions in the probability of treatment being timely and effective, or an increase in the risk of harm when compared with generally accepted practice.
Notes PeriodPre-intervention from 15 March until 15 May 2011 (2 months, 18 data points) and post-intervention from 23 May until 23 July 2011 (2 months, 18 data points).OtherQuality of documentation in participants’ medical notes as a concurrent control measurement.Sample size calculation not reported.
Risks of bias Authors’ judgement Support for judgement
Baseline characteristics, comparable control sites
Unclear risk Not reported.
Blinding of outcome assessment (detection bias)All outcomes
High risk “A limitation is that the evaluators were not blinded as to whether the data were pre- or post-intervention.”
Incomplete outcome data (attrition bias), all outcomes
Low risk “All patients’ drug charts were screened twice weekly during the full study period.”“All inpatient drug charts were screened to identify the primary outcome (technical errors)...”
Selective reporting (reporting bias)
Low risk “The primary outcome was the rate of technical errors.” Results on these outcome measures are described.
Secular changes Low risk “The impact of the intervention was measured using an ITS design, with a concurrent control measurement.”
Shape of intervention effect
Low risk “Our main hypothesis was that the prevalence of the technical errors would be reduced by the implementation of Check and Correct, when compared with any inherent improvement due to increasing prescriber experience.”
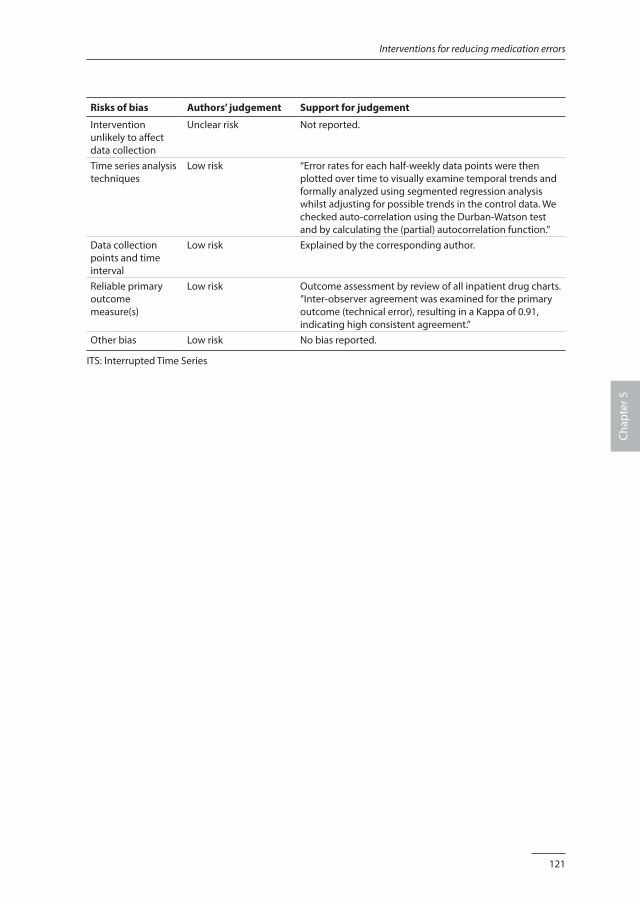
121
Interventions for reducing medication errors
Chap
ter 5
Risks of bias Authors’ judgement Support for judgement
Intervention unlikely to affect data collection
Unclear risk Not reported.
Time series analysis techniques
Low risk “Error rates for each half-weekly data points were then plotted over time to visually examine temporal trends and formally analyzed using segmented regression analysis whilst adjusting for possible trends in the control data. We checked auto-correlation using the Durban-Watson test and by calculating the (partial) autocorrelation function.”
Data collection points and time interval
Low risk Explained by the corresponding author.
Reliable primary outcome measure(s)
Low risk Outcome assessment by review of all inpatient drug charts. ”Inter-observer agreement was examined for the primary outcome (technical error), resulting in a Kappa of 0.91, indicating high consistent agreement.”
Other bias Low risk No bias reported.
ITS: Interrupted Time Series
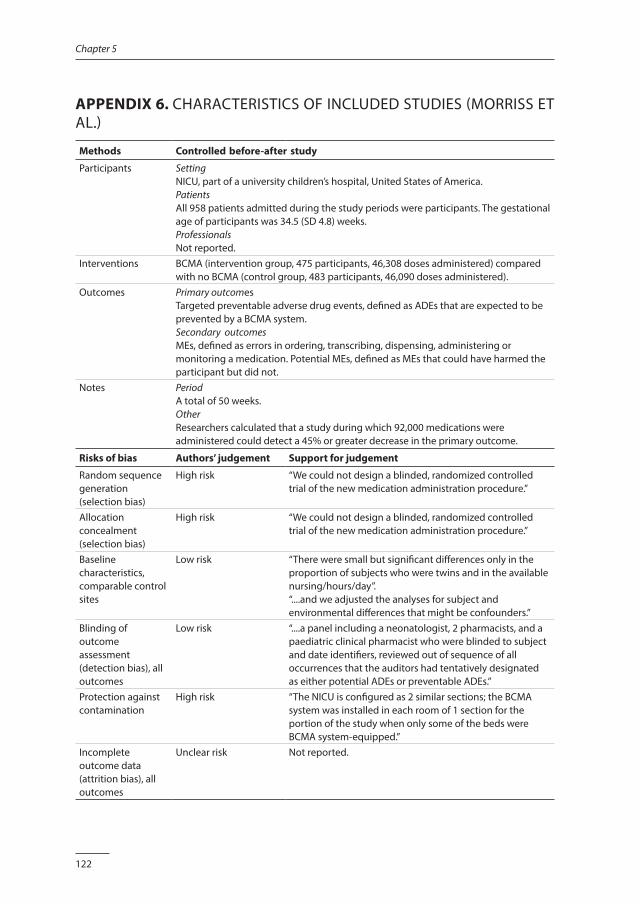
122
Chapter 5
APPENDIX 6. CHARACTERISTICS OF INCLUDED STUDIES (MORRISS ET AL.)
Methods Controlled before-after study
Participants SettingNICU, part of a university children’s hospital, United States of America.PatientsAll 958 patients admitted during the study periods were participants. The gestational age of participants was 34.5 (SD 4.8) weeks.ProfessionalsNot reported.
Interventions BCMA (intervention group, 475 participants, 46,308 doses administered) compared with no BCMA (control group, 483 participants, 46,090 doses administered).
Outcomes Primary outcomesTargeted preventable adverse drug events, defined as ADEs that are expected to be prevented by a BCMA system.Secondary outcomesMEs, defined as errors in ordering, transcribing, dispensing, administering or monitoring a medication. Potential MEs, defined as MEs that could have harmed the participant but did not.
Notes PeriodA total of 50 weeks.OtherResearchers calculated that a study during which 92,000 medications were administered could detect a 45% or greater decrease in the primary outcome.
Risks of bias Authors’ judgement Support for judgement
Random sequence generation (selection bias)
High risk “We could not design a blinded, randomized controlled trial of the new medication administration procedure.”
Allocation concealment (selection bias)
High risk “We could not design a blinded, randomized controlled trial of the new medication administration procedure.”
Baseline characteristics, comparable control sites
Low risk “There were small but significant differences only in the proportion of subjects who were twins and in the available nursing/hours/day”.“....and we adjusted the analyses for subject and environmental differences that might be confounders.”
Blinding of outcome assessment (detection bias), all outcomes
Low risk “....a panel including a neonatologist, 2 pharmacists, and a paediatric clinical pharmacist who were blinded to subject and date identifiers, reviewed out of sequence of all occurrences that the auditors had tentatively designated as either potential ADEs or preventable ADEs.”
Protection against contamination
High risk “The NICU is configured as 2 similar sections; the BCMA system was installed in each room of 1 section for the portion of the study when only some of the beds were BCMA system-equipped.”
Incomplete outcome data (attrition bias), all outcomes
Unclear risk Not reported.
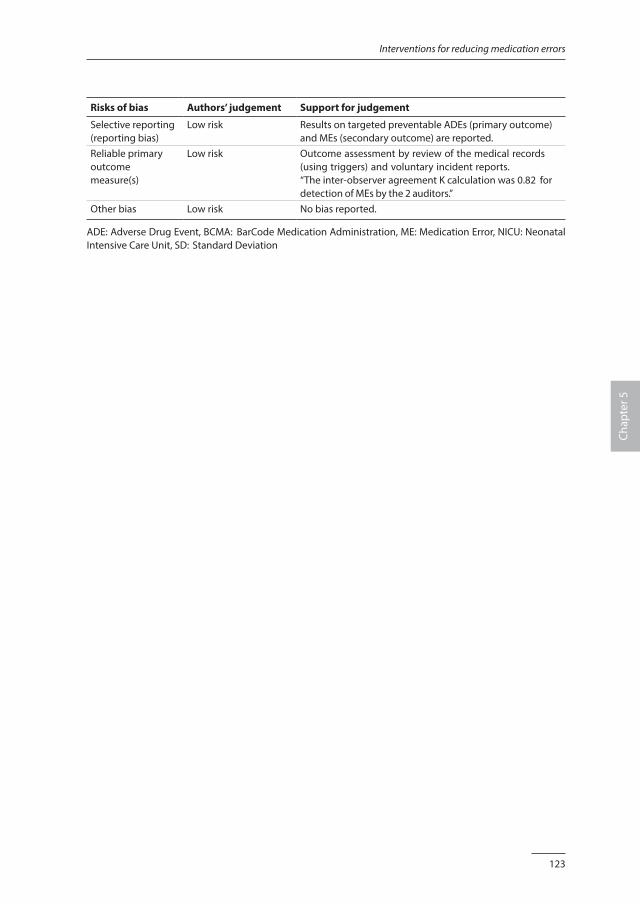
123
Interventions for reducing medication errors
Chap
ter 5
Risks of bias Authors’ judgement Support for judgement
Selective reporting (reporting bias)
Low risk Results on targeted preventable ADEs (primary outcome) and MEs (secondary outcome) are reported.
Reliable primary outcome measure(s)
Low risk Outcome assessment by review of the medical records (using triggers) and voluntary incident reports.“The inter-observer agreement K calculation was 0.82 for detection of MEs by the 2 auditors.”
Other bias Low risk No bias reported.
ADE: Adverse Drug Event, BCMA: BarCode Medication Administration, ME: Medication Error, NICU: Neonatal Intensive Care Unit, SD: Standard Deviation
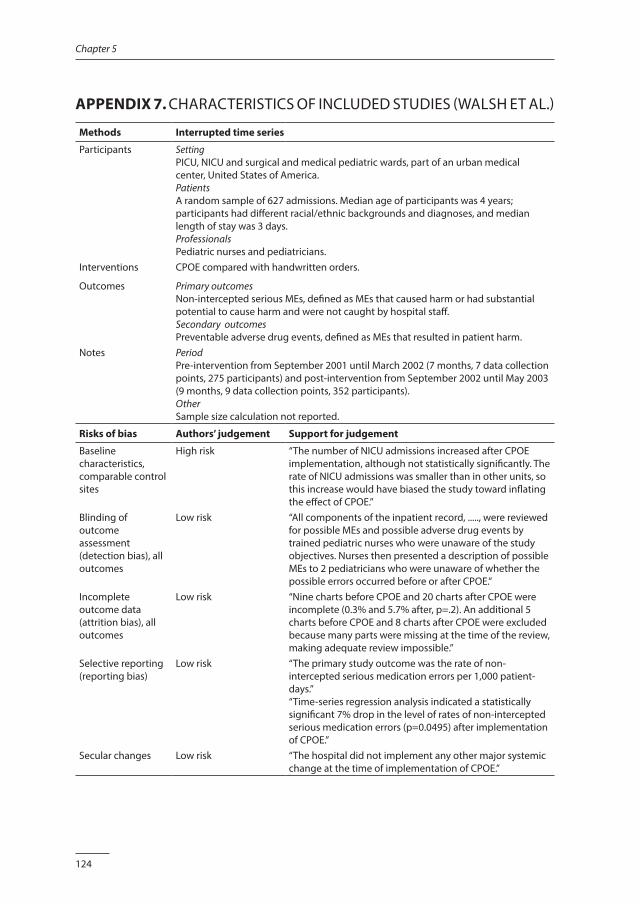
124
Chapter 5
APPENDIX 7. CHARACTERISTICS OF INCLUDED STUDIES (WALSH ET AL.)
Methods Interrupted time series
Participants SettingPICU, NICU and surgical and medical pediatric wards, part of an urban medical center, United States of America.PatientsA random sample of 627 admissions. Median age of participants was 4 years; participants had different racial/ethnic backgrounds and diagnoses, and median length of stay was 3 days.ProfessionalsPediatric nurses and pediatricians.
Interventions CPOE compared with handwritten orders.
Outcomes Primary outcomesNon-intercepted serious MEs, defined as MEs that caused harm or had substantial potential to cause harm and were not caught by hospital staff.Secondary outcomesPreventable adverse drug events, defined as MEs that resulted in patient harm.
Notes PeriodPre-intervention from September 2001 until March 2002 (7 months, 7 data collection points, 275 participants) and post-intervention from September 2002 until May 2003 (9 months, 9 data collection points, 352 participants).OtherSample size calculation not reported.
Risks of bias Authors’ judgement Support for judgement
Baseline characteristics, comparable control sites
High risk “The number of NICU admissions increased after CPOE implementation, although not statistically significantly. The rate of NICU admissions was smaller than in other units, so this increase would have biased the study toward inflating the effect of CPOE.”
Blinding of outcome assessment (detection bias), all outcomes
Low risk “All components of the inpatient record, ....., were reviewed for possible MEs and possible adverse drug events by trained pediatric nurses who were unaware of the study objectives. Nurses then presented a description of possible MEs to 2 pediatricians who were unaware of whether the possible errors occurred before or after CPOE.”
Incomplete outcome data (attrition bias), all outcomes
Low risk “Nine charts before CPOE and 20 charts after CPOE were incomplete (0.3% and 5.7% after, p=.2). An additional 5 charts before CPOE and 8 charts after CPOE were excluded because many parts were missing at the time of the review, making adequate review impossible.”
Selective reporting (reporting bias)
Low risk “The primary study outcome was the rate of non-intercepted serious medication errors per 1,000 patient-days.”“Time-series regression analysis indicated a statistically significant 7% drop in the level of rates of non-intercepted serious medication errors (p=0.0495) after implementation of CPOE.”
Secular changes Low risk “The hospital did not implement any other major systemic change at the time of implementation of CPOE.”
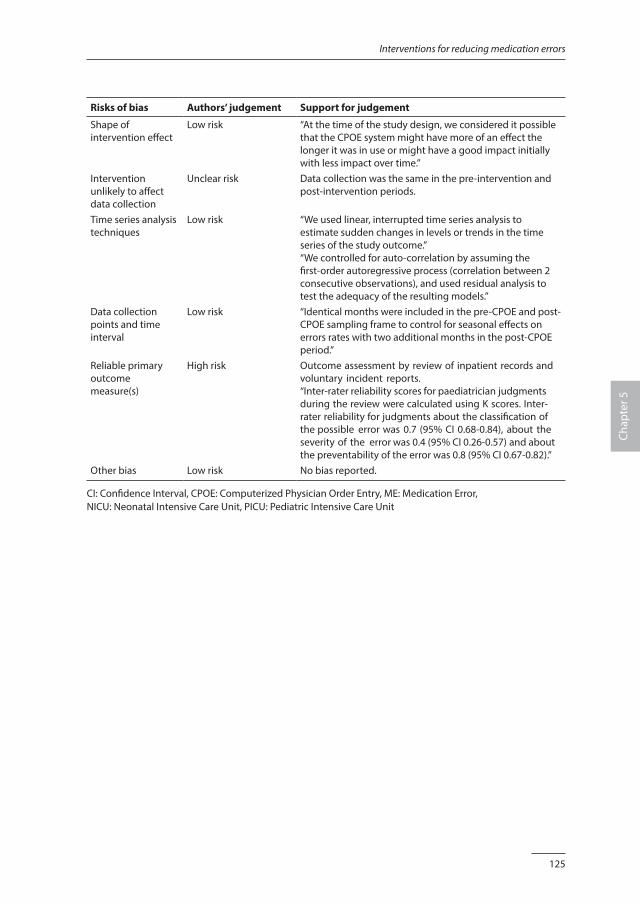
125
Interventions for reducing medication errors
Chap
ter 5
Risks of bias Authors’ judgement Support for judgement
Shape of intervention effect
Low risk “At the time of the study design, we considered it possible that the CPOE system might have more of an effect the longer it was in use or might have a good impact initially with less impact over time.”
Intervention unlikely to affect data collection
Unclear risk Data collection was the same in the pre-intervention and post-intervention periods.
Time series analysis techniques
Low risk “We used linear, interrupted time series analysis to estimate sudden changes in levels or trends in the time series of the study outcome.”“We controlled for auto-correlation by assuming the first-order autoregressive process (correlation between 2 consecutive observations), and used residual analysis to test the adequacy of the resulting models.”
Data collection points and time interval
Low risk “Identical months were included in the pre-CPOE and post-CPOE sampling frame to control for seasonal effects on errors rates with two additional months in the post-CPOE period.”
Reliable primary outcome measure(s)
High risk Outcome assessment by review of inpatient records and voluntary incident reports.“Inter-rater reliability scores for paediatrician judgments during the review were calculated using K scores. Inter-rater reliability for judgments about the classification of the possible error was 0.7 (95% CI 0.68-0.84), about the severity of the error was 0.4 (95% CI 0.26-0.57) and about the preventability of the error was 0.8 (95% CI 0.67-0.82).”
Other bias Low risk No bias reported.
CI: Confidence Interval, CPOE: Computerized Physician Order Entry, ME: Medication Error, NICU: Neonatal Intensive Care Unit, PICU: Pediatric Intensive Care Unit
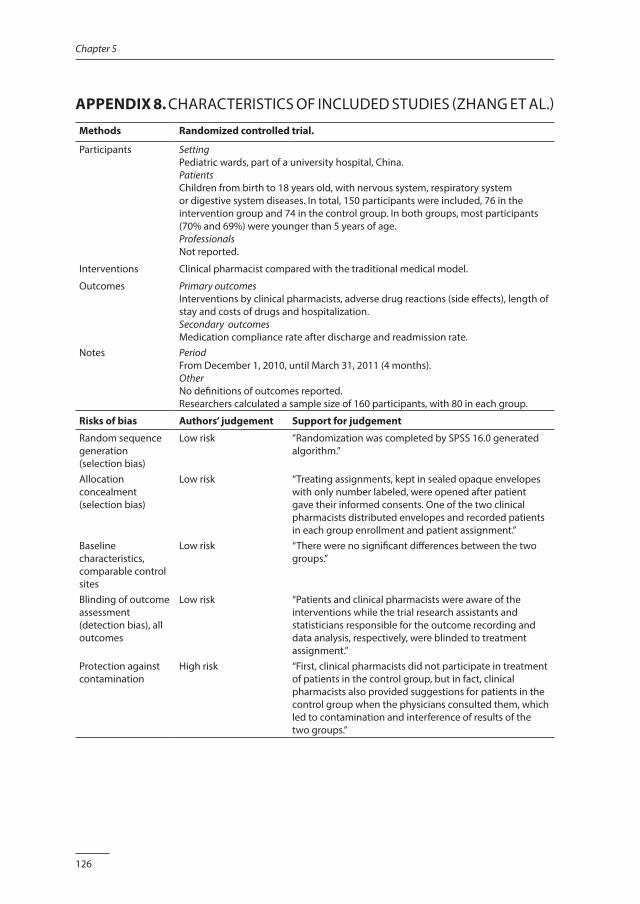
126
Chapter 5
APPENDIX 8. CHARACTERISTICS OF INCLUDED STUDIES (ZHANG ET AL.)
Methods Randomized controlled trial.
Participants SettingPediatric wards, part of a university hospital, China.PatientsChildren from birth to 18 years old, with nervous system, respiratory system or digestive system diseases. In total, 150 participants were included, 76 in the intervention group and 74 in the control group. In both groups, most participants (70% and 69%) were younger than 5 years of age.ProfessionalsNot reported.
Interventions Clinical pharmacist compared with the traditional medical model.
Outcomes Primary outcomesInterventions by clinical pharmacists, adverse drug reactions (side effects), length of stay and costs of drugs and hospitalization.Secondary outcomesMedication compliance rate after discharge and readmission rate.
Notes PeriodFrom December 1, 2010, until March 31, 2011 (4 months).OtherNo definitions of outcomes reported.Researchers calculated a sample size of 160 participants, with 80 in each group.
Risks of bias Authors’ judgement Support for judgement
Random sequence generation (selection bias)
Low risk ”Randomization was completed by SPSS 16.0 generated algorithm.”
Allocation concealment (selection bias)
Low risk “Treating assignments, kept in sealed opaque envelopes with only number labeled, were opened after patient gave their informed consents. One of the two clinical pharmacists distributed envelopes and recorded patients in each group enrollment and patient assignment.”
Baseline characteristics, comparable control sites
Low risk “There were no significant differences between the two groups.”
Blinding of outcome assessment (detection bias), all outcomes
Low risk “Patients and clinical pharmacists were aware of the interventions while the trial research assistants and statisticians responsible for the outcome recording and data analysis, respectively, were blinded to treatment assignment.”
Protection against contamination
High risk “First, clinical pharmacists did not participate in treatment of patients in the control group, but in fact, clinical pharmacists also provided suggestions for patients in the control group when the physicians consulted them, which led to contamination and interference of results of the two groups.”
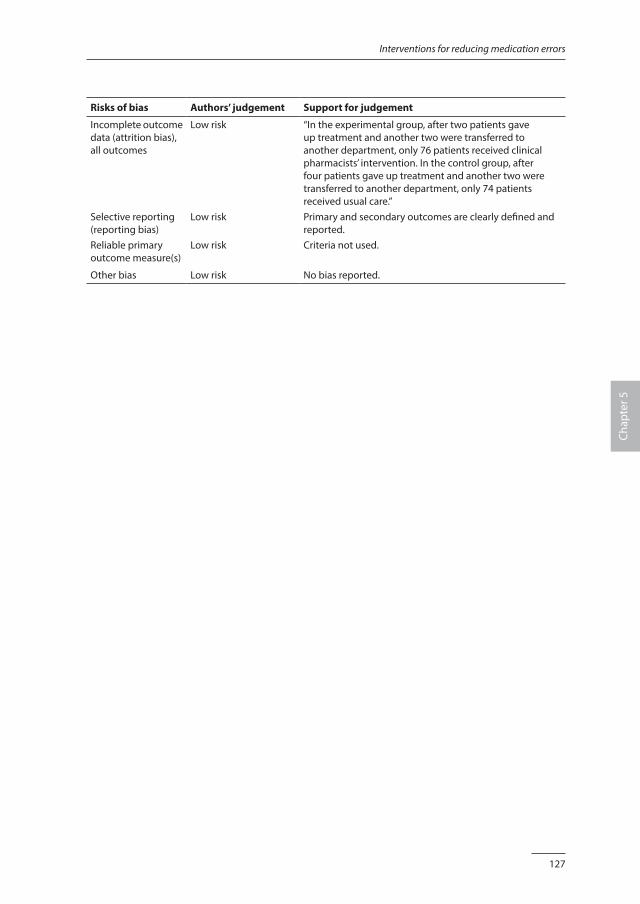
127
Interventions for reducing medication errors
Chap
ter 5
Risks of bias Authors’ judgement Support for judgement
Incomplete outcome data (attrition bias), all outcomes
Low risk “In the experimental group, after two patients gave up treatment and another two were transferred to another department, only 76 patients received clinical pharmacists’ intervention. In the control group, after four patients gave up treatment and another two were transferred to another department, only 74 patients received usual care.”
Selective reporting (reporting bias)
Low risk Primary and secondary outcomes are clearly defined and reported.
Reliable primary outcome measure(s)
Low risk Criteria not used.
Other bias Low risk No bias reported.

Chapter 6
Medication review and feedback by a clinical pharmacist decrease medication errors at the PICU:
an interrupted time series analysis
Jolanda MaaskantMarieke Tio
Reinier van HestHester VermeulenVincent Geukers
Submitted.
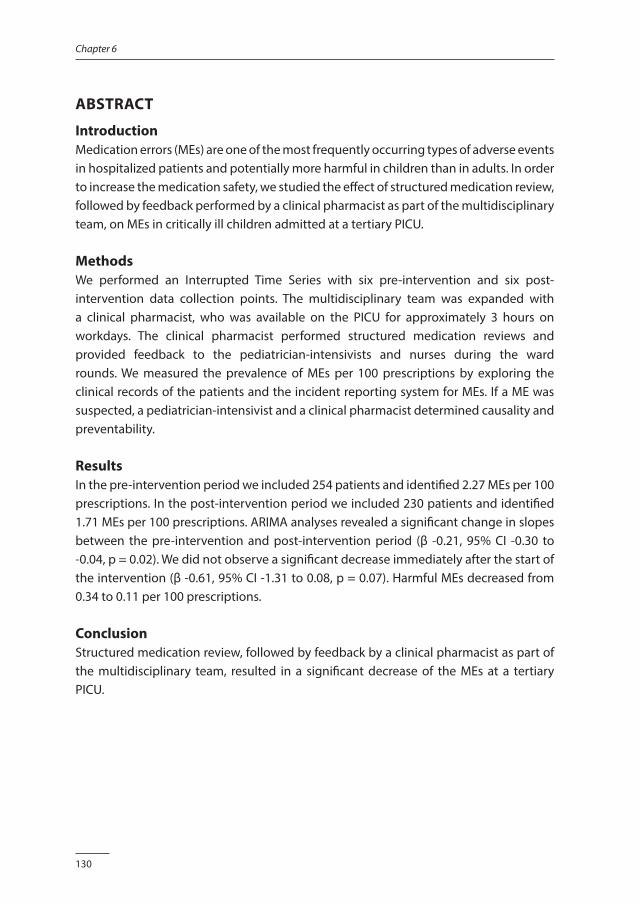
130
Chapter 6
ABSTRACT
IntroductionMedication errors (MEs) are one of the most frequently occurring types of adverse events in hospitalized patients and potentially more harmful in children than in adults. In order to increase the medication safety, we studied the effect of structured medication review, followed by feedback performed by a clinical pharmacist as part of the multidisciplinary team, on MEs in critically ill children admitted at a tertiary PICU.
MethodsWe performed an Interrupted Time Series with six pre-intervention and six post-intervention data collection points. The multidisciplinary team was expanded with a clinical pharmacist, who was available on the PICU for approximately 3 hours on workdays. The clinical pharmacist performed structured medication reviews and provided feedback to the pediatrician-intensivists and nurses during the ward rounds. We measured the prevalence of MEs per 100 prescriptions by exploring the clinical records of the patients and the incident reporting system for MEs. If a ME was suspected, a pediatrician-intensivist and a clinical pharmacist determined causality and preventability.
ResultsIn the pre-intervention period we included 254 patients and identified 2.27 MEs per 100 prescriptions. In the post-intervention period we included 230 patients and identified 1.71 MEs per 100 prescriptions. ARIMA analyses revealed a significant change in slopes between the pre-intervention and post-intervention period (β -0.21, 95% CI -0.30 to -0.04, p = 0.02). We did not observe a significant decrease immediately after the start of the intervention (β -0.61, 95% CI -1.31 to 0.08, p = 0.07). Harmful MEs decreased from 0.34 to 0.11 per 100 prescriptions.
ConclusionStructured medication review, followed by feedback by a clinical pharmacist as part of the multidisciplinary team, resulted in a significant decrease of the MEs at a tertiary PICU.
131
Clinical pharmacist
Chap
ter 6
INTRODUCTION
Medication errors (MEs) are one of the most frequently occurring types of adverse events in hospitalized patients, and 3% to 10% of MEs result in patient harm [1-3]. MEs are also associated with additional costs up to $8.500 per patient, as estimated for hospitals in the United States of America [4]. The reported prevalence of MEs varies from 5 to 24 per 100 prescriptions in pediatric patients [5-8]. A previous study has suggested that MEs are potentially more harmful in children than in adults [6]. Children admitted to the Pediatric Intensive Care Unit (PICU) are especially vulnerable to harmful MEs due to their dependence on multiple and life supporting medications [9]. Due to growing awareness of the complexity of the medication process and medication safety issues, it has been suggested that active involvement of a clinical pharmacist on pediatric wards might be of additional value. Three systematic reviews reported a reduction of MEs after a pharmacist was employed on clinical wards, but the included studies did not provide a clear description of the interventions by the clinical pharmacist and were generally of poor quality [10-12]. A recent published Cochrane systematic review [13] included only one high quality, controlled before-after study that showed a significant reduction of serious MEs after the implementation of a multi-faceted intervention by a full time clinical pharmacist on a PICU [14]. Due to the scarce existing evidence, we decided to study the effect of a structured review of prescribed medication, followed by feedback to the prescribing pediatrician-intensivist and bedside nurse, by a clinical pharmacist as part of the multidisciplinary team. We formulated the following research questions:· Do MEs and medication-related patient harm decrease after the implementation of
a structured medication review, followed by feedback from a clinical pharmacist as part of a multidisciplinary team?
· What types of recommendations are made by the clinical pharmacist, and to what extent are they accepted by the medical and nursing staff?
METHODS
The study design was based on the recommendations for Interrupted Time Series Designs [15]. The Institutional Review Board of the Academic Medical Center in Amsterdam ascertained that medical ethical approval was not required according to Dutch Medical Ethics Law. In accordance with the study protocol, all data were analyzed and reported anonymously.
132
Chapter 6
Setting and study populationWe performed our study in the tertiary PICU of Emma Children’s Hospital/Academic Medical Center, Amsterdam, the Netherlands. This mixed PICU has an operational capacity of 12 beds and provides care to approximately 600 intensive care patients and 300 additional high care patients annually, ranging in age from newborns to 18 years. As a daily routine, medication is prescribed or altered during the morning round, using a stand-alone Patient Data Management System (PDMS). This PDMS is a generic ordering system and is not equipped with a medication safety monitoring or decision support system. At the start of every nursing shift an electronically generated sign-off medication list is printed for all patients separately, and the prints are kept bedside. Electronic alterations can be made to the medication list by the attending resident, fellow or pediatrician-intensivist. If extensive alterations have been made, a new sign-off list is printed. Minor changes to the electronic list are hand copied to a separate bedside log, without printing a new sign-off list. After a mandatory double-check, the prescribed medications are administered to the patient, and both nurses sign off the medications on the list. Continuous intravenous medications are prepared into ready-to-administer doses by a decentralized pharmacy adjacent to the PICU. Additionally, limited stocks of commonly used intermittent medications are kept on the ward for immediate preparation by the bedside nurses. The decentralized pharmacy prepares the continuous medication during daytime for the next 24 hours, seven days a week. During evening and night hours all medication preparations are performed by the nurses. Guidelines of all medications are available on the ward in a hospital formulary. We included all patients with at least one medication prescription and with an expected length of stay (LOS) in the PICU of >24 hrs.
Study design and endpointsWe performed an Interrupted Time Series (ITS) with six pre-intervention data collection points and six post-intervention data collection points. We considered one-month interval between data collection points adequate to identify trends in MEs. For accurate comparison of the pre- and post-intervention data, the reviews took place during the same calendar months during two consecutive years to rule out seasonal effect that might influence the characteristics and medication profiles of patient groups. Primary endpoint was the prevalence of MEs per 100 prescriptions. Secondary outcomes were medication-related patient harm per 100 prescriptions, and the types and acceptance of the recommendations by the clinical pharmacist. We used the definitions and categories for error and harm as described by the National Coordinating Council for Medication Error Reporting and Prevention [16] (Appendix 1). High-alert medications were recorded according to the list for pediatric patients [17].
133
Clinical pharmacist
Chap
ter 6
Interventions by the clinical pharmacistWe expanded the PICU team with a clinical pharmacist who rotated within a group of eight pharmacists. The clinical pharmacists received a two-days mandatory training before the implementation period on the PICU started. During this training they familiarized themselves with prevailing medication protocols and guidelines, and they learned how to collect relevant information from the electronic hospital systems, including the PDMS. In addition, the clinical pharmacists were trained in their proactive role within the multidisciplinary PICU team by an external trainer. The clinical pharmacist was present on the PICU for a maximum of three hours every morning from Monday through Friday. At the beginning of the workday, patients considered most at risk for MEs were selected by the attending pediatrician-intensivists together with the clinical pharmacist for the medication review using the following criteria: (a) patients with reduced renal and/or hepatic clearance, (b) patients with high-alert medication prescriptions, (c) patients with more than 5 medications and (d) medication prescriptions with which the PICU professionals were unfamiliar. The clinical pharmacist performed a structured review of the prescribed medication for the selected patients, followed by feedback and recommendations to the attending pediatrician-intensivist and nurse during the ward round later during the same morning. Administration of medication was discussed with the bedside nurse, e.g. compatibility of medication administration, and infusion pump rates. If appropriate, the clinical pharmacist provided bedside instruction on pharmacological issues. A structured form was used for the medication review and bedside evaluation. Data collectionData on MEs and patient harm were collected for all included patients, i.e. the patients who were reviewed by the clinical pharmacist and the non-reviewed patients. To establish the incidence of MEs and patient harm, we used a three-step approach that was validated in a previous study [18]. During the first step, the clinical records of discharged patients were retrospectively reviewed by one of the investigators (JM or MT). Potential MEs were identified by reviewing all medication overviews, check-off lists, medical and nursing daily notes, symptom registration (e.g. Comfort scores) and postoperative notes. We systematically compared the potential MEs with the local protocols, the Dutch pediatric formulary [19] or international publications. In addition, the hospital incident reporting system, in which caregivers themselves report incidents, was reviewed for reported MEs during the study period. During the second step of the identification process, we presented the identified potential MEs to a blinded pediatrician-intensivist and pharmacist. They determined causality, preventability and the patient harm of the identified MEs. In the third step, they classified the MEs as harmful according to the NCC MERP categories. The process of data collection is visualized in Figure 1.
134
Chapter 6
Every day during the post-intervention period, the clinical pharmacists registered information on the recommendations and the acceptance on the structured medication review form. Acceptance was scored positively when a recommendation was followed-up within 24 hours. The data collection on MEs and potential patient harm was performed by two researchers (JM and MT). Data collection of the demographic data (gender, age, severity of illness, diagnosis category, length of stay) and medication profiles (number of prescriptions, number of administrations, high-alert medications) was supported by instructed research assistants. Data were collected on paper on self-designed structured forms that were kept in locked cupboards. One researcher (JM) then entered this data electronically. During the collection of data on all MEs (harmful and otherwise) in the post-intervention period, the researchers (JM and MT) and the experts (VG and RvH) were blinded for the patients selected for medication reviews. Two researchers (JM and MT) collected the data in parallel from the first month of the pre-intervention period independently, and discrepancies were discussed until consensus was reached. During the other study data collection periods the investigators performed double checks on the patients files that were considered complex by discretion of the researchers.
AnalysisWe estimated a prevalence of 10 MEs per 100 prescriptions in the pre-intervention group and 5 MEs per 100 prescriptions in the post-intervention group. With a type 1 error of 0.05 and a power of 0.80, we required a sample size of 474 patients. Descriptive statistics were used to summarize patient demographics and the recommendations of the clinical pharmacists. If normally distributed, continuous values were expressed as mean with standard deviation (SD); in case of not-normal distribution, data were expressed as median with interquartile range (IQR). Chi-squared analysis, the Mann Whitney test or the unpaired Student t-test was used to compare the pre-intervention and post-intervention characteristics of patients and MEs (harmful or otherwise). We adjusted the analyses for differences in baseline medication characteristics. Error rates were plotted over time to examine the data visually and we used autoregressive integrated moving average (ARIMA) interrupted time series techniques to study the effect of the intervention. Statistical uncertainty was expressed by 95% confidence interval (95% CI) and a p value of 0.05 was considered statistically significant. All analyses were performed using SPSS software (PASW statistics version 22.0, IBM, Armonk, NY, USA).
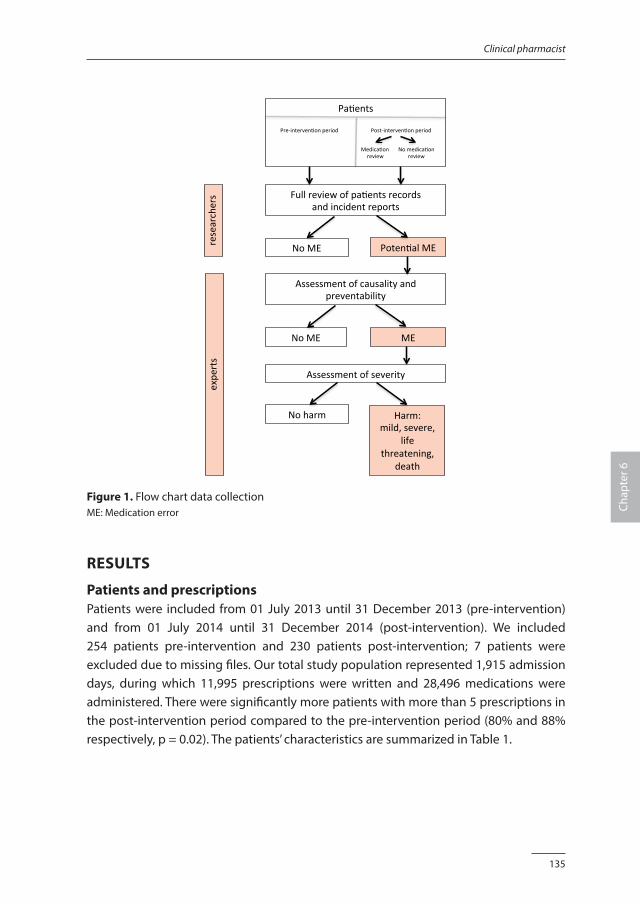
135
Clinical pharmacist
Chap
ter 6
Pa#ents
Fullreviewofpa#entsrecordsandincidentreports
NoME Poten#alME
Assessmentofcausalityandpreventability
NoME ME
Assessmentofseverity
Noharm Harm:mild,severe,
lifethreatening,
death
Pre-interven#onperiod
Post-interven#onperiod
Medica#onreview
Nomedica#onreview
research
ers
expe
rts
Figure 1. Flow chart data collectionME: Medication error
RESULTS
Patients and prescriptionsPatients were included from 01 July 2013 until 31 December 2013 (pre-intervention) and from 01 July 2014 until 31 December 2014 (post-intervention). We included 254 patients pre-intervention and 230 patients post-intervention; 7 patients were excluded due to missing files. Our total study population represented 1,915 admission days, during which 11,995 prescriptions were written and 28,496 medications were administered. There were significantly more patients with more than 5 prescriptions in the post-intervention period compared to the pre-intervention period (80% and 88% respectively, p = 0.02). The patients’ characteristics are summarized in Table 1.
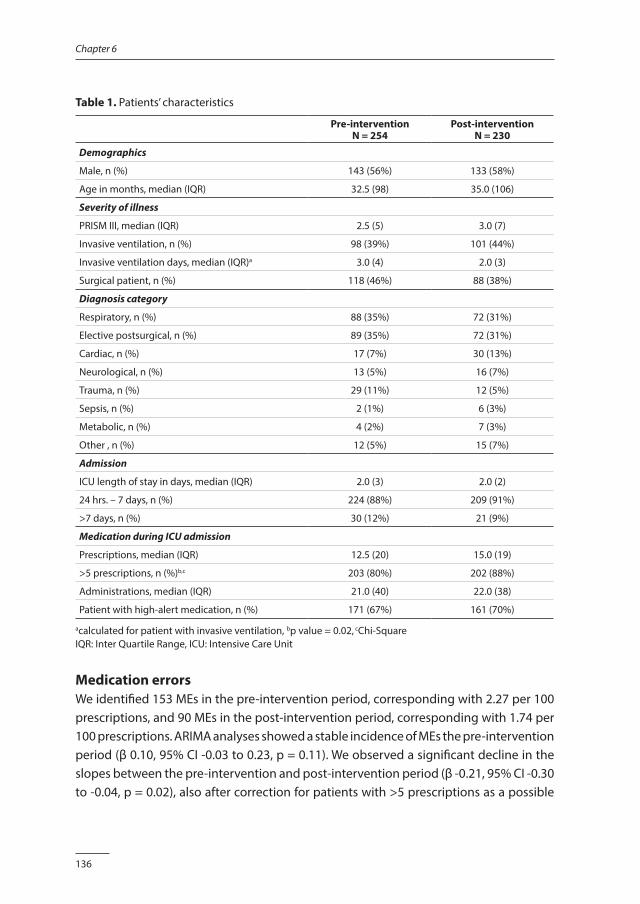
136
Chapter 6
Table 1. Patients’ characteristics
Pre-interventionN = 254
Post-interventionN = 230
Demographics
Male, n (%) 143 (56%) 133 (58%)
Age in months, median (IQR) 32.5 (98) 35.0 (106)
Severity of illness
PRISM III, median (IQR) 2.5 (5) 3.0 (7)
Invasive ventilation, n (%) 98 (39%) 101 (44%)
Invasive ventilation days, median (IQR)a 3.0 (4) 2.0 (3)
Surgical patient, n (%) 118 (46%) 88 (38%)
Diagnosis category
Respiratory, n (%) 88 (35%) 72 (31%)
Elective postsurgical, n (%) 89 (35%) 72 (31%)
Cardiac, n (%) 17 (7%) 30 (13%)
Neurological, n (%) 13 (5%) 16 (7%)
Trauma, n (%) 29 (11%) 12 (5%)
Sepsis, n (%) 2 (1%) 6 (3%)
Metabolic, n (%) 4 (2%) 7 (3%)
Other , n (%) 12 (5%) 15 (7%)
Admission
ICU length of stay in days, median (IQR) 2.0 (3) 2.0 (2)
24 hrs. – 7 days, n (%) 224 (88%) 209 (91%)
>7 days, n (%) 30 (12%) 21 (9%)
Medication during ICU admission
Prescriptions, median (IQR) 12.5 (20) 15.0 (19)
>5 prescriptions, n (%)b,c 203 (80%) 202 (88%)
Administrations, median (IQR) 21.0 (40) 22.0 (38)
Patient with high-alert medication, n (%) 171 (67%) 161 (70%)
acalculated for patient with invasive ventilation, bp value = 0.02, cChi-SquareIQR: Inter Quartile Range, ICU: Intensive Care Unit
Medication errors We identified 153 MEs in the pre-intervention period, corresponding with 2.27 per 100 prescriptions, and 90 MEs in the post-intervention period, corresponding with 1.74 per 100 prescriptions. ARIMA analyses showed a stable incidence of MEs the pre-intervention period (β 0.10, 95% CI -0.03 to 0.23, p = 0.11). We observed a significant decline in the slopes between the pre-intervention and post-intervention period (β -0.21, 95% CI -0.30 to -0.04, p = 0.02), also after correction for patients with >5 prescriptions as a possible
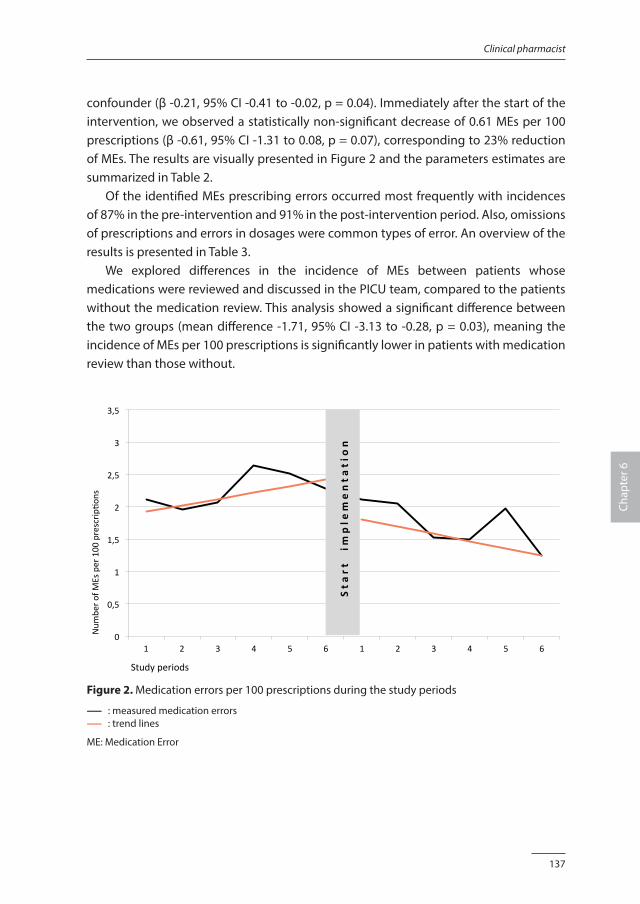
137
Clinical pharmacist
Chap
ter 6
confounder (β -0.21, 95% CI -0.41 to -0.02, p = 0.04). Immediately after the start of the intervention, we observed a statistically non-significant decrease of 0.61 MEs per 100 prescriptions (β -0.61, 95% CI -1.31 to 0.08, p = 0.07), corresponding to 23% reduction of MEs. The results are visually presented in Figure 2 and the parameters estimates are summarized in Table 2. Of the identified MEs prescribing errors occurred most frequently with incidences of 87% in the pre-intervention and 91% in the post-intervention period. Also, omissions of prescriptions and errors in dosages were common types of error. An overview of the results is presented in Table 3. We explored differences in the incidence of MEs between patients whose medications were reviewed and discussed in the PICU team, compared to the patients without the medication review. This analysis showed a significant difference between the two groups (mean difference -1.71, 95% CI -3.13 to -0.28, p = 0.03), meaning the incidence of MEs per 100 prescriptions is significantly lower in patients with medication review than those without.
!0
0,5
1
1,5
2
2,5
3
3,5
1 2 3 4 5 6 1 2 3 4 5 6
Num
bero
fMEsper100
prescrip
8ons
Studyperiods
Startim
plementation
Figure 2. Medication errors per 100 prescriptions during the study periods
------ : measured medication errors------ : trend lines
ME: Medication Error
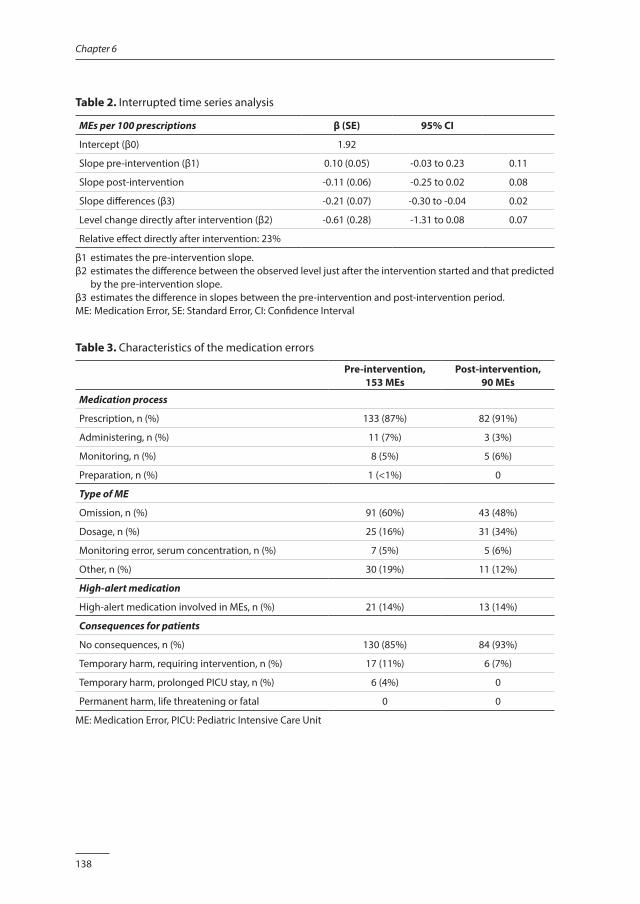
138
Chapter 6
Table 2. Interrupted time series analysis
MEs per 100 prescriptions β (SE) 95% CI
Intercept (β0) 1.92
Slope pre-intervention (β1) 0.10 (0.05) -0.03 to 0.23 0.11
Slope post-intervention -0.11 (0.06) -0.25 to 0.02 0.08
Slope differences (β3) -0.21 (0.07) -0.30 to -0.04 0.02
Level change directly after intervention (β2) -0.61 (0.28) -1.31 to 0.08 0.07
Relative effect directly after intervention: 23%
β1 estimates the pre-intervention slope.β2 estimates the difference between the observed level just after the intervention started and that predicted
by the pre-intervention slope. β3 estimates the difference in slopes between the pre-intervention and post-intervention period.ME: Medication Error, SE: Standard Error, CI: Confidence Interval
Table 3. Characteristics of the medication errors
Pre-intervention, 153 MEs
Post-intervention,90 MEs
Medication process
Prescription, n (%) 133 (87%) 82 (91%)
Administering, n (%) 11 (7%) 3 (3%)
Monitoring, n (%) 8 (5%) 5 (6%)
Preparation, n (%) 1 (<1%) 0
Type of ME
Omission, n (%) 91 (60%) 43 (48%)
Dosage, n (%) 25 (16%) 31 (34%)
Monitoring error, serum concentration, n (%) 7 (5%) 5 (6%)
Other, n (%) 30 (19%) 11 (12%)
High-alert medication
High-alert medication involved in MEs, n (%) 21 (14%) 13 (14%)
Consequences for patients
No consequences, n (%) 130 (85%) 84 (93%)
Temporary harm, requiring intervention, n (%) 17 (11%) 6 (7%)
Temporary harm, prolonged PICU stay, n (%) 6 (4%) 0
Permanent harm, life threatening or fatal 0 0
ME: Medication Error, PICU: Pediatric Intensive Care Unit
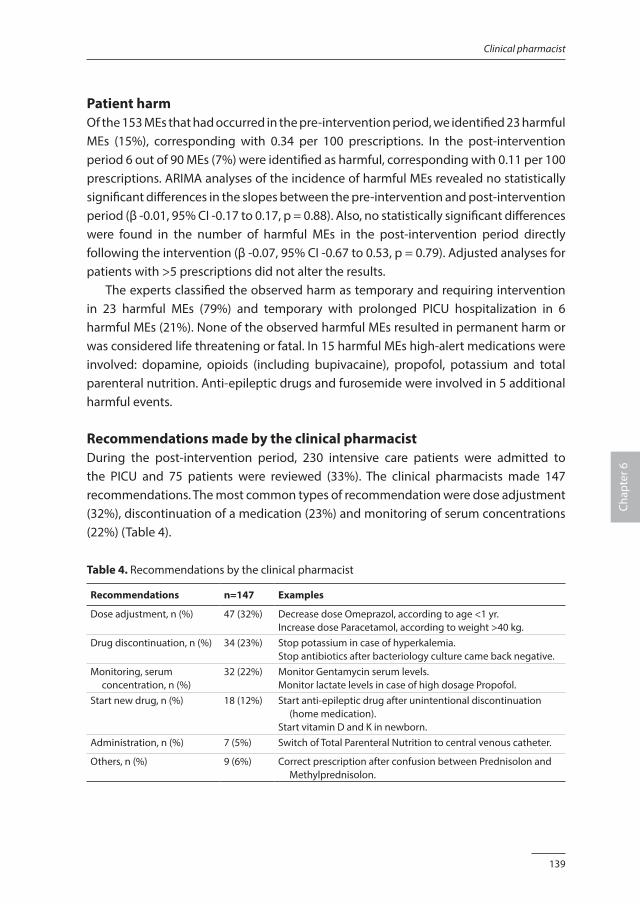
139
Clinical pharmacist
Chap
ter 6
Patient harmOf the 153 MEs that had occurred in the pre-intervention period, we identified 23 harmful MEs (15%), corresponding with 0.34 per 100 prescriptions. In the post-intervention period 6 out of 90 MEs (7%) were identified as harmful, corresponding with 0.11 per 100 prescriptions. ARIMA analyses of the incidence of harmful MEs revealed no statistically significant differences in the slopes between the pre-intervention and post-intervention period (β -0.01, 95% CI -0.17 to 0.17, p = 0.88). Also, no statistically significant differences were found in the number of harmful MEs in the post-intervention period directly following the intervention (β -0.07, 95% CI -0.67 to 0.53, p = 0.79). Adjusted analyses for patients with >5 prescriptions did not alter the results. The experts classified the observed harm as temporary and requiring intervention in 23 harmful MEs (79%) and temporary with prolonged PICU hospitalization in 6 harmful MEs (21%). None of the observed harmful MEs resulted in permanent harm or was considered life threatening or fatal. In 15 harmful MEs high-alert medications were involved: dopamine, opioids (including bupivacaine), propofol, potassium and total parenteral nutrition. Anti-epileptic drugs and furosemide were involved in 5 additional harmful events.
Recommendations made by the clinical pharmacist During the post-intervention period, 230 intensive care patients were admitted to the PICU and 75 patients were reviewed (33%). The clinical pharmacists made 147 recommendations. The most common types of recommendation were dose adjustment (32%), discontinuation of a medication (23%) and monitoring of serum concentrations (22%) (Table 4).
Table 4. Recommendations by the clinical pharmacist
Recommendations n=147 Examples
Dose adjustment, n (%) 47 (32%) Decrease dose Omeprazol, according to age <1 yr.Increase dose Paracetamol, according to weight >40 kg.
Drug discontinuation, n (%) 34 (23%) Stop potassium in case of hyperkalemia.Stop antibiotics after bacteriology culture came back negative.
Monitoring, serum concentration, n (%)
32 (22%) Monitor Gentamycin serum levels.Monitor lactate levels in case of high dosage Propofol.
Start new drug, n (%) 18 (12%) Start anti-epileptic drug after unintentional discontinuation (home medication).
Start vitamin D and K in newborn.Administration, n (%) 7 (5%) Switch of Total Parenteral Nutrition to central venous catheter.
Others, n (%) 9 (6%) Correct prescription after confusion between Prednisolon and Methylprednisolon.
140
Chapter 6
Of the 147 recommendations, 63% were accepted and given a follow-up within 24 hours. Another 28% of the recommendations were seriously considered but not accepted for various reasons (e.g. the patient’s situation had changed). No follow-up was given to 9% of the recommendations without reason.
DISCUSSION
Our study shows that the implementation of structured medication review, followed by timely feedback by a clinical pharmacist as part of the multidisciplinary team, resulted in a significant decreasing slope of the ME rate in a tertiary PICU. We also observed a decrease in medication-related patient harm, although this result was not statistically significant. The proactive role of the clinical pharmacist resulted in recommendations with a high acceptance rate. We identified only one previous high-quality study that investigated interventions by a clinical pharmacist on a PICU [14]. This controlled before-after study by Kaushal et al. reported a reduction of serious MEs on a PICU from 29 to 6 per 1000 patient days (p < 0.01) after the introduction of a clinical pharmacist who provided information and advice to the PICU staff, assisted during preparation, administration and monitoring of medications, and supported storage and distribution. However, in that study the definition of serious MEs was limited to non-intercepted MEs and was therefore different from our broader definition. In addition, in the study of Kaushal et al. the clinical pharmacist was present fulltime on the PICU, while in our study the pharmacist spent approximately 3 hours per day on the PICU. Our study demonstrates that a comparable decrease in the incidence of MEs after the introduction of a clinical pharmacist can be achieved with a more cost-effective protocol. Other studies that have investigated the effect of the presence of a clinical pharmacist on a PICU involved single-arm designs without a comparative control group, and focused on the recommendations and their acceptance by doctors and nurses rather than on the reduction of MEs [20-24]. Our finding that most recommendations of the clinical pharmacist concerned dosages is in accordance with the aforementioned studies, but the acceptance rate of the recommendations of 95% and 98% was higher than the 63% in our study [20,21,24]. In our study the clinical pharmacist was actively involved in the medication process of 1-2 patients per day, who were considered most at risk for MEs. Our results show the incidence of MEs per 100 prescriptions is significantly lower in patients with medication review than those without. This result suggests that the intervention has no effect in the non-reviewed patients, but this hypothesis must be investigated in future research. In addition, we found no significant effect of the interventions of the clinical pharmacist
141
Clinical pharmacist
Chap
ter 6
on patient harm. This might be explained by the low baseline rate of harmful MEs, and our study may have been underpowered to detect a difference. Although the low number of harm incidents is consistent with previous studies [6,9], these results must be interpreted with caution. According to the study protocol, the experts classified patient harm based on patient information documented during the stay on the PICU and we did not perform a follow-up after transfer or discharge. The combination of review and feedback is widely used to improve patient safety and generally leads to small but potentially important improvements in professional practice [25]. As part of the design of the study, the clinical pharmacist not only performed a medication review with bedside feedback, but also provided general clinical pharmacological information, gave instructions to and joined discussions with the PICU team on medication safety issues during the hours of presence. The latter activities might be considered as educational and teamwork interventions. Education has been shown to reduce MEs in children [26,27], while a multidisciplinary team results in clinical outcomes superior to those achieved by a monodisciplinary approach [28,29]. We did not investigate these interventions separately, and the effect on our results is unclear. It can be expected that in the future computerized physician order entry (CPOE) systems will increasingly support the medication prescription process, possibly marginalizing the role of the clinical pharmacist. Although a CPOE reduces MEs [30,31], it is important to note that information technology seems to introduce new errors [32]. Ongoing research is necessary to determine if participation of a clinical pharmacist within the setting of a multidisciplinary team remains effective when the context changes. The new clinical role of a pharmacist might be considered as a financial burden for the organization. Economic evaluations suggest a cost avoidance effect of interventions by a clinical pharmacist, but robust comparative economic analyses are lacking [33,34]. Therefore, future research should focus on the economic costs and benefits of the participation of a clinical pharmacist on PICUs, such as the time investment of a clinical pharmacist, in relation to the medical costs and the extra resource utilization related to MEs. Another direction for future research should focus on the risk factors that lead to MEs and related harm in critically ill children. Several risk factors have been studied, such as age, severity of illness and surgery, but the existing studies are limited and report non-conclusive results [7,9,35,36]. Only the number of prescriptions seems to be an independent risk factor for MEs [9,37]. We recognize several potential limitations in our study. Firstly, we retrospectively reviewed clinical records to detect potential MEs (harmful or otherwise). The results of this retrospective method depended in part on the information that was documented by doctors and nurses. Although we combined this documentation with the incident
142
Chapter 6
reports, this approach might have introduced an underestimation of MEs [38]. Secondly, blinding of the researchers was not complete during the process of identification of MEs, since the researchers knew whether the patient had been admitted during the pre-intervention or post-intervention period. However, neither researchers nor experts knew whether the medication for a specific patient had been reviewed by the clinical pharmacist. Thirdly, in an ITS study design data are collected at multiple time points before and after an intervention with a preferable 12-point data collection [39]. In our study data were collected at 6 points before the intervention. Although more data points might have increased the confidence in the study results, it is still in line with the Cochrane advice [40]. Finally, this was performed in a single-center study. Therefore, generalizability of the results might be limited in another clinical context and organization of the medication process. In conclusion, the implementation of structured medication review, followed by feedback by a clinical pharmacist, as part of the multidisciplinary team resulted in a significant decreasing slope of the ME rate in pediatric patients admitted on a mixed PICU. The results of this study provide justification for expanding the PICU team with a part-time clinical pharmacist.
AcknowledgementsWe would like to thank Niels Tio, Marjorie de Neef and Florentine Disch for their support with the data collection, and Susan van Dieren for supporting the ITS analyses.
FundingNeither this research project nor the authors received any grant from any agency in the public, commercial or not-for-profit sector.
143
Clinical pharmacist
Chap
ter 6
REFERENCES1. Kale A, Keohane CA, Maviglia S, et al: Adverse drug events caused by serious medication administration
errors. BMJ Qual Saf 2012;21:933-938.
2. de Vries EN, Ramrattan MA, Smorenburg SM, et al: The incidence and nature of in-hospital adverse events: a systematic review. Qual Saf Health Care 2008;17:216-223.
3. Zegers M, de Bruijne MC, Wagner C, et al: Adverse events and potentially preventable deaths in Dutch hospitals: results of a retrospective patient record review study. Qual Saf Health Care 2009;18:297-302.
4. Choi I, Lee S, Flynn L, et al: Incidence and treatment costs attributable to medication errors in hospitalized patients. Res Social Adm Pharm 2015, August (epub. ahead of print).
5. Glanzmann C, Frey B, Meier CR, et al. Analysis of medication prescribing errors in critically ill children. Eur J Pediatr 2015;174:1347-1355.
6. Kaushal R, Bates DW, Landrigan C, et al: Medication errors and adverse drug events in pediatric inpatients. JAMA 2001;285:2114-2120.
7. Maaskant JM, Bosman D, van Rijn-Bikker P, et al: Preventable errors with non-opioid analgesics and anti-emetic drugs increase burden in hospitalized children. Eur J Pediatc Surg 2014;24:381-388.
8. Marino BL, Reinhardt K, Eichelberger WJ, et al: Prevalence of errors in a paediatric hospital medication system: implications for error proofing. Outcomes Manag Nurs Pract 2000;4:129-135.
9. Rashed AN, Neubert A, Tomlin S, et al: Epidemiology and potential associated risk factors of drug-related problems in hospitalised children in the United Kingdom and Saudi Arabia. Eur J Clin Pharmacol 2012;68:1657-1666.
10. Manias E, Kinney S, Cranswick N, et al: Interventions to reduce medication errors in pediatric intensive care. Ann Pharmacother 2014;48:1313-1331.
11. Rinke ML, Bundy DG, Velasquez CA, et al: Interventions to reduce paediatric medication errors: a systematic review. Pediatrics 2014;134;338-360.
12. Sanghera N, Chan P, Kakhi ZF, et al. Interventions of hospital pharmacists in improving drug therapy in children. Drug Saf 2006;29:1031-1047.
13. Maaskant JM, Vermeulen H, Apampa B, et al: Interventions for reducing medication errors in children in hospital. Cochrane Database Syst Rev, 2015. Issue 3. Art. No: CD006208 DOI: 10.1002/14651858.CD006208.pub3.
14. Kaushal R, Bates DW, Abramson EL, et al: Unit-based clinical pharmacists’ prevention of serious medication errors in pediatric inpatients. Am J Health-Syst Pharm 2008;65:1254-1260.
15. Jandoc R, Burden AM, Mamdani M, et al: Interrupted time series analysis in drug utilization research is increasing: systematic review and recommendations. J Clin Epidemiol 2015;68:950-956
16. National Coordinating Council for Medication Error Reporting and Prevention (NCC MERP). Available: www.nccmerp.org, accessed May 2014.
17. Maaskant JM, Eskes A, Bosman D, et al: High-alert medications for pediatric patients: an international modified Delphi study. Expert Opin Drug Saf 2013;12:805-814.
18. de Boer M, Kiewiet JJS, Boeker EB, et al: A targeted method for standardized assessment of adverse drug events in surgical patients. J Eval Clin Pract 2013;19:1073-1082.
19. Dutch paediatric formulary, Dutch knowledge Centre for paediatric pharmacotherapy. Available: www.kinderformularium.nl, accessed April 2015.
20. Echarri-Martínez L, Fernández-Llamarazes CM, Manrique-Rodríque S, et al: Pharmaceutical care in paediatric intensive care unit: activities and interdisciplinary learning in a Spanish hospital. European Journal of Hospital Pharmacy 2011;19:416-422.
21. Krupicha MI, Bratton SL, Sonnenthal K, et al: Impact of a pediatric clinical pharmacist in the paediatric intensive care unit. Crit Care Med 2002;30:919-921.
144
Chapter 6
22. LaRochelle JM, Ghaly M, Creel AM. Clinical Pharmacy Faculty Interventions in a Pediatric Intensive Care Unit: An Eight-Month Review. J Pediatr Pharmacol Ther 2012;17:263-269.
23. Maat B, Au YS, Bollen CW, et al: Clinical pharmacy interventions in paediatric electronic prescriptions. Arch Dis Child 2013;98:222-227.
24. Tripathi S, Crabtee HM, Fryer KR, et al. Impact of clinical pharmacist on the paediatric intensive care practice: an 11-year tertiary center experience. J Pediatr Pharmacol Ther 2015;20:290-298.
25. Ivers N, Jamtvedt G, Flottorp S, et al: Audit and feedback: effects on professional practice and healthcare outcomes. Cochrane Database Syst Rev 2012, Issue 6. Art. No.: CD000259, DOI: 10.1002/14651858.CD000259.pub3.
26. Campino A, Santesteban E, Pascual P, et al. Strategies implementation to reduce medicine preparation error rate in neonatal intensive care units. Eur J Pediatr 2015, December (epub. ahead of print).
27. Cimino MA, Kirschbaum MS, Brodsky L, et al: Assessing medication prescribing errors in pediatric intensive care units. Pediatr Crit Care Med 2004;5:124-132.
28. Leape LL, Cullen DJ, Clapp MD, et al: Pharmacist participation on physician rounds and adverse drug events in intensive care unit. JAMA 2013;282:267-270.
29. Wagner EH: The role of patient care teams in chronic disease management. BMJ 2000;320:569-572.
30. Nuckols TK, Smith-Sprangler C, Morton SC, et al: The effectiveness of computerized order entry at reducing preventable adverse drug events and medication errors in hospital settings: a systematic review and meta-analysis. Systematic Reviews 2014;3:56.
31. Radley DC, Wasserman MR, Olsho LE, et al: Reduction in medication errors in hospitals due to adaptation of computerized provider order entry systems. J Am Med Inform Assoc 2013;20:470-476.
32. Cheung KC, van der Veen W, Bouvy ML, et al: Classification of medication incidents associated with information technology. J Am Med Inform Assoc 2014;21(E1):e63–e70.
33. Etchells E, Koo M, Daneman N, et al: Comparative economic analyses of patient safety improvement strategies in acute care: a systematic review. BMJ Qual Saf 2012;21:448-456.
34. Gallagher J, Byrne S, Woods N, et al: Cost-outcome description of clinical pharmacist interventions in a university teaching hospital. BMC Health Serv Res 2014;14:177.
35. Agerwal, Classen D, Larsen G, et al: Prevalence of adverse events in pediatric intensive care units in the United States. Pediatr Crit Care Med 2010;11:568-578.
36. Stavroudis TA, Shore AD, Morlock L, et al: NICU medication errors: identifying a risk profile for medication errors in the neonatal intensive care unit. J Perinatol 2010;30:459-468.
37. Holdsworth MT, Fichtl RE, Behta M, et al: Incidence and impact of adverse drug events in pediatric inpatients. Arch Pediatr Adolesc Med 2003;157:60-65.
38. Meyer-Massetti C, Cheng CM, Schwappach DL, et al: Systematic review of medication safety assessment methods. Am J Health Syst Pharm 2011;68:227-240.
39. Wagner AK, Soumerai SB, Zhang F, et al: Segmented regression analysis of interrupted time series studies in medication use research. Journal of Clinical Pharmacy and Therapeutics 2002;27:299-309.
40. Effective Practice, Organisation of Care (EPOC): Suggested risk of bias criteria for EPOC reviews. EPOC resources for review authors. Vol. Oslo: Norwegian Knowledge Centre for the Health Services. Available: http://epoc.cochrane.org/epoc-specific-resources-review-authors, accessed May 2014.
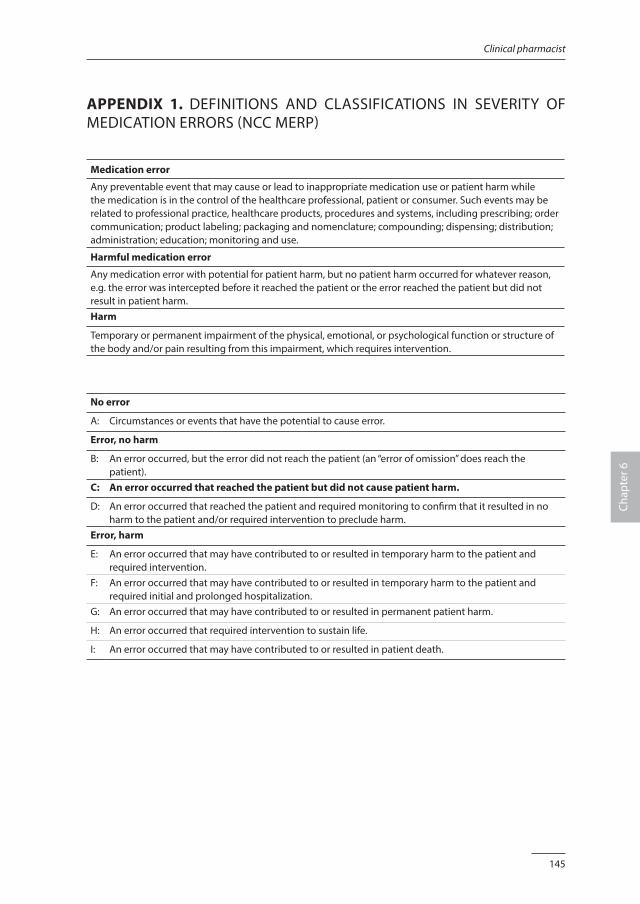
145
Clinical pharmacist
Chap
ter 6
APPENDIX 1. DEFINITIONS AND CLASSIFICATIONS IN SEVERITY OF MEDICATION ERRORS (NCC MERP)
Medication error
Any preventable event that may cause or lead to inappropriate medication use or patient harm while the medication is in the control of the healthcare professional, patient or consumer. Such events may be related to professional practice, healthcare products, procedures and systems, including prescribing; order communication; product labeling; packaging and nomenclature; compounding; dispensing; distribution; administration; education; monitoring and use.
Harmful medication error
Any medication error with potential for patient harm, but no patient harm occurred for whatever reason, e.g. the error was intercepted before it reached the patient or the error reached the patient but did not result in patient harm.Harm
Temporary or permanent impairment of the physical, emotional, or psychological function or structure of the body and/or pain resulting from this impairment, which requires intervention.
No error
A: Circumstances or events that have the potential to cause error.
Error, no harm
B: An error occurred, but the error did not reach the patient (an “error of omission” does reach the patient).
C: An error occurred that reached the patient but did not cause patient harm.
D: An error occurred that reached the patient and required monitoring to confirm that it resulted in no harm to the patient and/or required intervention to preclude harm.
Error, harm
E: An error occurred that may have contributed to or resulted in temporary harm to the patient and required intervention.
F: An error occurred that may have contributed to or resulted in temporary harm to the patient and required initial and prolonged hospitalization.
G: An error occurred that may have contributed to or resulted in permanent patient harm.
H: An error occurred that required intervention to sustain life.
I: An error occurred that may have contributed to or resulted in patient death.

Chapter 7
The trigger tool as a method to measure harmful medication errors in children:
a diagnostic accuracy study
Jolanda MaaskantMarian SmeulersDiederik Bosman
Annemarie BusinkPetra van Rijn-Bikker
Wim van AalderenHester Vermeulen
Journal of Patient Safety 2015, epub. ahead of print.
148
Chapter 7
ABSTRACT
IntroductionTo improve the medication safety for children, it is important to quantify the occurrence of preventable medication errors (MEs). A trigger tool may be an effective and time-saving strategy, but its measurement performance is unclear. Therefore, we aimed to estimate the performance of a pediatric medication-focused trigger tool in detecting harmful MEs.
MethodsFirstly, we established a multi-faceted method as a reference comparison. Secondly, we compared the pediatric medication-focused trigger tool with the multi-faceted method in a new cohort of patients. All patients admitted in February and March 2013 were screened using the trigger tool and the multi-faceted method to obtain full verification. Data collection was performed in separate teams to guarantee blinding of the test results.
ResultsReview of the clinical records and the voluntary incident reports were most effective in detecting harmful MEs, so this approach was chosen as reference comparison. In the second part of the study 369 patients were included. The multi-faceted method identified 33 harmful MEs. In contrast, the trigger tool did not identify any harm. When the two symptoms pain and nausea/vomiting were added to the trigger tool, 19 harmful MEs were identified. This extended trigger tool resulted in a sensitivity of 21.2 and a positive predictive value of 36.8.
ConclusionThe original pediatric medication-focused trigger tool yielded only false positive scores and left unsafe situations undiscovered. We conclude that a multi-faceted method remain the preferred method to detect harmful MEs. The additional value of the trigger tool stays unclear.
149
The trigger tool
Chap
ter 7
INTRODUCTION
Medication related adverse events are one of the most common type of adverse events, that endangers hospitalized patients [1-4]. A substantial part of these adverse events are preventable and must be considered medication errors (MEs) [5,6]. Children are especially at high risk of harm, because MEs are potentially more hazardous to them than to adults [7,8]. To move forward toward preventive interventions, it is necessary to be able to quantify medication safety. However, measuring MEs accurately is difficult, and the results of the various measurement methods vary widely [9-11]. Therefore, to obtain reliable data, a multi-faceted approach is recommended [12]. However, such an approach is time consuming, thus hampering both routine monitoring and clinical research. To overcome this problem, the trigger tool methodology has been developed. A trigger tool is a collection of “alerts”, that serve as indicators of potential adverse events [13]. In recent decades, several trigger tools have been developed, including trigger tools to measure specific adverse events (such as adverse drug events) [14-18] as well as trigger tools to be used in specific patient populations (e.g. children) [19-21]. Research on trigger tools designed specifically to detect adverse drug events in children is limited. To the best of our knowledge, only one pediatric medication-focused trigger tool has been developed [18], and the measurement performance of this trigger tool is not yet studied in depth. Moreover, most studies have focused on all adverse drug events and did not have specifically investigated preventable drug events defined as MEs. This knowledge is essential to develop risk reduction programs and therewith the medication safety for children. Therefore, in this study our aim was to (a) estimate the performance of a pediatric medication-focused trigger tool in detecting harmful MEs, using a multi-faceted method as reference comparison, and to (b) calculate the time investments needed for the use of the trigger tool and multi-faceted method. Patients of interest were hospitalized children from birth up to 18 years old.
METHODS
Setting and study populationThe study took place at the Emma Children’s Hospital in the Netherlands, which is part of the Academic Medical Center and is affiliated with the University of Amsterdam. We conducted our study on three general pediatric wards and a pediatric oncology ward. All patients who were admitted to one of these wards with at least one medication prescription during the study period were eligible. Patients with a hospital admission shorter than 24 hours and patients participating in other medication trials were excluded.
150
Chapter 7
Study designWe conducted a cross-sectional study consisting of two parts. In the first part, we established a multi-faceted method to identify harm due to MEs in order to obtain a reference comparison. In the second part, we compared this multi-faceted method with the pediatric medication-focused trigger tool [18] in a new cohort of patients. The primary outcome was patient harm due to MEs. The secondary outcome was the difference in time investment between the two methods. We used the definitions and categories for error and harm as described by the National Coordinating Council for Medication Error Reporting and Prevention (NCC MERP) [22]. The Institutional Review Board of the AMC determined that the protocol did not require medical ethical approval according to the Dutch Medical Ethics Law. All data were analyzed and reported anonymously.
Part 1: Establishing the multi-faceted method In the first part of this study, we established the most effective combination of methods to identify harmful MEs. To do this, we reanalyzed the clinical data from a previous study, in which we used four methods: review of the clinical records, analysis of incident reports, direct observations and analysis of pharmacy logs [23].
Part 2: Estimating the performance of the pediatric medication-related trigger toolTo establish the performance of the pediatric medication-related trigger tool, we used a new consecutive cohort of patients admitted in the period between 1 February 2013 and 31 March 2013. All included patients were screened for harmful MEs using the pediatric medication-focused trigger tool and the multi-faceted method to obtain full verification. We created two teams, each consisting of a pediatrician, a pediatric nurse and a research assistant, who were responsible for the data collection with the trigger tool and the multi-faceted method. To guarantee blinding of the test results, the two teams worked independently and were each unaware of the results of the other team. The pediatricians and pediatric nurses all had at least five years postgraduate experience and were members of the ward safety teams. The teams were assisted by a qualified pharmacy assistant and a registered nurse, who were supervised on a daily basis by the last author. Prior to the start of data collection, the protocol was discussed in the teams to ensure a clear understanding of definitions and methods. The research assistants were trained with help of the Pediatric Trigger Toolkit [24] and an instruction sheet based on the local situation, followed by a pilot to test their understanding. Data were collected on digital case record forms. We adapted the pediatric medication-focused trigger tool developed by Takata et al. [18]. Some triggers were slightly changed to reflect the Dutch situation. In addition,
151
The trigger tool
Chap
ter 7
two triggers on pain and nausea/vomiting that were established as symptoms associated with harmful MEs in our previous research were added to the trigger tool. The performance of both the original and the extended version of the trigger tool was studied separately [23]. The clinical records of all included patients were reviewed manually using the trigger tool. When a trigger was found, a full review of the clinical records was performed to determine if a harmful ME was associated with the trigger. MEs that were found “spontaneously” and were not associated with a trigger were ignored. The clinical records of all included patients were reviewed and analyzed for harmful MEs. Data were extracted from the medication overviews, medication administration records, medical progress summaries, medical daily notes, medical order sheets, nursing daily notes, nursing order sheets, symptom registrations, and anesthetist postoperative notes. In addition, the incident reports that involved MEs were analyzed. This method created ten locations per patient where a ME could be identified.
Time investmentThe time investment needed to establish harmful MEs was recorded real time in 100 patients, equally divided over the study period. For the trigger tool, the data collector recorded the time needed to identify a trigger as well as to determine if that trigger was associated with a ME. For the multi-faceted method the data collector recorded the time needed to perform a full review of a clinical record and an incident report.
ReliabilityIn order to study interobserver reliability, data from 100 included patients were collected using the trigger tool method by two reviewers (AB and MS) independently. We calculated the reliability of the identification of positive triggers, MEs and patient harm. Interobserver reliability of the multi-faceted approach had already been established in our previous study [23].
AnalysisDescriptive statistics were used to summarize patient demographics and MEs. If normally distributed, continuous values were expressed as mean and standard deviation (SD), otherwise median and interquartile range (IQR) were used. The performance of the pediatric medication-related trigger tool was described using sensitivity, specificity, positive and negative predictive values, and positive and negative likelihoods. The 95% confidence interval (95% CI) was used to quantify statistical uncertainty. Measures of interobserver reliability were calculated using percentages of absolute agreement and Kappa statistics. All analyses were performed using SPSS software (version 20.0, IBM, Armonk, NY, USA) and MedCalc software (version 12.7.5, Ostend, Belgium).
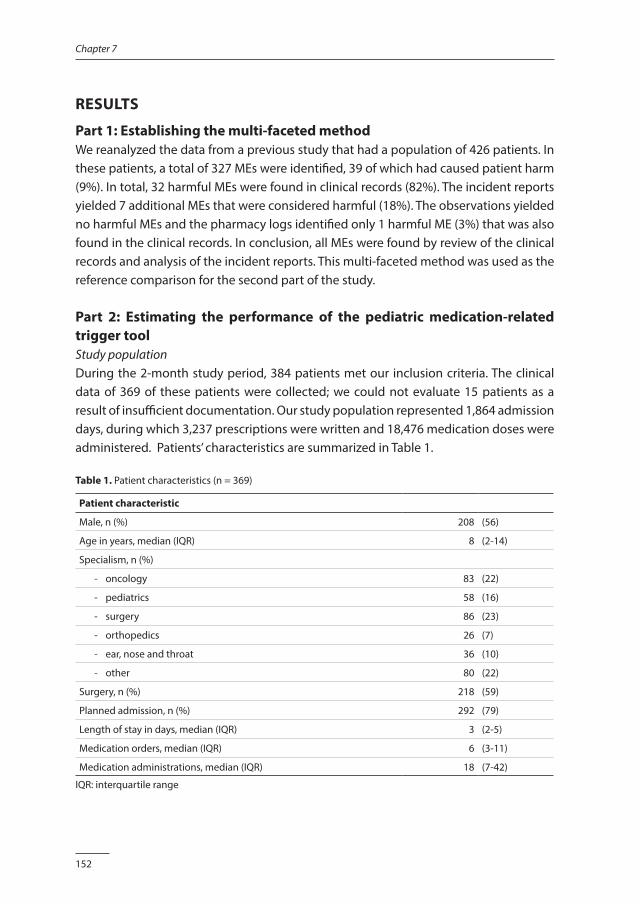
152
Chapter 7
RESULTS
Part 1: Establishing the multi-faceted methodWe reanalyzed the data from a previous study that had a population of 426 patients. In these patients, a total of 327 MEs were identified, 39 of which had caused patient harm (9%). In total, 32 harmful MEs were found in clinical records (82%). The incident reports yielded 7 additional MEs that were considered harmful (18%). The observations yielded no harmful MEs and the pharmacy logs identified only 1 harmful ME (3%) that was also found in the clinical records. In conclusion, all MEs were found by review of the clinical records and analysis of the incident reports. This multi-faceted method was used as the reference comparison for the second part of the study.
Part 2: Estimating the performance of the pediatric medication-related trigger toolStudy populationDuring the 2-month study period, 384 patients met our inclusion criteria. The clinical data of 369 of these patients were collected; we could not evaluate 15 patients as a result of insufficient documentation. Our study population represented 1,864 admission days, during which 3,237 prescriptions were written and 18,476 medication doses were administered. Patients’ characteristics are summarized in Table 1.
Table 1. Patient characteristics (n = 369)
Patient characteristic
Male, n (%) 208 (56)
Age in years, median (IQR) 8 (2-14)
Specialism, n (%)
- oncology 83 (22)
- pediatrics 58 (16)
- surgery 86 (23)
- orthopedics 26 (7)
- ear, nose and throat 36 (10)
- other 80 (22)
Surgery, n (%) 218 (59)
Planned admission, n (%) 292 (79)
Length of stay in days, median (IQR) 3 (2-5)
Medication orders, median (IQR) 6 (3-11)
Medication administrations, median (IQR) 18 (7-42)
IQR: interquartile range
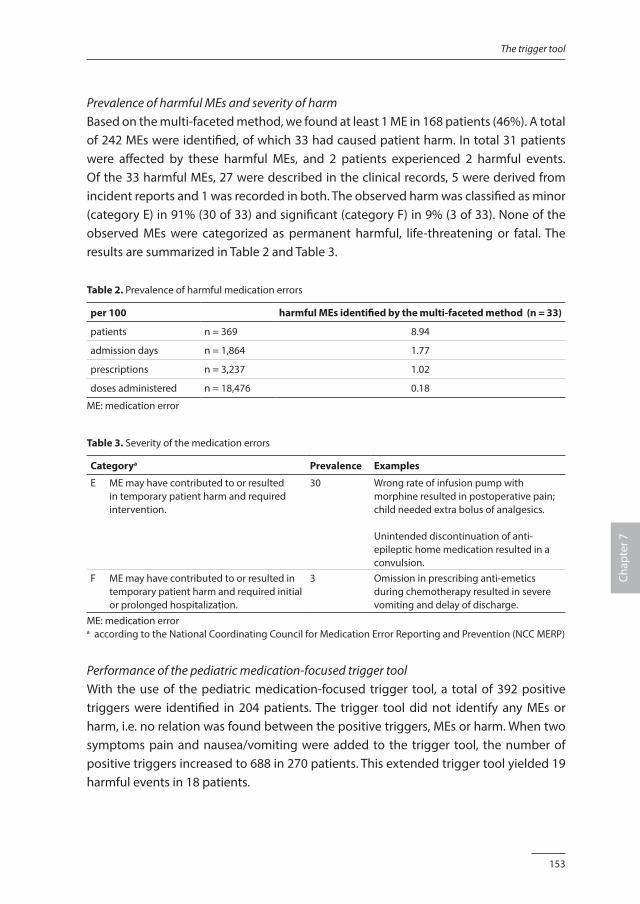
153
The trigger tool
Chap
ter 7
Prevalence of harmful MEs and severity of harm Based on the multi-faceted method, we found at least 1 ME in 168 patients (46%). A total of 242 MEs were identified, of which 33 had caused patient harm. In total 31 patients were affected by these harmful MEs, and 2 patients experienced 2 harmful events. Of the 33 harmful MEs, 27 were described in the clinical records, 5 were derived from incident reports and 1 was recorded in both. The observed harm was classified as minor (category E) in 91% (30 of 33) and significant (category F) in 9% (3 of 33). None of the observed MEs were categorized as permanent harmful, life-threatening or fatal. The results are summarized in Table 2 and Table 3.
Table 2. Prevalence of harmful medication errors
per 100 harmful MEs identified by the multi-faceted method (n = 33)
patients n = 369 8.94
admission days n = 1,864 1.77
prescriptions n = 3,237 1.02
doses administered n = 18,476 0.18
ME: medication error
Table 3. Severity of the medication errors
Categorya Prevalence Examples
E ME may have contributed to or resulted in temporary patient harm and required intervention.
30 Wrong rate of infusion pump with morphine resulted in postoperative pain; child needed extra bolus of analgesics.
Unintended discontinuation of anti-epileptic home medication resulted in a convulsion.
F ME may have contributed to or resulted in temporary patient harm and required initial or prolonged hospitalization.
3 Omission in prescribing anti-emetics during chemotherapy resulted in severe vomiting and delay of discharge.
ME: medication errora according to the National Coordinating Council for Medication Error Reporting and Prevention (NCC MERP)
Performance of the pediatric medication-focused trigger toolWith the use of the pediatric medication-focused trigger tool, a total of 392 positive triggers were identified in 204 patients. The trigger tool did not identify any MEs or harm, i.e. no relation was found between the positive triggers, MEs or harm. When two symptoms pain and nausea/vomiting were added to the trigger tool, the number of positive triggers increased to 688 in 270 patients. This extended trigger tool yielded 19 harmful events in 18 patients.
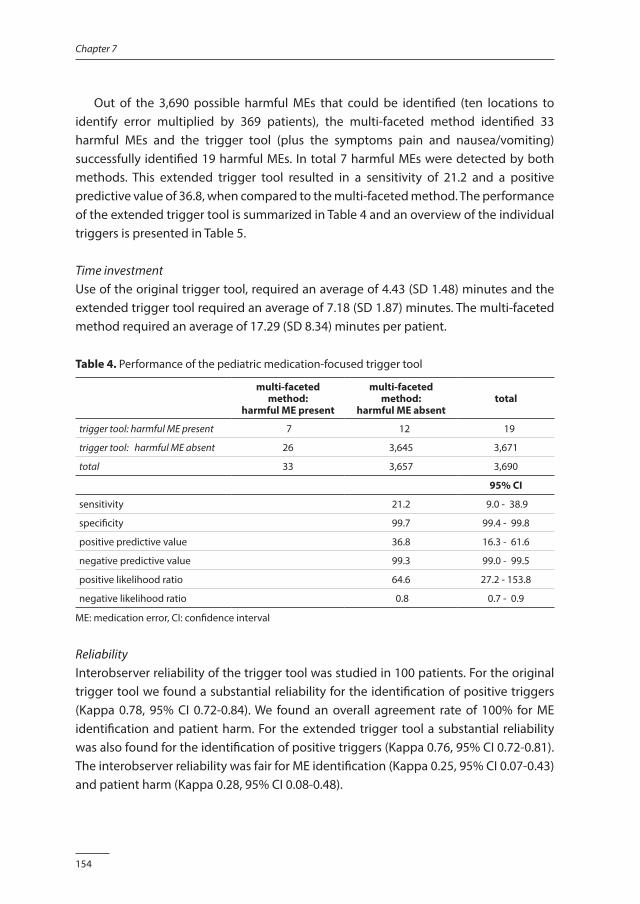
154
Chapter 7
Out of the 3,690 possible harmful MEs that could be identified (ten locations to identify error multiplied by 369 patients), the multi-faceted method identified 33 harmful MEs and the trigger tool (plus the symptoms pain and nausea/vomiting) successfully identified 19 harmful MEs. In total 7 harmful MEs were detected by both methods. This extended trigger tool resulted in a sensitivity of 21.2 and a positive predictive value of 36.8, when compared to the multi-faceted method. The performance of the extended trigger tool is summarized in Table 4 and an overview of the individual triggers is presented in Table 5.
Time investmentUse of the original trigger tool, required an average of 4.43 (SD 1.48) minutes and the extended trigger tool required an average of 7.18 (SD 1.87) minutes. The multi-faceted method required an average of 17.29 (SD 8.34) minutes per patient.
Table 4. Performance of the pediatric medication-focused trigger tool
multi-faceted method:
harmful ME present
multi-faceted method:
harmful ME absenttotal
trigger tool: harmful ME present 7 12 19
trigger tool: harmful ME absent 26 3,645 3,671
total 33 3,657 3,690
95% CI
sensitivity 21.2 9.0 - 38.9
specificity 99.7 99.4 - 99.8
positive predictive value 36.8 16.3 - 61.6
negative predictive value 99.3 99.0 - 99.5
positive likelihood ratio 64.6 27.2 - 153.8
negative likelihood ratio 0.8 0.7 - 0.9
ME: medication error, CI: confidence interval
ReliabilityInterobserver reliability of the trigger tool was studied in 100 patients. For the original trigger tool we found a substantial reliability for the identification of positive triggers (Kappa 0.78, 95% CI 0.72-0.84). We found an overall agreement rate of 100% for ME identification and patient harm. For the extended trigger tool a substantial reliability was also found for the identification of positive triggers (Kappa 0.76, 95% CI 0.72-0.81). The interobserver reliability was fair for ME identification (Kappa 0.25, 95% CI 0.07-0.43) and patient harm (Kappa 0.28, 95% CI 0.08-0.48).
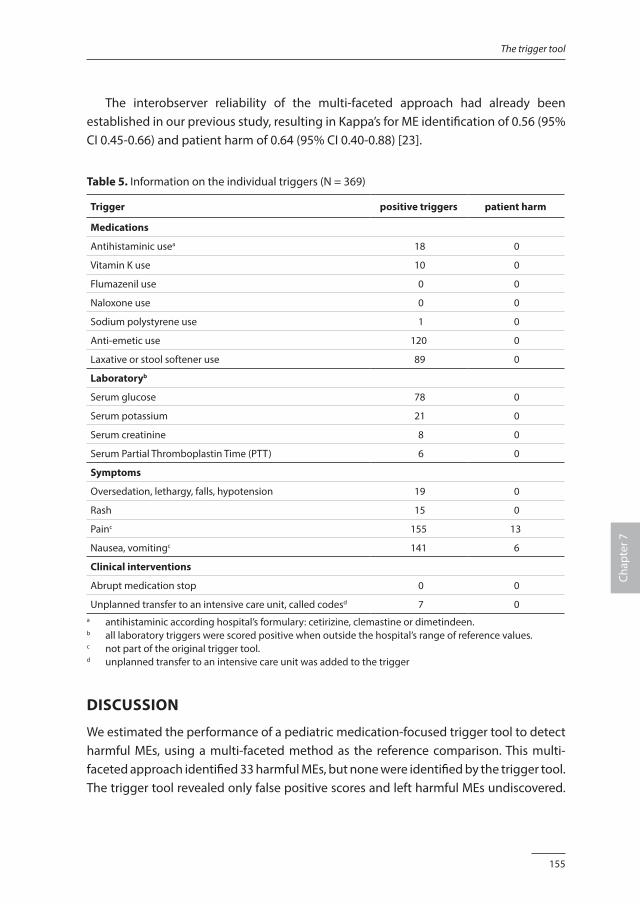
155
The trigger tool
Chap
ter 7
The interobserver reliability of the multi-faceted approach had already been established in our previous study, resulting in Kappa’s for ME identification of 0.56 (95% CI 0.45-0.66) and patient harm of 0.64 (95% CI 0.40-0.88) [23].
Table 5. Information on the individual triggers (N = 369)
Trigger positive triggers patient harm
Medications
Antihistaminic usea 18 0
Vitamin K use 10 0
Flumazenil use 0 0
Naloxone use 0 0
Sodium polystyrene use 1 0
Anti-emetic use 120 0
Laxative or stool softener use 89 0
Laboratoryb
Serum glucose 78 0
Serum potassium 21 0
Serum creatinine 8 0
Serum Partial Thromboplastin Time (PTT) 6 0
Symptoms
Oversedation, lethargy, falls, hypotension 19 0
Rash 15 0
Painc 155 13
Nausea, vomitingc 141 6
Clinical interventions
Abrupt medication stop 0 0
Unplanned transfer to an intensive care unit, called codesd 7 0a antihistaminic according hospital’s formulary: cetirizine, clemastine or dimetindeen.b all laboratory triggers were scored positive when outside the hospital’s range of reference values.c not part of the original trigger tool.d unplanned transfer to an intensive care unit was added to the trigger
DISCUSSION
We estimated the performance of a pediatric medication-focused trigger tool to detect harmful MEs, using a multi-faceted method as the reference comparison. This multi-faceted approach identified 33 harmful MEs, but none were identified by the trigger tool. The trigger tool revealed only false positive scores and left harmful MEs undiscovered.
156
Chapter 7
Even after modification by adding the symptoms pain and nausea/vomiting, the measurement performance was poor. The inability of the trigger tool to detect (harmful) MEs in our study deviates from the results of other studies. Takata et al. identified 19 harmful MEs with the medication-focused trigger tool in a population of 960 pediatric patients [18]. Furthermore, Burch discovered 5 harmful MEs in 59 patients with the same pediatric trigger tool in a rehabilitation hospital [25]. Trigger tools developed for adult inpatients were also able to identify adverse drug events and MEs [14,17,26]. Conflicting results have been reported when comparing the trigger tool methodology with other detecting methods. Several studies reported that the trigger tool methodology is superior to the review of clinical records and voluntary incident reports [14,18,25]. However, other studies have reported limited efficiency gains in using a medication-focused trigger tool [16,26,27]. Our study supports this latter conclusion. There are several possible explanations for the differences between our results and those presented in other studies. Firstly, the ability of a trigger tool to detect (harmful) MEs is very much dependent on the choice of the triggers. In a systematic review, Handler et al. stated that the number and combination of triggers varies considerably in different studies [28]. Also, more recent publications show variability in the number of triggers used [15-21,25,29-43]. We adapted an existing trigger tool developed in the USA. Hospital and patient characteristics could have affected the types of harmful MEs, requiring specific triggers to unravel hazardous situations. In our study the trigger tool plus the symptoms pain and nausea/vomiting successfully identified 19 harmful MEs of which 12 were identified by the extended trigger tool only. These results suggest the additional benefit of the trigger tool is very much dependent on the triggers chosen. Secondly, the heterogeneity in results may also be explained by differences in definitions and reference values used. In the present study, we focused on harmful MEs, defined as adverse events that we decided were preventable and caused harm to the patient. We included all types of MEs, also omissions and deviations in administering time. This resulted in a prevalence of harmful MEs in our present study that is at the higher range of results reported in other studies [7,44,45]. This is particularly important, because the prevalence has impact on the predictive values. Thirdly, the original medication-focused trigger tool did not identify any harmful ME, but this might be the result of the relatively small sample size in our study. Fourthly, our deviating results might be explained by the main outcome of the study. The trigger tool methodology was designed for detecting a broad range of adverse events, taking time limitations into account. In our study we chose a more narrow scope, e.g. we defined preventable drug events associated with patient harm as the main outcome of interest. We believe this information is most relevant as it presents situations that can be improved by risk reduction programs. The scope influences the results and comparisons
157
The trigger tool
Chap
ter 7
with other studies must be made with caution. Finally, experiences with the Global Trigger Tool show that up to 30% of adverse events are found without specific triggers [27,32]. These adverse events are identified “spontaneously” while reviewing patient notes following a positive trigger. In this present study, we only included MEs associated with triggers and ignored MEs that were not associated with the triggers. This might have influenced our results to be unfavorable for the trigger tool, but we considered this method necessary to establish the performance of the pediatric trigger tool accurately. The mean time to perform a full review of clinical records was still consistent with recommendations from the Institute for Healthcare Improvement to spend no longer than 20 minutes reviewing each chart as this does not usually yield additional information [46]. However, the trigger tool appeared more efficient as reflected in the time investment that was far less than the time needed to review the clinical records. This is an important advantage for both routine monitoring of medication safety and research projects.
LimitationsAlthough using four event detection methods to establish the reference comparison for the trigger tool method is a serious attempt to identify all MEs, it is likely, yet unknown, that MEs occurred that were not captured by this multi-faceted method. Therefore, the reported sensitivity and specificity attribute to the growing knowledge of the trigger tool methodology, but is limited by the absence of a criterion standard. Secondly, we collected our data retrospectively, which may have introduced documentation bias, since the quality of the data relies entirely on the information recorded in the clinical records and incident reports [47]. Thirdly, the reliability of both the multi-faceted method and the trigger tool methodology is a concern. Especially the reliability of the extended version of the trigger tool is surprisingly low, suggesting the subjectivity of the triggers pain and nausea/vomiting. Experienced and trained teams that are familiar with the local situation, and have a structured strategy to reach consensus in identification and classification of MEs, seem essential to obtain reliable data [26,29,48,49]. In our study, the experience with the trigger tool methodology was still growing and we did not discuss all harmful MEs in the teams. More attention for these aspects might have increased the interobserver reliability.
Future directionsAt present the limited ability of the trigger tool to detect MEs in children, does not make it an attractive alternative to a multi-faceted method. But with medical records becoming more and more electronically, new possibilities and challenges arise. Integrating triggers in the electronic medical records allows real time detection of adverse drug events,
158
Chapter 7
and moves patient safety from a retrospective focus on errors to real-time detection of adverse drug events. Future research should focus on the use of triggers as part of the electronic patient records to identify patients at risk for adverse drug events, by combining patient information, for example medication use and laboratory results. This real-time detection has the ability to capture the preventable adverse drug events, but might also play an important role in amelioration and recovery of events that until now are thought to be unpreventable. In future research the concept of preventability might be replaced by amelioration and mitigatibility. Secondly, in the present research most triggers are defined as biomedical signals and are less focused on organizational alerts. The evidence is growing that also competences of the healthcare professionals [50] and safety culture [51,52] are associated with adverse events. We recommend more research on these issues in relation to medication safety for children.
CONCLUSION
The trigger tool methodology has been developed for the purpose of monitoring adverse events using a technique that would be applicable throughout the healthcare system. However, the results of our study suggest that exchange of trigger tools between organizations may be limited. The high number of false-negative scores represent unsafe situations that are not discovered and might result in a feeling of false security. This might delay the development and implementation of effective interventions and thus continue to threaten patient safety. We conclude that a multi-faceted method remain the preferred method to detect harmful MEs. The additional value of the trigger tool stays unclear.
FundingNeither this research project nor the authors received any grant from any agency in the public, commercial or not-for-profit sector.
159
The trigger tool
Chap
ter 7
REFERENCES1. de Vries EN, Ramrattan MA, Smorenburg SM, et al. The incidence and nature of in-hospital adverse events:
a systematic review. Qual Saf Health Care 2008;17:216-223.
2. Kale A, Keohane CA, Maviglia S, et al. Adverse drug events caused by serious medication administration errors. BMJ Qual Saf 2012;21:933-938.
3. Zegers M, de Bruijne MC, Wagner C, et al. Adverse events and potential preventable deaths in Dutch hospitals: results of a retrospective patient record review study. Qual Saf Health Care 2009;18:297-302.
4. Landrigan CP, Parry GJ, Bones CB, et al. Temporal trends in rates of patient harm resulting from medical care. N Engl J Med 2010;363:2124-2134.
5. Kunac DL, Kennedy J, Austin N, et al. Incidence, preventability, and impact of Adverse Drug Events (ADEs) and potential ADEs in hospitalized children in New Zealand: a prospective observational cohort study. Paediatr Drugs 2009;11:153-160.
6. von Laue NC, Schwappach DL, Koeck CM. The epidemiology of preventable adverse drug events: a review of the literature. Wien Klin Wochenschr 2003;115:407-415.
7. Kaushal R, Bates DW, Landrigan C, et al. Medication errors and adverse drug events in pediatric inpatients. JAMA 2001;285:2114-2120.
8. Cowley E, Roger R, Cousins D. Medication errors in children: a descriptive summary of medication error reports submitted to the United States Pharmacopeia. Current Therapeutic Research 2001;62:627-640.
9. Meyer-Massetti C, Cheng CM, Schwappach DL, et al. Systematic review of medication safety assessment methods. Am J Health Syst Pharm 2011;68:227-240.
10. Morimoto T, Gandhi TK, Seger AC, et al. Adverse drug events and medication errors: detection and classification methods. Qual Saf Health Care 2004;13:306-314.
11. Franklin BD, Vincent C, Schachter M, et al. The incidence of prescribing errors in hospital inpatients: an overview of the research methods. Drug Saf 2005;28:891-900.
12. Olsen S, Neale G, Schwab K, et al. Hospital staff should use more than one method to detect adverse events and potential adverse events: incident reporting, pharmacist surveillance and local real-time record review may all have a place. Qual Saf Health Care 2007;16:40-44.
13. Resar RK, Rozich JD, Classen D. Methodology and rationale for the measurement of harm with trigger tools. Qual Saf Health Care 2003;12:ii39-ii45.
14. Rozich JD, Haraden CR, Resar RK. Adverse drug event trigger tool: a practical methodology for measuring medication related harm. Qual Saf Health Care 2003;12:194-200.
15. Moore C, Li J, Hung CC, et al. Predictive value of alert triggers for identification of developing adverse drug events. J Patient Saf 2009;5:223-228.
16. Franklin BD, Birch S, Schachter M, et al. Testing a trigger tool as a method of detecting harm from medication errorrs in a UK hospital: a pilot study. Int J Pharm Pract 2010;18:305-311.
17. de Boer M, Kiewiet JJ, Boeker EB, et al. A targeted method for standardized assessment of adverse drug events in surgical patients. J Eval Clin Pract 2013;19:1073-1082.
18. Takata GS, Mason W, Taketomo C, et al. Development, testing, and findings of a pediatric-focused trigger tool to identify medication-related harm in US children’s hospitals. Pediatrics 2008;121:e927-e935.
19. Sharek PJ, Horbar JD, Mason W, et al. Adverse events in the neonatal intensive care unit: development, testing, and findings of an NICU-focused trigger tool to identify harm in North American NICUs. Pediatrics 2006;118:1332-1340.
20. Matlow AG, Cronin CM, Flintoft V, et al. Description of the development and validation of the Canadian Paediatric Trigger Tool. BMJ Qual Saf 2011;20:416-423.
21. Agarwal S, Classen D, Larsen G, et al. Prevalence of adverse events in pediatric intensive care units in the United States. Pediat Crit Care Med 2010;11:568-578.
160
Chapter 7
22. National Coordinating Council for Medication Error Reporting and Prevention (NCC MERP). Available: www.nccmerp.org, accessed January 2013.
23. Maaskant JM, Bosman D, van Rijn-Bikker P, et al. Preventable errors with non-opioid analgesics and anti-emetic drugs increase burden in hospitalized children. Eur J Pediatr Surg. 2014;24:381-388.
24. Child Health Corporation of America. Pediatric Trigger Toolkit: measuring adverse drug events in the Children’s Hospital. Available: www.chca.com/triggers, accessed January 2013.
25. Burch KJ. Using a trigger tool to assess adverse drug events in a children’s rehabilitation hospital. J Pediatr Pharmacol Ther 2011;16:204-209.
26. Klopotowska JE, Wierenga PC, Stuijt CC, et al. Adverse drug events in older hospitalized patients: results and reliability of a comprehensive and structured identification strategy. PLoS One 2013;8:e71045.
27. Carnevali L, Krug B, Amant F, et al. Performance of the adverse drug event trigger tool and the global trigger tool for identifying adverse drug events: experience in a Belgian hospital. Ann Pharmacother 2013;47:1414-1419.
28. Handler SM, Altman RL, Perera S, et al. A systematic review of the performance characteristics of clinical event monitor signals used to detect adverse drug events in the hospital setting. J Am Med Inform Assoc 2007;14:451-458.
29. Sharek PJ, Parry G, Goldmann D, et al. Performance characteristics of methodology to quantify adverse events over time in hospitalized patients. Health Serv Res 2011;46:654-678.
30. Naessens JM, O’Byrne TJ, Johnson MG, et al. Measuring hospital adverse events: assessing interrater reliability and trigger performance of the Global Trigger Tool. Int J Qual Health Care 2010;22:266-274.
31. Hwang JI, Chin HJ, Chang YS. Characteristics associated with the occurence of adverse events: a retrospective medical record review using the global trigger tool in a fully digitalized tertiary teaching hospital in Korea. J Eval Clin Pract 2014;20:27-35.
32. Unbeck M, Schildmeijer K, Henriksson P, et al. Is determination of adverse events affected by record review methodology? An evaluation of the “Harvard Medical Practice Study” method and the “Global Trigger Tool”. Patient Saf Surg 2013;7:1-12.
33. Kirkendall ES, Kloppenborg E, Papp J, et al. Measuring adverse events and levels of harm in pediatric inpatients with the global trigger tool. Pediatrics 2012;130:e1206-e1214.
34. Szekendi MK, Sullivan C, Bobb A, et al. Active surveillance using electronic triggers to detect adverse events in hospitalized patients. Qual Saf Health Care 2006;15:184-190.
35. Griffin FA, Classen DC. Detection of adverse events in surgical patients using the trigger tool approach. Qual Saf Health Care 2008;17:253-258.
36. Kaafarani HM, Rosen AK, Nebeker JR, et al. Development of trigger tools for surveillance of adverse events in ambulatory surgery. Qual Saf Health Care 2010;19:425-429.
37. Resar RK, Rozich JD, Simmonds T, et al. A trigger tool to identify adverse events in the ICU. Jt Comm J Qual Patient Saf 2006;32:585-590.
38. de Wet C, Bowie P. Screening electronic patient records to detect preventable harm: a trigger tool for primary care. Qual Prim Care 2011;19:115-125.
39. Kalenderian E, Walji MF, Tavares A, et al. An adverse event trigger tool in dentistry: a new methodology for measuring harm in dental office. J Am Dent Assoc 2013;144:808-814.
40. Lander L, Roberson DW, Plummer KM, et al. A trigger tool fails to identify serious errors and adverse events in pediatric otolaryngology. Otolaryngol Head Neck Surg 2010;143:480-486.
41. Brenner S, Detz A, Lopez A, et al. Signal and noise: applying a laboratory trigger tool to identify adverse drug events among primary care patients. BMJ Qual Saf 2012;21:670-675.
42. Marcum ZA, Arbogast KL, Behrens MC, et al. Utility of an adverse drug event trigger tool in Veterans Affairs Nursing Facilities. Consult Pharm 2013;28:99-109.
43. Singh R, McLean-Plunckett EA, Kee R, et al. Experience with a trigger tool for identifying adverse drug
161
The trigger tool
Chap
ter 7
events among older adults in ambulatory primary care. Qual Saf Health Care 2009;18:199-204.
44. Holdsworth MT, Fichtl RE, Behta M, et al. Incidence and impact of adverse drug events in pediatric inpatients. Arch Pediatr Adolesc Med 2003;157:60-65.
45. Aljadhey H, Mahmoud MA, Mayet A, et al. Incidence of adverse drug events in an academic hospital: a prospective cohort study. Int J Qual Health Care 2013;25:648-655.
46. Institute for Healthcare Improvement. Trigger Tool for measuring adverse drug events. Available: www.ihi.org, accessed August 2014.
47. Michel P, Quenon JL, de Sarasqueta AM, et al. Comparison of three methods for estimating rates of adverse events and rates of preventable adverse events in acute care hospitals. BMJ 2004;328:199-224.
48. Classen DC, Lloyd RC, Provost L, et al. Development and evaluation of the Institute for Healthcare Improvement global trigger tool. J Patient Saf 2008;4:169-177.
49. Schildmeijer K, Nilsson L, Arestedt K, et al. Assessment of adverse events in medical care: lack of consistency between experienced teams using the Global Trigger Tool. BMJ Qual Saf 2012;21:307-314.
50. Dubois C, Dámour D, Tchouaket E, et al. Associations of patient safety outcomes with models of nursing care organization at unit level in hospitals. Int J Qual Health Care 2013;25:110-117.
51. Haynes AB, Weiser TG, Berry WR, et al. Changes in safety attitude and relationship to decreased postoperative morbidity and mortality following implementation of a checklist-based surgical safety intervention. BMJ Qual Saf 2011;20:102-107.
52. Mazzocco K, Petitti DB, Fong KT, et al. Surgical team behaviors and patient outcomes. Am J Surg 2009;197:678-685.

Chapter 8
The clinimetric properties of the COMFORT scale: a systematic review
Jolanda MaaskantPaulien Raymakers-Janssen
Esther VeldhoenErwin Ista
Cees LucasHester Vermeulen
European Journal of Pain 2016, accepted.
164
Chapter 8
ABSTRACT
IntroductionThe COMFORT scale is a measurement tool to assess distress, sedation and pain in nonverbal pediatric patients. Several studies have described the COMFORT scale, but no formal assessment of the methodological quality has been undertaken. Therefore, we performed a systematic review to study the clinimetric properties of the (modified) COMFORT scale in children up to 18 years.
MethodsWe searched Central, CINAHL, Embase, Medline, PsycInfo and Web of Science until December 2014. The selection, data extraction and quality assessment were performed independently by 2 reviewers. Quality of the included studies was appraised using the COSMIN checklist.
ResultsWe found 30 studies that met the inclusion criteria. Most participants were ventilated children up to 4 years without neurological disorders. The results on internal consistency and interrater reliability showed values of >0.70 in most studies, indicating an adequate reliability. Construct validity resulted in correlations between 0.68 and 0.84 for distress, between 0.42 and 0.94 for sedation and between 0.31 and 0.96 for pain. The responsiveness of the (modified) COMFORT scale seems to be adequate. The quality of the included studies ranged from poor to excellent.
ConclusionThe COMFORT scale shows overall an adequate reliability in providing information on distress, sedation and pain. Construct validity varies from good to excellent for distress, from moderate to excellent for sedation, and from poor to excellent for pain. The included studies are clinically and methodologically heterogeneous, hampering firm conclusions.
165
The COMFORT scale
Chap
ter 8
INTRODUCTION
Hospitalized children are often confronted with invasive procedures in a hostile environment that cause distress and pain. Distress is defined as “an organism’s response to aversive internal and external stimuli and may include discomfort, anxiety, fear and pain” [1]. Pain is described as “an unpleasant sensory and emotional experience associated with actual or potential tissue damage, or described in terms of such damage” [2]. Distress and pain are important clinical problems because they result in elevated metabolism, possible deterioration of the immune system, impaired brain development, and may even affect morbidity [3,4]. Also the number of accidental removals of medical devices and complications during invasive procedures increase when distress or pain are present [3,5,6]. Sedatives and analgesics are therefore needed to treat distress and pain in these patients. Sedation seeks to reduce distress, whereas analgesia aims to diminish pain. However, maintaining adequate sedation or pain relief in children is difficult, because of the wide range of ages and stages of development, and the different requirements over the course of the illness. Therefore, the accurate measurement of distress and pain is essential to establish its presence, and to monitor the effectiveness of interventions for relief and prevention. However, despite the many available scales and their potential to support daily practice, the assessment of distress and pain in children is still considered suboptimal [7,8,9]. Self-report is considered the reference standard for the measurement of distress and pain in adults and verbal children. Preverbal and sedated critically ill children, however, are unable to self-report, which requires observational parameters assessed by proxies or healthcare professionals. In recent decades, a number of observational tools to measure distress and pain have been developed [10,11]. A well-known multidimensional tool is the COMFORT scale, that was originally developed as a continuous measure of distress in ventilated pediatric patients aged from birth to 18 years [1]. The original COMFORT scale consists of 6 behavioral and 2 physiological measures. Later studies showed that the 6 behavioral items explained most of the variance in scores [12-15]. For this reason the COMFORT scale was revised, resulting in the COMFORT-Behavior (COMFORT-B) scale, including only these 6 items. Literature also describes other modified COMFORT scales like the COMFORT-neo, COMFORT-without muscle tone, and the COMFORT-without blood pressure [16-18]. Since the original development, a number of studies have described the clinimetric properties of the (modified) COMFORT scale measuring distress, sedation or pain in children of different ages, with different health conditions in different clinical contexts [13,18-21], but formal assessment of the methodological quality of the (modified) COMFORT scale has not been performed. An in-depth appraisal on this topic is needed to support healthcare professionals to decide when the COMFORT scale can be used
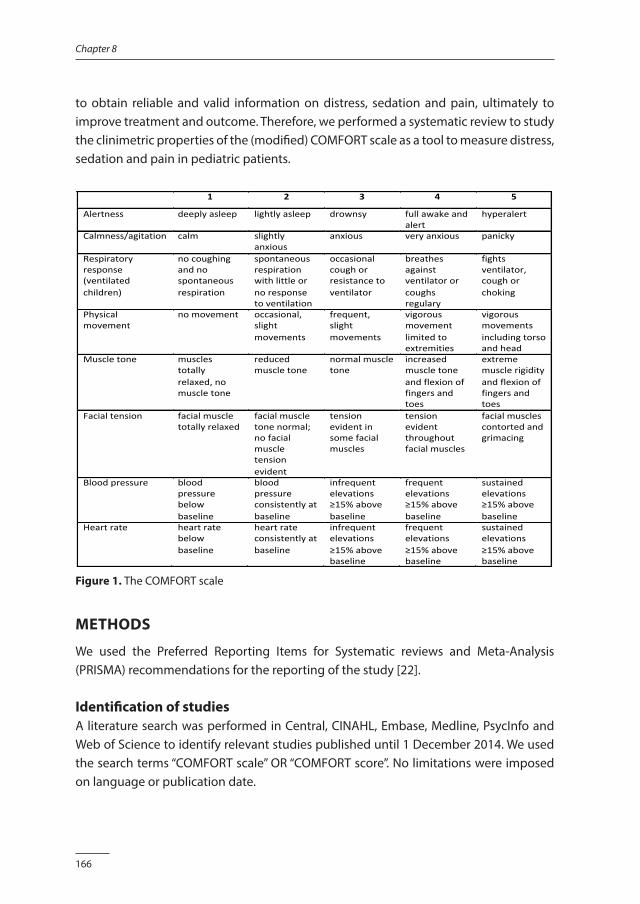
166
Chapter 8
to obtain reliable and valid information on distress, sedation and pain, ultimately to improve treatment and outcome. Therefore, we performed a systematic review to study the clinimetric properties of the (modified) COMFORT scale as a tool to measure distress, sedation and pain in pediatric patients.
1 2 3 4 5
Alertness deeplyasleep lightlyasleep drownsy fullawakeandalert
hyperalert
Calmness/agitation calm slightlyanxious
anxious veryanxious panicky
Respiratoryresponse(ventilatedchildren)
nocoughingandnospontaneousrespiration
spontaneousrespirationwithlittleornoresponsetoventilation
occasionalcoughorresistancetoventilator
breathesagainstventilatororcoughsregulary
fightsventilator,coughorchoking
Physicalmovement
nomovement occasional,slightmovements
frequent,slightmovements
vigorousmovementlimitedtoextremities
vigorousmovementsincludingtorsoandhead
Muscletone musclestotallyrelaxed,nomuscletone
reducedmuscletone
normalmuscletone
increasedmuscletoneandflexionoffingersandtoes
extrememusclerigidityandflexionoffingersandtoes
Facialtension facialmuscletotallyrelaxed
facialmuscletonenormal;nofacialmuscletensionevident
tensionevidentinsomefacialmuscles
tensionevidentthroughoutfacialmuscles
facialmusclescontortedandgrimacing
Bloodpressure bloodpressurebelowbaseline
bloodpressureconsistentlyatbaseline
infrequentelevations≥15%abovebaseline
frequentelevations≥15%abovebaseline
sustainedelevations≥15%abovebaseline
Heartrate heartratebelowbaseline
heartrateconsistentlyatbaseline
infrequentelevations≥15%abovebaseline
frequentelevations≥15%abovebaseline
sustainedelevations≥15%abovebaseline
Figure 1. The COMFORT scale
METHODS
We used the Preferred Reporting Items for Systematic reviews and Meta-Analysis (PRISMA) recommendations for the reporting of the study [22].
Identification of studiesA literature search was performed in Central, CINAHL, Embase, Medline, PsycInfo and Web of Science to identify relevant studies published until 1 December 2014. We used the search terms “COMFORT scale” OR “COMFORT score”. No limitations were imposed on language or publication date.
167
The COMFORT scale
Chap
ter 8
Two independent reviewers (PRJ, EV or JM) screened the search results on titles and abstracts to assess which studies satisfied the inclusion criteria. This was followed by full-text review of potentially eligible studies. The reference lists of the potentially eligible studies were hand searched to identify additional articles. Studies were included if they met the following criteria:1. the study aim was to evaluate 1 or more clinimetric properties of the original
COMFORT scale or any of the modified versions, as a tool to measure distress, sedation or pain;
2. the study population consisted of children from birth until 18 years, including premature neonates;
3. the studies were published as original articles. We decided to use the term “(modified) COMFORT” to describe collectively all versions of the scale we found in the literature. Publications were excluded if only abstracts were available, or if it concerned reviews, guidelines, descriptive studies, editorials or poster publications. Disagreements were discussed and solved with help of a third reviewer (JM, HV or EI) when necessary.
Data extraction A structured form was used to extract data from the original studies on participants (setting, number of participants and observations, age, diagnosis and intervention), type of outcome (distress, sedation or pain), assessment procedures and results on the clinimetric properties (statistics, outcomes, subgroups analysis). Data on the clinimetric properties included reliability, validity and responsiveness. Reliability refers to the extent to which the instrument produces consistent and reproducible results. Validity is the extent to which an instrument measures what it intends to measure. Responsiveness expresses the ability of an instrument to detect change over time. The data extraction included the following sub-categories: internal consistency, interrater reliability, intrarater reliability, measurement error, content, construct, criterion validity and responsiveness. Descriptions are presented in Table 1. Translations and transcultural validation were not assessed in this systematic review. Two reviewers (PRJ, EV or JM) extracted the data independently. Consensus was reached after discussion and consulting a third reviewer (JM or HV) when necessary.
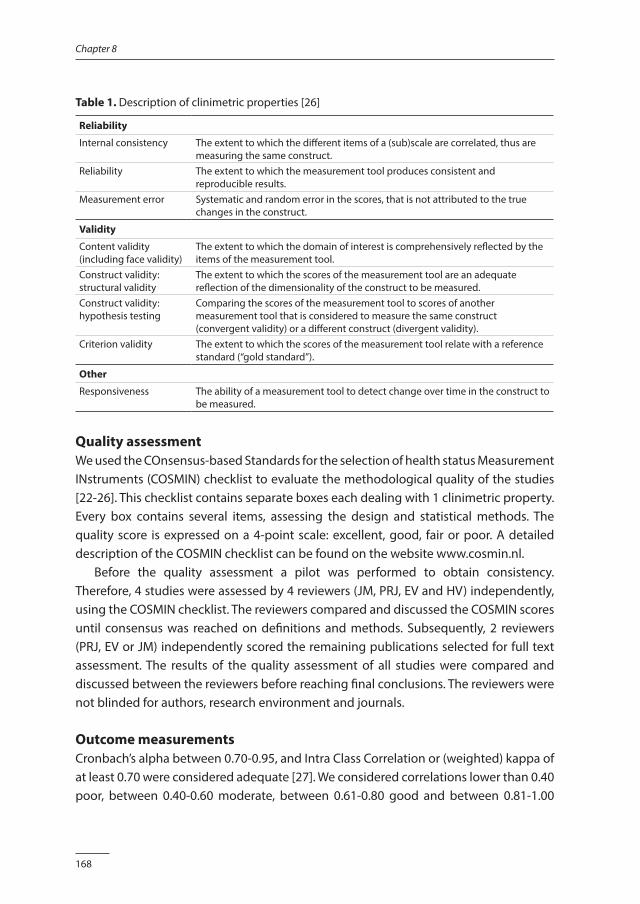
168
Chapter 8
Table 1. Description of clinimetric properties [26]
Reliability
Internal consistency The extent to which the different items of a (sub)scale are correlated, thus are measuring the same construct.
Reliability The extent to which the measurement tool produces consistent and reproducible results.
Measurement error Systematic and random error in the scores, that is not attributed to the true changes in the construct.
Validity
Content validity (including face validity)
The extent to which the domain of interest is comprehensively reflected by the items of the measurement tool.
Construct validity: structural validity
The extent to which the scores of the measurement tool are an adequate reflection of the dimensionality of the construct to be measured.
Construct validity: hypothesis testing
Comparing the scores of the measurement tool to scores of another measurement tool that is considered to measure the same construct (convergent validity) or a different construct (divergent validity).
Criterion validity The extent to which the scores of the measurement tool relate with a reference standard (“gold standard”).
Other
Responsiveness The ability of a measurement tool to detect change over time in the construct to be measured.
Quality assessmentWe used the COnsensus-based Standards for the selection of health status Measurement INstruments (COSMIN) checklist to evaluate the methodological quality of the studies [22-26]. This checklist contains separate boxes each dealing with 1 clinimetric property. Every box contains several items, assessing the design and statistical methods. The quality score is expressed on a 4-point scale: excellent, good, fair or poor. A detailed description of the COSMIN checklist can be found on the website www.cosmin.nl. Before the quality assessment a pilot was performed to obtain consistency. Therefore, 4 studies were assessed by 4 reviewers (JM, PRJ, EV and HV) independently, using the COSMIN checklist. The reviewers compared and discussed the COSMIN scores until consensus was reached on definitions and methods. Subsequently, 2 reviewers (PRJ, EV or JM) independently scored the remaining publications selected for full text assessment. The results of the quality assessment of all studies were compared and discussed between the reviewers before reaching final conclusions. The reviewers were not blinded for authors, research environment and journals.
Outcome measurementsCronbach’s alpha between 0.70-0.95, and Intra Class Correlation or (weighted) kappa of at least 0.70 were considered adequate [27]. We considered correlations lower than 0.40 poor, between 0.40-0.60 moderate, between 0.61-0.80 good and between 0.81-1.00
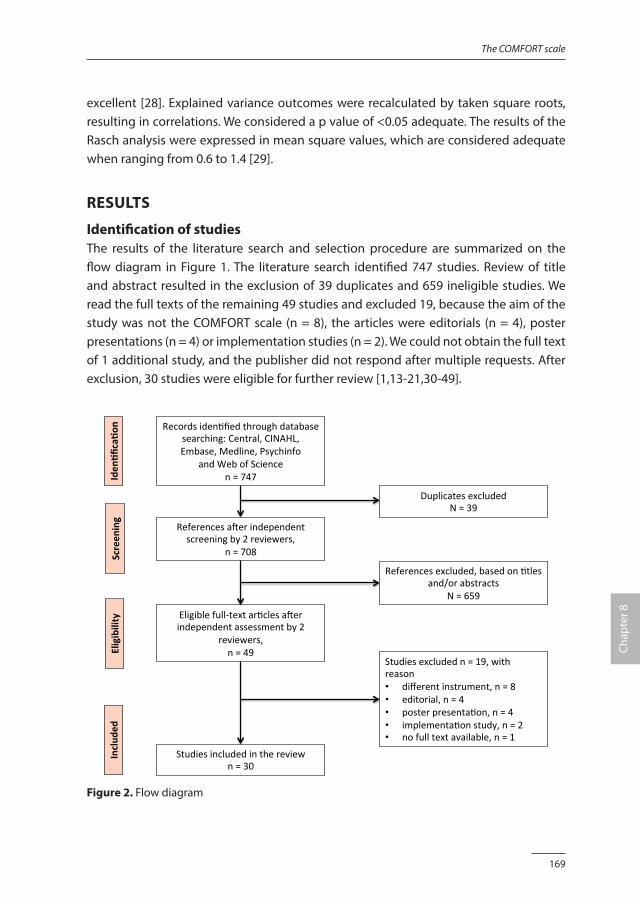
169
The COMFORT scale
Chap
ter 8
excellent [28]. Explained variance outcomes were recalculated by taken square roots, resulting in correlations. We considered a p value of <0.05 adequate. The results of the Rasch analysis were expressed in mean square values, which are considered adequate when ranging from 0.6 to 1.4 [29].
RESULTS
Identification of studiesThe results of the literature search and selection procedure are summarized on the flow diagram in Figure 1. The literature search identified 747 studies. Review of title and abstract resulted in the exclusion of 39 duplicates and 659 ineligible studies. We read the full texts of the remaining 49 studies and excluded 19, because the aim of the study was not the COMFORT scale (n = 8), the articles were editorials (n = 4), poster presentations (n = 4) or implementation studies (n = 2). We could not obtain the full text of 1 additional study, and the publisher did not respond after multiple requests. After exclusion, 30 studies were eligible for further review [1,13-21,30-49].
Recordsiden+fiedthroughdatabasesearching:Central,CINAHL,Embase,Medline,Psychinfo
andWebofSciencen=747
ReferencesaGerindependentscreeningby2reviewers,
n=708
Eligiblefull-textar+clesaGerindependentassessmentby2
reviewers,n=49
Studiesincludedinthereviewn=30
DuplicatesexcludedN=39
Studiesexcludedn=19,withreason• differentinstrument,n=8• editorial,n=4• posterpresenta+on,n=4• implementa+onstudy,n=2• nofulltextavailable,n=1
Referencesexcluded,basedon+tlesand/orabstracts
N=659
Iden
%fica%o
nEligibility
Screen
ing
Includ
ed
Figure 2. Flow diagram
170
Chapter 8
Description of included studiesOut of the 30 included studies 20 took place in highly specialized pediatric intensive care units (PICUs) [1,13-15,20,30,32-41,44,46-48] and 6 in Neonatal Intensive Care Units (NICUs) [16-18, 31,42,43]. The remaining studies were performed in an operation room [49], a specialized Burn Hospital [19,45] and on a maternity ward [21]. Sixteen studies investigated the original COMFORT scale [1,13,21,30-32,34-40,43,46,49] and the COMFORT-B was investigated in 8 studies [14,19,20,41,44,45,47,48]. Two studies investigated both the original COMFORT scale and the COMFORT-B [15,33]. Other modified versions were the COMFORT-without muscle tone [17], COMFORT-neo [16,42] and the COMFORT-without blood pressure [18]. Distress was studied in 4 studies [1,13,16,39] and 11 studies report on sedation [14,17,30,32,34-37,40,47,49]. All studies on distress and sedation included ventilated patients, with exception of 1 study that assessed the scale capacity to measure distress in patients receiving short term sedation during diagnostic open muscle biopsy [49]. Pain was studied in 11 studies [18-21,31,33,38,43-46]. Eight studies on pain included ventilated patients, who were therefore also sedated [20,33,38,41,43,44,46,48]. Studies on pain included study populations with postoperative pain [33,38,41,44] or procedural pain [18-21,31,43,45,46]. Three studies report results on background or prolonged pain [19,42,45]. Four studies report on both distress, sedation and/or pain [15,41,42,48]. In all studies the mean/median age of the participants was under 4 years. The study population in 7 studies consisted of (premature) neonates [16-18,21,31,42,43]. Whereas patients with neurological impairments were excluded from most studies, 1 study investigated the clinimetric properties of the COMFORT scale to measure pain in children with Down syndrome [20]. The characteristics of the included studies are summarized in Table 2.
Reliability In total 18 studies report on the reliability of the (modified) COMFORT scale [1,13-20,31,33,34,38,41-43,47,48]. Results on reliability are summarized in Table 3 (distress), Table 4 (sedation) and Table 5 (pain). The studies that report on more than one of these concepts are presented in both tables.
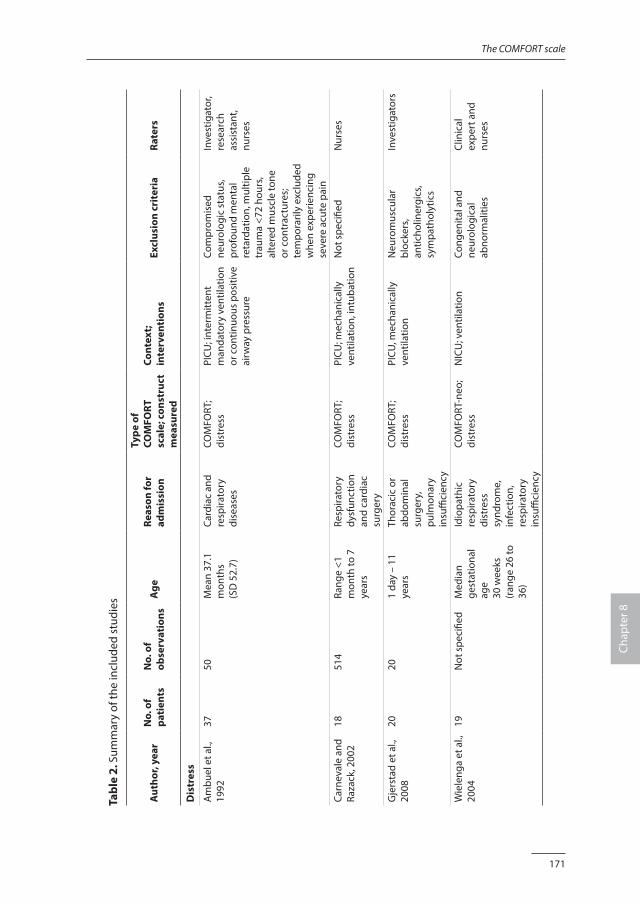
171
The COMFORT scale
Chap
ter 8
Tabl
e 2.
Sum
mar
y of
the
incl
uded
stu
dies
Aut
hor,
year
N
o. o
f pa
tien
tsN
o. o
f ob
serv
atio
nsA
ge
Reas
on fo
r ad
mis
sion
Type
of
COM
FORT
sc
ale;
con
stru
ct
mea
sure
d
Cont
ext;
inte
rven
tion
s Ex
clus
ion
crit
eria
Rate
rs
Dis
tres
s
Am
buel
et a
l.,
1992
3750
Mea
n 37
.1
mon
ths
(SD
52.
7)
Card
iac
and
resp
irato
ry
dise
ases
COM
FORT
; di
stre
ssPI
CU; i
nter
mitt
ent
man
dato
ry v
entil
atio
n or
con
tinuo
us p
ositi
ve
airw
ay p
ress
ure
Com
prom
ised
ne
urol
ogic
sta
tus,
prof
ound
men
tal
reta
rdat
ion,
mul
tiple
tr
aum
a <7
2 ho
urs,
alte
red
mus
cle
tone
or
con
trac
ture
s;
tem
pora
rily
excl
uded
w
hen
expe
rienc
ing
seve
re a
cute
pai
n
Inve
stig
ator
, re
sear
ch
assi
stan
t, nu
rses
Carn
eval
e an
d Ra
zack
, 200
218
514
Rang
e <1
m
onth
to 7
ye
ars
Resp
irato
ry
dysf
unct
ion
and
card
iac
surg
ery
COM
FORT
; di
stre
ssPI
CU; m
echa
nica
lly
vent
ilatio
n, in
tuba
tion
Not
spe
cifie
dN
urse
s
Gje
rsta
d et
al.,
20
0820
201
day
– 11
ye
ars
Thor
acic
or
abdo
min
al
surg
ery,
pu
lmon
ary
insu
ffici
ency
COM
FORT
; di
stre
ssPI
CU, m
echa
nica
lly
vent
ilatio
nN
euro
mus
cula
r bl
ocke
rs,
antic
holin
ergi
cs,
sym
path
olyt
ics
Inve
stig
ator
s
Wie
leng
a et
al.,
20
0419
Not
spe
cifie
dM
edia
n ge
stat
iona
l ag
e 30
wee
ks
(ran
ge 2
6 to
36
)
Idio
path
ic
resp
irato
ry
dist
ress
sy
ndro
me,
in
fect
ion,
re
spira
tory
in
suffi
cien
cy
COM
FORT
-neo
; di
stre
ssN
ICU
; ven
tilat
ion
Cong
enita
l and
ne
urol
ogic
al
abno
rmal
ities
Clin
ical
ex
pert
and
nu
rses
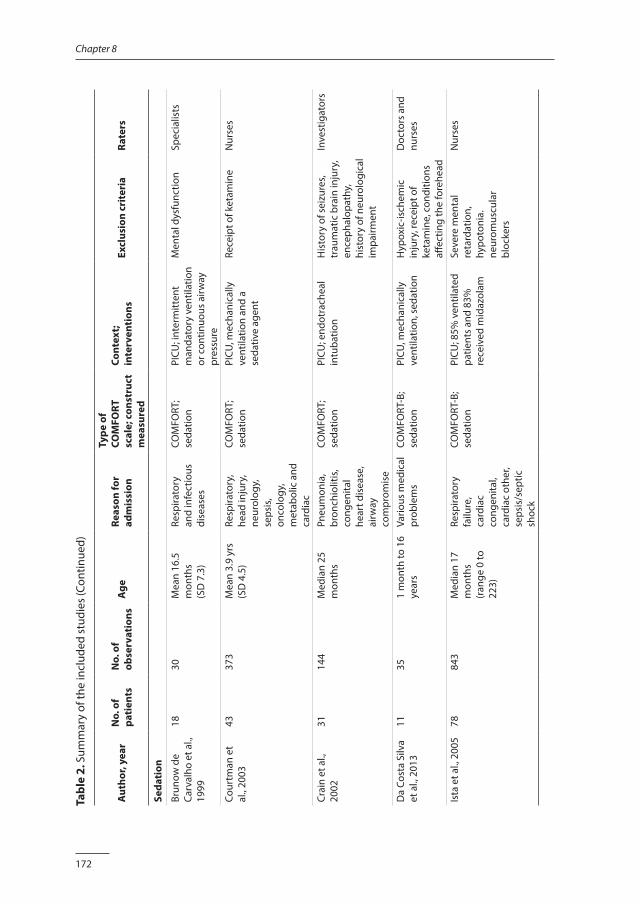
172
Chapter 8
Tabl
e 2.
Sum
mar
y of
the
incl
uded
stu
dies
(Con
tinue
d)
Aut
hor,
year
N
o. o
f pa
tien
tsN
o. o
f ob
serv
atio
nsA
ge
Reas
on fo
r ad
mis
sion
Type
of
COM
FORT
sc
ale;
con
stru
ct
mea
sure
d
Cont
ext;
inte
rven
tion
s Ex
clus
ion
crit
eria
Rate
rs
Seda
tion
Brun
ow d
e Ca
rval
ho e
t al.,
19
99
1830
Mea
n 16
.5
mon
ths
(SD
7.3
)
Resp
irato
ry
and
infe
ctio
us
dise
ases
COM
FORT
; se
datio
n PI
CU; i
nter
mitt
ent
man
dato
ry v
entil
atio
n or
con
tinuo
us a
irway
pr
essu
re
Men
tal d
ysfu
nctio
n Sp
ecia
lists
Cour
tman
et
al.,
2003
4337
3M
ean
3.9
yrs
(SD
4.5
)Re
spira
tory
, he
ad in
jury
, ne
urol
ogy,
se
psis
, on
colo
gy,
met
abol
ic a
nd
card
iac
COM
FORT
; se
datio
nPI
CU, m
echa
nica
lly
vent
ilatio
n an
d a
seda
tive
agen
t
Rece
ipt o
f ket
amin
eN
urse
s
Crai
n et
al.,
20
0231
14
4M
edia
n 25
m
onth
s
Pneu
mon
ia,
bron
chio
litis
, co
ngen
ital
hear
t dis
ease
, ai
rway
co
mpr
omis
e
COM
FORT
; se
datio
nPI
CU; e
ndot
rach
eal
intu
batio
nH
isto
ry o
f sei
zure
s, tr
aum
atic
bra
in in
jury
, en
ceph
alop
athy
, hi
stor
y of
neu
rolo
gica
l im
pairm
ent
Inve
stig
ator
s
Da
Cost
a Si
lva
et a
l., 2
013
1135
1 m
onth
to 1
6 ye
ars
Vario
us m
edic
al
prob
lem
sCO
MFO
RT-B
; se
datio
nPI
CU, m
echa
nica
lly
vent
ilatio
n, s
edat
ion
Hyp
oxic
-isch
emic
in
jury
, rec
eipt
of
keta
min
e, c
ondi
tions
aff
ectin
g th
e fo
rehe
ad
Doc
tors
and
nu
rses
Ista
et a
l., 2
005
7884
3M
edia
n 17
m
onth
s
(ran
ge 0
to
223)
Resp
irato
ry
failu
re,
card
iac
cong
enita
l, ca
rdia
c ot
her,
seps
is/s
eptic
sh
ock
COM
FORT
-B;
seda
tion
PICU
; 85%
ven
tilat
ed
patie
nts
and
83%
re
ceiv
ed m
idaz
olam
Seve
re m
enta
l re
tard
atio
n,
hypo
toni
a.
neur
omus
cula
r bl
ocke
rs
Nur
ses
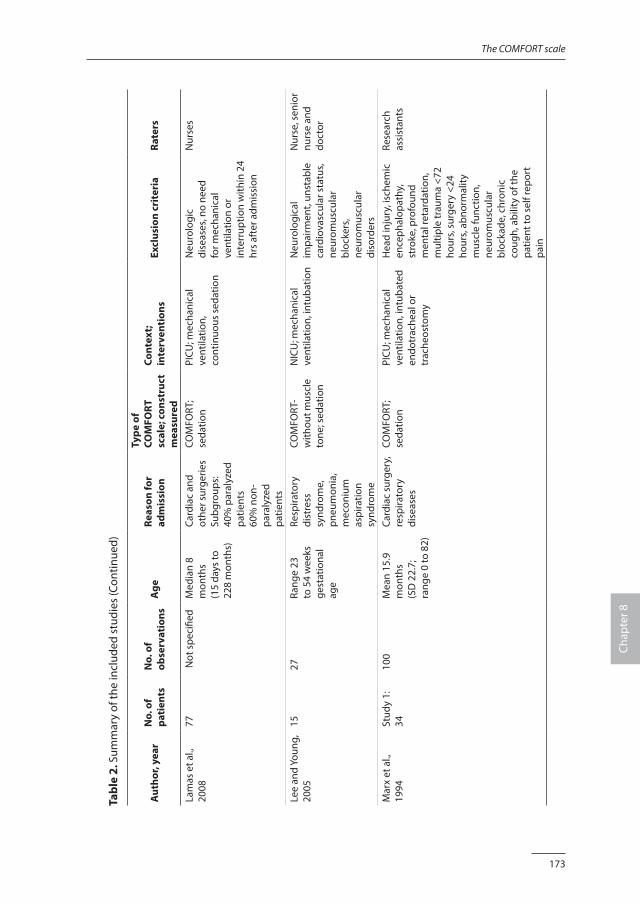
173
The COMFORT scale
Chap
ter 8
Tabl
e 2.
Sum
mar
y of
the
incl
uded
stu
dies
(Con
tinue
d)
Aut
hor,
year
N
o. o
f pa
tien
tsN
o. o
f ob
serv
atio
nsA
ge
Reas
on fo
r ad
mis
sion
Type
of
COM
FORT
sc
ale;
con
stru
ct
mea
sure
d
Cont
ext;
inte
rven
tion
s Ex
clus
ion
crit
eria
Rate
rs
Lam
as e
t al.,
20
0877
Not
spe
cifie
dM
edia
n 8
mon
ths
(1
5 da
ys to
22
8 m
onth
s)
Card
iac
and
othe
r sur
gerie
s Su
bgro
ups:
40%
par
alyz
ed
patie
nts
60%
non
-pa
raly
zed
patie
nts
COM
FORT
; se
datio
n PI
CU; m
echa
nica
l ve
ntila
tion,
co
ntin
uous
sed
atio
n
Neu
rolo
gic
dise
ases
, no
need
fo
r mec
hani
cal
vent
ilatio
n or
in
terr
uptio
n w
ithin
24
hrs
afte
r adm
issi
on
Nur
ses
Lee
and
Youn
g,
2005
1527
Rang
e 23
to
54
wee
ks
gest
atio
nal
age
Resp
irato
ry
dist
ress
sy
ndro
me,
pn
eum
onia
, m
econ
ium
as
pira
tion
synd
rom
e
COM
FORT
-w
ithou
t mus
cle
tone
; sed
atio
n
NIC
U; m
echa
nica
l ve
ntila
tion,
intu
batio
nN
euro
logi
cal
impa
irmen
t, un
stab
le
card
iova
scul
ar s
tatu
s, ne
urom
uscu
lar
bloc
kers
, ne
urom
uscu
lar
diso
rder
s
Nur
se, s
enio
r nu
rse
and
doct
or
Mar
x et
al.,
19
94St
udy
1:34
100
Mea
n 15
.9
mon
ths
(SD
22.
7;
rang
e 0
to 8
2)
Card
iac
surg
ery,
re
spira
tory
di
seas
es
COM
FORT
; se
datio
n PI
CU; m
echa
nica
l ve
ntila
tion,
intu
bate
d en
dotr
ache
al o
r tr
ache
osto
my
Hea
d in
jury
, isc
hem
ic
ence
phal
opat
hy,
stro
ke, p
rofo
und
men
tal r
etar
datio
n,
mul
tiple
trau
ma
<72
hour
s, su
rger
y <2
4 ho
urs,
abno
rmal
ity
mus
cle
func
tion,
ne
urom
uscu
lar
bloc
kade
, chr
onic
co
ugh,
abi
lity
of th
e pa
tient
to s
elf r
epor
t pa
in
Rese
arch
as
sist
ants
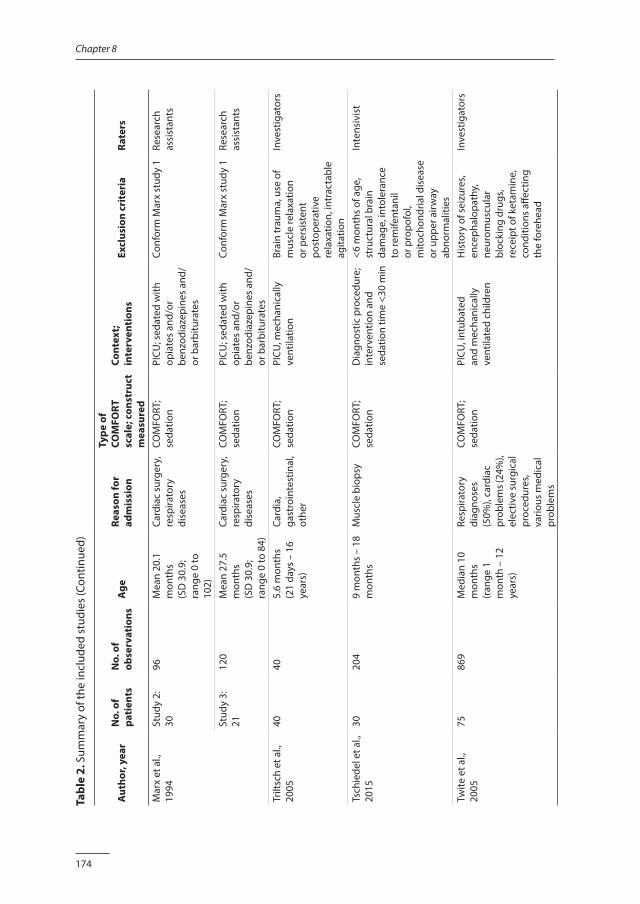
174
Chapter 8
Tabl
e 2.
Sum
mar
y of
the
incl
uded
stu
dies
(Con
tinue
d)
Aut
hor,
year
N
o. o
f pa
tien
tsN
o. o
f ob
serv
atio
nsA
ge
Reas
on fo
r ad
mis
sion
Type
of
COM
FORT
sc
ale;
con
stru
ct
mea
sure
d
Cont
ext;
inte
rven
tion
s Ex
clus
ion
crit
eria
Rate
rs
Mar
x et
al.,
19
94St
udy
2:30
96M
ean
20.1
m
onth
s (S
D 3
0.9;
ra
nge
0 to
10
2)
Card
iac
surg
ery,
re
spira
tory
di
seas
es
COM
FORT
; se
datio
n PI
CU; s
edat
ed w
ith
opia
tes
and/
or
benz
odia
zepi
nes
and/
or b
arbi
tura
tes
Conf
orm
Mar
x st
udy
1Re
sear
ch
assi
stan
ts
Stud
y 3:
2112
0M
ean
27.5
m
onth
s (S
D 3
0.9;
ra
nge
0 to
84)
Card
iac
surg
ery,
re
spira
tory
di
seas
es
COM
FORT
; se
datio
n PI
CU; s
edat
ed w
ith
opia
tes
and/
or
benz
odia
zepi
nes
and/
or b
arbi
tura
tes
Conf
orm
Mar
x st
udy
1Re
sear
ch
assi
stan
ts
Trilt
sch
et a
l.,
2005
4040
5.6
mon
ths
(21
days
– 1
6 ye
ars)
Card
ia,
gast
roin
test
inal
, ot
her
COM
FORT
; se
datio
nPI
CU, m
echa
nica
lly
vent
ilatio
nBr
ain
trau
ma,
use
of
mus
cle
rela
xatio
n or
per
sist
ent
post
oper
ativ
e re
laxa
tion,
intr
acta
ble
agita
tion
Inve
stig
ator
s
Tsch
iede
l et a
l.,
2015
3020
49
mon
ths
– 18
m
onth
sM
uscl
e bi
opsy
COM
FORT
; se
datio
nD
iagn
ostic
pro
cedu
re;
inte
rven
tion
and
seda
tion
time
<30
min
<6 m
onth
s of
age
, st
ruct
ural
bra
in
dam
age,
into
lera
nce
to re
mife
ntan
il or
pro
pofo
l, m
itoch
ondr
ial d
isea
se
or u
pper
airw
ay
abno
rmal
ities
Inte
nsiv
ist
Twite
et a
l.,
2005
7586
9M
edia
n 10
m
onth
s (r
ange
1
mon
th –
12
year
s)
Resp
irato
ry
diag
nose
s (5
0%),
card
iac
prob
lem
s (24
%),
elec
tive
surg
ical
pr
oced
ures
, va
rious
med
ical
pr
oble
ms
COM
FORT
; se
datio
nPI
CU, i
ntub
ated
an
d m
echa
nica
lly
vent
ilate
d ch
ildre
n
His
tory
of s
eizu
res,
ence
phal
opat
hy,
neur
omus
cula
r bl
ocki
ng d
rugs
, re
ceip
t of k
etam
ine,
co
nditi
ons
affec
ting
the
fore
head
Inve
stig
ator
s
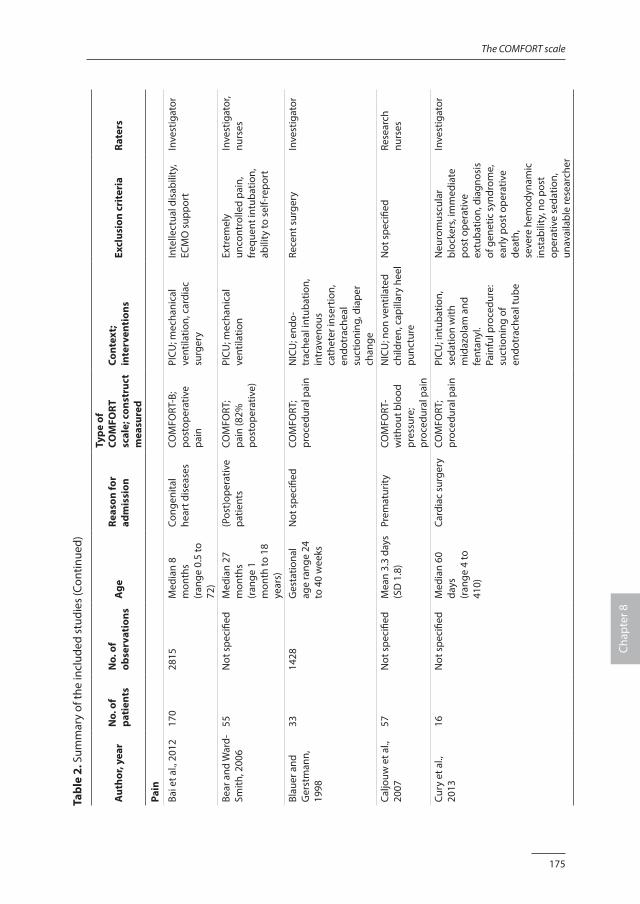
175
The COMFORT scale
Chap
ter 8
Tabl
e 2.
Sum
mar
y of
the
incl
uded
stu
dies
(Con
tinue
d)
Aut
hor,
year
N
o. o
f pa
tien
tsN
o. o
f ob
serv
atio
nsA
ge
Reas
on fo
r ad
mis
sion
Type
of
COM
FORT
sc
ale;
con
stru
ct
mea
sure
d
Cont
ext;
inte
rven
tion
s Ex
clus
ion
crit
eria
Rate
rs
Pain
Bai e
t al.,
201
217
028
15M
edia
n 8
mon
ths
(ran
ge 0
.5 to
72
)
Cong
enita
l he
art d
isea
ses
COM
FORT
-B;
post
oper
ativ
e pa
in
PICU
; mec
hani
cal
vent
ilatio
n, c
ardi
ac
surg
ery
Inte
llect
ual d
isab
ility
, EC
MO
sup
port
Inve
stig
ator
Bear
and
War
d-Sm
ith, 2
006
55N
ot s
peci
fied
Med
ian
27
mon
ths
(ran
ge 1
m
onth
to 1
8 ye
ars)
(Pos
t)op
erat
ive
patie
nts
COM
FORT
; pa
in (8
2%
post
oper
ativ
e)
PICU
; mec
hani
cal
vent
ilatio
n Ex
trem
ely
unco
ntro
lled
pain
, fr
eque
nt in
tuba
tion,
ab
ility
to s
elf-r
epor
t
Inve
stig
ator
, nu
rses
Blau
er a
nd
Ger
stm
ann,
19
98
3314
28G
esta
tiona
l ag
e ra
nge
24
to 4
0 w
eeks
Not
spe
cifie
dCO
MFO
RT;
proc
edur
al p
ain
NIC
U; e
ndo-
trac
heal
intu
batio
n,
intr
aven
ous
cath
eter
inse
rtio
n,
endo
trac
heal
su
ctio
ning
, dia
per
chan
ge
Rece
nt s
urge
ryIn
vest
igat
or
Caljo
uw e
t al.,
20
0757
Not
spe
cifie
dM
ean
3.3
days
(S
D 1
.8)
Prem
atur
ityCO
MFO
RT-
with
out b
lood
pr
essu
re;
proc
edur
al p
ain
NIC
U; n
on v
entil
ated
ch
ildre
n, c
apill
ary
heel
pu
nctu
re
Not
spe
cifie
dRe
sear
ch
nurs
es
Cury
et a
l.,
2013
16N
ot s
peci
fied
Med
ian
60
days
(r
ange
4 to
41
0)
Card
iac
surg
ery
COM
FORT
; pr
oced
ural
pai
nPI
CU; i
ntub
atio
n,
seda
tion
with
m
idaz
olam
and
fe
ntan
yl.
Pain
ful p
roce
dure
: su
ctio
ning
of
endo
trac
heal
tube
Neu
rom
uscu
lar
bloc
kers
, im
med
iate
po
st o
pera
tive
extu
batio
n, d
iagn
osis
of
gen
etic
syn
drom
e,
early
pos
t ope
rativ
e de
ath,
se
vere
hem
odyn
amic
in
stab
ility
, no
post
op
erat
ive
seda
tion,
un
avai
labl
e re
sear
cher
Inve
stig
ator
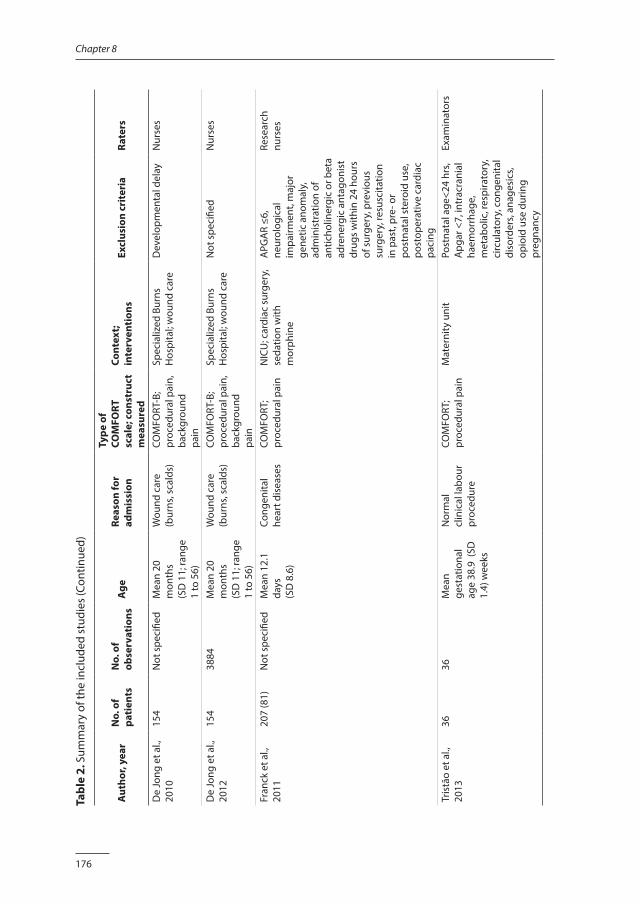
176
Chapter 8
Tabl
e 2.
Sum
mar
y of
the
incl
uded
stu
dies
(Con
tinue
d)
Aut
hor,
year
N
o. o
f pa
tien
tsN
o. o
f ob
serv
atio
nsA
ge
Reas
on fo
r ad
mis
sion
Type
of
COM
FORT
sc
ale;
con
stru
ct
mea
sure
d
Cont
ext;
inte
rven
tion
s Ex
clus
ion
crit
eria
Rate
rs
De
Jong
et a
l.,
2010
154
Not
spe
cifie
dM
ean
20
mon
ths
(SD
11;
rang
e 1
to 5
6)
Wou
nd c
are
(bur
ns, s
cald
s)
COM
FORT
-B;
proc
edur
al p
ain,
ba
ckgr
ound
pa
in
Spec
ializ
ed B
urns
H
ospi
tal;
wou
nd c
are
Dev
elop
men
tal d
elay
Nur
ses
De
Jong
et a
l.,
2012
154
3884
Mea
n 20
m
onth
s(S
D 1
1; ra
nge
1 to
56)
Wou
nd c
are
(bur
ns, s
cald
s)
COM
FORT
-B;
proc
edur
al p
ain,
ba
ckgr
ound
pa
in
Spec
ializ
ed B
urns
H
ospi
tal;
wou
nd c
are
Not
spe
cifie
dN
urse
s
Fran
ck e
t al.,
20
1120
7 (8
1)N
ot s
peci
fied
Mea
n 12
.1
days
(SD
8.6
)
Cong
enita
l he
art d
isea
ses
COM
FORT
; pr
oced
ural
pai
nN
ICU
; car
diac
sur
gery
, se
datio
n w
ith
mor
phin
e
APG
AR
≤6,
neur
olog
ical
im
pairm
ent,
maj
or
gene
tic a
nom
aly,
ad
min
istr
atio
n of
an
ticho
liner
gic
or b
eta
adre
nerg
ic a
ntag
onis
t dr
ugs
with
in 2
4 ho
urs
of s
urge
ry, p
revi
ous
surg
ery,
resu
scita
tion
in p
ast,
pre-
or
post
nata
l ste
roid
use
, po
stop
erat
ive
card
iac
paci
ng
Rese
arch
nu
rses
Tris
tão
et a
l.,
2013
3636
Mea
n ge
stat
iona
l ag
e 38
.9 (
SD
1.4)
wee
ks
Nor
mal
cl
inic
al la
bour
pr
oced
ure
COM
FORT
; pr
oced
ural
pai
nM
ater
nity
uni
tPo
stna
tal a
ge<2
4 hr
s, A
pgar
<7,
intr
acra
nial
ha
emor
rhag
e,
met
abol
ic, r
espi
rato
ry,
circ
ulat
ory,
con
geni
tal
diso
rder
s, an
ages
ics,
opio
id u
se d
urin
g pr
egna
ncy
Exam
inat
ors
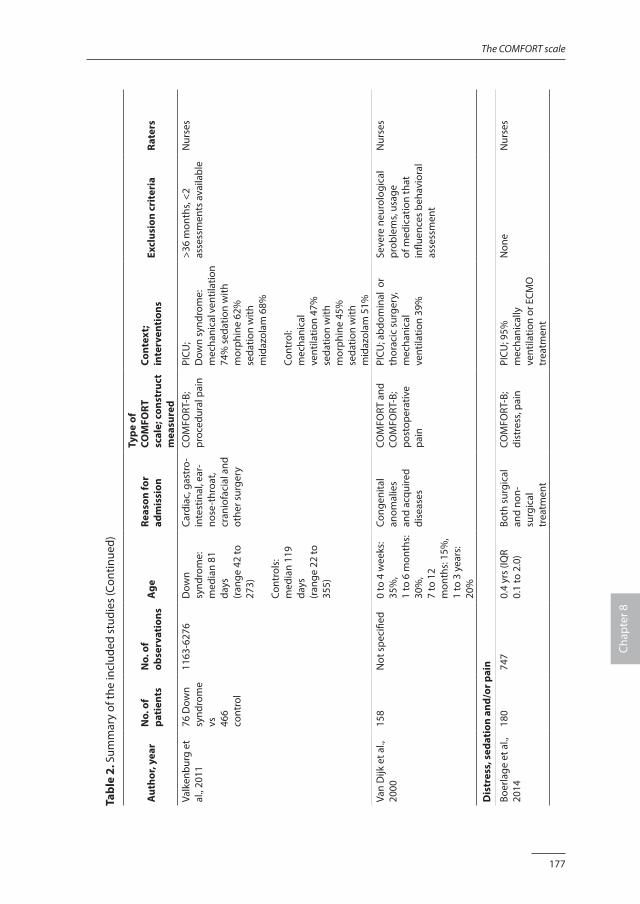
177
The COMFORT scale
Chap
ter 8
Tabl
e 2.
Sum
mar
y of
the
incl
uded
stu
dies
(Con
tinue
d)
Aut
hor,
year
N
o. o
f pa
tien
tsN
o. o
f ob
serv
atio
nsA
ge
Reas
on fo
r ad
mis
sion
Type
of
COM
FORT
sc
ale;
con
stru
ct
mea
sure
d
Cont
ext;
inte
rven
tion
s Ex
clus
ion
crit
eria
Rate
rs
Valk
enbu
rg e
t al
., 20
1176
Dow
n sy
ndro
me
vs
46
6 co
ntro
l
1163
-627
6D
own
synd
rom
e:m
edia
n 81
da
ys
(ran
ge 4
2 to
27
3)
Cont
rols
:m
edia
n 11
9 da
ys
(ran
ge 2
2 to
35
5)
Card
iac,
gas
tro-
in
test
inal
, ear
-no
se-t
hroa
t, cr
anio
faci
al a
nd
othe
r sur
gery
COM
FORT
-B;
proc
edur
al p
ain
PICU
;D
own
synd
rom
e:
mec
hani
cal v
entil
atio
n 74
% s
edat
ion
with
m
orph
ine
62%
seda
tion
with
m
idaz
olam
68%
Cont
rol:
mec
hani
cal
vent
ilatio
n 47
%se
datio
n w
ith
mor
phin
e 45
%se
datio
n w
ith
mid
azol
am 5
1%
>36
mon
ths,
<2
asse
ssm
ents
ava
ilabl
eN
urse
s
Van
Dijk
et a
l.,
2000
158
Not
spe
cifie
d0
to 4
wee
ks:
35%
, 1
to 6
mon
ths:
30
%,
7 to
12
mon
ths:
15%
, 1
to 3
yea
rs:
20%
Cong
enita
l an
omal
ies
and
acqu
ired
dise
ases
COM
FORT
and
CO
MFO
RT-B
; po
stop
erat
ive
pain
PICU
; abd
omin
al o
r th
orac
ic s
urge
ry,
mec
hani
cal
vent
ilatio
n 39
%
Seve
re n
euro
logi
cal
prob
lem
s, us
age
of m
edic
atio
n th
at
influ
ence
s be
havi
oral
as
sess
men
t
Nur
ses
Dis
tres
s, s
edat
ion
and/
or p
ain
Boer
lage
et a
l.,
2014
180
747
0.4
yrs
(IQR
0.1
to 2
.0)
Both
sur
gica
l an
d no
n-su
rgic
al
trea
tmen
t
COM
FORT
-B;
dist
ress
, pai
nPI
CU; 9
5%
mec
hani
cally
ve
ntila
tion
or E
CMO
tr
eatm
ent
Non
eN
urse
s
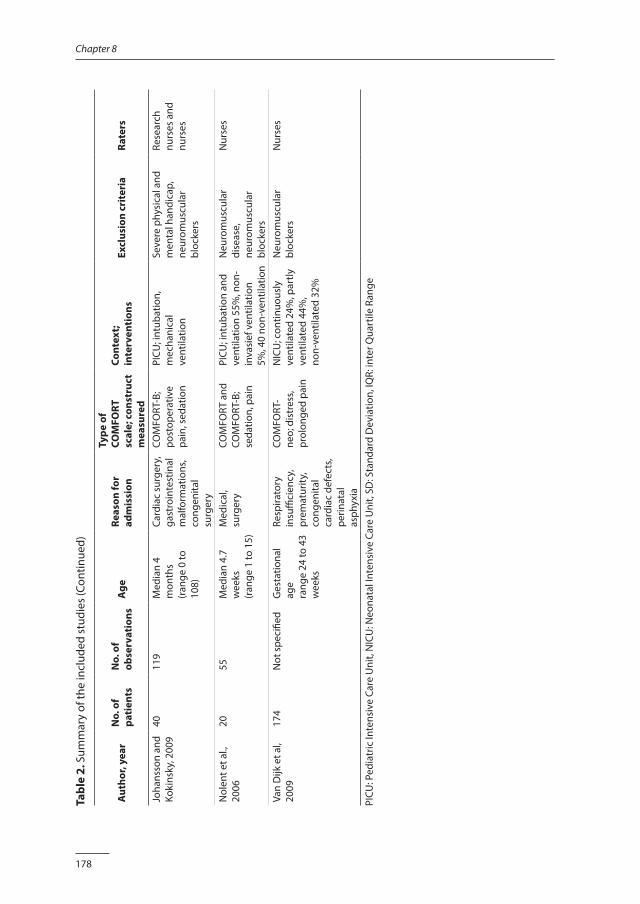
178
Chapter 8
Tabl
e 2.
Sum
mar
y of
the
incl
uded
stu
dies
(Con
tinue
d)
Aut
hor,
year
N
o. o
f pa
tien
tsN
o. o
f ob
serv
atio
nsA
ge
Reas
on fo
r ad
mis
sion
Type
of
COM
FORT
sc
ale;
con
stru
ct
mea
sure
d
Cont
ext;
inte
rven
tion
s Ex
clus
ion
crit
eria
Rate
rs
Joha
nsso
n an
d Ko
kins
ky, 2
009
4011
9M
edia
n 4
mon
ths
(ran
ge 0
to
108)
Card
iac
surg
ery,
ga
stro
inte
stin
al
mal
form
atio
ns,
cong
enita
l su
rger
y
COM
FORT
-B;
post
oper
ativ
e pa
in, s
edat
ion
PICU
; int
ubat
ion,
m
echa
nica
l ve
ntila
tion
Seve
re p
hysi
cal a
nd
men
tal h
andi
cap,
ne
urom
uscu
lar
bloc
kers
Rese
arch
nu
rses
and
nu
rses
Nol
ent e
t al.,
20
0620
55M
edia
n 4.
7 w
eeks
(r
ange
1 to
15)
Med
ical
, su
rger
y CO
MFO
RT a
nd
COM
FORT
-B;
seda
tion,
pai
n
PICU
; int
ubat
ion
and
vent
ilatio
n 55
%, n
on-
inva
sief
ven
tilat
ion
5%, 4
0 no
n-ve
ntila
tion
Neu
rom
uscu
lar
dise
ase,
ne
urom
uscu
lar
bloc
kers
Nur
ses
Van
Dijk
et a
l, 20
0917
4N
ot s
peci
fied
Ges
tatio
nal
age
rang
e 24
to 4
3 w
eeks
Resp
irato
ry
insu
ffici
ency
, pr
emat
urity
, co
ngen
ital
card
iac
defe
cts,
perin
atal
as
phyx
ia
COM
FORT
-ne
o; d
istr
ess,
prol
onge
d pa
in
NIC
U; c
ontin
uous
ly
vent
ilate
d 24
%, p
artly
ve
ntila
ted
44%
,no
n-ve
ntila
ted
32%
Neu
rom
uscu
lar
bloc
kers
Nur
ses
PICU
: Ped
iatr
ic In
tens
ive
Care
Uni
t, N
ICU
: Neo
nata
l Int
ensi
ve C
are
Uni
t, SD
: Sta
ndar
d D
evia
tion,
IQR:
inte
r Qua
rtile
Ran
ge
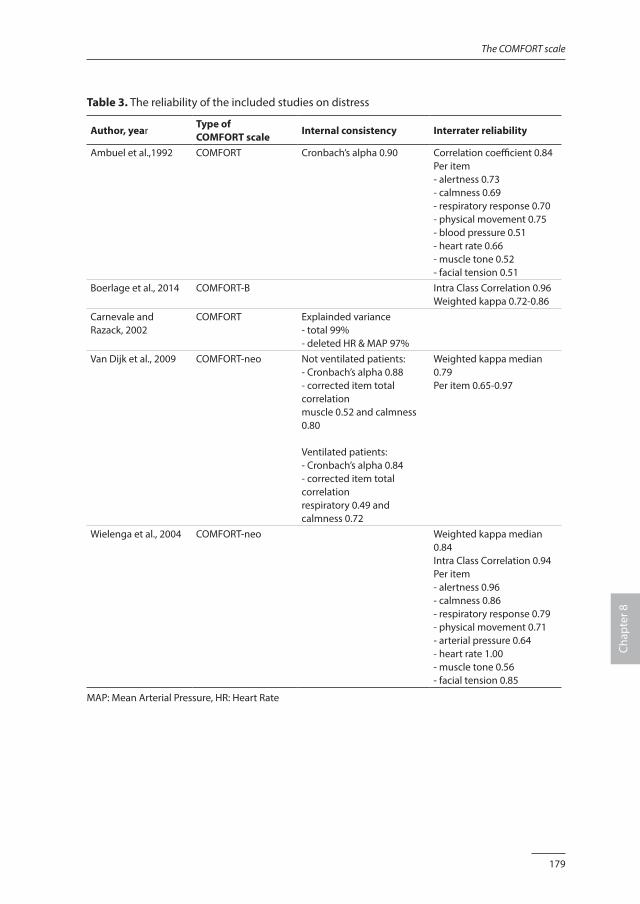
179
The COMFORT scale
Chap
ter 8
Table 3. The reliability of the included studies on distress
Author, yearType of COMFORT scale
Internal consistency Interrater reliability
Ambuel et al.,1992 COMFORT Cronbach’s alpha 0.90 Correlation coefficient 0.84 Per item- alertness 0.73- calmness 0.69- respiratory response 0.70- physical movement 0.75- blood pressure 0.51- heart rate 0.66- muscle tone 0.52- facial tension 0.51
Boerlage et al., 2014 COMFORT-B Intra Class Correlation 0.96Weighted kappa 0.72-0.86
Carnevale and Razack, 2002
COMFORT Explainded variance - total 99%- deleted HR & MAP 97%
Van Dijk et al., 2009 COMFORT-neo Not ventilated patients:- Cronbach’s alpha 0.88 - corrected item total correlation muscle 0.52 and calmness 0.80
Ventilated patients:- Cronbach’s alpha 0.84 - corrected item total correlation respiratory 0.49 and calmness 0.72
Weighted kappa median 0.79 Per item 0.65-0.97
Wielenga et al., 2004 COMFORT-neo Weighted kappa median 0.84 Intra Class Correlation 0.94 Per item - alertness 0.96 - calmness 0.86 - respiratory response 0.79 - physical movement 0.71 - arterial pressure 0.64 - heart rate 1.00 - muscle tone 0.56 - facial tension 0.85
MAP: Mean Arterial Pressure, HR: Heart Rate
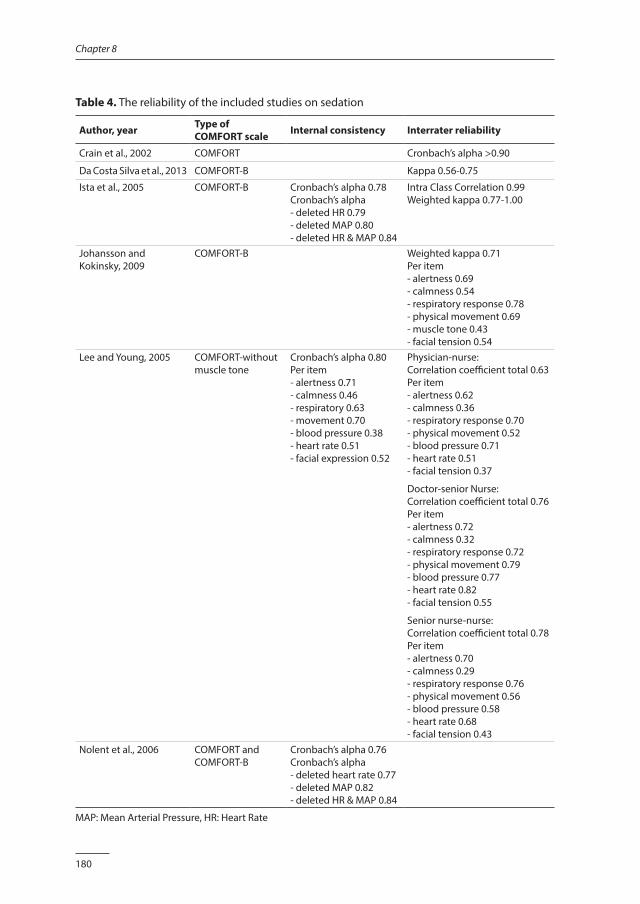
180
Chapter 8
Table 4. The reliability of the included studies on sedation
Author, year Type of COMFORT scale Internal consistency Interrater reliability
Crain et al., 2002 COMFORT Cronbach’s alpha >0.90
Da Costa Silva et al., 2013 COMFORT-B Kappa 0.56-0.75
Ista et al., 2005 COMFORT-B Cronbach’s alpha 0.78 Cronbach’s alpha - deleted HR 0.79 - deleted MAP 0.80 - deleted HR & MAP 0.84
Intra Class Correlation 0.99Weighted kappa 0.77-1.00
Johansson and Kokinsky, 2009
COMFORT-B Weighted kappa 0.71 Per item - alertness 0.69 - calmness 0.54 - respiratory response 0.78 - physical movement 0.69 - muscle tone 0.43 - facial tension 0.54
Lee and Young, 2005 COMFORT-without muscle tone
Cronbach’s alpha 0.80 Per item - alertness 0.71 - calmness 0.46 - respiratory 0.63 - movement 0.70 - blood pressure 0.38 - heart rate 0.51 - facial expression 0.52
Physician-nurse: Correlation coefficient total 0.63Per item - alertness 0.62 - calmness 0.36 - respiratory response 0.70 - physical movement 0.52 - blood pressure 0.71 - heart rate 0.51 - facial tension 0.37
Doctor-senior Nurse:Correlation coefficient total 0.76 Per item- alertness 0.72 - calmness 0.32 - respiratory response 0.72 - physical movement 0.79 - blood pressure 0.77 - heart rate 0.82 - facial tension 0.55
Senior nurse-nurse:Correlation coefficient total 0.78Per item- alertness 0.70 - calmness 0.29 - respiratory response 0.76 - physical movement 0.56 - blood pressure 0.58 - heart rate 0.68 - facial tension 0.43
Nolent et al., 2006 COMFORT and COMFORT-B
Cronbach’s alpha 0.76Cronbach’s alpha - deleted heart rate 0.77 - deleted MAP 0.82 - deleted HR & MAP 0.84
MAP: Mean Arterial Pressure, HR: Heart Rate
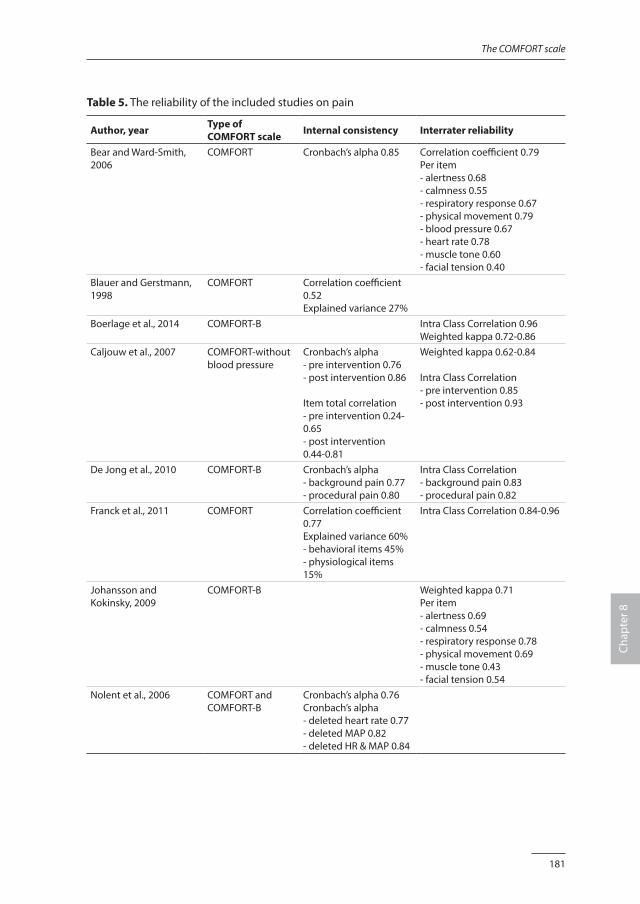
181
The COMFORT scale
Chap
ter 8
Table 5. The reliability of the included studies on pain
Author, year Type of COMFORT scale Internal consistency Interrater reliability
Bear and Ward-Smith, 2006
COMFORT Cronbach’s alpha 0.85 Correlation coefficient 0.79 Per item - alertness 0.68 - calmness 0.55 - respiratory response 0.67 - physical movement 0.79 - blood pressure 0.67 - heart rate 0.78 - muscle tone 0.60 - facial tension 0.40
Blauer and Gerstmann, 1998
COMFORT Correlation coefficient 0.52Explained variance 27%
Boerlage et al., 2014 COMFORT-B Intra Class Correlation 0.96Weighted kappa 0.72-0.86
Caljouw et al., 2007 COMFORT-without blood pressure
Cronbach’s alpha - pre intervention 0.76- post intervention 0.86
Item total correlation - pre intervention 0.24-0.65- post intervention 0.44-0.81
Weighted kappa 0.62-0.84
Intra Class Correlation- pre intervention 0.85- post intervention 0.93
De Jong et al., 2010 COMFORT-B Cronbach’s alpha- background pain 0.77 - procedural pain 0.80
Intra Class Correlation - background pain 0.83 - procedural pain 0.82
Franck et al., 2011 COMFORT Correlation coefficient 0.77Explained variance 60%- behavioral items 45%- physiological items 15%
Intra Class Correlation 0.84-0.96
Johansson and Kokinsky, 2009
COMFORT-B Weighted kappa 0.71 Per item - alertness 0.69 - calmness 0.54 - respiratory response 0.78 - physical movement 0.69 - muscle tone 0.43 - facial tension 0.54
Nolent et al., 2006 COMFORT and COMFORT-B
Cronbach’s alpha 0.76Cronbach’s alpha - deleted heart rate 0.77 - deleted MAP 0.82 - deleted HR & MAP 0.84
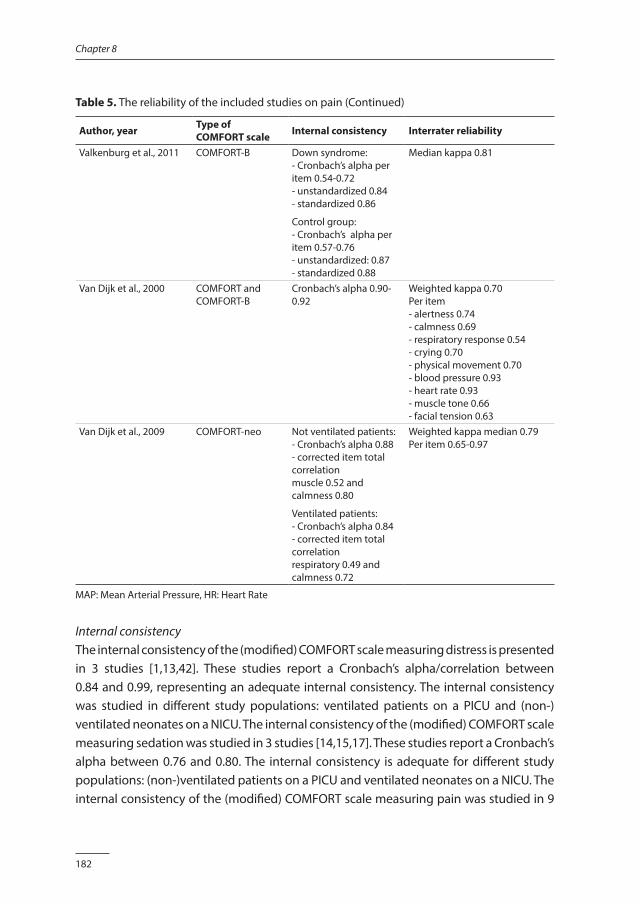
182
Chapter 8
Table 5. The reliability of the included studies on pain (Continued)
Author, year Type of COMFORT scale Internal consistency Interrater reliability
Valkenburg et al., 2011 COMFORT-B Down syndrome: - Cronbach’s alpha per item 0.54-0.72 - unstandardized 0.84 - standardized 0.86
Control group: - Cronbach’s alpha per item 0.57-0.76 - unstandardized: 0.87 - standardized 0.88
Median kappa 0.81
Van Dijk et al., 2000 COMFORT and COMFORT-B
Cronbach’s alpha 0.90-0.92
Weighted kappa 0.70 Per item - alertness 0.74 - calmness 0.69 - respiratory response 0.54 - crying 0.70 - physical movement 0.70 - blood pressure 0.93 - heart rate 0.93 - muscle tone 0.66 - facial tension 0.63
Van Dijk et al., 2009 COMFORT-neo Not ventilated patients:- Cronbach’s alpha 0.88 - corrected item total correlation muscle 0.52 and calmness 0.80
Ventilated patients:- Cronbach’s alpha 0.84 - corrected item total correlation respiratory 0.49 and calmness 0.72
Weighted kappa median 0.79 Per item 0.65-0.97
MAP: Mean Arterial Pressure, HR: Heart Rate
Internal consistencyThe internal consistency of the (modified) COMFORT scale measuring distress is presented in 3 studies [1,13,42]. These studies report a Cronbach’s alpha/correlation between 0.84 and 0.99, representing an adequate internal consistency. The internal consistency was studied in different study populations: ventilated patients on a PICU and (non-)ventilated neonates on a NICU. The internal consistency of the (modified) COMFORT scale measuring sedation was studied in 3 studies [14,15,17]. These studies report a Cronbach’s alpha between 0.76 and 0.80. The internal consistency is adequate for different study populations: (non-)ventilated patients on a PICU and ventilated neonates on a NICU. The internal consistency of the (modified) COMFORT scale measuring pain was studied in 9
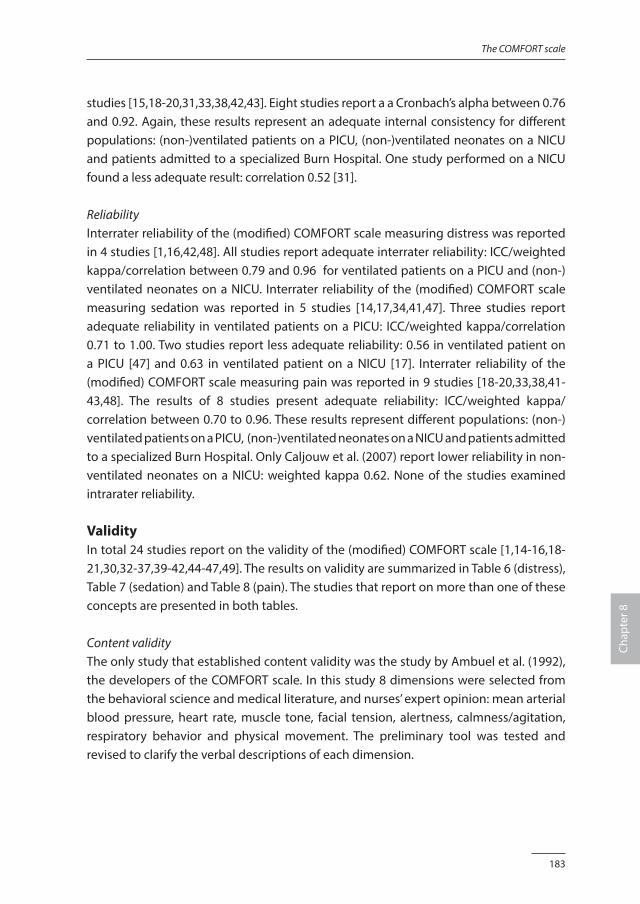
183
The COMFORT scale
Chap
ter 8
studies [15,18-20,31,33,38,42,43]. Eight studies report a a Cronbach’s alpha between 0.76 and 0.92. Again, these results represent an adequate internal consistency for different populations: (non-)ventilated patients on a PICU, (non-)ventilated neonates on a NICU and patients admitted to a specialized Burn Hospital. One study performed on a NICU found a less adequate result: correlation 0.52 [31].
ReliabilityInterrater reliability of the (modified) COMFORT scale measuring distress was reported in 4 studies [1,16,42,48]. All studies report adequate interrater reliability: ICC/weighted kappa/correlation between 0.79 and 0.96 for ventilated patients on a PICU and (non-)ventilated neonates on a NICU. Interrater reliability of the (modified) COMFORT scale measuring sedation was reported in 5 studies [14,17,34,41,47]. Three studies report adequate reliability in ventilated patients on a PICU: ICC/weighted kappa/correlation 0.71 to 1.00. Two studies report less adequate reliability: 0.56 in ventilated patient on a PICU [47] and 0.63 in ventilated patient on a NICU [17]. Interrater reliability of the (modified) COMFORT scale measuring pain was reported in 9 studies [18-20,33,38,41-43,48]. The results of 8 studies present adequate reliability: ICC/weighted kappa/correlation between 0.70 to 0.96. These results represent different populations: (non-)ventilated patients on a PICU, (non-)ventilated neonates on a NICU and patients admitted to a specialized Burn Hospital. Only Caljouw et al. (2007) report lower reliability in non-ventilated neonates on a NICU: weighted kappa 0.62. None of the studies examined intrarater reliability.
Validity In total 24 studies report on the validity of the (modified) COMFORT scale [1,14-16,18-21,30,32-37,39-42,44-47,49]. The results on validity are summarized in Table 6 (distress), Table 7 (sedation) and Table 8 (pain). The studies that report on more than one of these concepts are presented in both tables.
Content validityThe only study that established content validity was the study by Ambuel et al. (1992), the developers of the COMFORT scale. In this study 8 dimensions were selected from the behavioral science and medical literature, and nurses’ expert opinion: mean arterial blood pressure, heart rate, muscle tone, facial tension, alertness, calmness/agitation, respiratory behavior and physical movement. The preliminary tool was tested and revised to clarify the verbal descriptions of each dimension.
184
Chapter 8
Table 6. The construct validity of the included studies on distress
Author, year Comparison Results
Ambuel et al., 1992 COMFORT with VAS-obs Correlation coefficient 0.75
Gjerstad et al., 2008 COMFORT-B with skin conductance
Regression analysis before and during suctioning: R2 = 0.61, correlation coefficient 0.78during and after suctioning: R2 = 0.46, correlation coefficient 0.68
Van Dijk et al., 2009 COMFORTneo with NRS-obs Correlation coefficient: - NRS-obs 0.83 - mean NRS-obs 0.75 Cut off points COMFORTneo 14: - sensitivity 0.81- specificity 0.90
Wielenga et al., 2004 COMFORT with expert opinion COMFORT with expert opinionCorrelation coefficient 0.84 Cut off point 20: - sensitivity 1.00- specificity 0.77- AUC 0.95
AUC: Area Under the Curve, NRS-obs: Numeric Rating Scale observers, VAS-obs: Visual Analogue Scale observer.
Table 7. The construct validity of the included studies on sedation
Author, year Comparison Results
Brunow de Calvalho et al., 1999 COMFORT with Hartwig Kappa 0.35
Courtman et al., 2003 COMFORT with BIS Overall:Correlation coefficient 0.50, R2 = 0.25
Neurological diagnosis:Correlation coefficient 0.26, R2 = 0.06
Crain et al., 2002 COMFORT with BIS Individual measurements:Correlation coefficient 0.51, R2 = 0.26,
Categorized measurements: Correlation coefficient 0.94, R2 = 0.89,
Da Costa Silva et al., 2013 COMFORT-B with BIS Correlation coefficient (four raters) 0.42 to 0.52
Ista et al., 2005 COMFORT with NISS Differences COMFORT scores with the NISS categoriesKruskal Wallis p < 0.01
Johansson and Kokinsky, 2009 COMFORT with NISS Correlation coefficient 0.57
Lamas et al., 2008 COMFORT with BISCOMFORT with AEP COMFORT with Ramsay scale
Correlation coefficient- COMFORT with BIS 0.48 - COMFORT with AEP 0.53 - COMFORT with Ramsay scale 0.73
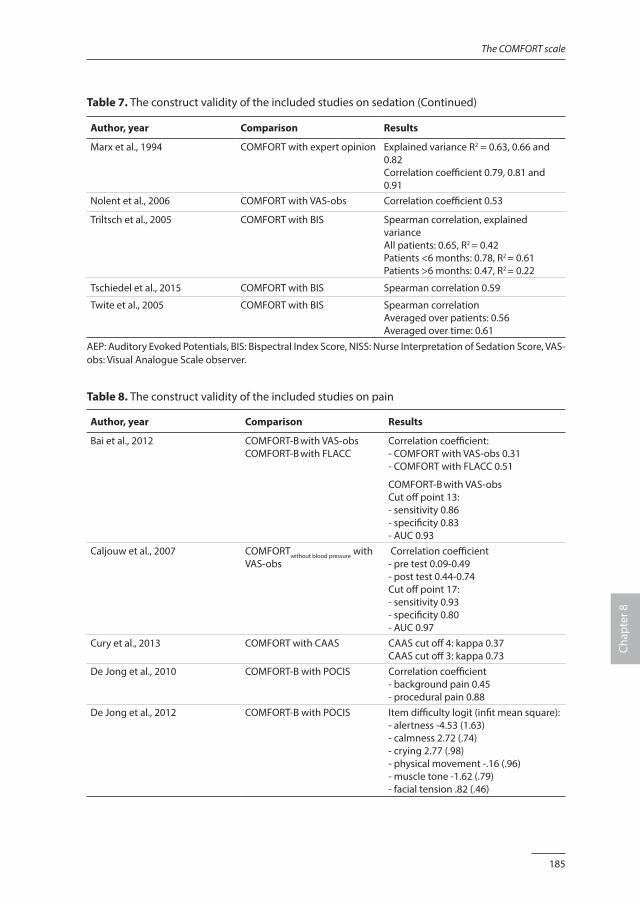
185
The COMFORT scale
Chap
ter 8
Table 7. The construct validity of the included studies on sedation (Continued)
Author, year Comparison Results
Marx et al., 1994 COMFORT with expert opinion Explained variance R2 = 0.63, 0.66 and 0.82Correlation coefficient 0.79, 0.81 and 0.91
Nolent et al., 2006 COMFORT with VAS-obs Correlation coefficient 0.53
Triltsch et al., 2005 COMFORT with BIS Spearman correlation, explained varianceAll patients: 0.65, R2 = 0.42Patients <6 months: 0.78, R2 = 0.61Patients >6 months: 0.47, R2 = 0.22
Tschiedel et al., 2015 COMFORT with BIS Spearman correlation 0.59
Twite et al., 2005 COMFORT with BIS Spearman correlationAveraged over patients: 0.56 Averaged over time: 0.61
AEP: Auditory Evoked Potentials, BIS: Bispectral Index Score, NISS: Nurse Interpretation of Sedation Score, VAS-obs: Visual Analogue Scale observer.
Table 8. The construct validity of the included studies on pain
Author, year Comparison Results
Bai et al., 2012 COMFORT-B with VAS-obs COMFORT-B with FLACC
Correlation coefficient:- COMFORT with VAS-obs 0.31 - COMFORT with FLACC 0.51
COMFORT-B with VAS-obs Cut off point 13: - sensitivity 0.86- specificity 0.83- AUC 0.93
Caljouw et al., 2007 COMFORTwithout blood pressure with VAS-obs
Correlation coefficient - pre test 0.09-0.49 - post test 0.44-0.74 Cut off point 17: - sensitivity 0.93- specificity 0.80- AUC 0.97
Cury et al., 2013 COMFORT with CAAS CAAS cut off 4: kappa 0.37 CAAS cut off 3: kappa 0.73
De Jong et al., 2010 COMFORT-B with POCIS Correlation coefficient - background pain 0.45 - procedural pain 0.88
De Jong et al., 2012 COMFORT-B with POCIS Item difficulty logit (infit mean square): - alertness -4.53 (1.63)- calmness 2.72 (.74) - crying 2.77 (.98)- physical movement -.16 (.96) - muscle tone -1.62 (.79) - facial tension .82 (.46)
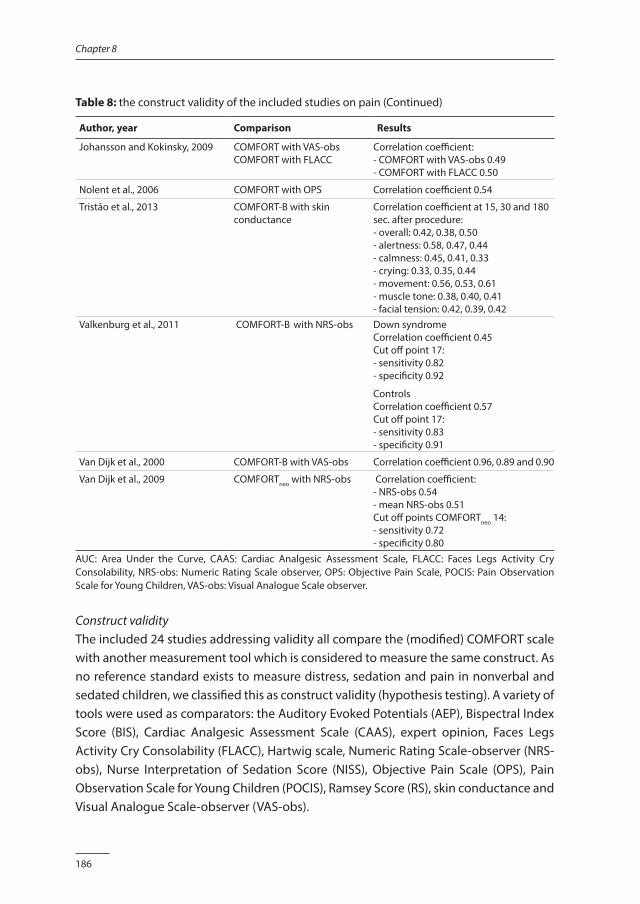
186
Chapter 8
Table 8: the construct validity of the included studies on pain (Continued)
Author, year Comparison Results
Johansson and Kokinsky, 2009 COMFORT with VAS-obs COMFORT with FLACC
Correlation coefficient:- COMFORT with VAS-obs 0.49 - COMFORT with FLACC 0.50
Nolent et al., 2006 COMFORT with OPS Correlation coefficient 0.54
Tristão et al., 2013 COMFORT-B with skin conductance
Correlation coefficient at 15, 30 and 180 sec. after procedure:- overall: 0.42, 0.38, 0.50- alertness: 0.58, 0.47, 0.44- calmness: 0.45, 0.41, 0.33- crying: 0.33, 0.35, 0.44- movement: 0.56, 0.53, 0.61- muscle tone: 0.38, 0.40, 0.41- facial tension: 0.42, 0.39, 0.42
Valkenburg et al., 2011 COMFORT-B with NRS-obs Down syndrome Correlation coefficient 0.45 Cut off point 17: - sensitivity 0.82 - specificity 0.92
ControlsCorrelation coefficient 0.57 Cut off point 17: - sensitivity 0.83 - specificity 0.91
Van Dijk et al., 2000 COMFORT-B with VAS-obs Correlation coefficient 0.96, 0.89 and 0.90
Van Dijk et al., 2009 COMFORTneo with NRS-obs Correlation coefficient: - NRS-obs 0.54- mean NRS-obs 0.51 Cut off points COMFORTneo 14: - sensitivity 0.72- specificity 0.80
AUC: Area Under the Curve, CAAS: Cardiac Analgesic Assessment Scale, FLACC: Faces Legs Activity Cry Consolability, NRS-obs: Numeric Rating Scale observer, OPS: Objective Pain Scale, POCIS: Pain Observation Scale for Young Children, VAS-obs: Visual Analogue Scale observer.
Construct validityThe included 24 studies addressing validity all compare the (modified) COMFORT scale with another measurement tool which is considered to measure the same construct. As no reference standard exists to measure distress, sedation and pain in nonverbal and sedated children, we classified this as construct validity (hypothesis testing). A variety of tools were used as comparators: the Auditory Evoked Potentials (AEP), Bispectral Index Score (BIS), Cardiac Analgesic Assessment Scale (CAAS), expert opinion, Faces Legs Activity Cry Consolability (FLACC), Hartwig scale, Numeric Rating Scale-observer (NRS-obs), Nurse Interpretation of Sedation Score (NISS), Objective Pain Scale (OPS), Pain Observation Scale for Young Children (POCIS), Ramsey Score (RS), skin conductance and Visual Analogue Scale-observer (VAS-obs).
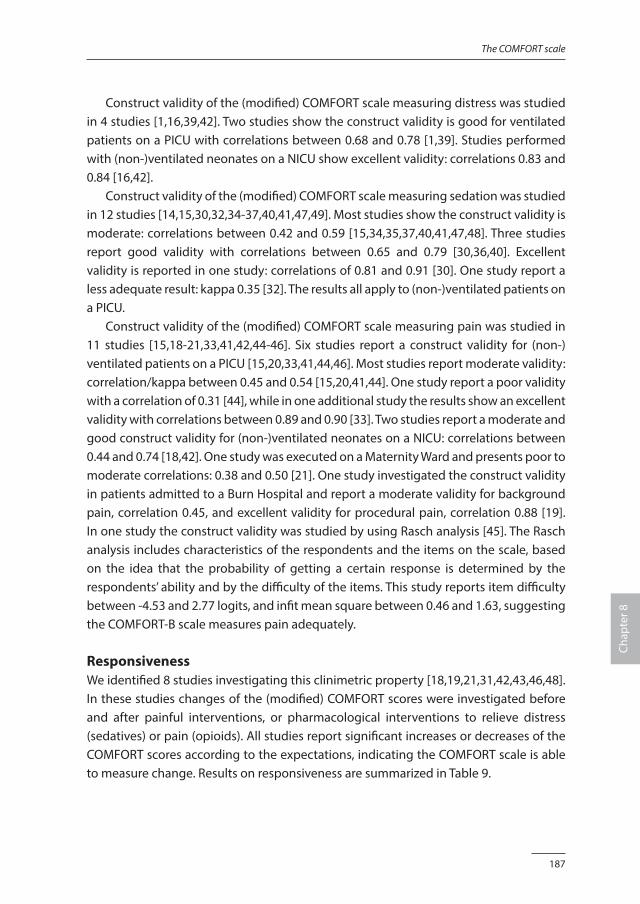
187
The COMFORT scale
Chap
ter 8
Construct validity of the (modified) COMFORT scale measuring distress was studied in 4 studies [1,16,39,42]. Two studies show the construct validity is good for ventilated patients on a PICU with correlations between 0.68 and 0.78 [1,39]. Studies performed with (non-)ventilated neonates on a NICU show excellent validity: correlations 0.83 and 0.84 [16,42]. Construct validity of the (modified) COMFORT scale measuring sedation was studied in 12 studies [14,15,30,32,34-37,40,41,47,49]. Most studies show the construct validity is moderate: correlations between 0.42 and 0.59 [15,34,35,37,40,41,47,48]. Three studies report good validity with correlations between 0.65 and 0.79 [30,36,40]. Excellent validity is reported in one study: correlations of 0.81 and 0.91 [30]. One study report a less adequate result: kappa 0.35 [32]. The results all apply to (non-)ventilated patients on a PICU. Construct validity of the (modified) COMFORT scale measuring pain was studied in 11 studies [15,18-21,33,41,42,44-46]. Six studies report a construct validity for (non-)ventilated patients on a PICU [15,20,33,41,44,46]. Most studies report moderate validity: correlation/kappa between 0.45 and 0.54 [15,20,41,44]. One study report a poor validity with a correlation of 0.31 [44], while in one additional study the results show an excellent validity with correlations between 0.89 and 0.90 [33]. Two studies report a moderate and good construct validity for (non-)ventilated neonates on a NICU: correlations between 0.44 and 0.74 [18,42]. One study was executed on a Maternity Ward and presents poor to moderate correlations: 0.38 and 0.50 [21]. One study investigated the construct validity in patients admitted to a Burn Hospital and report a moderate validity for background pain, correlation 0.45, and excellent validity for procedural pain, correlation 0.88 [19]. In one study the construct validity was studied by using Rasch analysis [45]. The Rasch analysis includes characteristics of the respondents and the items on the scale, based on the idea that the probability of getting a certain response is determined by the respondents’ ability and by the difficulty of the items. This study reports item difficulty between -4.53 and 2.77 logits, and infit mean square between 0.46 and 1.63, suggesting the COMFORT-B scale measures pain adequately.
ResponsivenessWe identified 8 studies investigating this clinimetric property [18,19,21,31,42,43,46,48]. In these studies changes of the (modified) COMFORT scores were investigated before and after painful interventions, or pharmacological interventions to relieve distress (sedatives) or pain (opioids). All studies report significant increases or decreases of the COMFORT scores according to the expectations, indicating the COMFORT scale is able to measure change. Results on responsiveness are summarized in Table 9.
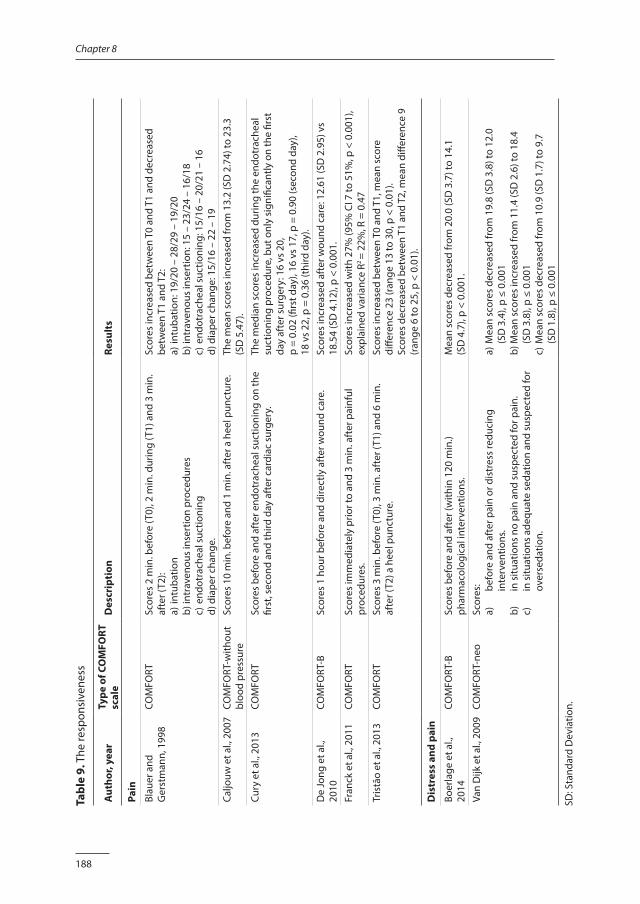
188
Chapter 8
Tabl
e 9.
The
resp
onsi
vene
ss
Aut
hor,
year
Type
of C
OM
FORT
sc
ale
Des
crip
tion
Resu
lts
Pain
Blau
er a
nd
Ger
stm
ann,
199
8CO
MFO
RTSc
ores
2 m
in. b
efor
e (T
0), 2
min
. dur
ing
(T1)
and
3 m
in.
afte
r (T2
): a)
intu
batio
n b)
intr
aven
ous
inse
rtio
n pr
oced
ures
c)
end
otra
chea
l suc
tioni
ng
d) d
iape
r cha
nge.
Scor
es in
crea
sed
betw
een
T0 a
nd T
1 an
d de
crea
sed
betw
een
T1 a
nd T
2:
a) in
tuba
tion:
19/
20 –
28/
29 –
19/
20b)
intr
aven
ous
inse
rtio
n: 1
5 –
23/2
4 –
16/1
8c)
end
otra
chea
l suc
tioni
ng: 1
5/16
– 2
0/21
– 1
6d)
dia
per c
hang
e: 1
5/16
– 2
2 –
19
Caljo
uw e
t al.,
200
7CO
MFO
RT-w
ithou
t bl
ood
pres
sure
Scor
es 1
0 m
in. b
efor
e an
d 1
min
. aft
er a
hee
l pun
ctur
e.Th
e m
ean
scor
es in
crea
sed
from
13.
2 (S
D 2
.74)
to 2
3.3
(SD
5.4
7).
Cury
et a
l., 2
013
COM
FORT
Scor
es b
efor
e an
d af
ter e
ndot
rach
eal s
uctio
ning
on
the
first
, sec
ond
and
third
day
aft
er c
ardi
ac s
urge
ry.
The
med
ian
scor
es in
crea
sed
durin
g th
e en
dotr
ache
al
suct
ioni
ng p
roce
dure
, but
onl
y si
gnifi
cant
ly o
n th
e fir
st
day
afte
r sur
gery
: 16
vs 2
0,
p =
0.02
(firs
t day
), 16
vs
17, p
= 0
.90
(sec
ond
day)
, 18
vs
22, p
= 0
.36
(thi
rd d
ay).
De
Jong
et a
l.,
2010
COM
FORT
-BSc
ores
1 h
our b
efor
e an
d di
rect
ly a
fter
wou
nd c
are.
Scor
es in
crea
sed
afte
r wou
nd c
are:
12.
61 (S
D 2
.95)
vs
18.5
4 (S
D 4
.12)
, p <
0.0
01.
Fran
ck e
t al.,
201
1CO
MFO
RTSc
ores
imm
edia
tely
prio
r to
and
3 m
in. a
fter
pai
nful
pr
oced
ures
.Sc
ores
incr
ease
d w
ith 2
7% (9
5% C
I 7 to
51%
, p <
0.0
01),
expl
aine
d va
rianc
e R2
= 22
%, R
= 0
.47
Tris
tão
et a
l., 2
013
COM
FORT
Scor
es 3
min
. bef
ore
(T0)
, 3 m
in. a
fter
(T1)
and
6 m
in.
afte
r (T2
) a h
eel p
unct
ure.
Sc
ores
incr
ease
d be
twee
n T0
and
T1,
mea
n sc
ore
diffe
renc
e 23
(ran
ge 1
3 to
30,
p <
0.0
1).
Scor
es d
ecre
ased
bet
wee
n T1
and
T2,
mea
n di
ffere
nce
9 (r
ange
6 to
25,
p <
0.0
1).
Dis
tres
s an
d pa
in
Boer
lage
et a
l.,
2014
COM
FORT
-BSc
ores
bef
ore
and
afte
r (w
ithin
120
min
.) ph
arm
acol
ogic
al in
terv
entio
ns.
Mea
n sc
ores
dec
reas
ed fr
om 2
0.0
(SD
3.7
) to
14.1
(S
D 4
.7),
p <
0.00
1.Va
n D
ijk e
t al.,
200
9CO
MFO
RT-n
eoSc
ores
:a)
be
fore
and
aft
er p
ain
or d
istr
ess
redu
cing
in
terv
entio
ns.
b)
in s
ituat
ions
no
pain
and
sus
pect
ed fo
r pai
n.c)
in
situ
atio
ns a
dequ
ate
seda
tion
and
susp
ecte
d fo
r ov
erse
datio
n.
a) M
ean
scor
es d
ecre
ased
from
19.
8 (S
D 3
.8) t
o 12
.0
(SD
3.4
), p
≤ 0.
001
b) M
ean
scor
es in
crea
sed
from
11.
4 (S
D 2
.6) t
o 18
.4
(SD
3.8
), p
≤ 0.
001
c) M
ean
scor
es d
ecre
ased
from
10.
9 (S
D 1
.7) t
o 9.
7 (S
D 1
.8),
p ≤
0.00
1
SD: S
tand
ard
Dev
iatio
n.
189
The COMFORT scale
Chap
ter 8
Quality assessmentThe results of the methodological quality assessments are shown in Table 10. The quality of the studies that report on internal consistency and interrater reliability varies between poor (n = 1), fair (n = 15), good (n = 11) and excellent (n = 1). The quality of the studies that report on construct validity varies between poor (n = 5), fair (n = 15) and good (n = 4). The studies that report on responsiveness are of fair (n = 2), good (n = 4) and excellent (n = 2) quality. We report concerns related to blinding, missing items and sample size.
BlindingBlinding is important wherever items are to be compared without influences from the preferences or expectations from researchers or participants. The absence of blinding usually leads to an overestimation of the results. Blinding was a major problem in 16 studies, because the researcher, nurse or physician who rated distress, sedation or pain with the instruments under investigation were unblinded or this item was unclear described [13-15,20,30-35,42-46,49].
Missing itemsA high number of missing items can introduce bias, resulting in an overestimation or underestimation in the results of the study. Therefore, the number of missing items, whether the missing items were at random and how they were handled should be described. In 21 studies the number of missing items was not mentioned, or not explained further [1,13,16-21,30-32,34,37-39,41,44-47,49].
Sample sizeAn adequate sample size is important to make inferences about a population from a sample. Small sample sizes generally lead to imprecise results. Following the criteria of Mokkink et al. (2013) we considered a sample size of less than 30 poor and a sample size over 100 excellent. In total 5 studies resulted in low scores on this item [16,17,32,39,46].
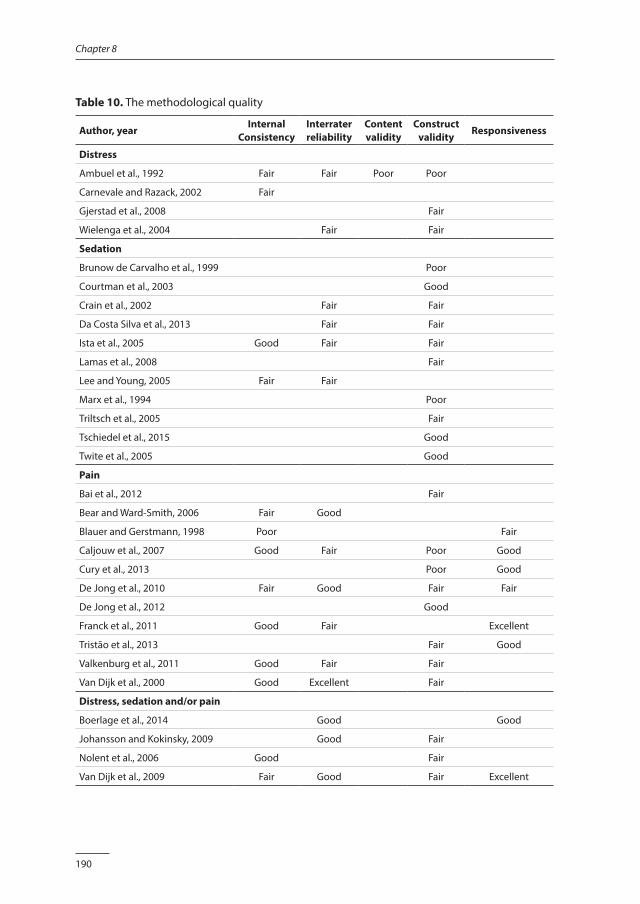
190
Chapter 8
Table 10. The methodological quality
Author, year Internal
ConsistencyInterrater reliability
Content validity
Construct validity
Responsiveness
Distress
Ambuel et al., 1992 Fair Fair Poor Poor
Carnevale and Razack, 2002 Fair
Gjerstad et al., 2008 Fair
Wielenga et al., 2004 Fair Fair
Sedation
Brunow de Carvalho et al., 1999 Poor
Courtman et al., 2003 Good
Crain et al., 2002 Fair Fair
Da Costa Silva et al., 2013 Fair Fair
Ista et al., 2005 Good Fair Fair
Lamas et al., 2008 Fair
Lee and Young, 2005 Fair Fair
Marx et al., 1994 Poor
Triltsch et al., 2005 Fair
Tschiedel et al., 2015 Good
Twite et al., 2005 Good
Pain
Bai et al., 2012 Fair
Bear and Ward-Smith, 2006 Fair Good
Blauer and Gerstmann, 1998 Poor Fair
Caljouw et al., 2007 Good Fair Poor Good
Cury et al., 2013 Poor Good
De Jong et al., 2010 Fair Good Fair Fair
De Jong et al., 2012 Good
Franck et al., 2011 Good Fair Excellent
Tristão et al., 2013 Fair Good
Valkenburg et al., 2011 Good Fair Fair
Van Dijk et al., 2000 Good Excellent Fair
Distress, sedation and/or pain
Boerlage et al., 2014 Good Good
Johansson and Kokinsky, 2009 Good Fair
Nolent et al., 2006 Good Fair
Van Dijk et al., 2009 Fair Good Fair Excellent
191
The COMFORT scale
Chap
ter 8
DISCUSSION
In this systematic review, we studied the clinimetric properties of the (modified) COMFORT scale as a tool to measure distress, sedation and pain in children from birth to 18 years old. We included 30 studies that report on the reliability, validity and/or responsiveness. These studies report overall an adequate reliability for distress, sedation and pain. Construct validity varies from good to excellent for distress, from moderate to excellent for sedation and from poor to excellent for pain. Finally, the COMFORT scale shows adequate responsiveness, regardless of the construct it is being claimed to measure. None of the included studies resulted in high quality scores on the clinimetric properties under consideration, according to the COSMIN criteria. Distress and pain are difficult to discriminate; these experiences may occur simultaneously, influence each other and present with comparable responses. Pain frequently results in distress, however distress may have causes other than pain. Despite their close association, distinguishing between the two is clinically important as they are treated differently. Unfortunately, up to date there is no tool (either physiological or behavioral) available that is able to differentiate between distress and pain. The COMFORT scale was originally developed as a continuous measure of distress in children aged from birth to 18 years receiving ventilation in an intensive care environment. Studies from later date confirmed the validity of the COMFORT scale for this originally intended population and clinical context. This systematic review also presents studies that investigated the validity of the (modified) COMFORT scale in the assessment of sedation. Although distress and sedation are not the same, it can be argued these concepts are in the same continuum. Most studies on sedation included ventilated children in an intensive care environment, as in the studies on distress. The studies on sedation report a construct validity between moderate and excellent, suggesting the COMFORT scale might be helpful in the assessment of sedation. Other studies investigating the clinimetric properties of the (modified) COMFORT scale focus on pain assessment. The COMFORT scale was not developed to measure pain, but it is obvious that distress and pain are related, which is reflected in the similarity of the content of pain instruments and the (modified) COMFORT scale. The studies that compare the (modified) COMFORT scale with a pain measurement tool are executed in patients with different health conditions and in different clinical contexts. For example, some studies on pain included ventilated patients, who were therefore also sedated. The variety in the results suggest the (modified) COMFORT is less capable in the assessment of pain, but the heterogeneity in patient population and circumstances hampers clear conclusions. There has been debate about the relevance of physiological parameters in assessing distress, sedation and pain. The original COMFORT scale combines behavioral and
192
Chapter 8
physiological items. Behavioral parameters (e.g. body movement, facial expression) rely on subjective observations and interpretations and are therefore questioned. Physiological parameters (e.g. heart rate, blood pressure) might be more objective, but are often influenced by the disease and medical interventions. Heart rate and blood pressure were removed from the original COMFORT, as they have been shown to have low item total correlations, indicating the internal consistency would improve if these items were excluded [13-15,33]. On contrary, other studies investigating the COMFORT scale show a combination of behavioral and physiological items is preferable, because both account for a significant proportion of the variance in scores [12,43]. Furthermore, the correlation between physiological and behavioral items improved with a higher intensity of pain, suggesting a combination of both dimensions is more useful to diagnose severe, but not moderate pain [12]. Up to date, the correlation between behavioral and physiological variables remain an imperfectly solved problem. Therefore, in daily practice a careful interpretation of all information on the patient’s situation is considered essential. For example, information on disease, treatment or previous experiences of the patient might be valuable for an accurate assessment of distress and pain [10,50]. In this review, the COSMIN checklist was used for the assessment of methodological quality [26]. This checklist became available for researchers in 2010. Most publications in this review are from earlier date, and were not guided by the suggestions and explanations the COSMIN offers. This might explain the limited studies with good or excellent quality scores in this review. A formal assessment to study the relationship between the quality rates and results does not exist and visual inspection did not reveal any relationship between the quality of the studies and the magnitude of the results. Therefore, we decided to present all selected studies in this review, also the ones with low quality scores. However, it must be kept in mind a low quality score represent a high risk of bias, meaning there might be an important flaw in the study that might have resulted in an underestimation or overestimation of the results. Unfortunately, it is impossible to estimate to what extent the risk of bias affect the results of a particular study. The included studies were clinically and methodologically heterogeneous. We found differences in the age of the included patients, reasons for admission and treatments. In addition, different primary endpoints were reported (distress, sedation and pain) and the clinimetric properties of the COMFORT scale were studied using different comparators, methodology and statistics. As a result of this heterogeneity, data synthesis was impossible. This review identified a considerable number of studies on the clinimetric properties of the (modified) COMFORT scale. Still, more research is needed. Firstly, additional
193
The COMFORT scale
Chap
ter 8
studies are warranted for specific patients, like children with neurological impairments and physically or mentally disabled children as they are excluded from studies so far. Also studies that include children older than 4 years are limited up to date. Secondly, studies that investigated the validity of the (modified) COMFORT scale show mixed results, especially in identifying pain. Therefore, more studies of high quality are needed to establish the validity of the COMFORT scale in measuring pain. Finally, more research on the responsiveness is needed to investigate the ability of the COMFORT to measure changes at the extremes of distress/sedation or pain.
CONCLUSION
The COMFORT scale shows overall an adequate reliability in providing information on distress, sedation and pain. Construct validity varies from good to excellent for distress, from moderate to excellent for sedation, and from poor to excellent for pain. The included studies were clinically and methodologically heterogeneous, hampering firm conclusions.
FundingNeither this research project nor the authors received any grant from any agency in the public, commercial or not-for-profit sector.
194
Chapter 8
REFERENCES1. Ambuel B, Hamlett KW, Marx CM, et al. Assessing distress in pediatric intensive care environments: The
COMFORT scale. J Pediatr Psychol 1992;17:95-109.
2. International Association for the Study of Pain (IASP). Available: www.iasp-pain.org, accessed December 2014.
3. Stoddard FJ, Ronfeldt H, Kagan J. et al. Young burned children: the course of acute stress and physiological and behavioural responses. Am J Psychiatry 2006;163:1084–1090.
4. Brummelte S, Grunau RE, Chau V, et al. Procedural pain and brain development in premature newborns. Ann Neurol 2012;71:385-396.
5. Taddio A, Katz J, Ilersich AL, et al. Effect of neonatal circumcision on pain response during subsequent routine vaccination. Lancet 1997;349:599-603.
6. Hermann C, Hohmeister J, Demirakca S, et al. Long-term alteration of pain sensitivity in school-aged children with early pain experiences. Pain 2006;125:278-285.
7. Franck LS, Bruce S. Putting pain assessment into practice: why is it so painful. Pain Res Manag 2009;14:13-20.
8. Johnston C, Barrington KJ, Taddio A, et al. Pain in Canadian NICUs: have we improved over the past 12 years? Clin J Pain 2011;27:225-232.
9. Vet NJ, Ista E, De Wildt SN, et al. Optimal sedation in paediatric intensive care patients: a systematic review. Intensive Care Med 2013;39:1524-1534.
10. von Baeyer CL, Spagrud LJ. Systematic review of observational (behavioral) measures of pain for children and adolescents aged 3 to 18 years. Pain 2007;127:140-150.
11. Dorfman TL, Schellenberg ES, Remple GR, et al. An evaluation of instruments for scoring physiological and behavioral cues of pain, non-pain related distress, and adequacy of analgesia and sedation in pediatric mechanically ventilated patients: a systematic review. Int J Nur Stud 2014;51:654-676.
12. van Dijk M, de Boer JB, Koot HM, et al. The association between physiological and behavioral pain measures in 0 to 3 year old infants after major surgery. J Pain Symptom Manage 2001;22:600-609.
13. Carnevale FA, Razack S. An item analysis of the COMFORT scale in a pediatric intensive care unit. Pediatr Crit Care Med 2002;3:177-180.
14. Ista E, Van Dijk M, Tibboel D, et al. Assessment of sedation levels in pediatric intensive care patients can be improved by using the COMFORT “behavior” scale. Pediatr Crit Care Med 2005;6:58-63.
15. Nolent P, Nanquette MC, Carbajal R, et al. Which sedation scale should be used in the paediatric intensive care unit? A comparative prospective study. Arch Pédiatr: Organe Officiel De La Sociéte Française De Pédiatrie 2006;13:32-37.
16. Wielenga JM, De Vos R, de Leeuw R, et al. COMFORT scale: A reliable and valid method to measure the amount of stress of ventilated preterm infants. Neonatal Netw 2004;23:39-44.
17. Lee WK, Young BW. Measuring the sedation level of mechanically ventilated infants by a modified COMFORT scale. HK J Paediatr (new Series) 2005;10:189-195.
18. Caljouw MA, Kloos MA, Olivier MY, et al. Measurement of pain in premature infants with a gestational age between 28 to 37 weeks: validation of the adapted COMFORT scale. J Neonatal Nurs 2007;13:13-18.
19. de Jong A, Baartmans M, Bremer M, et al. Reliability, validity and clinical utility of three types of pain behavioural observation scales for young children with burns aged 0-5 years. Pain 2010;150:561-567.
20. Valkenburg AJ, Boerlage AA, Ista E, et al. The COMFORT-behavior scale is useful to assess pain and distress in 0 to 3 year old children with down syndrome. Pain 2011;152:2059-2064.
21. Tristão RM, Garcia NV, Lacerda de Jesus JA, et al. Comfort behaviour scale and skin conductance activity: what are they really measuring? Acta Paediatrica 2013;102:e402-e406.
22. Preferred Reporting Items for Systematic reviews and Meta-Analysis (Prisma) recommendations for the reporting of the study. Available: www.prisma-statement.org, accessed July 2014.
195
The COMFORT scale
Chap
ter 8
23. Mokkink LB, Terwee CB, Knol DL, et al. The COSMIN checklist for evaluating the methodological quality of studies on measurement properties: A clarification of its content. BMC Med Res Methodol 2010;10:22-30.
24. Mokkink LB, Terwee CB, Patrick DL, et al. The COSMIN checklist for assessing the methodological quality of studies on measurement properties of health status measurement instruments: an international Delphi study. Qual Life Res 2010;19:539-549.
25. Mokkink LB, Terwee CB, Gibbons E, et al. Interrater agreement and reliability of the COSMIN (consensus-based standards for the selection of health status measurement instruments) checklist. BMC Med Res Methodol 2010;10:82-93.
26. Mokkink LB, Terwee CB, Patrick DL, et al. The COSMIN checklist manual. Available: www.cosmin.nl, accessed January 2013.
27. Terwee CB, Bot SD, De Boer MR, et al. Quality criteria were proposed for measurement properties of health status questionnaires. J Clin Epidemiol 2007;60:34-42.
28. Sackett D, Hayes R, Guyatt G, et al. Clinical epidemiology: a basic science for clinical medicine, Boston: Brown & Co, 1991.
29. Wright BD, Linacre JM. Reasonable mean-square fit values. Rasch Measurement Transactions 1994;8:370.
30. Marx CM, Smith PG, Lowrie LH, et al. Optimal sedation of mechanically ventilated pediatric critical care patients. Crit Care Med 1994;22:163-170.
31. Blauer T, Gerstmann D. A simultaneous comparison of three neonatal pain scales during common NICU procedures. Clin J Pain 1998;14:39-47.
32. Brunow de Carvalho W, Da Silva LP, Paulo CS, et al. Comparison between the COMFORT and Hartwig sedation scales in pediatric patients undergoing mechanical lung ventilation. São Paulo Med J 1999;117:192-196.
33. van Dijk M, De Boer JB, Koot HM, et al. The reliability and validity of the COMFORT scale as a postoperative pain instrument in 0 to 3-year-old infants. Pain 2000;84:367-377.
34. Crain N, Slonim A, Murray M, et al. Assessing sedation in the pediatric intensive care unit by using BIS and the COMFORT scale. Pediatr Crit Care Med 2002;3:11-14.
35. Courtman SP, Wardurgh A, Petros AJ. Comparison of the bispectral index monitor with the Comfort score in assessing level of sedation of critically ill children. Intensive Care Med 2003;29:2239-2246.
36. Triltsch AE, Nestmann G, Orawa H, et al. Bispectral index versus COMFORT score to determine the level of sedation in paediatric intensive care unit patients: a prospective study. Crit Care 2005;9:R9-R17.
37. Twite MD, Zuk J, Gralla J, et al. Correlation of the Bispectral Index Monitor with the COMFORT scale in pediatric intensive care unit. Pediatr Crit Care Med 2005;6:648-653.
38. Bear LA, Ward-Smith P. Interrater reliability of the COMFORT scale. Pediatr Nurs 2006;32:427-434.
39. Gjerstad AC, Wagner K, Henrichsen T, et al. Skin conductance versus the modified COMFORT sedation score as a measure of discomfort in artificially ventilated children. Paediatrics 2008;122:e848-853.
40. Lamas A, López-Herce J, Sancho L, et al. Assessing sedation in critically ill children by bispectral index, auditory-evoked potentials and clinical scales. Intensive Care Med 2008;34:2092-2099.
41. Johansson M, Kokinsky E. The COMFORT behavioural scale and the modified FLACC scale in paediatric intensive care. Nurs Crit Care 2009;14:122-130.
42. van Dijk M, Roofthooft DW. Anand KJ, et al. Taking up the challenge of measuring prolonged pain in (premature) neonates: The COMFORTneo scale seems promising. Clin J Pain 2009;25:607-616.
43. Franck LS, Ridout D, Howard R, et al. A comparison of pain measures in newborn infants after cardiac surgery. Pain 2011;152:1758-1765.
44. Bai J, Hsu L, Tang Y, et al. Validation of the COMFORT behavior scale and the FLACC scale for pain assessment in chinese children after cardiac surgery. Pain Manag Nurs 2012;13:18-26.
45. de Jong AE, Tuinebreijer WE, Bremer M, et al. Construct validity of two pain behaviour observation measurement instruments for young children with burns by rasch analysis. Pain 2012;153:2260-2266.
196
Chapter 8
46. Cury MR, Martinez FE, Carlotti AP. Pain assessment in neonates and infants in the post-operative period following cardiac surgery. Postgrad Med J 2013;89:63-67.
47. Da Costa Silva C, Osorio Alves MM, Dos Santos El Halal MG, et al. A comparison of gradual sedation levels using the Comfort-B scale and bispectral index in children on mechanical ventilation in the pediatric intensive care unit. Rev Bras Ter Intensiva 2013;25:306-311.
48. Boerlage AA, Ista E, Duivenvoorden HJ, et al. The COMFORT behaviour scale detects clinical meaningful effects of analgesics and sedative treatment. Eur J Pain 2014;19:473-479.
49. Tschiedel E, Müller O, Schara U, et al. Sedation monitoring during open muscle biopsy in children by COMFORT Score and Bispectral Index – a prospective analysis. Paediatric Anesthesia 2015;25:265-271.
50. Schiavenato M, Craigh KD. Pain assessment as a social transaction – beyond the “gold standard”. Clin J Pain 2010;26:667-676.
Chapter 9
Safety interventions, safety culture and priorities for the future in a pediatric hospital:
a 5-year cohort study
Jolanda MaaskantJoke Wielenga
Marjorie de NeefDiederik BosmanHester Vermeulen
Submitted.
198
Chapter 9
ABSTRACT
Introduction During the last decade, awareness has grown about the added value of safety culture to prevent unintentional harm to patients, but evidence on the effectiveness of interventions to improve safety culture is limited and not conclusive. The aim of this five-year study was twofold: to determine the effect of multi-faceted safety interventions on the patient safety culture at a Dutch pediatric university hospital and to establish priorities for future safety activities.
MethodsBetween 2009 and 2014 a two stages safety program was implemented. In the first-stage intervention, a ward-based patient safety program was initiated that focused on (a) incident reporting, (b) blame-free response to error and (c) collaboration in multidisciplinary safety teams. In the second-stage intervention, patient safety became a top strategic priority when the hospital started an accreditation process. During this period we studied the patient safety culture by means of the Hospital Survey on Patient Safety Culture (HSoPSC). All nurses, pediatricians and allied healthcare professionals, employed on four non-Intensive Care Units (non-ICUs) and two Intensive Care Units (ICUs), were invited to participate. Differences in mean scores between the time points were analyzed using regression techniques and multi-level modeling was performed to account for clustering of respondents’ scores within wards.
ResultsWe collected a total of 811 questionnaires in 2009, 2011 and 2013. On the non-ICUs six of the eleven dimensions of the HSoPSC improved. The greatest improvement was found after the first intervention period. The accreditation process in the second period did not lead to statistical significant positive changes to the safety culture. The two ICUs showed smaller changes in the HSoPSC scores, probably due their longer history in safety management. The dimensions “teamwork across hospital units”, “handovers and transitions” and “hospital management support for safety” were considered areas for future improvement.
ConclusionA multi-faceted safety intervention, including ward-based safety teams, an incident reporting system and a blame free environment, is associated with improvements on most patient safety dimensions, but the remaining dimensions are still a concern. Measurements over time reveal areas with potential for improvement, thereby contributing to prioritizing future safety interventions.
199
Safety culture
Chap
ter 9
INTRODUCTION
Despite substantial efforts to improve patient safety in hospitals, unintentional patient harm remains a concern and continues to threaten hospitalized patients [1]. Interventions such as guidelines development, adherence to care pathways and information technology have made important contributions to safer patient care, but appear not to be sufficient [2,3,4]. During the past decade awareness has grown about the added value of safety culture to prevent patient harm. Patient safety culture can be defined as “the values shared among organization members about what is important, their beliefs about how things operate in the organization, and the interaction of these with work unit and organizational structures and systems.”[5]. The safety culture influences the behavior of healthcare professionals [6]. Important elements of a safety culture are knowledge of high-risk activities, a blame-free environment in which learning from errors is encouraged, multidisciplinary teamwork, and management support for patient safety [7]. These elements are used in several recently developed, validated questionnaires measuring safety culture, which have been endorsed worldwide [8,9].A more positive patient safety culture is believed to be related to fewer adverse events [10]. Associations have been shown between safety culture and sepsis [11], pressure ulcers [12], patient falls [13] and postoperative complications [11,14]. Mazzocco et al. showed that poor teamwork resulted in almost five times more complications or deaths [15]. Based on these findings, attention for patient safety culture is stressed by several leading organizations like the Institute of Healthcare Improvement and the Joint Commission International [16,17]. Although the consensus is that safety culture is essential, evidence on the effectiveness of interventions to improve safety culture is limited and not conclusive [18,19,20]. This knowledge gap is problematic, as most interventions entail significant efforts and resources from hospitals. Therefore, studying the various dimensions of safety culture over the years is justified, as it enables hospitals to initiate tailored interventions and allocate resources accordingly. The aim of this five-year study was twofold: to determine the effect of multi-faceted safety interventions on the patient safety culture at a Dutch pediatric university hospital and to establish priorities for future safety activities.
METHODS
Setting and SampleThe study took place at Emma Children’s Hospital. This pediatric hospital is part of the Academic Medical Center (AMC) and affiliated with the University of Amsterdam, the Netherlands. Emma Children’s Hospital has 130 beds and provides both regular and highly-specialized intramural medical care. Children from birth to the age of 18 years
200
Chapter 9
are treated on four non-ICUs (three general pediatric wards and an oncology ward), and two ICUs (a pediatric intensive care unit (PICU) and a neonatology intensive care unit (NICU)). Being an academic centre, the multidisciplinary care is provided by qualified healthcare professionals, trainees and students. For this study all nurses, pediatricians and allied healthcare professionals (e.g. physical therapists and teaching staff), who were employed at Emma Children’s Hospital at the time of the study were invited to participate. The medical and nursing leaders gave approval for the survey. Because no patient involvement was required for the survey, approval of the Institutional Review Board was not necessary according to the Dutch Medical Ethics Law. All responses were analyzed and reported anonymously.
InterventionsIn 2010 (the first intervention period), a ward-based patient safety program was initiated that focused on (a) incident reporting, (b) blame-free response to error and (c) collaboration in multidisciplinary safety teams. The safety teams, which consisted of pediatricians and nurses, were made responsible for systematically collecting and reviewing the safety incidents. They were empowered for this task during a one-day training session at the start of the intervention, followed by monthly meetings to stimulate discussion, exchange improvement measures and solve shared safety problems. All healthcare professionals were strongly encouraged to report incidents by means of written information and interactive meetings, rapid feedback about the incidents and information about the impact on clinical practice. It was stressed that the purpose of incident reporting was not to assign blame, but to ultimately prevent unsafe situations. Reporting incidents was facilitated by a computerized system with the possibility of reporting anonymously. In 2012 (the second intervention period) patient safety became a top strategic priority when the AMC started the Joint Commission International (JCI) accreditation process. Hospital-wide improvement projects were initiated on aspects such as high-risk medication, hand hygiene, fall prevention and patient verification. Project leaders were assigned to support and educate the healthcare professionals on those subjects and an ongoing monitoring program was implemented based on the JCI tracer methodology. Additional interventions included promoting ward and hospital leadership, accountability and long-term solutions for safety problems were advocated. All wards from Emma Children’s Hospital participated in these hospital-wide initiatives.
Measurement toolWe used the Hospital Survey on Patient Safety Culture (HSoPSC), a questionnaire to quantify patient safety culture [21,22]. The HSoPSC has been validated in the Dutch situation, and shows acceptable reliability and good construct validity [23]. The HSoPSC
201
Safety culture
Chap
ter 9
covers 11 safety dimensions: (a) teamwork within hospital units, (b) communication openness, (c) feedback about and learning from error, (d) non-punitive response to error, (e) staffing, (f ) supervisor/manager expectations and actions, (g) frequency of events reporting, (h) overall perceptions of safety, (i) teamwork across hospital units, (j) handovers and transitions and (k) hospital management support for safety. The survey items use a five-point Likert scale ranging from 1 = “never/strongly disagree” to 5 = “always/strongly agree”. According to the recommendation of the HSoPSC, the results are expressed two ways. Firstly, the responses are summarized as mean scores on each dimension. Secondly, the percentages of the respondents that gave positive scores (4 or 5 on the 5-point Likert scale) on the 11 dimensions are determined. If 75% or more of the respondents scored the dimension positively, then it is considered to be an aspect with a strong positive safety culture. If less than 50% of the respondents scored the dimension positively, then improvement in the safety culture is needed. The patient safety dimensions are presented in Appendix A.
Data collectionWe collected data at three time points: 2009, 2011 and 2013. In 2009 and 2011 the HSoPSC was sent to the participants on paper accompanied by an explanatory letter. Completed questionnaires were collected in sealed boxes on the wards. In 2013 the HSoPSC was distributed digitally: the participants received the explanatory text and the link for the online questionnaire by email, using a commercially available survey tool (SurveyMonkey, Inc. Europe, Sarl, Luxembourg). We collected the questionnaires during four weeks. No incentives were offered, but we sent personalized reminders and asked senior staff to encourage their employees to fill out the questionnaire.
TimeframeThe ward-based patient safety program had a pilot period on the two pediatric ICUs, which started in 2007. So at the time of the first survey in 2009, the non-ICUs and ICUs had different starting points. In 2012, the JCI accreditation program became a priority for all wards in the hospital. An overview of the timeframe is shown in Figure 1.
AnalysisDescriptive statistics were used to summarize the characteristics of the respondents. Since the questionnaire contains both positively and negatively formulated items, the negative ones were first recoded to make sure that higher scores always indicated a more positive culture. Dimension scores were calculated by adding up all item scores per dimension and dividing this total by the number of items, which gives equal weight to each item in the composite dimension score. Differences in mean scores between the

202
Chapter 9
three time points were analyzed using regression techniques. The mean score for each dimension was adjusted for respondents’ characteristics and multi-level modeling was performed to account for clustering of respondents’ scores within wards. Because the surveys were completed anonymously, we could not match responses from the three periods at the individual level. Missing values on the separate items were replaced by the respondents’ mean scores calculated from the total dataset. Because of multiple testing, we considered a p value <0.005 as statistically significant [24]. All analyses were performed using SPSS software (PASW statistics version 20.0, IBM, Armonk, NY, USA).
2007 2008 2009 2010 2011 2012 2013 2014
S
urv
ey
3
S
urv
ey
2
S
urv
ey
1
Ward-basedpa2entsafetyprogram,PICUandNICU
Ward-basedpa2entsafetyprogram,non-ICUwards
Hospital-wideaccredita2onprogram
Figure 1. Timeframe of the two intervention periods and surveys
RESULTS
Setting and SampleIn 2009, 2011 and 2013 we collected 269, 232 and 310 surveys, representing response rates of 66%, 57% and 61% respectively. We checked the final datasets for missing data. In total 11 respondents were excluded from the analysis, because they had completed less than half of all questions (2009: 3, 2011: 2, 2013: 6). Other missing values were rare: 1.2% in 2009, 1.3% in 2011 and 1.6% in 2013. Most of the respondents (64%) were nursing staff, but the distribution of professions is a reflection of the total staff. Nearly all respondents (97%) had direct interaction or contact with patients in their daily work. The characteristics of the respondents are summarized in table 1.
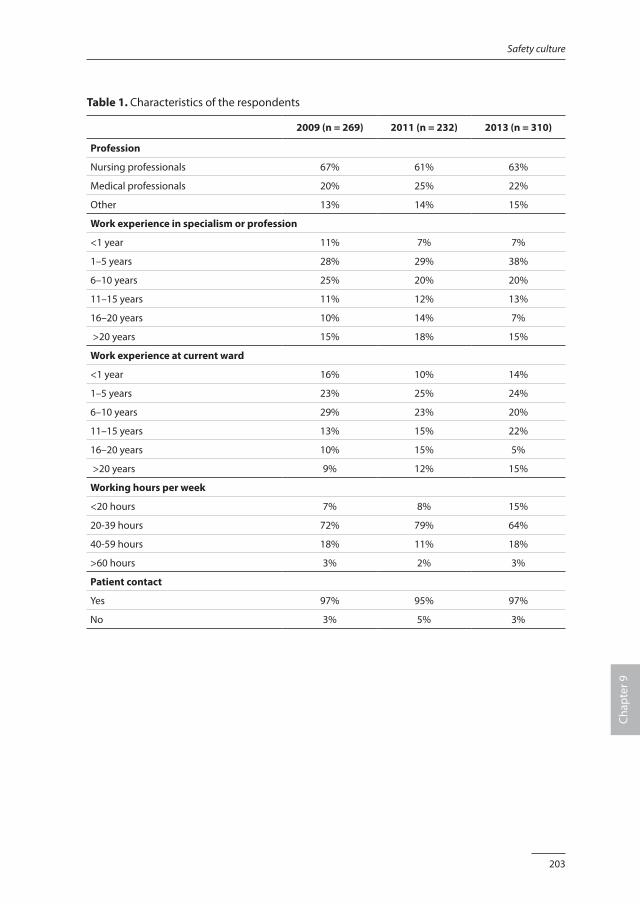
203
Safety culture
Chap
ter 9
Table 1. Characteristics of the respondents
2009 (n = 269) 2011 (n = 232) 2013 (n = 310)
Profession
Nursing professionals 67% 61% 63%
Medical professionals 20% 25% 22%
Other 13% 14% 15%
Work experience in specialism or profession
<1 year 11% 7% 7%
1–5 years 28% 29% 38%
6–10 years 25% 20% 20%
11–15 years 11% 12% 13%
16–20 years 10% 14% 7%
>20 years 15% 18% 15%
Work experience at current ward
<1 year 16% 10% 14%
1–5 years 23% 25% 24%
6–10 years 29% 23% 20%
11–15 years 13% 15% 22%
16–20 years 10% 15% 5%
>20 years 9% 12% 15%
Working hours per week
<20 hours 7% 8% 15%
20-39 hours 72% 79% 64%
40-59 hours 18% 11% 18%
>60 hours 3% 2% 3%
Patient contact
Yes 97% 95% 97%
No 3% 5% 3%
204
Chapter 9
Changes in safety culture dimensions On the non-ICUs, the scores on 8 of the 11 safety culture dimensions of the HSoPSC changed significantly during the five-year period of the study. The mean scores on the dimensions “feedback about and learning from error”, “non punitive response to error”, “staffing”, “frequency of event reporting”, “overall perception on safety” and “hospital management support for safety” increased between 2009 and 2013, indicating a more positive safety culture over these years. The mean scores on the dimensions “teamwork within hospital units” and “handovers and transitions” decreased in the same period, indicating the respondents perceived the safety culture less positively in 2013 compared to 2009. Most improvements were seen in the first period, between 2009 and 2011, when the ward-based patient safety program was initiated. On the ICUs, where the safety program had started earlier, the mean scores in 2009 were higher on all dimensions compared to the non-ICUs. However, between 2009 and 2013 the scores on the ICUs for the dimensions “expectations supervisor, management” and “hospital management support for safety” decreased. The results are presented in table 2 and 3.
Strong dimensions and dimensions with potential for improvement In 2013, the percentages of respondents who scored on the 11 dimensions positively were as follows. For the non-ICUs the dimensions “teamwork within hospital units”, “communication openness” and “non punitive response to error” scored ≥75%. For the PICU and NICU the dimensions “teamwork within hospital units” and “feedback about and learning from error” scored ≥75%. On all wards the dimensions “teamwork across hospital units” and “hospital management support for safety” were considered as having potential for improvement, i.e. <50% of the respondents scored these dimensions positively. Respondents at the non-ICUs scored “handovers and transitions” as a problematic dimension. The percentages positive responses in combination with the changes observed over the last 5 years were used to establish priorities for future safety interventions. The results are summarized in Table 4.
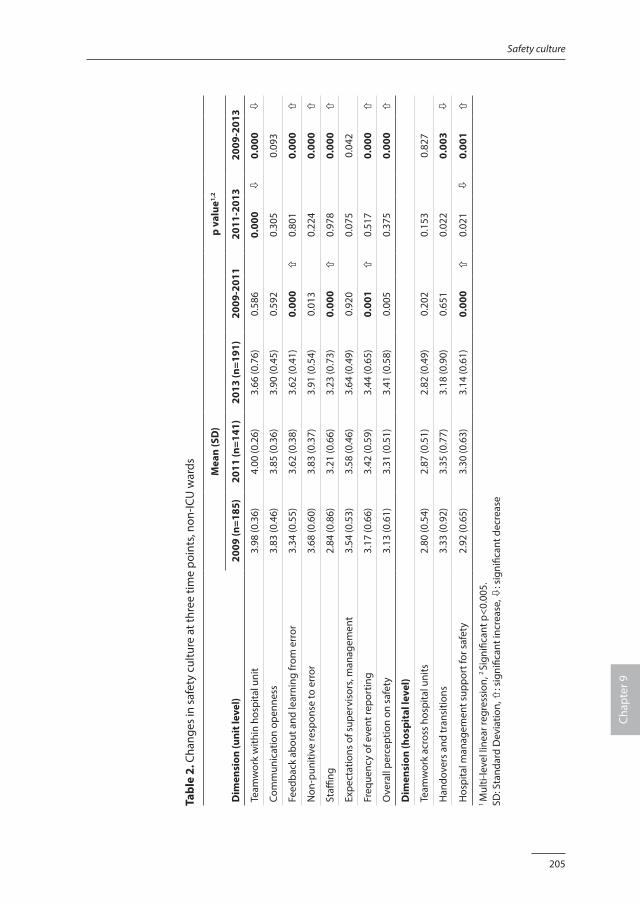
205
Safety culture
Chap
ter 9
Tabl
e 2.
Cha
nges
in s
afet
y cu
lture
at t
hree
tim
e po
ints
, non
-ICU
war
ds Mea
n (S
D)
p va
lue1,
2
Dim
ensi
on (u
nit l
evel
)20
09 (n
=185
)20
11 (n
=141
)20
13 (n
=191
)20
09-2
011
2011
-201
320
09-2
013
Team
wor
k w
ithin
hos
pita
l uni
t3.
98 (0
.36)
4.00
(0.2
6)3.
66 (0
.76)
0.58
60.
000
ò0.
000
ò
Com
mun
icat
ion
open
ness
3.83
(0.4
6)3.
85 (0
.36)
3.90
(0.4
5)0.
592
0.30
50.
093
Feed
back
abo
ut a
nd le
arni
ng fr
om e
rror
3.34
(0.5
5)3.
62 (0
.38)
3.62
(0.4
1)0.
000
ñ0.
801
0.00
0ñ
Non
-pun
itive
resp
onse
to e
rror
3.68
(0.6
0)3.
83 (0
.37)
3.91
(0.5
4)0.
013
0.22
40.
000
ñ
Staffi
ng2.
84 (0
.86)
3.21
(0.6
6)3.
23 (0
.73)
0.00
0ñ
0.97
80.
000
ñ
Expe
ctat
ions
of s
uper
viso
rs, m
anag
emen
t3.
54 (0
.53)
3.58
(0.4
6)3.
64 (0
.49)
0.92
00.
075
0.04
2
Freq
uenc
y of
eve
nt re
port
ing
3.17
(0.6
6)3.
42 (0
.59)
3.44
(0.6
5)0.
001
ñ0.
517
0.00
0ñ
Ove
rall
perc
eptio
n on
saf
ety
3.13
(0.6
1)3.
31 (0
.51)
3.41
(0.5
8)0.
005
0.37
50.
000
ñ
Dim
ensi
on (h
ospi
tal l
evel
)
Team
wor
k ac
ross
hos
pita
l uni
ts2.
80 (0
.54)
2.87
(0.5
1)2.
82 (0
.49)
0.20
20.
153
0.82
7
Han
dove
rs a
nd tr
ansi
tions
3.33
(0.9
2)3.
35 (0
.77)
3.18
(0.9
0)0.
651
0.02
20.
003
ò
Hos
pita
l man
agem
ent s
uppo
rt fo
r saf
ety
2.92
(0.6
5)3.
30 (0
.63)
3.14
(0.6
1)0.
000
ñ0.
021
ò0.
001
ñ
1 M
ulti-
leve
l lin
ear r
egre
ssio
n, 2
Sign
ifica
nt p
<0.0
05.
SD: S
tand
ard
Dev
iatio
n, ñ
: sig
nific
ant i
ncre
ase,
ò: s
igni
fican
t dec
reas
e
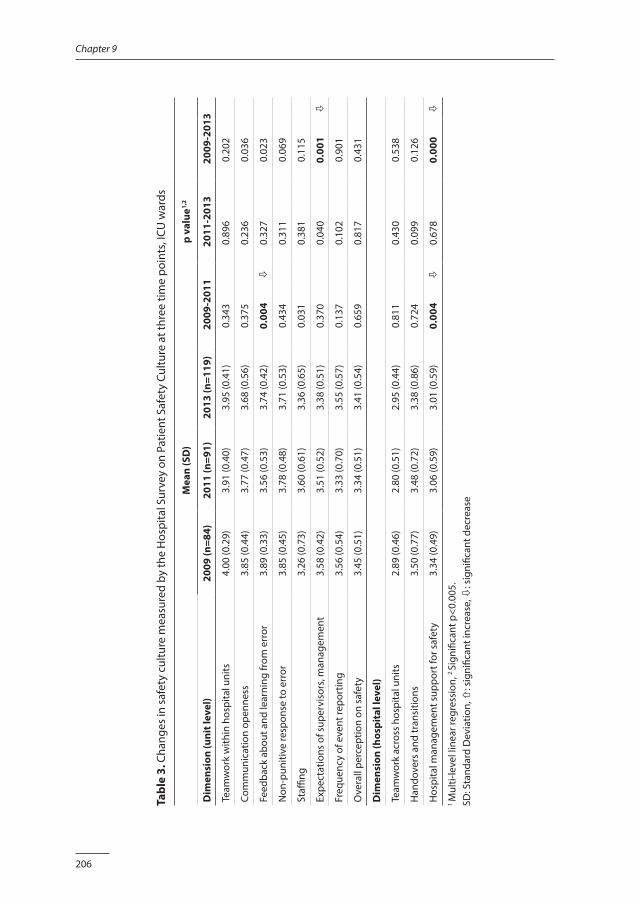
206
Chapter 9
Tabl
e 3.
Cha
nges
in s
afet
y cu
lture
mea
sure
d by
the
Hos
pita
l Sur
vey
on P
atie
nt S
afet
y Cu
lture
at t
hree
tim
e po
ints
, ICU
war
ds
Mea
n (S
D)
p va
lue1,
2
Dim
ensi
on (u
nit l
evel
)20
09 (n
=84)
2011
(n=9
1)20
13 (n
=119
)20
09-2
011
2011
-201
320
09-2
013
Team
wor
k w
ithin
hos
pita
l uni
ts4.
00 (0
.29)
3.91
(0.4
0)3.
95 (0
.41)
0.34
30.
896
0.20
2
Com
mun
icat
ion
open
ness
3.85
(0.4
4)3.
77 (0
.47)
3.68
(0.5
6)0.
375
0.23
60.
036
Feed
back
abo
ut a
nd le
arni
ng fr
om e
rror
3.89
(0.3
3)3.
56 (0
.53)
3.74
(0.4
2)0.
004
ò0.
327
0.02
3
Non
-pun
itive
resp
onse
to e
rror
3.85
(0.4
5)3.
78 (0
.48)
3.71
(0.5
3)0.
434
0.31
10.
069
Staffi
ng3.
26 (0
.73)
3.60
(0.6
1)3.
36 (0
.65)
0.03
10.
381
0.11
5
Expe
ctat
ions
of s
uper
viso
rs, m
anag
emen
t3.
58 (0
.42)
3.51
(0.5
2)3.
38 (0
.51)
0.37
00.
040
0.00
1ò
Freq
uenc
y of
eve
nt re
port
ing
3.56
(0.5
4)3.
33 (0
.70)
3.55
(0.5
7)0.
137
0.10
20.
901
Ove
rall
perc
eptio
n on
saf
ety
3.45
(0.5
1)3.
34 (0
.51)
3.41
(0.5
4)0.
659
0.81
70.
431
Dim
ensi
on (h
ospi
tal l
evel
)
Team
wor
k ac
ross
hos
pita
l uni
ts2.
89 (0
.46)
2.80
(0.5
1)2.
95 (0
.44)
0.81
10.
430
0.53
8
Han
dove
rs a
nd tr
ansi
tions
3.50
(0.7
7)3.
48 (0
.72)
3.38
(0.8
6)0.
724
0.09
90.
126
Hos
pita
l man
agem
ent s
uppo
rt fo
r saf
ety
3.34
(0.4
9)3.
06 (0
.59)
3.01
(0.5
9)0.
004
ò0.
678
0.00
0ò
1 M
ulti-
leve
l lin
ear r
egre
ssio
n, 2
Sign
ifica
nt p
<0.0
05.
SD: S
tand
ard
Dev
iatio
n, ñ
: sig
nific
ant i
ncre
ase,
ò: s
igni
fican
t dec
reas
e
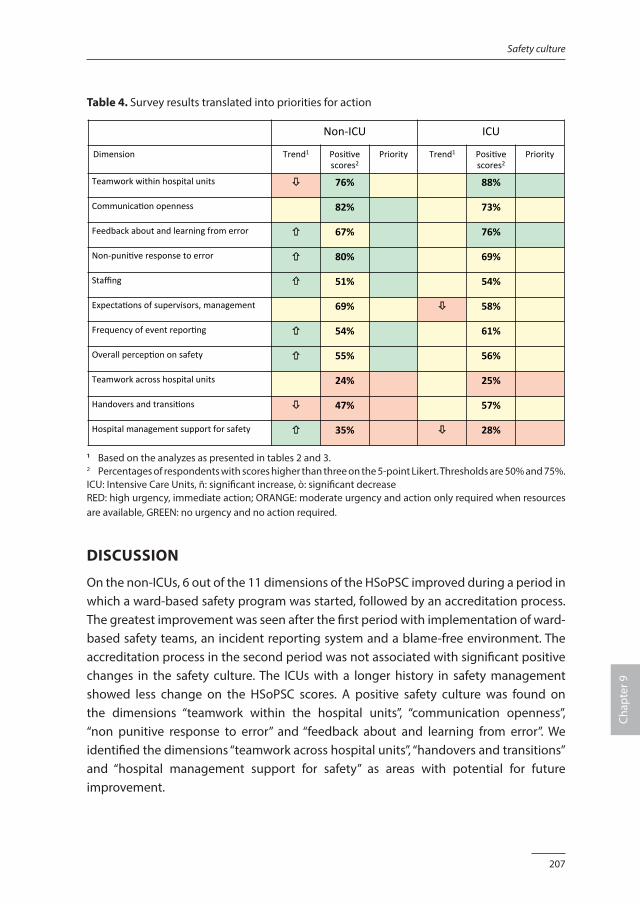
207
Safety culture
Chap
ter 9
Table 4. Survey results translated into priorities for action
Non-ICU ICU
Dimension Trend1 Posi3vescores2
Priority Trend1
Posi3vescores2
Priority
Teamworkwithinhospitalunits ! 76% 88%
Communica3onopenness 82% 73%
Feedbackaboutandlearningfromerror " 67% 76%
Non-puni3veresponsetoerror " 80% 69%
Staffing " 51% 54%
Expecta3onsofsupervisors,management 69% ! 58%
Frequencyofeventrepor3ng " 54% 61%
Overallpercep3ononsafety " 55% 56%
Teamworkacrosshospitalunits 24% 25%
Handoversandtransi3ons ! 47% 57%
Hospitalmanagementsupportforsafety " 35% ! 28%
1 Based on the analyzes as presented in tables 2 and 3.2 Percentages of respondents with scores higher than three on the 5-point Likert. Thresholds are 50% and 75%.ICU: Intensive Care Units, ñ: significant increase, ò: significant decreaseRED: high urgency, immediate action; ORANGE: moderate urgency and action only required when resources are available, GREEN: no urgency and no action required.
DISCUSSION
On the non-ICUs, 6 out of the 11 dimensions of the HSoPSC improved during a period in which a ward-based safety program was started, followed by an accreditation process. The greatest improvement was seen after the first period with implementation of ward-based safety teams, an incident reporting system and a blame-free environment. The accreditation process in the second period was not associated with significant positive changes in the safety culture. The ICUs with a longer history in safety management showed less change on the HSoPSC scores. A positive safety culture was found on the dimensions “teamwork within the hospital units”, “communication openness”, “non punitive response to error” and “feedback about and learning from error”. We identified the dimensions “teamwork across hospital units”, “handovers and transitions” and “hospital management support for safety” as areas with potential for future improvement.
208
Chapter 9
Although many publications have described patient safety culture, most are before-after studies [20] and only few have reported on multiple surveys to determine the changes in patient safety culture over time [25,26,27]. Brilli et al. described significant associations between a multi-faceted patient safety program, a reduction of preventable harm and an increase in culture scores during a three-year period [25]. Muething et al. reported the changes in safety culture over a five-year period. They found improvements on patient safety dimensions on both ward and hospital level [26]. Paine et al. reported the changes in safety culture over a three-year period. Again, significant improvements were measured on most items on both ward and hospital level [27]. The trend in our results is less consistent. This might be explained by the differences in timeframes and interventions. In the first period, we started with a patient safety program that focused on ward-based interventions. In the second period, hospital-wide initiatives became apparent priorities as part of the JCI accreditation process. Despite the fact that commitment of ward and hospital leaders was also part of this process, our results did not show an improvement on the management dimensions. Culture change takes time, so the effect of these latter interventions might not have been apparent in the results from 2013. In addition, our findings showed differences between the ICUs and non-ICUs, with the PICU and NICU representing wards with a longer history of safety management. Our results showed that the healthcare professionals on those wards did not perceive a further improvement on the safety culture; on the contrary they reported a decrease on the two management dimensions. But it must be kept in mind that the baseline performance on the ICUs was already high, so there was less room for improvements. Our results showed the greatest improvements after the implementation of a ward-based patient safety program that focussed on (a) incident reporting, (b) blame-free response to error and (c) creating multidisciplinary safety teams. This supports the idea that creating a culture of safety requires the participation of all healthcare professionals, working together as a team with a shared commitment to improve patient safety [28,29,30]. An incident reporting system helps to identify problems in the delivery of healthcare and provide an opportunity for an organization to learn from errors. Essential is that healthcare professionals are assured that the primary goal of incident reporting is not to assign blame for errors, but to investigate and analyze why they have occurred and how best to prevent them in future. Involvement of all professionals in this process is an important way of gaining confidence in the process and reducing the fear of personal consequences as this is a common barrier to incident reporting [31,32]. Between 2012 and 2013 Emma Children’s Hospital, was highly focused on the JCI accreditation process. Despite the fact that patient safety is the key issue of the JCI
209
Safety culture
Chap
ter 9
standards and was stressed on all wards by the management, the changes in the safety culture scores appeared small. This could be explained by the timeframe as mentioned above, but the effect of an accreditation is also disputed. Accreditation systems are based on the assumption that externally promoted adherence to predefined standards will result in improvements in the quality of care. However, the evidence that underpins the benefits of accreditation systems on patient-relevant outcomes is mixed [33,34]. Based on the results of our study, future safety interventions should concentrate on the dimensions “teamwork across hospital units”, “handovers and transitions” and “hospital management support for safety”, as they were considered areas that need improvement in the hospital under study. Teamwork across wards can be combined with projects that aim to improve handovers and transitions. A comprehensive approach, with involvement of all healthcare professionals and with hospital management support might be needed to make improvements. The “leadership walk round” is an intervention to express management support for safety which has been shown to be effective [35]. During these rounds, the hospital management visits wards to observe and discuss patient safety problems, as well as to show their support to healthcare professionals. Although leadership walk rounds have been shown to improve safety culture, their effectiveness is very much dependent on the frequency and implementation. Especially in organizations with large numbers of professionals or a high turnover, there must be a high frequency, otherwise individual healthcare professionals may be rarely exposed to a walk round [35].
LimitationsWe acknowledge a number of limitations. Firstly, we explored the patient safety culture using a quantitative approach, resulting in group scores on predefined dimensions. Additional qualitative research, such as focus group discussions, interviews and observations might be valuable to gain more in-depth understanding of safety culture and culture change [36]. Secondly, although the response rate of the three survey rounds was satisfactory, not all health professionals returned the survey, so a selective response is a possibility. Thirdly, this study was performed in one pediatric hospital only. The results can be used to compare the safety culture between hospital units and identify areas for improvement. However, whether the data can actually be standardized to the point of being useful for external benchmarking is a point of ongoing discussion [37].
210
Chapter 9
CONCLUSION
A multi-faceted safety intervention, including ward-based safety teams, an incident reporting system and a blame-free environment, is associated with improvements on most patient safety dimensions, but other dimensions remain a concern. Measurements over time reveal areas with potential for improvement, thereby contributing to prioritizing future safety interventions.
AcknowledgmentsJan Binnekade advised on the analysis and his contribution is gratefully acknowledged.
FundingNeither this research project nor the authors received any grant from any agency in the public, commercial or not-for-profit sector.
211
Safety culture
Chap
ter 9
REFERENCES1. Landrigan CP, Parry GJ, Bones CB, et al. Temporal trends in rates of patient harm resulting from medical
care. N Engl J Med 2010;363:2124-2134.
2. Ou L, Chen J, Assareh H, et al. Trends and variations in the rates of hospital complications, failure-to-rescue and 30-day mortality in surgical patients in New South Wales, Australia, 2002-2009. PLoS One 2014;9:e96164.
3. Sunol R, Wagner C, Arah OA, et al. Evidence-based organization and patient safety strategies in European hospitals. Int J Qual Health Care 2014;26:47-55 (suppl. 1).
4. Wang Y, Eldridge N, Metersky ML, et al. National trends in patient safety for four common conditions, 2005-2011. N Engl J Med 2014;370:341-351.
5. Singer S, Lin S, Falwell A, et al. Relationship of safety climate and safety performance in hospitals. Health Serv Res 2009;44:399-421.
6. Cooper MD, Phillips RA. Exploratory analyzis of safety climate and safety behavior relationship. J Safety Res 2004;35:497-512.
7. Pizzi LT, Goldfarb NI, Nash DB. Promoting a culture of safety. In: Making Health Care Safer: A Critical Analyzis of Patient Safety Practices. Agency for Healthcare Research and Quality 2001, chapter 40:447-457.
8. Colla JB, Bracken AC, Kinney LM, et al. Measuring patient safety climate: a review of surveys. Qual Saf Health Care 2005;14:364-366.
9. Jackson J. Sarac C. Flin R. Hospital safety climate surveys: measurement issues. Curr Opin Crit Care 2010;16:632-638.
10. Dicuccio MH. The relationship between patient safety culture and patient outcomes: a systematic review. J Patient Saf 2015;11:135-142.
11. Mardon RE, Khanna K, Sorra J, et al. Exploring relationships between hospital patient safety culture and adverse events. J Patient Saf 2010;6:226-232.
12. Singer S, Lin S, Falwell A, et al. Relationship of safety climate and safety performance in hospitals. Health Serv Res 2009;44:399-421.
13. Brewer BB. Relationships among teams, culture, safety and cost outcomes. West J Nurs Res 2006;28:641-653.
14. Haynes AB, Weiser TG, Berry WR, et al. Changes in safety attitude and relationship to decreased postoperative morbidity and mortality following implementation of a checklist-based surgical safety intervention. BMJ Qual Saf 2011;20:102-107.
15. Mazzocco K, Petitti DB, Fong KT, et al. Surgical team behaviors and patient outcomes. Am J Surg 2009;197:678-685.
16. Institute of Medicine: Crossing the Quality Chasm: A New Health System for the 21st Century. Washington: Institute of Medicine, 2001.
17. Wong P, Helsinger D, Petry J. Providing the right infrastructure to lead the culture change for patient safety. Jt Comm J Qual Improv 2002;28:363-372.
18. Morello RT, Lowthian JA, Barker AL, et al. Strategies for improving patient safety culture in hospitals: a systematic review. BMJ Qual Saf 2013;22:11-18.
19. Parmelli E, Flodgren G, Schaafsma ME, et al. The effectiveness of strategies to change organizational culture to improve healthcare performance (review). Cochrane Database Syst Rev 2011, Issue 1. Art. No.: CD008315. DOI:10.1002/14651858.CD008315.pub2.
20. Weaver SJ, Lubomski LH, Wilson RF, et al. Promoting a culture of safety as a patient strategy: a systematic review. Ann Intern Med 2013;158:369-374.
21. Blegen MA, Gearhart S. AHRQ’s hospital survey on patient safety culture: Psychometric analyzis. J Patient Saf 2009;5:139-144.
212
Chapter 9
22. Sorra JS, Dyer N. Multilevel psychometric properties of the AHRQ Hospital Survey on Patient Safety Culture. BMC Health Serv Res 2010;10:199-212.
23. Smits M, Christiaans-Dingelhoff I, Wagner C, et al. The psychometric properties of the ‘Hospital Survey on Patient Safety Culture’ in Dutch hospitals. BMC Health Serv Res 2008;7:208-230.
24. Feise RJ. Do multiple outcome measures require p-value adjustment. BMC Med Res Methodol 2002;2:8-12.
25. Brilli RJ, McClead RE Jr, Crandall WV, et al. A comprehensive patient safety program can significantly reduce preventable harm, associated costs and hospital mortality. J Pediatr 2013;163:1638-1645.
26. Muething SE, Goudie A, Schoettker PJ, et al. Quality improvement initiative to reduce serious safety events and improve patient safety culture. Pediatrics 2012;130:e423-e431.
27. Paine LA, Rosenstein BJ, Sexton JB, et al. Assessing and improving safety culture throughout an academic medical centre: a prospective cohort study. Qual Saf Health Care 2010;19:547-554.
28. Clancy CM. TeamSTEPPS: Optimizing teamwork in the perioperative setting. AORN J 2007;86:18-22.
29. Clark PR. Teamwork: building healthier workplaces and providing safer patient care. Crit Care Nurs Q 2009;32:221-231.
30. Pronovost PJ, Freischlag JA. Improving teamwork to reduce surgical mortality. JAMA 2010;304:1721-1722.
31. Subhehar NV, Parry HA. Critical incident reporting in neonatal practice. Arch Dis Child Fetal Neonatal 2010;95:F378-382.
32. Evans S, Berry JG, Smith BJ, et al. Attitudes and barriers to incident reporting: a collaborative hospital study. Qual Saf Health Care 2006;15:39-43.
33. Flodgren G, Pomey MP, Taber SA, et al. Effectiveness of external inspection of compliance with standards in improving healthcare organization behaviour, healthcare professional behaviour or patient outcomes. Cochrane Database Syst Rev 2011, Issue 11. Art. No.: CD008992. DOI: 10.1002/14651858.CD008992.pub2.
34. Greenfield D, Pawsey M, Hinchcliff R, et al. The standard of healthcare accreditation standards: a review of empirical research underpinning their development and impact. BMC Health Serv Res 2012;12:329-343.
35. Thomas EJ, Sexton JB, Neilands TB, et al. The effect of executive walk rounds on nurse safety climate attitudes: a randomized trial of clinical units. BMC Health Serv Res 2005;5:28-37.
36. Reiman T, Pietikainen E, Oedewald P. Multilayered approach to patient safety culture. Qual Saf Health Care 2010;19:e20-e25.
37. Ettorchi-Tardy A, Levif M, Michel P. Benchmarking: a method for continuous quality improvement of health. Healthcare Policy 2012;7:e101-e119.
38. Agency for Healthcare Research and Quality: Hospital survey on Patient Safety Culture. Available: http://www.ahrq.gov/qual/patientsafetyculture/, accessed July 2015.
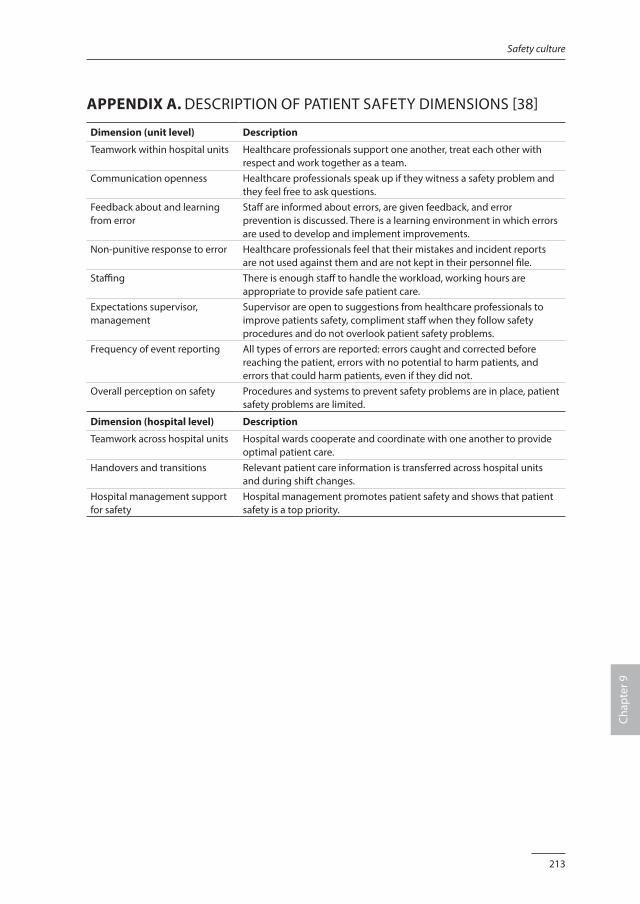
213
Safety culture
Chap
ter 9
APPENDIX A. DESCRIPTION OF PATIENT SAFETY DIMENSIONS [38]
Dimension (unit level) Description
Teamwork within hospital units Healthcare professionals support one another, treat each other with respect and work together as a team.
Communication openness Healthcare professionals speak up if they witness a safety problem and they feel free to ask questions.
Feedback about and learning from error
Staff are informed about errors, are given feedback, and error prevention is discussed. There is a learning environment in which errors are used to develop and implement improvements.
Non-punitive response to error Healthcare professionals feel that their mistakes and incident reports are not used against them and are not kept in their personnel file.
Staffing There is enough staff to handle the workload, working hours are appropriate to provide safe patient care.
Expectations supervisor, management
Supervisor are open to suggestions from healthcare professionals to improve patients safety, compliment staff when they follow safety procedures and do not overlook patient safety problems.
Frequency of event reporting All types of errors are reported: errors caught and corrected before reaching the patient, errors with no potential to harm patients, and errors that could harm patients, even if they did not.
Overall perception on safety Procedures and systems to prevent safety problems are in place, patient safety problems are limited.
Dimension (hospital level) Description
Teamwork across hospital units Hospital wards cooperate and coordinate with one another to provide optimal patient care.
Handovers and transitions Relevant patient care information is transferred across hospital units and during shift changes.
Hospital management support for safety
Hospital management promotes patient safety and shows that patient safety is a top priority.

Chapter 10
Summary and general discussion

217
Summary and general discussion
Chap
ter 1
0
SUMMARY
Medication safety in pediatric hospital care is not yet fully understood. With the research presented in this thesis, we aimed to contribute to the knowledge, ultimately to improve medication safety and prevent medication related harm in pediatric patients in hospital. Specific objectives were:1. to gain knowledge on the prevalence, nature and impact of medication errors, and
factors that contribute to medication errors;2. to attribute to the existing evidence on interventions to improve medication safety;3. to explore measurement tools to monitor medication safety.
In chapter 2, we describe a cross-sectional study that explored the prevalence and type of medication errors (MEs) and the severity of patient harm due to MEs in hospitalized children from birth to 18 years. We identified MEs by reviewing patients’ clinical records, making direct observations, monitoring pharmacy logs and reviewing voluntary incident reports. Subsequently, the MEs were classified according to type of error, type of medication and stage of the medication process. Pediatricians rated the severity of the observed harm. We collected data from 426 hospitalized children during 3 months. A total of 322 MEs were identified, of which 39 caused patient harm. Harmful events were mainly due to wrong time of administration (41%). Pediatricians rated the observed harm as minor in 77% and significant in 23% of the incidents. None of the harmful MEs resulted in permanent harm or was considered life threatening or fatal. Patients admitted for a surgical procedure were at higher risk for a harmful event compared to patients admitted for non-surgical reasons (adjusted OR 2.79, 95% CI 1.35-5.80). Non-opioid analgesics and anti-emetic drugs accounted for 67% of the harmful MEs. Harmful MEs occurred most frequently during medication prescription (28%) and administration (62%). We concluded that MEs increase the burden for hospitalized children, especially for surgical patients. Although the harm was considered minor in most cases, it still caused discomfort for the patients, and the high prevalence is a source of concern. In chapter 3 we present a qualitative study that contributes to a further understanding of the contributory factors that may lead to medication errors as experienced by the key professionals: doctors, nurses and pharmacists. We collected our data from focus group discussions. The transcripts of these discussions were coded by three researchers, who read the transcripts independently, keeping the research question in mind. After completing the initial coding, the researchers sorted the resulting codes into similar contextual categories. Finally, the categories were developed further into interpretative main themes. Four main themes emerged: “lack of coherent teamwork”, “suboptimal work process”, “inability to work safely” and “culture”. Culture appeared to be a central element, linking the three themes. The participants concluded that particularly
218
Chapter 10
organizational issues contribute to unsafe patient care. They expressed feelings of frustration, confusion and uncertainty, as well as resignation. Our results highlight the need for interventions on the organizational level, with a focus on interdisciplinary teamwork and re-design of the medication process. An essential aspect is to create an organizational culture that gives priority to medication safety and is supported by both healthcare management and healthcare professionals. In chapter 4 we describe an international modified Delphi study that aimed to generate a list of high-alert medications for a pediatric inpatient population from birth to 18 years. Based on the literature, a list of potential high-alert medications and medication classes was compiled and given to experts to rate. They were also asked to add other medications or medication classes to the list that they considered as high-alert. We validated the results with reports on medication incidents in children based on national data. The rating panel consisted of 34 experts from 13 countries. In total, 14 medications and 4 medication classes were included with the predefined level of consensus of 75%. The high-alert medications were: amiodarone, digoxin, dopamine, epinephrine, fentanyl, gentamycin, heparine, insulin, morphine, norepinephrine, phenytoin, potassium, propofol and tacrolimus. The high-alert medication classes included in the final list were: chemotherapeutic drugs, immunosuppressive medications, lipid/total parenteral nutrition and opioids. In chapter 5 we present a systematic review of the existing evidence to determine the effectiveness of interventions to reduce MEs in hospitalized children. We searched the following databases: CENTRAL, Cinahl, Dissertations and Theses Database, Embase, EPOC Group Specialized Register, Medline, Nursing & Allied Health, PsycInfo and Web of Science. Furthermore, we searched the Cochrane Database of Systematic Reviews and the DARE, the grey literature, as well as trial registries for ongoing studies. We also hand searched reference lists of all included studies and relevant systematic reviews. We included randomized controlled trials, controlled before-after studies and interrupted time series investigating interventions applied to hospitalized children (≤ 18 years) to improve medication safety. The outcome measures included MEs, (potential) patient harm, resource utilization and unintended consequences of the interventions. Two reviewers independently selected studies and assessed study quality using the EPOC checklist. The risk of bias was estimated using the GRADE approach. The selection process revealed seven studies describing five different interventions: clinical pharmacist (two studies), computerized physician order entry (two studies), barcode medication administration, a structured prescribing form, and a check & control checklist in combination with feedback. Most studies resulted in a reduction in MEs, but the benefits for the patients in terms of less harm were not conclusive. Clinical and methodological heterogeneity between the studies precluded meta-analyses.
219
Summary and general discussion
Chap
ter 1
0
Although all hospitalized pediatric patients are vulnerable, children admitted to the Pediatric Intensive Care Unit (PICU) are even more at risk to be exposed to harm. In chapter 6 we describe the results of an interrupted time series study that examined the effectiveness of a multi-faceted intervention by a clinical pharmacist, on MEs in critically ill children. We expanded the multidisciplinary team with a clinical pharmacist, who was available on the PICU for approximately 3 hours on workdays. The clinical pharmacist performed structured medication reviews and provided feedback to the prescribing pediatrician-intensivists and nurses during the ward rounds on the same day. Primary endpoint was the prevalence of MEs per 100 prescriptions. We explored the patients’ clinical records and the incident reporting system for MEs. If a ME was suspected, a pediatrician-intensivist and a clinical pharmacist determined causality and preventability. They classified the ME as harmful according to the National Coordinating Council for Medication Error Reporting and Prevention categories. We included 254 patients in the pre-intervention and 230 patients in de post-intervention period. We identified 153 MEs in the pre-intervention period, corresponding with 2.27 per 100 prescriptions, and 90 MEs in the post-intervention period, corresponding with 1.71 per 100 prescriptions. ARIMA analyses revealed a significant change in slopes between the pre-intervention and post-intervention period (β -0.21, 95% CI -0.30 to -0.04, p = 0.02). We did not observe a significant decrease immediately after the start of the intervention (β -0.61, 95% CI -1.31 to 0.08, p = 0.07). We concluded that the implementation of structured medication review, followed by feedback by a clinical pharmacist as part of the multidisciplinary team, resulted in a significant reduction of MEs in a tertiary PICU. To monitor the medication safety and patient harm, we need valid and reliable measurement instruments. It is suggested that a trigger tool may be an effective and time-saving strategy to measure MEs, but its measurement performance is unclear. Therefore, we studied the diagnostic accuracy of an existing pediatric medication-focused trigger tool in detecting harmful MEs. This study is described in chapter 7. Firstly, we established a multi-faceted method as a reference comparison. Secondly, we compared the pediatric medication-focused trigger tool with the multi-faceted method in a new cohort of patients. All patients admitted in February and March 2013 were screened using the trigger tool and the multi-faceted method to obtain full verification. Data collection was performed in separate teams to guarantee blinding of the test results. Review of the patients’ clinical records and the voluntary incident reports were most effective in detecting harmful MEs, so this approach was chosen as reference comparison. In the second part of the study 369 patients were included. The multi-faceted method identified 33 harmful MEs. In contrast, the trigger tool did not identify any harm. When the two symptoms “pain” and “nausea/vomiting” were added to the trigger tool, 19 harmful MEs were identified. This extended trigger tool
220
Chapter 10
resulted in a sensitivity of 21.2 and a positive predictive value of 36.8. The original pediatric medication-focused trigger tool yielded only false positive scores and left unsafe situations undiscovered. We concluded that a multi-faceted method remain the preferred method to detect harmful MEs. The COMFORT scale is a well-known measurement tool to assess distress, sedation and pain in nonverbal pediatric patients. A number of studies describe the COMFORT scale in children of different ages, with different health conditions and in different clinical contexts, but no formal assessment of the methodological quality has been undertaken. Therefore, we performed a systematic review to study the clinimetric properties of the original COMFORT scale or any of the modified versions: chapter 8. We searched CENTRAL, Cinahl, Embase, Medline, PsycInfo and Web of Science. The selection, data extraction and quality assessment were performed independently by 2 reviewers. Quality of the included studies was appraised using the COSMIN checklist. We found 30 studies that met the inclusion criteria. Most participants were ventilated children up to 4 years without neurological disorders. The results on internal consistency and interrater reliability showed values of >0.70 in most studies, indicating an adequate reliability. Construct validity resulted in correlations between 0.68 and 0.84 for distress, between 0.42 and 0.94 for sedation and between 0.31 and 0.96 for pain. The responsiveness of the (modified) COMFORT scale seems to be adequate. The quality of the included studies ranged from poor to excellent. The COMFORT scale shows overall an adequate reliability in providing information on distress, sedation and pain. Construct validity varies from good to excellent for distress, from moderate to excellent for sedation, and from poor to excellent for pain. The included studies were clinically and methodologically heterogeneous, hampering firm conclusions. In chapter 9 we describe a longitudinal study in which we investigated whether the safety culture changed during a five years period of active safety management in our pediatric hospital. During the last decade, awareness has grown about the added value of safety culture to increase the safety for patients, but evidence on the effectiveness of interventions to improve safety culture is limited and not conclusive. The aim of this five-year study was twofold: to determine the effect of multi-faceted safety interventions on the patient safety culture and to establish priorities for future safety activities. Between 2009 and 2014 a two stages safety program was implemented. In the first-stage intervention, a ward-based patient safety program was initiated that focused on (a) incident reporting, (b) blame-free response to error and (c) collaboration in multidisciplinary safety teams. In the second-stage intervention, patient safety became a top strategic priority when the hospital started the Joint Commission International accreditation process. During this period we studied the patient safety culture by means of the Hospital Survey on Patient Safety Culture (HSoPSC). All nurses, pediatricians and
221
Summary and general discussion
Chap
ter 1
0
allied healthcare professionals, employed on four non-Intensive Care Units (non-ICUs) and two Intensive Care Units (ICUs), were invited to participate. Differences in mean scores between the time points were analyzed using regression techniques and multi-level modeling was performed to account for clustering of respondents’ scores within wards. We collected a total of 811 questionnaires in 2009, 2011 and 2013. On the non-ICUs 6 of the 11 dimensions of the HSoPSC improved. The greatest improvement was found after the first intervention period. The accreditation process in the second period did not lead to statistical significant positive changes in the safety culture. The two ICUs showed smaller changes in the HSoPSC scores, probably due their longer history in safety management compared to the non-ICU wards. The dimensions “teamwork across hospital units”, “handovers and transitions” and “hospital management support for safety” were considered areas for future improvement. We concluded that multi-faceted safety interventions, including ward-based safety teams, an incident reporting system and a blame free environment, are associated with improvements on most patient safety dimensions.
GENERAL DISCUSSION
The field of medication safety has progressed in recent years. Nonetheless, the work must continue to increase medication safety in general and for children specifically.
Special consideration for pediatric patientsMedication safety differs in several ways for children compared with adults. It is important to understand these differences as they may affect the recommended safety interventions and the way in which healthcare is provided [1]. Child-specific characteristics play an important role: age-based variability and necessary adaptation to physiological development and growth [2-4]. These specific characteristics hamper standardization in all stages of the medication process, while standardization is believed to decrease the risk of error and patient harm [5,6]. In addition, the absence of medications in formulations and dosages appropriate for children makes it necessary to manipulate the medications before administration, which increases the complexity and the risk of error and patient harm. Finally, children cannot communicate (side) effects and are dependent on the observations of their caregivers. The latter is even more important as many medications are described off-label and the awareness on off-label prescribing in children is low [7-9]. Although there may be other factors that contribute to medication safety problems, such as equipment failures, workload, or confusing medication packaging and names, child-specific characteristics are believed to contribute up to half of the pediatric patient safety problems [4].
222
Chapter 10
All studies presented in this thesis are executed in a pediatric academic hospital. The constant need of dosing adjustments might explain the high prevalence of MEs related to dosages (chapter 2 and 6). Specific characteristics of pediatric care, like feeding and sleeping schedules, might explain the deviation in the time the medications are administered (chapter 2). Limited knowledge on medication specific in pediatric care was mentioned as a contributory factor to medication safety (chapter 3). Still, we did not identified specific pediatric medication safety issues as much as we expected beforehand. The participants in our studies were pediatricians and pediatric nurses, and all were familiar with pediatric daily practice; dealing with the specific pediatric characteristics of the medication process is “business as usual”. The interventions described in our systematic review were performed on pediatric wards, but none of them addressed interventions targeting the specific pediatric situations described above (chapter 5). Evidence-based interventions that increase medication safety must include specific pediatric characteristics. For example, technology such as CPOE and bar-code technology has proven to improve medication safety, but pediatric safety features incorporated in the CPOE are scarce. We strongly advise CPOE systems with decision support based on the best available pediatric pharmacological knowledge. Also specific features such as integrated dose checking and obligatory fields (weight, age) must be considered. Nurses must be supported in the administering process with bar-code technology, again adapted to the specific pediatric context. Calculation aids and alerts to prevent dosing errors are essential. Clinical pharmacists appear to be a key role professional in medication safety. We plead to acknowledge their clinical role, and also underpin the necessity for a pediatric trained clinical pharmacist. This specialized pediatric clinical pharmacist might play an important role in the prevention of MEs by clinical activities, but is also essential in spreading available knowledge on medication efficacy and safety for children.
Interdisciplinary teamworkInterdisciplinary teamwork is considered a pivotal condition for patient safety [10-12]. Recent evidence suggests that improvement in interdisciplinary teamwork results in a significant decrease in complications and mortality [13]. Effective interdisciplinary teamwork entails communication, coordination and cooperation amongst all disciplines and departments [10,12]. Communication includes sharing information that is relevant, accurate and timely. Coordination is related to logistics such as daily schedules and routines, and might be influenced by the geographical location of the various departments. Cooperation includes the acknowledgement of the expertise, tasks and responsibilities of other healthcare professionals, and a team orientation characterized
223
Summary and general discussion
Chap
ter 1
0
by “mutual trust, supportive behaviour and shared goals” [12]. Those elements for interdisciplinary teamwork are highly relevant for the medication process with doctors, nurses and pharmacists as the key role players. Unfortunately, healthcare professionals tend to disregard the capabilities of those not part of their own profession. Medication advice-seeking and information sharing across doctors, nurses and pharmacists are limited and they tend to work alongside one another rather than with each other [14-17]. The lack of interdisciplinary teamwork was identified as a main theme in our qualitative study; the healthcare professionals appeared to work mainly within their own discipline and on their own ward (chapter 3). Also, the survey on patient safety culture shows low scores on teamwork between hospital units (chapter 9). Moving forward towards improvements, we found two high quality studies that show the valuable contribution of a clinical pharmacist when part of a interdisciplinary team (chapter 5). These results were confirmed in our research at the PICU, where we expanded the multidisciplinary team with a clinical pharmacist, resulting in a significant reduction of MEs (chapter 6). Interdisciplinary teamwork must be encouraged, organized and facilitated in order to increase medication safety. In the medication safety process, the members of the interprofessional team are the doctor, the nurse and the pharmacist. Those professionals must meet not only to discuss the medication regimes of individual patients, but also to combine expertise in the development of protocols and policies. The working processes of the different professionals and departments must be synchronized to prevent unsafe and inefficient situations. Interprofessional education and training must be considered as this might increase mutual understanding and support. The challenge is to change a team of experts into an expert team.
Patient safety cultureMedication safety does not occur in isolation, but is affected by the context [18]. Nowadays, it is generally believed that an important element of this context is the patient safety culture. Patient safety culture can be defined as “the values shared among organization members about what is important, their beliefs about how things operate in the organization, and the interaction of these with work unit and organizational structures and systems, which together produce behavioral norms in the organization that promote safety” [19]. The idea is that a more positive culture is related to better clinical performance. Although the evidence for this relationship is limited [20], several studies show that hospitals that score higher on patient safety culture surveys tend to have fewer reported adverse events [19,21,22]. These results have initiated interventions to improve a safety culture [23-25]. The best evidence seems to include multi-faceted interventions that include team training, improvement of team communication and executive safety walk rounds [23,25].
224
Chapter 10
Several healthcare organizations take an example on the so called High Reliability Organizations (HROs) [26,27]. HROs are complex and dynamic organizations with a constant risk of catastrophic failure, e.g. aviation and nuclear power plants. For those organizations the prevention of errors is top priority. Therefore, strong leadership and robust process improvement are emphasized. But the most appealing feature of HROs is their safety culture. The HRO safety culture is reflected in five shared characteristics: preoccupation with failure, reluctance to simplification, sensitivity to operations, commitment to resilience and deferent to expertise. In practice this means that every employee is responsible for safety, incident reporting is rewarded, errors are thoroughly analyzed and used for shared learning, education and team training are daily practice, and the additional value of all employees is recognized and acknowledged [27,28]. Although healthcare organizations differ from other industries, they can be considered HRO and its principles might help hospitals to develop and sustain a comprehensive approach to patient safety [26,27,29]. Patient safety culture emerged as one of the main themes in relation to the contributory factors leading to MEs (chapter 3). This research shows that a shared attitude toward medication safety, the reaction towards unsafe behavior and the ability to learn from errors need further improvement. These results are complementary to the survey on patient safety culture (chapter 9). A positive patient safety culture must be aimed for in all healthcare organizations, as they are obliged to guarantee their patients safe. Therefore, strong leaders are essential. They must be unanimous and clear on the safety principles and desirable behavior, and act accordingly. A good start is to discussed safety issues and behavior openly, e.g. during executive safety rounds.
Future perspectivesThe aforementioned child-specific characteristics show the need for effective and safe medications for children. Still, it is estimated that over half of the children receives an unlicensed or off label drug prescription during hospitalization [8,9]. To ensure that children are treated with drugs that are fully tested, ongoing research is needed to determine the most appropriate formulations, dose, frequency, and routes of administration in children of different ages. Children are viewed as a vulnerable population that historically is underserved in research. An important reason is the ethical principle of “scientific necessity”: children should only be enrolled in clinical trials to obtain knowledge that attributes to the health and welfare of children [30]. As many medications work differently in children, clinical trials in pediatric populations are scientific necessary and should therefore be executed. Recent developments in the legislation (Better Pharmaceuticals for Children Act 2002 and Regulation on Medicinal Products for Paediatric Use 2007) and the start of research networks (European Network

225
Summary and general discussion
Chap
ter 1
0
of Paediatric Research and the Medicines for Children Research Network) are promising. The costs of research for the relatively small pediatric population may not hamper research programs as it is a moral duty to guarantee children are treated with drugs that are effective and safe. Furthermore, we must be prepared for the increased number of children with complex care needs, that often includes medication dependency [31]. In addition, patients spend less time in hospital and care is provided in home settings more frequently [32]. Consequently, the research agenda within the field of medication safety changes: medication reconciliation, family education, interventions to improve compliance and medication safety at home will become more and more important. Given the limited high quality evidence on interventions to improve medication safety in pediatric care, more methodologically sound research is obviously needed. Researchers should use the most robust design possible, e.g. cluster-randomized trials, stepped wedge trial designs, controlled before-after studies or interrupted time series [33]. There has been debate on the outcome measures, but nowadays it is recommended that evaluation of complex interventions include both process and patient relevant outcomes [34]. Future studies in the field of medication safety should include MEs, potentially harmful MEs and patient harm as main outcome measures. Efforts must be made by international safety institutes to ensure an uniform nomenclature to be used in medication safety research. A multi-faceted method is the preferred method to detect MEs, but is time-consuming [35,36]. New possibilities might arise from patient records, that become more and more electronically. By combining patient information it might become feasible to detect MEs and related harm in a more effective and efficient way. Reporting systems need further development from simple registrations to systems that support the healthcare professionals in decision making and error prevention. Future research is needed to discover the possibilities of electronically patient records in the identification of (harmful) MEs, and the effectiveness of real-time correction measures. And last but not least, we must pay attention to the implementation of the available evidence in clinical practice [37]. It must be recognized that the generalizability of improvement interventions to different settings is low [38]. Therefore, hospitals should analyze the specific context, choose implementation strategies tailored to this specific context and pay attention to barriers and facilitators to change [39]. Evaluation in a pilot seems sensible to prevent an organization to start with interventions that might not work well or introduce new safety problems [40]. As the key role players in the medication process are doctors, nurses and pharmacists, these disciplines should participate in implementation projects. Clearly, healthcare professionals must become familiar with implementation knowledge and competencies in order to integrate evidence and clinical practice successfully, ultimately to improve medication safety for children [41,42].
226
Chapter 10
CONCLUSION
Knowledge of medication safety for children has grown in recent years; the epidemiology of medication errors and contributory factors are better understood. Nonetheless, the work must continue as evidence-based interventions are still limited. Information technology and interdisciplinary teamwork look promising and these interventions should be implemented, taking into account the specific pediatric characteristics. Special attention should be paid to the safety culture within an organization. Comprehensive and sustained medication safety for children can only be achieved in an organization with shared values among all disciplines, and processes with a focus on patient safety.
227
Summary and general discussion
Chap
ter 1
0
REFERENCES1. Ruano M, Villamañán E, Pérez E, et al. New technologies as a strategy to decrease medication errors: how
do they affect adults and children differently? World J pediatr 2016;12:28-34.
2. Miller MR, Robinson KA, Lubomski LH, et al. Medication errors in pediatric care: a systematic review of epidemiology and an evaluation of evidence supporting reduction strategy recommendations. Qual Saf Health Care. 2007;16:116-126.
3. Wong ICK, Wong LYL, Cranswick NE. Minimising medication errors in children. Arch Dis Child 2009 94:161-164.
4. Woods DM, Holl JL, Shonkoff JP, et al. Child-specific risk factors and patient safety. J Patient Saf 2005;14:17-22.
5. Aseeri MA. The impact of a pediatric antibiotic standard dosing table on dosing errors. J Pediatri Pharmacol Ther 2013;18:220-226.
6. Rotter T, Kinsman L, James EL, et al. Clinical pathways: effects on professional practice, patient outcomes, length of stay and hospital costs. Cochrane Database of Systematic Reviews 2010, Issue 3. Art. No.: CD006632. DOI:10.1002/14651858.CD006632.pub2.
7. Balan S, Hassali MA, Mak VS. Awareness, knowledge and views of off-label prescrbing in children: a systematic review. Br J Clin Pharmcol 2015;80:1269-1280.
8. Conroy S, Choonara I, Impicciatore P, et al. Survey of unlicensed and off label drug use in paediatric wards in European countries. BMJ 2000;320:79-82.
9. Magalhães J, Rodriques AT, Roque F, et al. Use of off-label and unlicenced drugs in hospitalised paediatric patients: a systematic review. Eur J Clin Pharmacol 2015;71:1-13.
10. Taylor N, Clay-Williams R, Hogden E, et al. High performance hospitals: a qualitative systematic review of associated factors and practical strategies for improvement. BMC Health Services Research 2015;15:244-266.
11. Weaver S, Rosen M, Diaz Granados D, et al. Does teamwork improve performance in the operating room? A multilevel evaluation. Jt Comm J Qual Patient Saf 2010;36:133-142.
12. Weller J, Boyd M, Cumin D. Teams, tribes and patient safety: overcoming barriers to effective teamwork in healthcare. Postgrad Med J 2014;90:149-154.
13. Berry JC, Davis JT, Bartman T, et al. Improved safety culture and teamwork climate are associated with decreases in patient harm and hospital mortality across a hospital system. J Patient Saf 2016, January (epub. ahead of print).
14. Manias E. The concept of teamwork does not fully explain how interprofessional work occurs in intensive care. Austr Crit Care 2015;28:235-237.
15. Creswick N, Westbrook JI. Who do hospital physicians and nurses go to for advice about medications? A social network analysis and examination of prescribing error rates. J Patient Saf 2015;11:152-159.
16. Edmondson AC. Teaming: How organizations learn, innovate, and compete in the knowledge economy. First edition. Harvard Business School, Jossey Bass, United States of America, 2012.
17. Rixon S, Braaf S, Williams A, et al. Pharmacists’ interprofessional communication about medications in speciality hospital settings. Health Communications 2015;30:1065-1075.
18. Mark BA, Hughes LC, Belyea M, et al. Exploring organizational context and structure as predictors of medication errors and patient falls. J Patient Saf 2008;4:66–77.
19. Singer S, Lin S, Falwell A, et al. Relationship of safety climate and safety performance in hospitals. Health Serv Res 2009;44:399-421.
20. Scott I. What are the most effective strategies for improving quality and safety of health care? Intern Med J 2009;39:389-400.
21. Dicuccio MH. The relationship between patient safety culture and patient outcomes: a systematic review. J Patient Saf 2015;11:135-142.
228
Chapter 10
22. Mardon RE, Khanna K, Sorra J, et al. Exploring relationships between hospital patient safety culture and adverse events. J Patient Saf 2010;6:226-232.
23. Morello RT, Lowthian JA, Barker AL, et al. Strategies for improving patient safety culture in hospitals: a systematic review. BMJ Qual Saf 2013;22:11-18.
24. Parmelli E, Flodgren G, Schaafsma ME, et al. The effectiveness of strategies to change organizational culture to improve healthcare performance (review). Cochrane Database Syst Rev 2011, Issue 1. Art. No.: CD008315. DOI:10.1002/14651858.CD008315.pub2.
25. Weaver SJ, Lubomski LH, Wilson RF, et al. Promoting a culture of safety as a patient strategy: a systematic review. Ann Intern Med 2013;158:369-374.
26. Bagnara S, Parlangeli O, Tartaglia R. Are hospitals becoming high reliability organisations? Applied Ergonomics 2010;4:713-718.
27. Chassin MR, Loeb JM. High Reliability Health Care: getting there from here. The Milbank Quarterly 2013;91:459-490.
28. Sutcliffe KM. High Reliability Organizations (HROs). Best Practice and Research Clinical Anaesthesiology 2011;25:133-144.
29. Hines S, Luna K, Lofthus J, et al. Becoming a High Reliability Organization: Operational Advice for Hospital Leaders. AHRQ Publication No. 08-0022. Agency for Healthcare Research and Quality, available: www.ahrq.gov, accessed March 2016.
30. Canadian Paediatric Society. Ethical issues in health research in children. Paediatr Child Health 2008;13:707-712.
31. Berry JG, Hall M, Hall DE, et al. Inpatient growth and resource use in 28 children’s hospitals: a longitudinal, multi-institutional study. JAMA Pediatr 2013;167:170–177.
32. Eurostat statistics. Hospital dicharges and length of stay statistics. Available: http://ec.europa.eu/eurostat/statistics-explained, accessed April 2016.
33. Fan E, Laupacis A, Pronovost PJ, et al. How to use an article about quality improvement. JAMA 2010;304:2279-2287.
34. Brown C, Hofer T, Johal A, et al. An epistemiology of patient safety research: a framework for study design and interpretation. Part 3. End points and measurement. Qual Saf Health Care 2008;17:170-177.
35. Meyer-Massetti C, Cheng CM, Schwappach DL, et al. Systematic review of medication safety assessment methods. Am J Health Syst Pharm 2011;68:227-240.
36. Morimoto T, Gandhi TK, Seger AC, et al. Adverse drug events and medication errors: detection and classification methods. Qual Saf Health Care 2004;13:306-314.
37. Shojania KG. Conventional evaluations of improvement interventions: more trials or just more tribulations? BMJ Qual Saf 2013;22:881-884.
38. Seidlin HM, Stützle M, Hoppe-Tichy T, et al. Best practice strategies to safeguard drug prescribing and drug administration: an anthology of expert views and opinions. Int J Clin Pharm 2016, March (epub. ahead of print).
39. Grol R, Grimshaw J. From best evidence to best practice: effective implementation of change in patients’ care. Lancet 2003;362:1225-1230.
40. Brown C, Hofer T, Johal A, et al. An epistemiology of patient safety research: a framework for study design and interpretation. Part 1. conceptualising and developing interventions. Qual Saf Health Care 2008;17:158-162.
41. Glasziou P, Ogrinc G, Goodmans S. Can evidence-based medicine and clinical quality improvement learn from each other? BMJ Qual Saf 2011:20:i13-i17 (Suppl.).
42. Margolis P, Provost LP, Schoettker PJ, et al. Quality improvement, clinical research and quality improvement research-opportunities for integration. Pediatr Clin North Am 2009;56:831-841.
Nederlands samenvatting

231
Nederlandse samenvatting
Een belangrijk onderwerp in de ziekenhuiszorg aan kinderen is de medicatieveiligheid. Met de onderzoeken die we in dit proefschrift presenteren, beogen we een bijdrage te leveren aan de kennis, die nodig is om de medicatieveiligheid te verbeteren en vermijdbare schade te voorkomen. We hebben de volgende doelstellingen in ons onderzoek geoperationaliseerd:1. het verkrijgen van inzicht in de prevalentie, aard en gevolgen van medicatiefouten,
en factoren die bijdragen aan medicatiefouten;2. het leveren van een bijdrage aan de bestaande wetenschappelijke kennis over
interventies om de medicatieveiligheid te verbeteren;3. het onderzoeken van meetinstrumenten om medicatieveiligheid te monitoren.
In hoofdstuk 2 doen we verslag van een cross-sectionele studie die de prevalentie en de aard van de medicatiefouten onderzocht, alsmede de patiëntenschade als gevolg van deze medicatiefouten bij kinderen in de leeftijd van 0 tot 18 jaar tijdens een ziekenhuisopname. We hebben de medicatiefouten vastgesteld door een review van de patiëntendossiers, door directe observaties op de verpleegafdelingen, en met gegevens uit de apotheekregistratie en het incidentensysteem. Vervolgens zijn de medicatiefouten ingedeeld naar type fout, type geneesmiddel en de fase waarin de medicatiefout was opgetreden. Kinderartsen hebben de ernst van de patiëntenschade vastgesteld. We hebben gegevens van 426 kinderen verzameld. In totaal signaleerden we 322 medicatiefouten, waarvan 39 patiëntenschade hadden veroorzaakt. Deze schadelijke voorvallen waren in de meeste gevallen het gevolg van het toedienen op een verkeerd tijdstip (41%). Kinderartsen beoordeelden de geobserveerde schade als “minimaal” in 77% en “substantieel” in 23% van de incidenten. De schade resulteerde nooit in blijvend letsel of in een levensbedreigende situatie en was nooit fataal. Patiënten die opgenomen waren voor een chirurgische ingreep liepen een hoger risico op patiëntenschade als gevolg van een medicatiefout in vergelijking met patiënten die voor een niet-chirurgische reden in het ziekenhuis waren opgenomen (gecorrigeerde OR 2.79, 95% BI 1.35 tot 5.80, p = 0.006). Bij 67% van de medicatiefouten waren pijnstillers uit de niet-opiaten groep en anti-emetica betrokken. Schadelijke medicatiefouten traden het meest op bij het voorschrijven (28%) en toedienen (62%). We concludeerden dat medicatiefouten het risico op leed voor kinderen tijdens een ziekenhuisopname onnodig vergroot, vooral voor kinderen na een chirurgische ingreep. Hoewel de schade in de meeste gevallen niet ernstig bleek te zijn, heeft deze toch discomfort bij de patiënten veroorzaakt, en is de prevalentie verontrustend hoog. In hoofdstuk 3 beschrijven we een kwalitatief onderzoek dat, op basis van ervaringen van artsen, verpleegkundigen en apothekers, inzicht geeft in de factoren die bijdragen tot het ontstaan van medicatiefouten. We hebben deze meningen verkregen
232
Nederlandse samenvatting
tijdens focusgroepen. De transcripten van deze focusgroepen werden gecodeerd door drie onderzoekers, die onafhankelijk van elkaar vanuit de onderzoeksvraag de teksten bestudeerden. Deze initiële codering werd vervolgens vertaald naar overeenkomstige contextuele categorieën. In de laatste stap werden uit deze categorieën hoofdthema’s geformuleerd. Vier hoofdthema’s kwamen naar voren: “gebrek aan teamwork”, “suboptimale werkprocessen”, “de onmogelijkheid om veilig te werken” en “cultuur”. Cultuur bleek een centraal thema dat de andere drie onderwerpen verbindt. De deelnemers van de focusgroepen benadrukten dat vooral organisatiekenmerken bijdragen aan onveilige patiëntenzorg. Zij uitten gevoelens van frustratie, verwarring en onzekerheid, maar ook berusting. Deze resultaten wijzen op de noodzaak om verbeteringen door te voeren op organisatieniveau, met nadruk op interdisciplinaire samenwerking en een herinrichting van het medicatieproces. Essentieel is het bewerkstelligen van een organisatiecultuur waarin medicatieveiligheid prioriteit heeft en wordt ondersteund door het management en de zorgprofessionals. In hoofdstuk 4 beschrijven we een internationaal Delphi-onderzoek. Deze studie voerden we uit met het doel een lijst met hoog-risico geneesmiddelen samen te stellen voor kinderen van 0 tot 18 jaar, die zijn opgenomen in het ziekenhuis. Gebaseerd op bestaande literatuur werd een lijst met potentieel hoog-risico geneesmiddelen en geneesmiddelengroepen samengesteld. Deze lijst werd in meerdere rondes voorgelegd aan experts uit verschillende landen met de vraag een rangorde aan te brengen. Tevens vroegen we de experts hoog-risico geneesmiddelen of geneesmiddelengroepen toe te voegen aan de lijst, wanneer deze naar hun mening nog ontbraken. We hebben de resultaten van het Delphi-onderzoek gevalideerd met behulp van incidentmeldingen uit een nationale database. De groep deelnemers bestond uit 34 experts uit 13 landen. We hadden vooraf besloten dat een geneesmiddel op de definitieve lijst zou komen bij consensus van minimaal 75%. De experts bereikten dit niveau bij 14 geneesmiddelen en 4 geneesmiddelengroepen. De hoog-risico geneesmiddelen op de definitieve lijst zijn geworden: amiodaron, digoxine, dopamine, epinefrine, fentanyl, fenytoine, gentamycine, heparine, insuline, kalium, morfine, norepinefrine, propofol en tacrolimus. Tevens kwamen vier geneesmiddelengroepen op de definitieve lijst terecht: cytostatica, immunosuppressiva, totaal parenterale voeding en opiaten. In hoofdstuk 5 presenteren we een systematisch literatuuronderzoek, dat we uitvoerden om vast te stellen welke interventies effectief zijn om medicatiefouten bij kinderen tijdens een ziekenhuisopname te verminderen. We doorzochten de volgende databases: CENTRAL, Cinahl, Dissertations and Theses Database, Embase, EPOC Group Specialized Register, Medline, Nursing & Allied Health, PsycInfo, Web of Science, de Cochrane Database of Systematic Reviews en DARE. De referenties van de gevonden relevante studies en systematisch reviews werden nagekeken
233
Nederlandse samenvatting
voor eventuele aanvullende artikelen. In dit literatuuronderzoek includeerden we gerandomiseerde studies, gecontroleerde voor- en nametingen en interrupted time series, die interventies bestudeerden met het doel medicatieveiligheid te vergroten bij kinderen tijdens een ziekenhuisopname. De primaire uitkomstmaten waren medicatiefouten en (potentiële) patiëntenschade. Twee onderzoekers selecteerden de studies en beoordeelden de methodologische kwaliteit van de studies onafhankelijk van elkaar met behulp van de EPOC-checklist en GRADE. Het selectieproces resulteerde in zeven studies, die vijf verschillende interventies beschrijven: de klinische inzet van een apotheker (twee studies), het elektronisch medicatievoorschrijfsysteem (twee studies), toedieningsregistratie met behulp van barcodes, een gestructureerd voorschrijfformulier en een “check & correct checklist” in combinatie met feedback. De meeste studies resulteerden in een vermindering van het aantal medicatiefouten, maar het voordeel voor de patiënt in termen van verminderde schade was niet eenduidig. Klinische en methodologische heterogeniteit maakte meta-analyses onmogelijk. Kinderen in een ziekenhuis vormen een kwetsbare groep, en dat geldt zeker voor kinderen die op een intensive care worden opgenomen. Niet verwonderlijk is dan ook dat we juist op deze afdeling een interventiestudie uitvoerden. Deze beschrijven we in hoofdstuk 6. Het betreft een interrupted time series waarin we over een periode van 12 maanden keken of het aantal medicatiefouten daalde door de inzet van een apotheker, die op de afdeling een aantal verschillende, op medicatieveiligheid gerichte activiteiten uitvoerde. Deze apotheker was tijdens werkdagen drie uur aanwezig op de afdeling, en maakte deel uit van het multidisciplinaire behandelteam. Zijn werkzaamheden bestonden uit een gestructureerde evaluatie van de voorgeschreven geneesmiddelen en directe feedback aan de intensivisten en verpleegkundigen tijdens de visite. Primaire uitkomstmaat was het aantal medicatiefouten per 100 voorschriften. We hebben de medicatiefouten vastgesteld door middel van een review van de patiëntendossiers en met behulp van gegevens uit het incidentensysteem. Bij een vermoeden van een medicatiefout werd de situatie voorgelegd aan een intensivist en een apotheker, die vaststelden of er inderdaad sprake was van een medicatiefout en de ernst hiervan voor de patiënt. We maakten hierbij gebruik van de classificatie van de National Coordinating Council for Medication Error Reporting and Prevention. We includeerden 254 patiënten in de pre-interventie en 230 in de post-interventie periode. In de pre-interventie periode vonden we 153 medicatiefouten, wat overeenkwam met 2.27 per 100 voorschriften. In de post-interventie periode vonden we 90 medicatiefouten, wat overeenkwam met 1.71 per 100 voorschriften. Uit de ARIMA-analyse bleek een significante daling van de trend in het aantal medicatiefouten (β -0.21, 95% BI -0.30 tot -0.04, p = 0.02). Daarentegen was er geen significante daling van het aantal medicatiefouten direct na start van de interventie (β -0.61, 95% BI -1.31 tot 0.08, p = 0.07). We concludeerden dat
234
Nederlandse samenvatting
een gestructureerde evaluatie van de voorgeschreven geneesmiddelen in combinatie met feedback, uitgevoerd door een apotheker, leidt tot een belangrijke daling van het aantal medicatiefouten op een intensive care kinderen. Om medicatieveiligheid te monitoren hebben we valide en betrouwbare meetinstrumenten nodig. In de literatuur wordt beschreven dat de zogenaamde “trigger tool” een effectieve en tijdbesparende methode is om medicatiefouten te meten. Echter, de meetprestaties van dit instrument zijn onduidelijk. Daarom hebben we de diagnostische accuratesse onderzocht van een bestaande trigger tool, die ontworpen is om schadelijke medicatiefouten bij kinderen vast te stellen. Deze studie beschrijven we in hoofdstuk 7. In het eerste deel van de studie hebben we vastgesteld welke methode we als referentiestandaard konden gebruiken. In het tweede deel hebben we de trigger tool vergeleken met deze referentiestandaard in een nieuw cohort patiënten. We gebruikten de trigger tool en de referentietest om schadelijke medicatiefouten op te sporen bij alle patiënten die in februari en maart 2013 op de pediatrie afdelingen van ons ziekenhuis werden opgenomen. Op deze manier verkregen we volledige verificatie. De dataverzameling werd uitgevoerd in twee verschillende teams om blindering te garanderen. Uit het eerste deel van de studie bleek dat review van de patiëntendossiers in combinatie met incidentmeldingen het meest effectief was om schadelijke medicatiefouten op te sporen. Daarom werd deze combinatie gebruikt als referentietest in het tweede deel van de studie. In het tweede deel werden 369 patiënten geïncludeerd. Met de referentietest werden 33 schadelijke medicatiefouten ontdekt, in tegenstelling tot de trigger tool, die geen schadelijke medicatiefouten signaleerde. Wanneer we de twee symptomen “pijn” en “misselijkheid/braken” aan de trigger tool toevoegden werden 19 schadelijke medicatiefouten ontdekt. Deze verlengde trigger tool resulteerde in een sensitiviteit van 21.2 en een positief voorspellende waarde van 36.8. We concludeerden dat de oorspronkelijke trigger tool niet het vermogen heeft om schadelijke medicatiefouten op te sporen, en dat review van de patiëntendossiers in combinatie met incidentmeldingen hiertoe de voorkeur heeft. The COMFORT-schaal is een meetinstrument om stress, sedatie en pijn vast te stellen bij non-verbale kinderen. Verschillende studies beschrijven de meetprestaties van de COMFORT-schaal bij kinderen van verschillende leeftijden, met verschillende diagnoses en in verschillende klinische omgevingen, maar inzicht in de kwaliteit van deze studies en een overzicht van de resultaten ontbreken. We besloten daarom een systematisch literatuuronderzoek uit te voeren om de klinimetrische eigenschappen van de COMFORT-schaal te bestuderen: hoofdstuk 8. We doorzochten de volgende databases: CENTRAL, Cinahl, Embase, Medline, PsycInfo en Web of Science. De selectie, data-extractie en kwaliteitsbeoordeling werden onafhankelijk uitgevoerd door twee onderzoekers. Voor de kwaliteitsbeoordeling hebben we gebruik gemaakt van de COSMIN-lijst. We vonden 30 studies die voldeden aan de inclusiecriteria voor dit
235
Nederlandse samenvatting
literatuuronderzoek. De meeste deelnemers in de studies waren kinderen die beademd werden, in de leeftijd tot 4 jaar en zonder neurologische afwijkingen. De interne consistentie en interbeoordelaars betrouwbaarheid resulteerden in waarden >0.70 in vrijwel alle studies, wat wijst op een adequate betrouwbaarheid. De constructvaliditeit resulteerde in correlaties tussen 0.68 en 0.84 voor stress, tussen 0.42 en 0.94 voor sedatie en tussen 0.31 en 0.96 voor pijn. De responsiviteit van de COMFORT-schaal lijkt adequaat. De kwaliteit van de geïncludeerde studies varieerde sterk: van slecht tot excellent. Klinische en methodologische heterogeniteit van de studies maken het moeilijk een helder advies voor het gebruik van de COMFORT-schaal te formuleren. In hoofdstuk 9 beschrijven we een longitudinale studie waarin we onderzochten of de veiligheidscultuur veranderde gedurende vijf jaar waarin we actief werkten aan het verbeteren van de patiëntveiligheid in ons kinderziekenhuis. Het doel van dit onderzoek was tweeledig. Als eerste wilden we het effect op de veiligheidscultuur bestuderen van een veiligheidsprogramma met meerdere interventies. Ten tweede wilden we prioriteiten vaststellen voor toekomstige activiteiten op het gebied van patiëntveiligheid. Tussen 2009 en 2014 kunnen twee fasen worden onderscheiden. In de eerste fase werd een afdeling gebonden patiëntveiligheidsprogramma geïntroduceerd met de volgende onderdelen: (a) incident melden, (b) een niet-verwijtende reactie op fouten en (c) samenwerking binnen multidisciplinaire veiligheidsteams. In de tweede fase kreeg patiëntveiligheid hoge prioriteit toen de organisatie een extern accreditatieproces startte. Gedurende de vijf jaren van de studie hebben we driemaal de veiligheidscultuur gemeten met behulp van de Hospital Survey on Patient Safety Culture. Alle verpleegkundigen, kinderartsen en overige disciplines, die op dat moment werkzaam waren op de vier non-intensive care en twee intensive care afdelingen werden uitgenodigd deel te nemen aan het onderzoek. De verschillen in gemiddelde scores werden vastgesteld met behulp van regressietechnieken en multi-level modellering om te corrigeren voor clustering van de scores per afdeling. We hebben in totaal 811 vragenlijsten verzameld in 2009, 2011 en 2013. Op de non-intensive care zagen we een significante verbetering op 6 van de 11 dimensies van de vragenlijst. De duidelijkste verbetering was zichtbaar na de eerste fase. Het accreditatietraject in de tweede fase leidde niet tot een significante verbetering van de veiligheidscultuur. De intensive care afdelingen vertoonden kleinere, niet-significante veranderingen in de scores. De dimensies “samenwerking tussen ziekenhuisafdelingen”, “overdrachten en overplaatsingen” en “ondersteuning door het ziekenhuismanagement” werden aangeduid als gebieden waar verbetering nodig is. We concludeerden dat de gecombineerde interventie bestaande uit incident melden, een niet-verwijtende reactie op fouten en samenwerking binnen multidisciplinaire veiligheidsteams resulteert in een verbetering van de veiligheidscultuur.
236
Nederlandse samenvatting
DISCUSSIE
Op het gebied van medicatieveiligheid is de laatste jaren vooruitgang behaald. Toch moet er nog meer werk verzet worden om deze specifiek voor kinderen te verbeteren.
Speciale overwegingen bij pediatrische patiëntenMedicatieveiligheid voor kinderen verschilt van medicatieveiligheid voor volwassenen. Het is belangrijk deze verschillen te onderkennen, want mogelijk zijn zij van invloed op de wijze waarop we de medicatieveiligheid kunnen vergoten [1]. Kind-specifieke eigenschappen spelen een belangrijk rol, zoals leeftijdsafhankelijke variatie in de fysiologische ontwikkeling en groei [2-4]. Deze eigenschappen bemoeilijken standaardisatie in alle fasen van het medicatieproces, terwijl standaardisatie het risico op fouten lijkt te verminderen [5,6]. Bovendien noodzaakt het ontbreken van geneesmiddelen in pediatrische samenstellingen en doseringen tot bewerkingen voordat een geneesmiddel kan worden toegediend. Dit vergroot de complexiteit en daarmee ook het risico op fouten en patiëntenschade. Tenslotte, kinderen zijn minder in staat de werking en eventuele bijwerkingen van een geneesmiddel aan te geven en zijn daarvan afhankelijk van de observaties van hun verzorgers. Dit laatste punt moet niet worden onderschat want kinderen krijgen veel geneesmiddelen off-label, een gegeven waar hulpverleners zich nauwelijks van bewust zijn [7-9]. Er wordt aangenomen dat de genoemde kind-specifieke kenmerken een rol spelen bij de helft van alle veiligheidsproblemen bij kinderen [4]. Dit proefschrift presenteert studies die allemaal in een kinderziekenhuis zijn uitgevoerd. De constante aanpassingen van doseringen aan leeftijd en gewicht van de kinderen kan een verklaring bieden voor de hoge prevalentie medicatiefouten die wij constateerden (hoofdstuk 2 en 6). Andere overwegingen specifiek in de zorg voor kinderen, zoals voeding en slaapschema’s, kan de vele afwijkingen in tijdstip van toedienen verklaren (hoofdstuk 2). De beperkte kennis over geneesmiddelen voor kinderen is genoemd als een factor die bijdraagt aan onveilige zorg (hoofdstuk 3). Toch kwamen de kind-specifieke onderwerpen minder uit onze onderzoeken naar voren dan we vooraf hadden verwacht. De deelnemers aan onze studies waren allemaal kinderartsen en gespecialiseerde kinderverpleegkundigen, die volledig bekend zijn met de dagelijks praktijk; kind-specifieke aspecten in het medicatieproces zijn voor hen wellicht “business as usual”. De interventies die we beschrijven in de systematische review werden allemaal op kinderafdelingen uitgevoerd, maar geen van deze interventies adresseerde de specifieke situatie in de pediatrie (hoofdstuk 5). Interventies bedoeld om de medicatieveiligheid voor kinderen te vergroten moeten kind-specifieke kenmerken bevatten. Bijvoorbeeld, een elektronisch voorschrijfsysteem en toedieningsregistratie zijn bewezen effectief, maar zelden ingericht voor de
237
Nederlandse samenvatting
pediatrie. Wij adviseren nadrukkelijk een elektronisch voorschrijfsysteem met beslissingsondersteuning gebaseerd op de beschikbare farmacologische kennis met betrekking tot kinderen. Een dergelijk systeem moet controleren op doseringen, die gebaseerd zijn op het actuele gewicht en de leeftijd van het kind. Verpleegkundigen moeten ondersteund worden bij de toediening door barcode technologie, opnieuw ingericht voor het medicatieproces bij kinderen. Een rekenhulp en waarschuwingen bij mogelijke doseringsfouten zijn essentieel. Een klinische apotheker is een hoofdrolspeler in het medicatieproces. We pleiten voor de klinische inzet van een apotheker, die zich specialiseert in de pediatrie. Deze gespecialiseerde pediatrische apotheker kan een belangrijke rol spelen in het voorkomen van medicatiefouten, en bij het verspreiden van de beschikbare kennis over de effectiviteit en veiligheid van geneesmiddelen voor kinderen.
Interdisciplinair teamworkInterdisciplinair teamwork is van doorslaggevend belang voor patiëntveiligheid [10-12]. Recent onderzoek toont aan dat verbetering van interdisciplinair teamwork resulteert in een significante daling van het aantal complicaties en sterfgevallen [13]. Belangrijke elementen zijn communicatie, coördinatie en samenwerking tussen alle disciplines en afdelingen [10,12]. Communicatie betekent het delen van relevante, nauwkeurige en tijdige informatie. Coördinatie heeft een verband met logistiek, zoals dagelijkse schema’s en routines, en wordt ook beïnvloed door de geografische ligging van de afdelingen ten opzicht van elkaar. Samenwerking betekent het (er)kennen van de expertise, taken en verantwoordelijkheden van andere zorgverleners, en aandacht voor “wederzijds vertrouwen, onderlinge steun en gedeelde doelen” [12]. Deze elementen zijn zeer relevant voor het medicatieproces, waarin meerdere disciplines en afdelingen een rol spelen. Helaas vindt het adviseren en informatie delen tussen artsen, verpleegkundigen en apothekers maar beperkt plaats en komt het nog regelmatig voor dat zij langs elkaar heen werken [14-17]. Het gebrek aan interdisiciplinair teamwork kwam als een hoofdthema uit onze kwalitatieve studie naar voren; zorgverleners blijken vooral binnen hun eigen discipline en op hun eigen afdelingen te werken (hoofdstuk 3). Ook het onderzoek naar patiëntveiligheidscultuur laat lage scores zien op teamwork tussen de afdelingen (hoofdstuk 9). In onze systematische review vonden we twee goed uitgevoerde studies die de meerwaarde aantoonden van een klinische apotheker als deel van het interdisciplinaire team op een afdeling (hoofdstuk 5). Deze resultaten werden bevestigd in onze studie op de intensive care kinderen, waar een apotheker werd toegevoegd aan het multidisciplinaire behandelteam, waarna een significante daling van het aantal medicatiefouten optrad (hoofdstuk 6).
238
Nederlandse samenvatting
Interdisciplinair teamwork moet worden gestimuleerd, georganiseerd en gefaciliteerd met het doel de medicatieveiligheid te vergroten. In het medicatieproces zijn de hoofdrolspelers de arts, de verpleegkundige en de apotheker. Deze professionals moeten gezamenlijk het geneesmiddelenbeleid van individuele patiënten bespreken, en hun expertise bundelen bij de ontwikkeling van protocollen en beleid. De processen van de verschillende hulpverleners moeten op elkaar worden afgestemd om onveilige en inefficiënte situaties te voorkomen. Interprofessioneel onderwijs en training moet worden overwogen, want hierdoor kan wederzijds begrip en steun worden bereikt. De uitdaging is om een team van experts om te vormen tot een expertteam.
Patiënt veiligheidscultuurTegenwoordig wordt algemeen erkend dat de veiligheidscultuur een belangrijke rol speelt binnen patiëntveiligheid. Een patiëntveiligheidscultuur kan worden gedefinieerd als “waarden die worden gedeeld binnen een organisatie over wat belangrijk is, opvattingen over hoe dingen zijn georganiseerd, en de interactie hiervan met de organisatiestructuur en -systemen. Deze bepalen samen welke gedragsnormen over veiligheid worden gehanteerd” [19]. Het idee is dat een meer positieve veiligheidscultuur bijdraagt aan betere klinische uitkomsten. Enkele studies tonen aan dat hogere scores op patiëntveiligheidsenquêtes gerelateerd zijn aan minder incidenten [19,21,22]. Deze resultaten hebben geleid tot de ontwikkeling van interventies die de veiligheidscultuur zouden moeten verbeteren [23-25]. Het meest effectief lijkt een combinatie van teamtraining, verbetering van communicatie en leiderschapsrondes [23,25]. Verschillende organisaties nemen een voorbeeld aan de zogenaamde High Reliability Organizations (HRO’s) [26,27]. HRO’s zijn complexe en dynamische organisaties met een voortdurend risico op een catastrofale ramp, zoals bijvoorbeeld in de luchtvaart en bij kerncentrales. Voor dergelijke organisaties heeft veiligheid een zeer hoge prioriteit. Dit blijkt o.a. uit de aandacht voor sterk leiderschap en continue procesverbetering. Maar het meest aansprekende kenmerk van een HRO is de veiligheidscultuur. Deze zien we terug in vijf kenmerken: voortdurende alertheid op fouten, terughoudendheid om zaken te simplificeren, gerichtheid op de uitvoerende werkzaamheden, de inzet van veerkracht en respect voor deskundigheid. In de praktijk betekent dit dat iedere werknemer verantwoordelijkheid draagt voor veiligheid, dat het melden van incidenten wordt gewaardeerd en dat fouten grondig worden geanalyseerd en worden gebruikt om van te leren. In HRO’s zijn onderwijs en teamtraining onderdeel van de dagelijkse praktijk en de waarde van elke werknemer wordt gezien en erkend [27,28]. Hoewel gezondheidszorginstellingen verschillen van andere organisaties, kunnen de veiligheidsprincipes ziekenhuizen helpen om de patiëntveiligheid duurzaam te ontwikkelen [26,27,29].
239
Nederlandse samenvatting
De patiëntveiligheidscultuur bleek één van de hoofdthema’s te zijn die bijdraagt aan medicatiefouten, zoals beschreven in onze kwalitatieve studie (hoofdstuk 3). Deze studie toont aan dat een gezamenlijk attitude ten opzichte van medicatieveiligheid, de reactie op onveilig gedrag en het vermogen om te leren van fouten verder kunnen verbeteren. Deze resultaten zijn aanvullend op de survey over de patiëntveiligheidscultuur (hoofdstuk 9). Een positieve patiëntveiligheidscultuur moet worden nagestreefd in elke gezondheidszorginstelling, want deze draagt bij aan veilige zorg. Leidinggevenden spelen daarin een belangrijke rol. Zij moeten unaniem en glashelder zijn over de geldende veiligheidsnormen, welk gedrag verwacht wordt en zelf het goede voorbeeld geven. Een goede start is om onderwerpen die de veiligheid raken openlijk te bespreken, bijvoorbeeld tijdens leiderschapsrondes.
Overwegingen voor de toekomstDe hierboven beschreven kind-specifieke kenmerken tonen aan dat er behoefte is aan geneesmiddelen, die effectief en veilig zijn voor kinderen. Toch krijgt meer dan de helft van de in een ziekenhuis opgenomen kinderen een off-label of een niet-geregistreerd geneesmiddel [8,9]. Om te garanderen dat kinderen medicatie krijgen die volledig getest is, is onderzoek noodzakelijk naar de juiste samenstelling, dosering, frequentie en toedieningswijze voor kinderen van verschillende leeftijden. Wetenschappelijk onderzoek met kinderen gebeurt echter weinig. Een belangrijke achterliggende reden is het ethisch principe van wetenschappelijke noodzakelijkheid: kinderen mogen alleen meedoen aan wetenschappelijk onderzoek wanneer het bijdraagt aan de gezondheid en welzijn van kinderen [30]. Omdat veel geneesmiddelen bij kinderen anders werken dan bij volwassenen, zijn klinische trials in de pediatrische populatie noodzakelijk. Recente ontwikkelingen in de regelgeving en de start van verschillende samenwerkingsverbanden zullen dit in de toekomst eenvoudiger maken. De kosten die samengaan met onderzoek voor deze relatief kleine patiëntenpopulatie mag geen belemmering zijn; het is een morele verplichting om te garanderen dat kinderen worden behandeld met geneesmiddelen die zowel effectief als veilig zijn. Verder moeten wij ons voorbereiden op een groeiend aantal kinderen met complexe hulpvragen, die vaak samengaan met geneesmiddelengebruik [31]. Daarbij komt nog dat patiënten korter in het ziekenhuis verblijven en de zorg steeds meer thuis plaatsvindt [32]. Dit heeft gevolgen voor de toekomstige onderzoeksagenda: medicatie-overdrachten, familie-educatie, therapietrouw en veiligheid in de thuissituatie worden belangrijker. Gezien het beperkte aantal studies van hoge kwaliteit is het belangrijk in de toekomst meer aandacht te besteden aan onderzoeksmethodologie. Onderzoekers moeten streven naar robuuste onderzoeksdesigns, zoals cluster gerandomiseerde studies, onderzoeken met een stepped wedge opzet, gecontroleerde voor- nametingen

240
Nederlandse samenvatting
of interrupted time series [33]. Met betrekking tot de uitkomstmaten wordt aanbevolen om zowel proces als klinische uitkomsten te overwegen [34]. Toekomstige studies op het gebied van medicatieveiligheid moeten zowel medicatiefouten, potentiële schadelijke medicatiefouten en patiëntenschade als uitkomstmaten bevatten. Er moet gestreefd worden naar uniforme definities in onderzoek naar medicatieveiligheid; daarin kunnen internationale veiligheidsinstituten een belangrijke rol spelen. Een combinatie van methoden is de beste manier om medicatiefouten vast te stellen, maar dit is tijdsintensief [35,36]. Wellicht doen zich nieuwe mogelijkheden voor na invoering van een elektronisch patiëntendossier. Door patiëntengegevens met elkaar te verbinden zou het mogelijk moeten zijn medicatiefouten effectiever en efficiënter boven tafel te krijgen. Deze systemen moeten zich verder ontwikkelen van registratiesystemen tot systemen die de zorgverleners ondersteunen bij besluitvorming en het voorkomen van fouten. Toekomstig onderzoek moet de mogelijkheden van een elektronisch patiëntendossier bij het identificeren van (schadelijke) medicatiefouten en de effectiviteit van corrigerende maatregelen verder onderzoeken. Tot slot moeten we aandacht besteden aan de implementatie van bewezen effectieve interventies in de klinische praktijk [37]. We moeten daarbij in het oog houden dat de generaliseerbaarheid van verbeteracties naar andere organisaties niet vanzelfsprekend is [38]. Het is daarom belangrijk dat elk ziekenhuis een analyse maakt van zijn context, implementatiestrategieën kiest die daarop aansluiten en inspeelt op lokale bevorderende en belemmerende factoren [39]. Een pilot kan voorkomen dat een organisatie een interventie breed implementeert, die mogelijk niet werkt of zelfs nieuwe veiligheidsproblemen introduceert [40]. De hoofdrolspelers binnen medicatieveiligheid, artsen, verpleegkundigen en apothekers, moeten deelnemen aan implementatieprojecten. Daarvoor moeten zij kennis en vaardigheden bezitten met betrekking tot implementeren, zodat wetenschappelijk bewezen interventies daadwerkelijk de klinische praktijk veranderen [41,42].
CONCLUSIE
De kennis over medicatieveiligheid in de ziekenhuiszorg aan kinderen is in de afgelopen jaren toegenomen; de epidemiologie van medicatiefouten en factoren die daaraan bijdragen worden beter begrepen. Daar staat tegenover dat de effectiviteit van de interventies die medicatieveiligheid vergroten zelden wetenschappelijk zijn bewezen. Informatietechnologie en interdisciplinair teamwork zijn veelbelovend en deze interventies moeten worden geïmplementeerd, waarbij de kind-specifieke kenmerken moeten worden meegenomen. De patiëntveiligheidscultuur vraagt speciale aandacht. Elke gezondheidszorginstelling moet medicatieveiligheid prioriteren, faciliteren en organiseren met het ultieme doel om de veiligheid in de zorg voor kinderen te garanderen.
241
Nederlandse samenvatting
REFERENTIES1. Ruano M, Villamañán E, Pérez E, et al. New technologies as a strategy to decrease medication errors: how
do they affect adults and children differently? World J pediatr 2016;12:28-34.
2. Miller MR, Robinson KA, Lubomski LH, et al. Medication errors in pediatric care: a systematic review of epidemiology and an evaluation of evidence supporting reduction strategy recommendations. Qual Saf Health Care. 2007;16:116-126.
3. Wong ICK, Wong LYL, Cranswick NE. Minimising medication errors in children. Arch Dis Child 2009 94:161-164.
4. Woods DM, Holl JL, Shonkoff JP, et al. Child-specific risk factors and patient safety. J Patient Saf 2005;14:17-22.
5. Aseeri MA. The impact of a pediatric antibiotic standard dosing table on dosing errors. J Pediatri Pharmacol Ther 2013;18:220-226.
6. Rotter T, Kinsman L, James EL, et al. Clinical pathways: effects on professional practice, patient outcomes, length of stay and hospital costs. Cochrane Database of Systematic Reviews 2010, Issue 3. Art. No.: CD006632. DOI:10.1002/14651858.CD006632.pub2.
7. Balan S, Hassali MA, Mak VS. Awareness, knowledge and views of off-label prescrbing in children: a systematic review. Br J Clin Pharmcol 2015;80:1269-1280.
8. Conroy S, Choonara I, Impicciatore P, et al. Survey of unlicensed and off label drug use in paediatric wards in European countries. BMJ 2000;320:79-82.
9. Magalhães J, Rodriques AT, Roque F, et al. Use of off-label and unlicenced drugs in hospitalised paediatric patients: a systematic review. Eur J Clin Pharmacol 2015;71:1-13.
10. Taylor N, Clay-Williams R, Hogden E, et al. High performance hospitals: a qualitative systematic review of associated factors and practical strategies for improvement. BMC Health Services Research 2015;15:244-266.
11. Weaver S, Rosen M, Diaz Granados D, et al. Does teamwork improve performance in the operating room? A multilevel evaluation. Jt Comm J Qual Patient Saf 2010;36:133-142.
12. Weller J, Boyd M, Cumin D. Teams, tribes and patient safety: overcoming barriers to effective teamwork in healthcare. Postgrad Med J 2014;90:149-154.
13. Berry JC, Davis JT, Bartman T, et al. Improved safety culture and teamwork climate are associated with decreases in patient harm and hospital mortality across a hospital system. J Patient Saf 2016, January (epub. ahead of print).
14. Manias E. The concept of teamwork does not fully explain how interprofessional work occurs in intensive care. Austr Crit Care 2015;28:235-237.
15. Creswick N, Westbrook JI. Who do hospital physicians and nurses go to for advice about medications? A social network analysis and examination of prescribing error rates. J Patient Saf 2015;11:152-159.
16. Edmondson AC. Teaming: How organizations learn, innovate, and compete in the knowledge economy. First edition. Harvard Business School, Jossey Bass, United States of America, 2012.
17. Rixon S, Braaf S, Williams A, et al. Pharmacists’ interprofessional communication about medications in speciality hospital settings. Health Communications 2015;30:1065-1075.
18. Mark BA, Hughes LC, Belyea M, et al. Exploring organizational context and structure as predictors of medication errors and patient falls. J Patient Saf 2008;4:66–77.
19. Singer S, Lin S, Falwell A, et al. Relationship of safety climate and safety performance in hospitals. Health Serv Res 2009;44:399-421.
20. Scott I. What are the most effective strategies for improving quality and safety of health care? Intern Med J 2009;39:389-400.
21. Dicuccio MH. The relationship between patient safety culture and patient outcomes: a systematic review. J Patient Saf 2015;11:135-142.
242
Nederlandse samenvatting
22. Mardon RE, Khanna K, Sorra J, et al. Exploring relationships between hospital patient safety culture and adverse events. J Patient Saf 2010;6:226-232.
23. Morello RT, Lowthian JA, Barker AL, et al. Strategies for improving patient safety culture in hospitals: a systematic review. BMJ Qual Saf 2013;22:11-18.
24. Parmelli E, Flodgren G, Schaafsma ME, et al. The effectiveness of strategies to change organizational culture to improve healthcare performance (review). Cochrane Database Syst Rev 2011, Issue 1. Art. No.: CD008315. DOI:10.1002/14651858.CD008315.pub2.
25. Weaver SJ, Lubomski LH, Wilson RF, et al. Promoting a culture of safety as a patient strategy: a systematic review. Ann Intern Med 2013;158:369-374.
26. Bagnara S, Parlangeli O, Tartaglia R. Are hospitals becoming high reliability organisations? Applied Ergonomics 2010;4:713-718.
27. Chassin MR, Loeb JM. High Reliability Health Care: getting there from here. The Milbank Quarterly 2013;91:459-490.
28. Sutcliffe KM. High Reliability Organizations (HROs). Best Practice and Research Clinical Anaesthesiology 2011;25:133-144.
29. Hines S, Luna K, Lofthus J, et al. Becoming a High Reliability Organization: Operational Advice for Hospital Leaders. AHRQ Publication No. 08-0022. Agency for Healthcare Research and Quality, available: www.ahrq.gov, accessed March 2016.
30. Canadian Paediatric Society. Ethical issues in health research in children. Paediatr Child Health 2008;13:707-712.
31. Berry JG, Hall M, Hall DE, et al. Inpatient growth and resource use in 28 children’s hospitals: a longitudinal, multi-institutional study. JAMA Pediatr 2013;167:170–177.
32. Eurostat statistics. Hospital dicharges and length of stay statistics. Available: http://ec.europa.eu/eurostat/statistics-explained, accessed April 2016.
33. Fan E, Laupacis A, Pronovost PJ, et al. How to use an article about quality improvement. JAMA 2010;304:2279-2287.
34. Brown C, Hofer T, Johal A, et al. An epistemiology of patient safety research: a framework for study design and interpretation. Part 3. End points and measurement. Qual Saf Health Care 2008;17:170-177.
35. Meyer-Massetti C, Cheng CM, Schwappach DL, et al. Systematic review of medication safety assessment methods. Am J Health Syst Pharm 2011;68:227-240.
36. Morimoto T, Gandhi TK, Seger AC, et al. Adverse drug events and medication errors: detection and classification methods. Qual Saf Health Care 2004;13:306-314.
37. Shojania KG. Conventional evaluations of improvement interventions: more trials or just more tribulations? BMJ Qual Saf 2013;22:881-884.
38. Seidlin HM, Stützle M, Hoppe-Tichy T, et al. Best practice strategies to safeguard drug prescribing and drug administration: an anthology of expert views and opinions. Int J Clin Pharm 2016, March (epub. ahead of print).
39. Grol R, Grimshaw J. From best evidence to best practice: effective implementation of change in patients’ care. Lancet 2003;362:1225-1230.
40. Brown C, Hofer T, Johal A, et al. An epistemiology of patient safety research: a framework for study design and interpretation. Part 1. conceptualising and developing interventions. Qual Saf Health Care 2008;17:158-162.
41. Glasziou P, Ogrinc G, Goodmans S. Can evidence-based medicine and clinical quality improvement learn from each other? BMJ Qual Saf 2011:20:i13-i17 (Suppl.).
42. Margolis P, Provost LP, Schoettker PJ, et al. Quality improvement, clinical research and quality improvement research-opportunities for integration. Pediatr Clin North Am 2009;56:831-841.
List of co-authors

245
List of co-authors
Prof. Dr. W.M.C. van Aalderen (Wim), MDDepartment of Pediatrics, Emma Children’s Hospital, Academic Medical Center, Amsterdam, the Netherlands.
Dr. B. Apampa (Bugewe), PharmDSchool of Life Sciences, University of Sussex, Brighton, United Kingdom.
Dr. D.T. Bosman (Diederik), MDDepartment of Pediatrics, Emma Children’s Hospital, Academic Medical Center, Amsterdam, the Netherlands.
A.M. Busink (Annemarie), RNDepartment of Internal Medicine, Section of Geriatric Medicine, Academic Medical Center, Amsterdam, the Netherlands.
Dr. A.M. Eskes (Anne), RNACHIEVE - Centre of Applied Research, Faculty of Health, Amsterdam University of Applied Sciences, Amsterdam, the Netherlands.
Dr. B. Fernando (Bernard), MDCommunity Health Sciences – General Practice, University of Edinburgh, Rainham, United Kingdom.
Dr. M.A. Ghaleb (Maisoon), PharmDDepartment of Pharmacy, School of Life and Medical Sciences, University of Hertfordshire, Hatfield, United Kingdom.
Dr. V.G.M. Geukers (Vincent), MDDepartment of Pediatric Intensive Care, Emma Children’s Hospital, Academic Medical Center, Amsterdam, the Netherlands.
Dr. R.M. van Hest (Reinier), PharmDDepartment of Hospital Pharmacy, Academic Medical Center, Amsterdam, the Netherlands.
Dr. W.G. Ista (Erwin), RNDepartment of Pediatrics and Pediatric Surgery, Intensive Care Unit, Sophia Children’s Hospital Rotterdam, the Netherlands.
246
List of co-authors
Prof. Dr. C. Lucas (Cees), Clin EpiDepartment of Clinical Epidemiology, Biostatistics and Bioinformatics, Academic Medical Center and University of Amsterdam, Amsterdam, the Netherlands.
M. de Neef (Marjorie), RNDepartment of Pediatric Intensive Care, Emma Children’s Hospital, Academic Medical Center, Amsterdam, the Netherlands.
Dr. A. Neubert (Antje), PharmDDepartment of Pediatrics, University Hospital Erlangen, Erlangen, Germany.
Dr. C.J. van Oostveen (Catharina), RNSpaarne Research Academy, Spaarne Hospital, Hoofddorp, the Netherlands.
P.A.M.A. Raymakers-Janssen (Paulien), RNDepartment of Pediatric Intensive Care Unit, Wilhelmina Children’s Hospital, University Medical Center Utrecht, Utrecht, the Netherlands.
Dr. P.C. van Rijn-Bikker (Petra), PharmDDepartment of Hospital Pharmacy, Academic Medical Center, Amsterdam, the Netherlands.
Dr. M. Smeulers (Marian), PTDepartment of Out Patient Services, Academic Medical Center, Amsterdam, the Netherlands.
Dr. A. Soe (Aung), MDOliver Fisher Neonatal Unit, Medway Maritime Hospital, Gillingham, United Kingdom.
Dr. S. Thayyil (Sudhin), MDAcademic Neonatology, Imperial College London, London, United Kingdom.
M.A. Tio (Marieke), PharmDDepartment of Hospital Pharmacy, Academic Medical Center, Amsterdam, the Netherlands.
247
List of co-authors
Dr. E.S. Veldhoen (Esther), MDDepartment of Pediatric Intensive Care Unit, Wilhelmina Children’s Hospital, University Medical Center Utrecht, Utrecht, the Netherlands.
Dr. H. Vermeulen (Hester), RNDepartment of Surgery, Academic Medical Center, Amsterdam, the Netherlands.
Dr. J.M. Wielenga (Joke), RNDepartment of Neonatal Intensive Care, Emma Children’s Hospital, Academic Medical Center Amsterdam, the Netherlands.


PhD portfolio

251
PhD portfolio
Name: Jolanda Marianne MaaskantPhD period: 2011 – 2016PhD supervisor: Prof. Dr. W.M.C. van AalderenPhD co-supervisor: Dr. H. Vermeulen
Year Workload (ECTS)
CoursesQualitative Health Research 2011 1.9Clinical Data Management 2011 0.6Law and Organisation for Clinical Researchers (BROK)Herregistration course
20122016
0.80.1
Scientific Writing in English for Publication 2012 0.8Mixed models 2013 0.7Advanced biostatistics 2014 1.0Advanced topics in clinical epidemiology 2014 0.7Implementation Science in Healthcare 2014 1.4Scientific conferences, workshopsQuality & Safety in Health Care, Institute for Healthcare Improvement, BMJ Group, Amsterdam, the Netherlands
2011 0.3
Workshop: “getting published” by Gordon Guyatt 2011 0.2European Academy of Paediatric Societies, Istanbul, Turkey 2012 1.1Amsterdam Children Symposium, Amsterdam, the Netherlands
2013 0.3
Amsterdam Children Symposium, Amsterdam, the Netherlands
2014 0.3
European Academy of Paediatric Societies, Barcelona, Spain 2014 1.1Quality & Safety in Health Care, Institute for Healthcare Improvement, BMJ Group, Londen, United Kingdom
2015 0.3
Amsterdam Children Symposium, Amsterdam, the Netherlands
2016 0.3
Oral presentations “Medication safety in pediatric care”, VMS congres, Utrecht 2011 0.5“Medication safety”, Nursing Event, Ede-Wageningen 2011 0.5“Medication errors in paediatrics: Patient, Pill and Process”, European Academy of Paediatric Societies, Istanbul, Turkey
2012 0.5
“Patient safety: culture shifts over time”, European Academy of Paediatric Societies, Istanbul, Turkey
2012 0.5
252
PhD portfolio
Poster presentations “Patientveiligheidscultuur in een kinderziekenhuis”, Amsterdam Children Symposium, Amsterdam, the Netherlands
2011 0.5
“Medication errors in paediatrics: Patient, Pill and Process”, Amsterdam Children Symposium, Amsterdam, the Netherlands
2013 0.5
“Patient safety culture in progress”, European Academy of Paediatric Societies, Barcelona, Spain
2014 0.5
“Effective interventions to reduce medication errors in children: a systematic review”, European Academy of Paediatric Societies, Barcelona, Spain
2014 0.5
“Medication review and feedback by a clinical pharmacist decrease medication errors in the PICU: an Interrupted Time Series analysis”, Amsterdam Children Symposium, Amsterdam, the Netherlands
2016 0.5
LecturingEvidence-based practice for nurses, Academic Medical Center, Amsterdam
2011 - present
3.0
Evidence-based practice for nurses, different organisations (Dutch EBP congress, Nursing, Rehabilitation Centre Leiden, Dutch Network Gynaecology nurses, Antonius Hospital, Cochrane Netherlands)
2011 - present
3.0
Applied implementation science (“Implement-leren”) 2013 - present
2.0
Supervising, mentoring, reviewingThesis supervising, students master Evidence-based practice, University of Amsterdam (6 students a year)
2011 - present
30.0
Thesis supervising, students master Strategic Management, University of Rotterdam (1 student a year)
2012 - present
4.0
Reviewing manuscrips for international journals, like Expert Opinion on Drug Safety, Journal of Patient Safety.
2014 - present
3.0
NB. 1 ECTS = 28 hours, based on the European Credit Transfer System

International publications

255
International publications
1. Maaskant JM, Boer JP, Dalesio O, Holtkamp M, Lucas C. The effectiveness of chlorhexidine-silver sulfadiazine impregnated central venous catheter in patients receiving high-dose chemotherapy followed by peripheral stem cell transplantation, Eur J Cancer Care 2009;18:477-482.
2. Maaskant JM, Knops AM, Ubbink DT, Vermeulen H. Evidence-based practice: a survey among pediatric nurses and pediatricians. J Pediatr Nurs 2013;28:150-157.
3. Sieswerda-Hoogendoorn T, Bilo RA, Duurling LL, Kars WA, Maaskant JM, van Aalderen WM, van Rijn RR. Abusive head trauma in young children in the Netherlands: evidence for multiple abusive incidents. Acta Paediatr 2013;102:e497-e501.
4. Tump E, Maaskant JM, Brölmann FE, Bosman DK, Ubbink DT. What brings children home? A prognostic study to predict length of hospitalization. Eur J Pediatr 2013;172:1379-1385.
5. Eskes AM, Maaskant JM, Holloway S, van Dijk N, Alves P, Legemate DA, Ubbink DT, Vermeulen H. Competences of specialized wound care nurses: a European Delphi study. Int Wound J 2014;11:665-674.
6. Verwey L, Smeulers M, Maaskant JM, Vermeulen H. Quiet please! Drug round tabards, are they effective and accepted? A mixed method study. J Nurs Scholarsh 2014;46:340-348.
7. Maaskant JM, Bosman D, van Rijn-Bikker P, van Aalderen W, Vermeulen H. Preventable errors with non-opioid analgesics and anti-emetic drugs increase burden in hospitalized children. Eur J Pediatr Surg 2014;24:381-388.
8. Maaskant JM, Eskes A, Bosman D, van Rijn-Bikker P, van Aalderen W, Vermeulen H. High-alert medications for pediatric patients: an international modified Delphi study. Expert Opin Drug Saf 2013;12:805-814.
9. Maaskant JM, Smeulers M, Bosman D, Busink A, van Rijn-Bikker P, van Aalderen W, Vermeulen H. The trigger tool as a method to measure harmful medication errors in pediatric care. J Patient Saf 2015, April (epub. ahead of print).
10. Maaskant JM, Vermeulen H, Apampa B, Fernando B, Ghaleb MA, Neubert A, Thayyil S, Soe A. Interventions for reducing medication errors in children in hospital. Cochrane Database of Systematic Reviews, 2015, Isssue 3. Art. No: CD006208. DOI: 10.1002/14651858.CD006208.pub3.
11. Smeulers M, Verwey L, Maaskant JM, de Boer M, Krediet P, Nieveen-van Dijkum EJ, Vermeulen H. Quality indicators for safe medication preparation and administration: a systematic review. PLoS One 2015;10:e0122695.
256
International publications
12. Stilma W, Rijkenberg S, Feijen HM, Maaskant JM, Endeman H. Validation of the Dutch version of the Critical care Pain Observation Tool. Nurs Crit Care 2015, December (epub. ahead of print).
13. Maaskant JM, Wielenga J, de Neef M, Bosman D, Vermeulen H. Safety interventions, safety culture and priorities for the future in a pediatric hospital: a 5-years cohort study. Submitted.
14. Maaskant JM, Raymakers-Janssen PA, Veldhoen ES, Ista WG, Lucas C, Vermeulen H. The clinimetric properties of the COMFORT scale: a systematic review. Eur J Pain 2016. Accepted.
15. Doedens P, Barkhof E, Storosum JG, van Meijel B, Latour CH, Maaskant JM, Koeter MW, de Haan L. Nursing staff factors contributing to seclusion in acute mental healthcare: a prognostic study. Submitted.
16. Smeulers M, Dolman C, Adema D, van Dieren S, Maaskant JM, Vermeulen H. Safe and effective nursing shift handover with NURSEPASS: an interrupted time series analysis. Submitted.
17. van de Pol I, van Itersen M, Maaskant JM. Effect of nocturnal sound reduction on incidence of delirium in Intensive Care Unit patients: an interrupted time series analysis. Submitted.
18. Schut L, Wangensteen A, Maaskant JM, Tol J, Bahr R, Moen M. Can clinical evaluation predict return to sport after acute hamstring injuries? A systematic review. Submitted.
19. Maaskant JM, Tio M, van Hest R, Vermeulen H, Geukers V. Medication review and feedback by a clinical pharmacist decrease medication errors at the PICU: an interrupted time series analysis. Submitted.
20. Maaskant JM, van Oostveen C, Smeulers M, van Rijn-Bikker P, Vermeulen H. Contributory factors leading to medication errors in pediatric patients: a qualitative study. Submitted.
21. van Lieshout I, Munsterman ID, Eskles AM, Maaskant JM, van der Hulst R. Systematic review and meta-analysis: sodium picosulphate with magnesium citrate (SPMC) as bowel preparation for colonoscopy. Submitted.
Dankwoord

259
Dankwoord
Mijn promotietraject sluit ik af met een groot gevoel van dankbaarheid en blijdschap. Dankbaar dat ik deze kans heb gekregen en blij dat het proefschrift is gelukt. Aan het einde van deze periode richt ik graag het woord tot de mensen in mijn omgeving die dit mogelijk hebben gemaakt.
Allereerst wil ik mijn copromotor, Dr. Hester Vermeulen, enorm bedanken. Beste Hester, je bent als begeleider de rode draad geweest tijdens het hele promotietraject en een betere copromotor kan ik me niet voorstellen. Onze wekelijkse afspraken waren altijd te kort. We bespraken niet alleen de voortgang van mijn promotie, maar ook andere ideëen om de kwaliteit van zorg te verbeteren. Ik bewonder je idealisme, creativiteit en doorzettingsvermogen. Jouw drive om de patiëntveiligheid in het ziekenhuis te ver-beteren was voor mij enorm stimulerend en steunend in periodes wanneer het allemaal niet zo eenvoudig bleek. Heel veel dank hiervoor!
Tevens wil ik mijn promotor, Prof. Dr. Wim van Aalderen, van harte bedanken. Beste Wim, vrijwel direct bij mijn aanstelling in het AMC kreeg ik van jou de kans een promoti-etraject te starten. Het onderwerp was weliswaar nog niet duidelijk en het heeft even geduurd voordat er schot in kwam, maar je twijfelde nooit aan een succesvolle afloop. Je blijdschap, wanneer er weer een artikel was geaccepteerd, was ontwapenend. Dank je wel dat je mijn promotor wilde zijn en me de gelegenheid hebt gegeven onderzoek te doen op de kinderafdelingen.
Geachte leden van de promotiecommissie, hartelijk dank voor de inhoudelijke beoor-deling van mijn manuscript en uw bereidheid hierover met mij van gedachten te wissel-en tijdens de openbare verdediging.
De combinatie van promotieonderzoek en het werk als stafmedewerker was niet mo-gelijk geweest als daarvoor geen begrip en medewerking was geweest van al mijn (oud) collega’s. Veel van hen zijn verbonden aan de Divisie Vrouw-Kind, maar ook de samenwerking met de apotheek, de afdeling Kwaliteit & Proces Innovatie en Bureau Kwaliteit & Veiligheid was buitengewoon waardevol.
Mijn speciale dank gaat uit naar Robert Simons en Lex Unk. Beste Robert, je bent wel-iswaar mijn baas, maar zo heeft dat nooit gevoeld, want we hebben altijd op voet van gelijkwaardigheid met elkaar samengewerkt. Ik bewonder je om je tomeloze energie en bereidheid de (verpleegkundige) zorg een stapje verder te helpen, waarbij een forse dosis humor nooit ontbrak. Ook voor mijn promotie was je onmisbaar, vooral omdat je me de vrijheid gaf dit traject op mijn eigen manier te lopen. Dank je wel voor dit ver-
260
Dankwoord
trouwen! Beste Lex, je bent al jarenlang mijn kamergenoot en direkte collega. Naast de goede samenwerking die we hebben vanuit onze functie als stafmedewerker, heb je zeker heel wat te incasseren gehad als het gaat om mijn promotie. Wanneer mijn concentratie toenam, daalde mijn gezelligheid en was ik zelden goed aanspreekbaar. Jij voelde dat altijd haarscherp aan, hield daar rekening mee en beschermde me zelfs tegen (op dat moment) ongewenste verstoringen. Veel dank hiervoor!
Een speciaal woord voor mijn collega’s van de universitaire Master Evidence-based practice. Beste Cees, na beeindiging van de master bracht jij me in contact met Rob-ert, waarna het promotie-balletje ging rollen. Jij hebt dit traject een belangrijke impuls gegeven en daarvoor ben ik je dankbaar. Bovendien sta je aan het hoofd van een bij-zondere groep mensen, waar ik al jaren deel van uit mag maken. Dank jullie wel voor de fijne samenwerking!
Onderzoek opzetten, uitvoeren en opschrijven is teamwerk. Ik wil dan ook iedereen be-danken die heeft meegedacht en meegewerkt. De medeauteurs ben ik zeer erkentelijk voor hun bijdragen aan de verschillende artikellen.
Lieve Nyncke en Frans, ik ben trots dat jullie mijn paranimfen zijn. Nyncke, lang geleden waren we collega’s. Sindsdien is er ontzettend veel gebeurd, maar het contact bleef en door de jaren heen groeide een onbetaalbare vriendschap. Onze ontmoetingen zijn altijd eerlijk, relativerend, ondersteunend en (niet onbelangrijk) gezellig. Dank je wel voor je vriendschap! Frans, voor jou heb ik eigenlijk geen tekst. Natuurlijk sta jij op deze belangrijke dag naast me. Dank je wel dat je er bent! Lieve familie, vrienden en vriendinnen, jullie zorgden voor de ontspanning buiten het werk en waren alleen daardoor al onmisbaar in dit promotietraject. De culturele uitjes, etentjes, terrasjes, verjaardagspartijtjes, familiedagen, zussendagen, wandelin-gen en vakanties waren een heerlijke afwisseling en soms ook een noodzakelijke on-derbreking van het werk dat de promotie met zich mee bracht. Jullie zijn allen op een eigen manier ontzettend waardevol voor me en ik kan jullie niet genoeg bedanken voor alle warmte en steun.


Jolanda Maaskant
Jolanda Maaskant
Medication safety in pediatric care
Uitnodiging voor het bijwonen van de openbare verdediging
van het proefschrift
Medication safety in pediatric care
door Jolanda Maaskant
Vrijdag 23 september 2016om 13:00 uur
Aula van de Universiteit (Oude Lutherse Kerk)
Singel 411 1012 XM Amsterdam
Gelegenheid tot feliciteren na afloop van de promotie.
Jolanda MaaskantLanseloetstraat 41-21055 BC Amsterdam
[email protected] 06 45558002
Paranimfen:Nyncke Bouma
[email protected] 53360619
Frans [email protected]
06 22761561