Puredata Systems for Analytics: Concurrency and Workload ...
103
St. Cloud State University theRepository at St. Cloud State Culminating Projects in Information Assurance Department of Information Systems 12-2015 Puredata Systems for Analytics: Concurrency and Workload Management Sai Mohit Muddu St. Cloud State University, [email protected] Follow this and additional works at: hps://repository.stcloudstate.edu/msia_etds is Starred Paper is brought to you for free and open access by the Department of Information Systems at theRepository at St. Cloud State. It has been accepted for inclusion in Culminating Projects in Information Assurance by an authorized administrator of theRepository at St. Cloud State. For more information, please contact [email protected]. Recommended Citation Muddu, Sai Mohit, "Puredata Systems for Analytics: Concurrency and Workload Management" (2015). Culminating Projects in Information Assurance. 3. hps://repository.stcloudstate.edu/msia_etds/3
Transcript of Puredata Systems for Analytics: Concurrency and Workload ...

St. Cloud State UniversitytheRepository at St. Cloud State
Culminating Projects in Information Assurance Department of Information Systems
12-2015
Puredata Systems for Analytics: Concurrency andWorkload ManagementSai Mohit MudduSt. Cloud State University, [email protected]
Follow this and additional works at: https://repository.stcloudstate.edu/msia_etds
This Starred Paper is brought to you for free and open access by the Department of Information Systems at theRepository at St. Cloud State. It has beenaccepted for inclusion in Culminating Projects in Information Assurance by an authorized administrator of theRepository at St. Cloud State. For moreinformation, please contact [email protected].
Recommended CitationMuddu, Sai Mohit, "Puredata Systems for Analytics: Concurrency and Workload Management" (2015). Culminating Projects inInformation Assurance. 3.https://repository.stcloudstate.edu/msia_etds/3

Puredata Systems for Analytics: Concurrency and Workload Management
by
Sai Mohit Muddu
A Starred Paper
Submitted to the Graduate Faculty
of
St. Cloud State University
in Partial Fulfillment of the Requirements
for the Degree of
Master of Science in
Information Assurance
December, 2015
Starred Paper Committee:
Dr. Jim Q Chen
Dr. Susantha Herath
Dr. Changsoo Sohn

2
Abstract
PureDataTM
System for Analytics also called as Netezza is a data warehouse server
handling analytic operations capable of providing throughput 1000 times greater and faster than
traditional database servers. Impressively, it requires minimal system tuning thereby providing
high-end performance as well as requiring a low total cost of ownership (TCO). Database
performance is directly linked to the allocation of system resources on a database management
system. The heart of the Netezza appliance, Field-Programmable Gate Array (FPGA) plays a key
role in boosting the overall performance of a server. I/O operations are always a bottleneck in
any database server and it is the FPGA that eradicates the I/O problem in Netezza by filtering the
data across each snippet processing unit (SPU), processing and running the queries faster thereby
pumping server’s performance greatly.
This paper describes the current problems the companies face in a “big data”
environment which includes concurrency handling and query performance. There are various
factors which affect a query's performance, which includes bad data distribution, stale statistics,
server load and uneven system resources. Since this paper is restricted to only the system
resources, an in-depth analysis of system resources and its components will be analyzed in this
research. A database server’s performance is directly related to its underlying allocation of
system resources. Work Load Management (WLM) and each of its features are described in this
paper which gives the reader a clear notion of how a query's performance is altered using various
mechanisms. The paper describes the current performance problems that exist on the traditional
database servers and how the Work Load Management components can be tweaked along with
the predefined system configurations to process a query to run faster on a Netezza machine.

3
Acknowledgement
Though the following paper is an individual work, I could have never reached the heights
without the support, efforts and guidance of certain people.
First and foremost, I would like to thank my advisor and mentor Dr. Jim Q Chen for
providing me endless guidance throughout the project tenure.
I would like to thank and express my deepest gratitude to my mentors Dr. Susantha
Herath, Dr. Jim Q Chen, Dr. Dennis Guster, and Dr. Tirthankar Ghosh for all their support,
encouragement and guidance throughout my tenure at St. Cloud State University.
This project could not have been completed without tremendous support from my
colleagues at workplace who have come across a long way in supporting and assisting me at
every step. It is with their strong knowledge, motivation and vast experience I have acquired
enough notion to explore the overall scope of the project.
Finally, I would like to thank my family and all my friends for the continuous support
and encouragement without whom I could not have come this long way.

4
Table of Contents
Page
List of Tables ............................................................................................................................ 6
List of Figures ........................................................................................................................... 7
List of Acronyms ...................................................................................................................... 9
Chapter
I. INTRODUCTION ........................................................................................................ 10
Overview ................................................................................................................. 10
Problem Statement .................................................................................................. 11
Nature and Significance of the Problem ................................................................. 12
Objective of Paper................................................................................................... 12
Study Questions ...................................................................................................... 13
Limitations of the Study.......................................................................................... 13
Summary ................................................................................................................. 13
II. BACKGROUND AND REVIEW OF LITERATURE ................................................ 15
Introduction ............................................................................................................. 15
Background ............................................................................................................. 15
Literature Review.................................................................................................... 16
Literature Review Related to Methodology ............................................................ 18
Summary ................................................................................................................. 29
III. METHODOLOGY ....................................................................................................... 31
Introduction ............................................................................................................. 31

5
Chapter Page
Design of the Study ................................................................................................. 31
Concurrency ............................................................................................................ 40
Workload Management (WLM) ............................................................................. 41
IV. DATA PRESENTATION AND ANALYSIS .............................................................. 62
Introduction ............................................................................................................. 62
Data Presentation and Analysis .............................................................................. 62
V. IMPLICATIONS, CONCLUSION, AND RECOMMENDATIONS .......................... 81
Introduction ............................................................................................................. 81
Implications............................................................................................................. 81
Conclusion .............................................................................................................. 85
Future Work ............................................................................................................ 86
References ................................................................................................................................. 88
Appendix ................................................................................................................................... 90

6
List of Tables
Table Page
1. Netezza SQL Commands for Displaying Privileges ..................................................... 37
2. Query Priority Levels .................................................................................................... 45
3. Netezza Machine Models .............................................................................................. 58
4. GRA Compliance Settings ............................................................................................ 69
5. Short Query Bias System Configuration Parameters .................................................... 77

7
List of Figures
Figure Page
1. IBM’s massively parallel processing architecture ........................................................ 19
2. Netezza Software Components ..................................................................................... 20
3. Software Architecture ................................................................................................... 21
4. Concurrent Query Resource Allocation ........................................................................ 21
5. Workload Management Structure ................................................................................. 27
6. Netezza TwinFin Architecture ..................................................................................... 31
7. NzAdmin Tool Interface – Query Explain Plan ........................................................... 39
8. “nzsqa schedqueues”–1 ................................................................................................ 51
9. “nzsqa schedqueues”–2 ................................................................................................ 52
10. NzAdmin Tool Interface ............................................................................................... 53
11. NzAdmin – Netezza Hardware Specifications ............................................................. 53
12. NzAdmin – Netezza SPU Specifications ...................................................................... 54
13. NzAdmin – Netezza SPU Details ................................................................................. 55
14. Netezza Web Interface ................................................................................................. 56
15. Aginity Workbench ...................................................................................................... 57
16. User and User Group Information ................................................................................ 64
17. “resource_misc_grp” Group Information ................................................................... 64
18. Resource Groups ........................................................................................................... 64
19. “nzsqa schedqueues” Output........................................................................................ 65
20. “nzsqa schedqueues” GRA Output .............................................................................. 66

8
21. Job Max Information..................................................................................................... 67
22. User Groups Priorities................................................................................................... 68
23. GRA System Registry Configurations .......................................................................... 69
24. NzAdmin Resource Allocation Performance ................................................................ 71
25. Resource Allocation Performance History ................................................................... 71
26. Resource Performance Graph ....................................................................................... 72
27. Resource Group Priorities ............................................................................................. 74
28. Short Query Bias System Registry Configuration ........................................................ 77
29. Create Scheduler Rule................................................................................................... 78
30. Current Scheduler Rules ............................................................................................... 78
31. Query Pending State ..................................................................................................... 79
32. Drop Scheduler Rule ..................................................................................................... 80
33. GRA Performance Summary ........................................................................................ 83
34. GRA Performance History ............................................................................................ 83
35. Short Query Bias System Registry Configuration ........................................................ 84
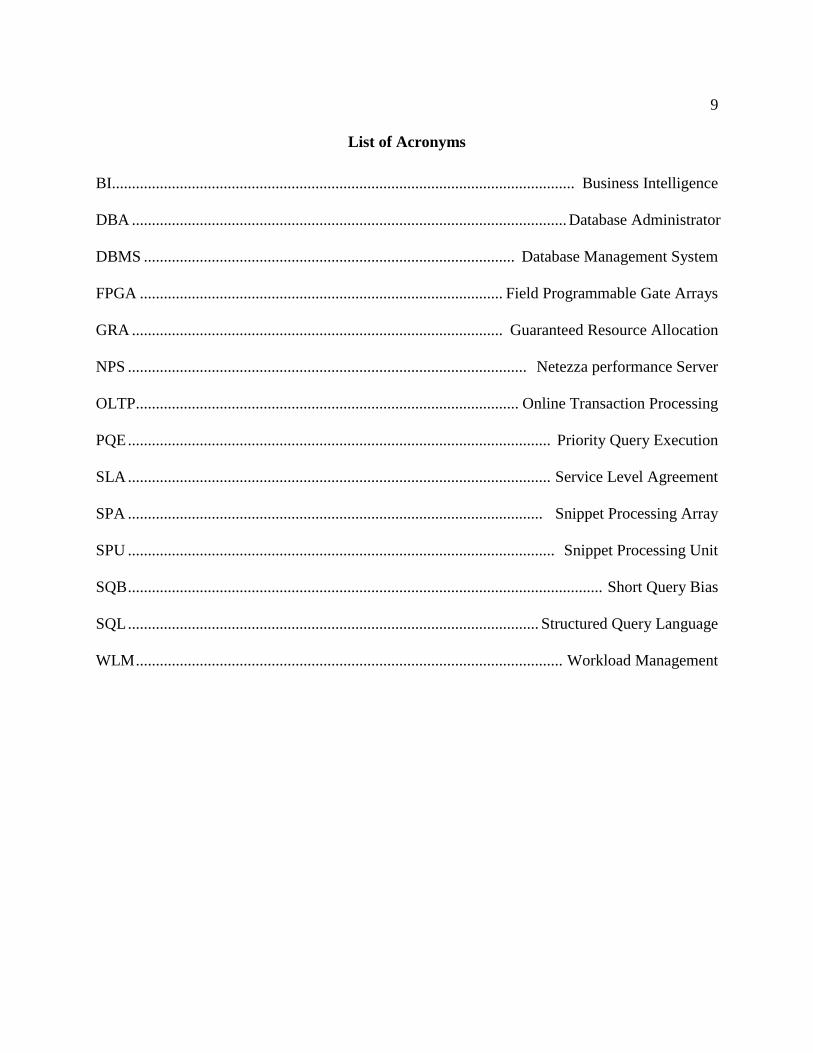
9
List of Acronyms
BI.................................................................................................................... Business Intelligence
DBA ............................................................................................................. Database Administrator
DBMS ............................................................................................. Database Management System
FPGA ........................................................................................... Field Programmable Gate Arrays
GRA ............................................................................................. Guaranteed Resource Allocation
NPS .................................................................................................... Netezza performance Server
OLTP................................................................................................ Online Transaction Processing
PQE .......................................................................................................... Priority Query Execution
SLA .......................................................................................................... Service Level Agreement
SPA ........................................................................................................ Snippet Processing Array
SPU ........................................................................................................... Snippet Processing Unit
SQB ....................................................................................................................... Short Query Bias
SQL ....................................................................................................... Structured Query Language
WLM ........................................................................................................... Workload Management

10
Chapter I
INTRODUCTION
Overview
The challenge for any data warehouse environment is to access and process large
volumes of data in a very short span of time. Apart from leveraging hardware components there
is always a need to tweak the system resources in order to have the database groups and users
achieve the edge to gain more performance. There are a few traditional databases which provide
good support in handling large amount of data. But the question is how much volume can these
databases accommodate and how well does the query optimization and execution is carried out.
Healthcare and banking industries often come across hassle situations where in the database
freezes or corrupts because of the large volumes of data being processed at the same time.
Database Administrators are required to work round the clock to tune system configurations and
resources. In order to address these issues, Netezza was developed in the year 1999 by Foster
Hinshaw and Jit Saxena. International Business Machines Corporation (IBM) acquired the
product in the year 2010 for $1.7 billion (IBM, 2010a).Netezza is now a part of IBM’s
PureDataSystemsTM
family (IBM, 2010b). Netezza is also known as PureDataTM
System for
Analytics. Netezza provides faster response to business users compared to the current traditional
databases in the market. With simple deployment, no additional tuning, minimal maintenance
and creative optimization technique, Netezza stands out among other competitors. Netezza
supports Hadoop, Java, C++, Python and MapReduce programming models. Netezza’s customer
base is widely spread across the globe which is estimated to be about 500+ clients. It is estimated

11
that Netezza provides 10-100 times greater throughput compared to Oracle with minimal amount
of tuning required when compared to Oracle.
Improper utilization of system resources can lead to significant problems. It is always a
challenging task for a database administrator to allocate and adjust the numerous system
resources to a job or a user group with a strong justification. In this paper, the features of
workload management are reviewed along with the various methods to address the performance
issues by implementing more than one workload features in parallel.
Problem Statement
With the growing size of users and data there is always a need to address and adjust the
resource management of a database server. Companies are thriving to achieve a better
performance each day with minimal amount of tweaking and monitoring. Inefficient workload
management is the biggest concern the conventional databases servers face today. Database
Administrators are required to put in extra efforts due to the change in system catalogs and
database size. Performance of a database server is directly related to the allocation of system
resources. The better the resources are allocated the better the database server performs yielding
faster run time of a query. Netezza comes with a handful amount of enriched workload
management features which provides throughput incredibly faster than current conventional
DBMS. One needs to know the right combination of implementing the workload features. This is
based on several factors ranging from application teams, data volume, number of users and
resource groups, performance factors etc.

12
Nature and Significance of the Problem
Inadequate planning of utilization and allocation of system resources leads to a disaster in
a database server. Queries submitted to the server are of various sizes and complexity. With no
workload management configured each query obtains same share of system resources, termed as
‘fair-sharing model’ (IBM, n.d.b). System resources are divided equally based on the number of
active jobs running given that each job has equal priority. However, the drawback in having such
a model arises when there is no predefined feature to set priorities. With no priorities set each
query gets the same share of resources. This can cause a huge drawback to any data warehouse
environment when you have analytic operations running concurrently along with the user
submitted jobs. Higher priority queries should grasp an extra edge in performance and system
resources. Conventional database system fails to produce that extra edge in performance due to
the lack of workload management features and an inadequate variety of system configurations.
This can cause a delay in missing business SLA’s. This is a huge loss in terms of time and
money for a company, where additional efforts are required to put in to achieve a performance
gain.
Objective of Paper
The objective is to lay out the role of Netezza’s workload management features along
with the predefined system configurations it comes with. In this paper, a brief explanation is
provided on how the performance of a query can be improvised by tweaking and mixing the
system configurations along with the work load management parameters to make a complex
query run faster.

13
Study Questions
Upon completion of this paper, the following questions can be answered and explained
on how the workload management feature can leverage the performance of a query.
1. How can the workload management feature enhance the Netezza system to handle
concurrent queries of various complexities without hassle?
2. The tools and bash scripts required to configure the workload management and how
the predefined system configurations can be tweaked on the lines of workload
management to achieve improvised performance?
3. On what basis the workload management features needs to be assigned and allocated
to? How the workload management is configured based upon the role of a database
user or a database group?
Limitations of the Study
This paper is limited to only the design and study of workload management features
along with server performance, though a brief explanation will be covered on data design and
maintenance. The project results and conclusions cannot be generalized to all kinds of data
warehouse environments since the factors and attributes vary for different companies.
Summary
Companies are thriving to adapt and set up “big data” environment but fail to reach the
end users expectation. This could be either due to bad data architectural planning or bad
configurations on their database servers. Inadequate features and lack of predefined system
configurations are the biggest drawbacks in the current conventional DBMS models. The

14
following chapter explains the problems and drawbacks of the current conventional database
servers.

15
Chapter II
BACKGROUND AND REVIEW OF LITERATURE
Introduction
Database servers are expected to meet the needs of the business, market and end users by
providing tremendous performance. Since, companies are moving towards “big data” technology
to support larger audience there is always a need to have a performance enriched data warehouse
server running behind to accommodate the needs of end clients. A traditional database server is
capable of handling gigabytes of data, providing a minimal amount of performance. This is due
to the restricted amount of predefined configurations and parameters the servers are equipped
with. A traditional database server cannot match up the performance of a data warehouse server
running on a massively parallel asymmetrical engine.
Background
A data warehouse environment needs to be configured with high end hardware
components and high performance software programs to make it run faster and also capable of
handling large volumes of data with no repeated problems. Netezza is capable of handling
concurrent queries of various complexities. Current traditional database servers lack the ability to
handle large number of concurrent queries at any given time, resulting in a server crash, loss in
time, value and money. Businesses today are shifting more and more towards data warehouses
providing multiple parallel processing (MPP) architecture because of the multiple jobs being run
on the data warehouse appliance concurrently.
Current traditional database servers lack the ability to produce potential performance.
Inefficient and limited workload management features and lack of system configuration

16
parameters are the biggest reasons. With no workload management enabled, and having
concurrent queries running, there is always a possibility of network congestion resulting in loss
of time. This is a very big drawback and loss to any company wherein activities and jobs are run
round the clock against a data warehouse system. Netezza, unlike other conventional database
servers provides 10-100 times faster query response by providing 5 level workload management,
which includes the gate keeper, the guaranteed resource allocation, the snippet scheduler,
scheduling rules and the resource allocation scheduler. In addition, there are other features and
configurations – priority query execution, and short query bias, which IBM provides to enhance
the workload management of a Netezza server much more effectively.
Literature Review
Most researchers have considered dealing performance issues through resource tweaking
which involves tuning the memory and swab space on a disk or a storage unit. Performance
issues were dealt manually rather relying on the workload management policies. Benoit (2000)
proposed a model which illustrates how the performance of a database system can be impacted
by tuning the available resources. Tweaking system resources based on the business needs and
priorities can largely impact the SLA’s. The model also states the interdependency relationship
among various resources in a database system. The aim of demonstrating such a model is to
enhance the overall functionality and performance of a database system by tweaking the system
configurations and resource parameters.
Various attributes contribute to the overall performance of a database system which
includes both software and hardware. A database administrator is responsible to track the
performance of a system by tuning system configurations and resource parameters at various

17
levels. Weikum, Hasse, M¨onkeberg, and Zabback (1994) described the factors which contribute
to the performance of a system and how they can be measured. The research paper describes
tweaking the parameters at various levels of a database system including system configurations,
workload management policies, resource parameters adjustments, database level configurations,
application configurations and operational parameters.
Concurrent queries on any database system are limited in number. It is critical to
hardcode the number of concurrent sessions that can run on a database system in order to avoid
congestion, thereby, affecting performance and throughput. Since each concurrent query shares
the available amount of resources while running, it is always important to set priorities to a query
wherein the higher priority query is allocated more resources than the other active queries.
Schroeder, Harchol-Balter, Iyengar, and Nahum (2006) built a model which states each SLA
designed for a business requires having a query response time criteria to be specified. For a large
data warehouse environment, there is large number of users connected at any given time running
concurrent queries of various complexities. With no dynamic allocation and continuous
tweaking, performance can be impacted slowing the query runtime eventually affecting the
business. To achieve performance and throughput, Schroeder et al. (2006) stated that a feedback
control loop is designed to dynamically tweak the number of active concurrent sessions by re-
allocating the available system resources and re-assigning the priorities.
The problem with such theories and research is that only the resource management is
considered as a factor for performance. There are other factors which need to be considered such
as killing bad queries which abuses databases and system resources. Such queries need to be
addressed and re-written. Apart from this, the above works are restricted only up to OLTP. We

18
do need to consider SAS and BI if we are illustrating the same research from a data warehouse
environment point of view.
Literature Review Related to Methodology
Databases servers have come along a long way over the years due to the increase in the
volume of data, concurrent users, business needs, business urgencies, and real time analytics. In
order to meet the success requirements, new workload features have been implemented and the
existing ones were carved repeatedly to make the database servers perform more efficiently.
Workload is the concept of running the daily scheduled jobs such as SQL queries, data loads, and
maintenance jobs along with a few system triggered action jobs. Assessing a workload is called
workload management. In the below sections, a brief explanation is covered about the workload
management aspects on traditional DBMS followed by workload management and resource
management on a netezza appliance, illustrating each workload management feature. The last
section summarizes the entire scenario of workload management and how it has evolved over the
years and the best practices to implement it.
PureData System for Analytics: Design
Data loaded into a netezza machine is run through multiple snippets before finally
settling on the storage disks. Data stored in a netezza machine is of compressed format. Resultant
data retrieved from tables on a regular basis are usually stored in a cache memory using a smart
algorithm. This is to boost the performance of the netezza machine by returning results directly
from the cache memory instead of requiring disk storage access. Field Programmable Gate
Arrays (FPGAs) are known as the core components of a netezza machine. Netezza is designed on
the lines of Asymmetric Massively Parallel Processing™ (AMPP™) architecture consisting of

19
multi-core CPUs. These CPUs combined with FPGA Accelerated Stream Technology (FASTTM
)
boosts the system to run 10-1000 times faster than the traditional DBMS machines. FAST
engines’ running in parallel uncompresses and filters the data which is irrelevant to the query.
The relevant data is served through the multiple CPU cores which run in parallel.
Figure 1. IBM’s Massively Parallel Processing Architecture (IBM, n.d.a)
FPGA is considered as the heart of the netezza system due to its ability to produce
tremendous performance. FPGA acts as an auxiliary CPU to a netezza system. Similarly, there
are multiple FPGA engines which process data at a very high speed thereby providing
throughput incredibly faster. FPGAs can be (re)configured dynamically. Each FPGA engine
performs filter and transformation mechanisms which assist in performance boost. FPGA engine
consists of three components–Direct Memory Access (DMA), Compress Engine (CRC check),
and filter and transformation functions.
Filter and Transformation Functions. The filter and transformation functions
compromise of the following components.

20
Compress Engine: Responsible in compressing and decompressing the data during
processing to and fro disks. Due to this, the performance of a netezza system is
boosted further by four to eight times the average performance.
Filter Function—Project and Restrict Engine: Filters out irrelevant data based on the
“select” and “where” clauses in an executed query.
Visibility Engine: Plays a key role in maintaining ACID properties at faster speeds.
Filters out the irrelevant data. Data relevant to the query is only visible.
Figure 2. Netezza Software Components (IBM, n.d.a)
Software components of a Netezza system include:
Multiple optimizers running in parallel to ensure queries are running efficiently and
that each node is fully occupied with a task.
A smart scheduler which is capable of providing maximum throughput irrespective of
how busy the system is.
Snippet processors which are responsible to analyze and run queries.
A network channel to move the data across the appliance at streaming speeds.

21
Figure 3. Software Architecture (IBM, n.d.a)
Figure 4. Concurrent Query Resource Allocation (IBM, n.d.a)

22
PureData System for Analytics: Workload Management
In a data warehouse environment where there are concurrent jobs running round the
clock, there is always a need to have smart configured workload settings which is capable of
providing real time analytics with no hindrance to user jobs. In implementing the workload
management on a DBMS server, e.g., Oracle Database Resource Manager, Microsoft SQL
Server Resource and Query Governor, IBM DB2 Workload Manager, Teradata Active System
Management, there are certain key factors one needs to consider.
Performance criteria based on business requirements.
Segregate and identify user initiated jobs.
Implications of workload management over queries.
Performance criteria and business compliance. Jobs submitted to a Netezza system are
assigned with a minimum amount of system resource along with other attributes pertaining to
performance and business needs. There is a wide range of queries submitted to a database server
ranging from user initiated jobs, application initiated jobs, business priority jobs, and system
initiated jobs. The performance of each query is generated based on the implications of
workload features it needs to run through along with the priorities set by the business. Based on
the SLA’s set by the business and end-clients, the workload needs to be tweaked to adjust the
runtime of a query. Performance of a query can be asserted through the following metrics: (a)
query runtime, (b) throughput, and (c) query runtime velocity.
Runtime of a query is the elapsed time duration from query submission to query
completion. Throughput is defined as the number of requests completed in a defined unit of time.
Query Runtime Velocity is defined as the execution speed of the query irrespective of server

23
status (idle or busy). This is calculated as a ratio of average query runtime to the actual time the
query ran in the system. Based on the result outcome, the delay factor can be calculated for a
respective query. If the ratio is closer to 0, it indicates a drastic delay in performance. Various
factors contribute to a delay in performance levels–high priority queries running concurrently,
bad workload management, disk storage space issues, poor memory allocation design etc.
Based on the priorities set by the business, higher priority queries generating business
revenue are allocated with large amount of memory resources. These queries take precedence
over the rest of the queries running concurrently in the system. Queries submitted to the system
are allocated with the available system memory resources and a priority factor based on the
importance it has for the business. The workload parameters and system configurations defined
on a database server contribute towards the performance of each query submitted to the system.
These parameters control the behavior of a query from the point it gets submitted to the system
until the result execution time. Workload rules defines the amount of available resources a query
needs to be allocated when it is submitted on a system along with the priority of a query.
Each query or job submitted to a system is defined as work and a group of such is termed
as workload. Performance of a query or a workload is usually calculated in terms of percentiles
or ratios. In simple terms, it is defined as the x% percent of queries in a workload running in y
units of time. Queries submitted by the business are usually of high priority and are expected to
attain a higher value of x% with respect to smaller y value in time metrics. Apart, other non-
business/non-critical queries are usually not set with any performance policies since they do not
implicate any business needs. Hence, they do not need to be tagged with a higher priority.

24
Furthermore, scheduling rules comes into place to set restriction on the allocation of memory
resources for non-critical queries or workloads (Chen et al., 2008).
Identify and segregate user initiated jobs. Jobs submitted to a system needs to be
identified and segregated based on the nature of the query as well as its impact on business or
end-user. Queries with higher priority needs to be addressed at first place since they are the one
generating revenues for business. Any factors causing hindrance to such high priority queries can
cause a huge negative impact on business. Workload rules are configured to identify the jobs
submitted to the system. Based on the query attributes workload management policies kicks in
(Chen et al., 2008). Various attributes of a query contributing towards the priority assignment
depends on the user who submitted the query, group name the user belongs to, against which
database and objects the query is running against, rowset return, and impact on business. Any
query submitted to the system will need to be identified and assigned a priority based on the
business needs and SLA’s set by the business. Queries prioritized based on business needs are
supposed to be run at schedule times and in a stipulated amount of time. Non-critical queries are
supposed to be run during the times the system is idle or little busy.
Queries submitted to the system are supposed to be grouped into workloads based on
priority levels and attributes of a query. This gives a clear picture with the amount of system
resources an entire workload is running on a system, thereby providing visibility (Chen et al.,
2008; Microsoft Corp., 2015). Using user-defined rules and policies, similar queries can be
grouped together to run under a single workload. Query commencement and query type
contributes towards the key factors in deciding if they come under a single workload. This
depends on who is initiating and running the query such as user name, application name,

25
application type, and session ID. Apart, it also depends on the query characteristics. Query
characteristics include the type of SQL query a user is running, estimated costs, skew factor.
Implications of workload management over queries. A query submitted to a database
system undergoes through the workload policies before the execution phase begins. A query
submitted to the system is allocated system memory out of the available resources followed by a
priority level (low, medium, high, critical) tagged to it. Workload management involves three
different types of controls – admission control, scheduling control, and execution control
(Krompass, Kuno, Dayal, & Kemper, n.d.; Krompass et al., 2008). Each of the workload controls
have system configurations pertained to it. These system configurations can be modified based
on the business needs and criteria.
Admission control acts as a gatekeeper to a database system which determines if a submitted
query needs to be passed on to next phase or not. This is to avoid the network and database
congestion. A query submitted to a database system undergoes through the workload
management policies before moving into the execution phase. Optimizer plays a key role is
calculating the estimated cost of a query. The workload management determines if the given
query submitted is a long running or a short query (<2s runtime). Short queries are assigned with
a reserved amount of memory resources when it is run in concurrency with large complex
queries.
The next set of workload management control, scheduling control, determines the similar
requests of queries and bundles them into a single workload. Based on the priority levels,
workloads are created and queued. The workload management policies decide which queries or
jobs needs to be sent for execution. It is the responsibility of the database server’s workload

26
management to keep the system in optimal state and meet the business SLA’s. In order to meet
this requirement, the scheduling mechanism needs to determine the attributes of a query such as
query characteristics, query priority, estimated cost of a query, resource allocated to the query. A
database system’s threshold is responsible in maintaining the overall health of a system. If the
threshold is too high, the system is over utilized and underutilized if the threshold is too low. The
number of concurrent sessions needs to be defined in order to gain control over the queries that
can run in parallel. The maximum value on a Netezza system for this is 48.
Execution phase controls the runtime attributes of a query. The workload management
policy under this phase dynamically controls the running query to restrict its impact on the
system and other concurrent queries. It is the primary responsibility of the execution phase to
determine the availability of system resources to allocate the newly submitted queries. Re-
allocation of memory resources occurs when an existing running query completes.
Workload Management Structure
Over the years’, workload management has come along a long way in adding new
parameters and reconfiguring the existing ones to enhance the overall functionality and
performance of a database system. This section covers the brief illustration of the components of
a workload management.

27
Figure 5. Workload Management Structure (Zhang, 2014)
Workload Characterization–Provides vital information about workload (queries and
jobs) to its controllers and sub-ordinates. Information related to costs, resources,
demands, business priorities, business SLA’s, and performance metrics are passed on
to controllers.
o Static Characterization–This type of workload is usually observed in
traditional database systems where in the system resources are allocated
before the requests are arrived.
o Dynamic Characterization–Dynamically identifies the arriving workloads and
allocates shared system memory based on the arriving loads.
Admission Control–Restricts the number of concurrent sessions running against a
database system. This helps in maintaining ideal throughput and adequate allocation
of available resources. If more number of connections are accepted, beyond the
defined threshold value, the throughput of a system decreases marginally.
o Threshold Based Admission Control–Defines the threshold parameter above
which no query is allowed to submit and execute on a database system. The

28
threshold parameters can be defined in terms of estimated query cost, query
runtime, session runtime, and concurrent sessions.
o Prediction Based Admission Control–Predicts the behavior of a query before
it is submitted to a database system. Based on a query’s behavior – type of the
query, estimated cost of the query, query runtime, performance of a query can
be calculated.
Scheduling–Scheduling mechanisms acts as a gatekeeper to a database system. It is
responsible to schedule the order in which the new requests are supposed to be
arrived. Based on the priority of new requests, higher priority queries are scheduled to
be submitted first followed by the medium and low priority requests.
o Query Management–Execution order of a query is based on the attributes of a
query that is submitted on a database system. After passing through the
admission control mechanism, the similar queries are piled together into a
single workload based on the attributes.
o Query Restructuring–Breaks down a large complex query into smaller pieces
and executes them in a scheduled order. In this way, large queries will not
have to rely on shorter queries and vice versa.
Execution Control–Places control mechanisms on different workloads to execute
concurrent requests without being biased to any of the active requests.
o Query Cancellation–Process of killing an active query that is currently
running on a database system. Killing an active query releases the system
resources allocated to the query.

29
o Request Suspension–Slows down or suspends an active request’s execution.
Query Suspend and Resume–Any active query can be suspended or
killed, and the intermediate results are stored in a cache memory. The
suspended query can be scheduled to run at a later time during off
business hours. In this way the resource is reallocated to higher
priority queries.
Request Throttling techniques–holds the same functionality as the
previous subclass mechanism except that this functionality does not
suspend an active request rather it pauses it there by releasing network
bandwidth. CPU usage and I/O bottlenecks can be diagnosed using
this subclass functionality.
o Query Re-prioritization–Dynamically adjusts the priority of a query in the
middle of running state thereby resulting in resource reallocation of system
memory. High priority gets higher amount of shared available system
resources compared to low priority requests. Business requests submitted to a
system can be dynamically tweaked to alter the priority based on the SLA.
Summary
In this chapter, some brief concepts were introduced about the workload management and
its background. This chapter also covered the critical components of workload management
policies including Performance criteria based on business requirements, Segregate and identify
user initiated jobs, and Implications of workload management over queries. The existing (and
previous) research works are still insufficient in diagnosing a performance issue on a database

30
system. The previous works are limited to resource management and priority execution and does
not talk about how a bad query abusing a database is supposed to be dealt. Despite having
dynamically changing resource management and priority optimization, it is often the bad queries
that affect the performance of a system. Troubleshooting a bad query, either re-writing or killing
it can cause adverse effects on a database system.

31
Chapter III
METHODOLOGY
Introduction
A Netezza server is bundled with server, database and storage unit into a single
architectural system. Netezza is upgraded by leveraging its hardware unlike other traditional
databases wherein software is upgraded. It is capable of providing rapid results claiming to be
10-100 times faster than Oracle and this is because of the server’s asymmetric massively parallel
processing (AMPP) architecture along with the efficient use of five level workload management
features it offers. Going through the paper an in-depth description is explained about the
workload management along with an introduction to netezza’s concepts and theories in addition
to the usage of various syntaxes and tools the server supports.
Figure 6. Netezza TwinFin Architecture
Design of the Study
In this section, a brief explanation is driven about the core components of a netezza’s
TwinFin architecture. Netezza’s released its TwinFin model in the year 2009 as an advanced
32
model of its previous machine, Mustang. In the following year, 2010, Netezza released a new
model, skimmer, as a trimmed down version of TwinFin. Since the TwinFin release Netezza has
opened up about supporting programming languages such as JAVA, C, C++, Hadoop and R.
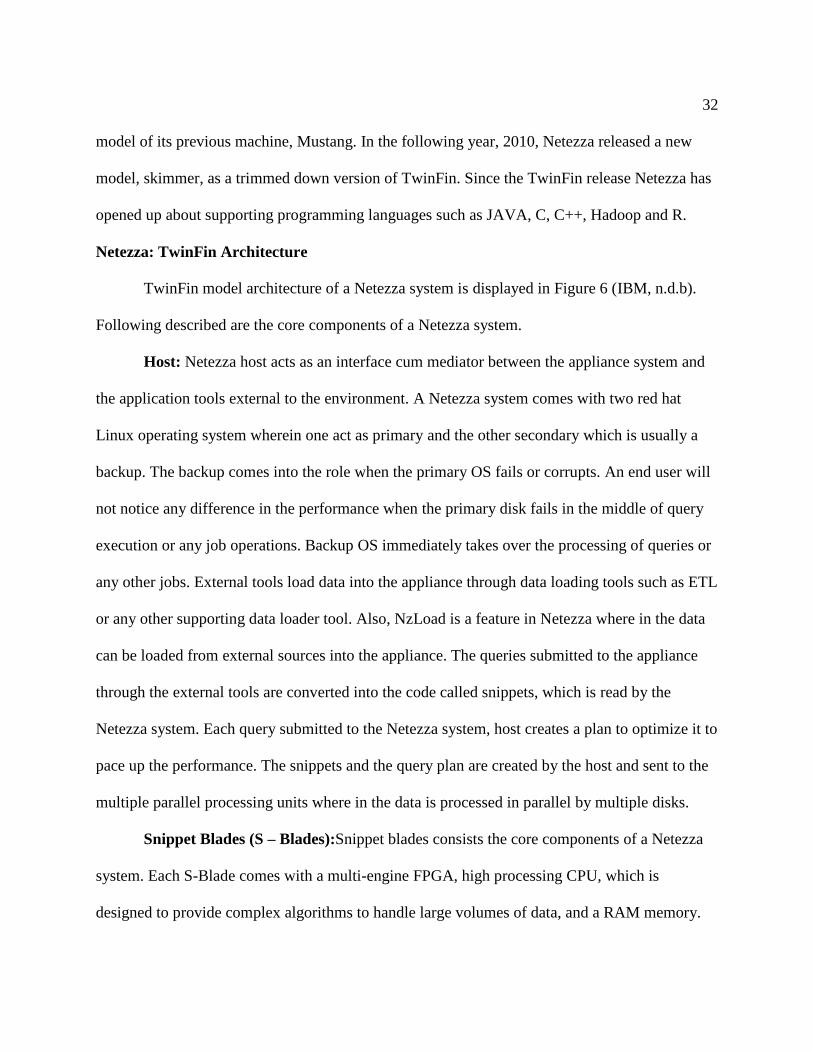
Netezza: TwinFin Architecture
TwinFin model architecture of a Netezza system is displayed in Figure 6 (IBM, n.d.b).
Following described are the core components of a Netezza system.
Host: Netezza host acts as an interface cum mediator between the appliance system and
the application tools external to the environment. A Netezza system comes with two red hat
Linux operating system wherein one act as primary and the other secondary which is usually a
backup. The backup comes into the role when the primary OS fails or corrupts. An end user will
not notice any difference in the performance when the primary disk fails in the middle of query
execution or any job operations. Backup OS immediately takes over the processing of queries or
any other jobs. External tools load data into the appliance through data loading tools such as ETL
or any other supporting data loader tool. Also, NzLoad is a feature in Netezza where in the data
can be loaded from external sources into the appliance. The queries submitted to the appliance
through the external tools are converted into the code called snippets, which is read by the
Netezza system. Each query submitted to the Netezza system, host creates a plan to optimize it to
pace up the performance. The snippets and the query plan are created by the host and sent to the
multiple parallel processing units where in the data is processed in parallel by multiple disks.
Snippet Blades (S – Blades):Snippet blades consists the core components of a Netezza
system. Each S-Blade comes with a multi-engine FPGA, high processing CPU, which is
designed to provide complex algorithms to handle large volumes of data, and a RAM memory.

33
Overall, snippets are the processing nodes where in the query optimization takes place and the
jobs are split into multiple lines and processed by each of the MPP engines. On a TwinFin
appliance, there are eight MPP nodes. Each MPP node consists of 2GB RAM, one FPGA core,
and one CPU processor core. Query processing and optimization takes place on each of these
snippets by the FPGA. Queries received by the Host are forwarded to these snippet processing
units (SPU) for query execution and optimization. A SPU is a combination of the memory units
ALONG with the FPGA. Unification of all the SPU’s on the appliance is called Snippet
processing Array (SPA).
Disk Enclosures: Large volumes of data loaded into the appliance finally end up in to
disk storage. Each disk is RAID protected and is connected to the S-Blades through a network
stream. Each SPU has a hard drive storage space to accommodate data, which is otherwise called
as data slice. Data is split on these data slices based upon the distribution key. A distribution key
is a column in the table definition. The data loaded on to the primary disk is copied on to the
mirror (aka secondary) disk. Replication of data ensures that if the primary disk fails, then the
secondary disk can act as primary until the primary is resolved.
Network Fabric: The Netezza appliance comes up with a Network fabric which connects
all the components in the appliance. The bandwidth of the network is high enough to
accommodate a thousand nodes with no difference in performance drop even when each and
every node is communicating and transferring data among themselves. Network fabric runs a
customized IP based protocol.
34
Netezza: Features and Benefits
Following described are the features and benefits of the Netezza system over other
current conventional data warehouse appliances.
Speed: The Netezza System for Analytics, is said to provide 10-100 times faster response
to query execution and other performance aspects, with about 128 gigabytes per second scan
rate. This is because of netezza’s asymmetric massively parallel processing (AMPP) architecture
which is capable of running multiple jobs concurrently, thereby providing rapid response to the
end clients without any hassle. Field Programmable Gate Arrays (FPGA) is the heart and brain of
Netezza system which filters the data apart from making sensible and smart decisions to improve
the overall performance of the system. Over the years, Netezza has come up with various models
with much rapid growth in performance. Of late, IBM has come up with a new algorithm –
Directed Data Processing algorithm, integrating it with the Netezza system, thereby achieving a
throughput of about 20 times greater than the previous Netezza models.
Simplicity. Netezza provides faster performance with no indexing or tablespaces
required. Also, Netezza does not rely on the key constraints. As said earlier, Netezza system in
ready-to-go state can be immediately started with taking up jobs and query execution thereby
providing instant responses to the clients’ right away. Netezza system easily integrates with the
BI tools and other data loading tools such as ETL through netezza’s supporting interfaces, JDBC,
ODBC and OLE. Netezza supports redundancy of data, wherein failures of one of the nodes or
disk will not impact system’s performance. Netezza does not require any additional tuning to the
hardware components.

35
Scalable. Based on the size of the environment required to build a database to store large
amounts of data, Netezza is capable of providing great response irrespective of the volume of
data being loaded or stored on the appliance. A Netezza appliance holds server storage space
ranging from 8 terabytes to 300 terabytes. Also, additional system can be deployed without any
hassle if data volume increases beyond the initially installed server. As said earlier, minimal
amount of administrative tasks are required to maintain a Netezza system, therefore loading large
amount of data into the storage unit will not affect the performance nor will require any
additional tasks to be performed.
Netezza: Users and Objects
Netezza system by default has a database user and a group – ADMIN and PUBLIC
Administrator, also, is the super user of a database who has all the privileges right from creating
databases to granting/revoking object privileges on a user. Admin has access to all the objects on
a database server. An administrator has several responsibilities for carrying out various tasks and
managing them altogether efficiently like managing databases, backing up/restoring databases,
providing access control.
Always advisable to create a service account for the database administrators who have all
the admin level privileges. Usage of the ADMIN account for database object deployment is not
permissible unless the job activity is critical which involves system related activities. Any object
deployed by the database administrators on a database should be under the ADMIN account.
Once the object is deployed, ALTER the owner to admin. Queries run by admin occupy at least
50% of system resources.

36
By default, user is allocated to the PUBLIC resource group. The name and attributes of a
PUBLIC group cannot be altered. ADMIN owns the group PUBLIC. Each user has a limited set
of permissions. Database groups are created and permissions are granted to the group and the
users who require a similar set of permissions are added on to a single group rather than granting
permissions to each user explicitly. In Netezza, the users are usually authenticated using LDAP.
Admin user always uses local authentication.
➢ Create User using LDAP authentication
CREATE USER MMUDDU; CREATE USER MMUDDU WITH PASSWORD ‘MMUDDU’;
➢ Create User using LOCAL authentication
CREATE USER MMUDDU WITH PASSWORD ‘MMUDDUNYBOY’ AUTH LOCAL;
User or group attributes can be altered using the ‘ALTER’ syntax; also the admin can drop a
group or a user using a simple ‘DROP’ command.
Netezza: Security Model
The security model illustrates the level of privileges a user is assigned to. Typically, there are
two types of privileges—administrative level privileges and objects level privileges.
Administrative level privileges include creating database objects and execute global
objects. Object level privileges are restricted only up to a particular object like a database, a table
and so on. A database user inherits the access level privileges from a database group they are
assigned to, provided the group has been granted the necessary privileges. In simple terms,
permissions granted to a group are allocated to the users belonging to the group. It is not a good
practice to grant/revoke permissions to a user explicitly when the user belongs to a database
group.

37
Table 1
Netezza SQL Commands for Displaying Privileges
Authenticating using LDAP. User authentication is either ‘local’ or LDAP
authentication. Under local authentication, password needs to be defined while creating a user.
CREATE USER MMUDDU with PASSWORD ‘Bikerboy’ AUTH LOCAL;
Netezza admin has the privileges to alter the login credentials of any ‘local’ authenticated
user. In LDAP authentication, Netezza admin need not define any user password while creating a
database user.
CREATE USER MMUDDU;
Netezza has an inbuilt centralized LDAP server that authenticates any newly created
database user. Netezza system adopts Pluggable Authentication Module (PAM) to authenticate
users on an LDAP name server. LDAP assigned credentials differ from the UNIX account.
Command Description
\du Displays database users.
\dU Displays database users and the groups in which they belong to.
\dpU Displays all the privileges pertaining to a database user.
\dg Displays the database groups.
\dG Displays database groups and the users belonging to each group.
\dpg Displays all the privileges pertaining to a database group.
\dp Displays all the privileges of a database user through direct assigning
or through inheriting privileges from a database group the user
belongs to.

38
In LDAP authentication, the system looks up the system catalog to check the LDAP
authenticated user and returns an error if a user does not exist. Every successful and failed login
attempts on a Netezza appliance is recorded on to a log file which can be found on the UNIX
host machine under /nz/kit/log/postgres/pg.log. The end user sees no difference between local
and LDAP authentication.
There are extensive aspects which include parameter tweaking as well as writing
additional parameters to a LDAP configuration file, but, this is beyond our project scope.
Netezza: Optimizer and Query Plans
Netezza appliance is designed with an inbuilt optimizer which elects the best scenario for
query join operation, the order of join operations and most importantly the regulation of data
between SPUs which in turn decides the best way to distribute data over the SPUs either through
redistribution(HASH or RANDOM) or broadcast. The Netezza planner indicates the criteria the
data is distributed on the SPUs. Netezza planner optimizes a query in a way the larger tables are
not redistributed. This could make an impact on performance. When two or more tables are used
in a join condition, the Netezza optimizer and planner initially checks the validity of the join
conditions inside a given query. A smaller table has to precede a larger table in any join
statement. During data distribution, larger tables are distributed initially followed by smaller
tables. Vice versa would result in a bad skew, which could impact performance and also
improper utilization of available SPU resources.
Planner and optimizer decide the order of tables that needs to be redistributed initially,
although this is based on the size of a table. Optimizer plays a key role in improving the system’s
performance by rewriting queries without any database administrator intervention. A database

39
administrator can do an ‘EXPLAIN VERBOSE’ command on an active running query to check
the criteria planner has chosen to redistribute the data. An admin can check this either through a
query plan file or query explain plan.
Figure 7. NzAdmin Tool Interface–Query Explain Plan
Performance of an optimizer relies on the table statistics. Optimizer plans and runs
efficiently if the table statistics are updated on a regular basis. Stale statistics bring down the
performance of an optimizer. Generate the table statistics when data is loaded onto a table, or
when data is deleted from a table, or when a table structure is altered. Statistics are updated using
the command GENERATE STATISTICS. Statistics can not only be generated on a table, but can
also be generated on a database, and a table column(s). Optimizer relies on the last updated
statistics information to optimize a query. Statistics information is stored in the system catalog
table under the system database. Running statistics generates the count of duplicate values in a

40
column, the maximum and minimum values in a column, unique data in a column and also the
null values.
GENERATE STATISTICS ON TABLE_NAME/DATABASE_NAME;
In order to analyze an active running query following plans are generated.
EXPLAIN PLAN syntax
▪ EXPLAIN PLANGRAPH SELECT * FROM TABLE_NAME;
HTML PLAN syntax
▪ SET enable_print_plan_html=1;
SELECT * FROM TABLE_NAME;
‘SET’ command writes the plangraph output to the /tmp directory on the host machine.
The plan.html file represents a query in the form of a tree with each ‘where’ clause represented
as a single node.
The queries are run on the command terminal. Alternatively, a plan file can looked up on
the netezza admin tool.
Concurrency
Often, large numbers of queries run concurrently at the same time on a Netezza
appliance. Netezza has the capability of handling the multiple concurrent queries running at the
same time. But how many queries can run concurrently is the question here. Netezza has a limit
of 48 concurrent queries. That is Netezza can service all the 48 queries which run at the same
time. However, Netezza commits that the limit of the number of concurrent queries can be
increased if only required. It is important that queries submitted or running concurrently must
run efficiently and meet the end user requirements without any hindrance. On the Netezza host

41
machine, the postgres configuration file (postgres.conf) can be modified to alter the number of
queries an appliance can take up concurrently, but this number cannot exceed 48.
Queries are queued up to wait for the initial queries to run. Queries which are queued up
are in the ‘Active’ state but are waiting for the other queries to finish running. Also, when any
operation is going on a specific table, then any other query having that table name will have to
wait until the former query finishes running. No two queries can run simultaneously on a table.
Often when multiple queries try to run on a single table concurrently then the operation would
result in a SPU swap partition error where the appliance says that the temporary work space is
full. There is no solution for this problem rather an alternative way is to reduce the number of
concurrent queries running or the SQL query has to be rewritten.
Workload Management (WLM)
Queries submitted to a database system will need minimum amount of system resources
to have it run. When you have equally assigned resources to each of the resource groups, priority
needs to be assigned to each user group or to an individual user. This is to give an extra edge in
performance to have the query run faster than the average runtime. Often, there are large
complex queries running round the clock pertained to business needs and criticality. These types
of queries consume large amount of resources and ultimately affects the performance of smaller
(and simpler) queries whose runtime is about a second or less in average. Netezza addresses this
problem with the use of Short Query Bias feature. The following sections drive through the
components of a workload management on a netezza machine.

42
Guaranteed Resource Allocation (GRA) and Resource Sharing Groups (RSG)
Before GRA is introduced, a brief explanation is described on the Resource Sharing
Groups. Resource Sharing Groups unlike access groups have resources allocated to them
disproportionately. Priorities are allocated to the Resource Sharing Groups based on the role the
application is assigned to it. A database user cannot belong to more than one resource group.
Admin possesses several controls over the Resource Sharing Groups such as
● Resource minimum and Resource maximum–Minimum and maximum percentage of
system resources can be granted to a RSG for the queries being run by the users
belonging to a RSG.
● Job Maximum–Number of concurrent queries the users belonging to a RSG can run.
Typically, not more than 48 should be set.
● Querytimeout–Mhe maximum time the queries can run before being kicked out by the
appliance.
● Sessiontimeout–The idle time before session drops.
● Rowsetlimit–Mhe number of rows to be returned on executing a query.
● Defpriority and Maxpriority–Four levels of priority given to a user in a RSG -
critical, high, normal, low.
Often, Resource minimum and Resource maximum are the only options which are set for
the RSGs. Querytimeout should not be set because there are certain queries run by a user which
supposedly return about a billion of rows and this operation will take hours or even days but the
information returned is valuable in some means to the user. Rowsetlimit is also one such option
that is not set by the admin while defining a RSG, because there are certain queries which would

43
return about a million or a billion rows. Job Maximum is left to its default value. And the rest
parameters are used accordingly with respect to the environment the appliance is being used in.
Netezza SQL commands to create a RSG
SYSTEM (ADMIN) => CREATE GROUP DEVELOPERS WITH RESOURCE MINIMUM 50
RESOURCE MAXIMUM 100;
To change the resource minimum of a group to 30% from 50%
SYSTEM (ADMIN) => ALTER GROUP DEVELOPER WITH RESOURCE MINIMUM 30%;
Add user ‘mmuddu’ to the group DEVELOPERS
SYSTEM (ADMIN) => ALTER GROUP DEVELOPERS ADD USER MMUDDU;
For a given RSG, say the resource minimum is defined as 30%, then the group get at least
30% of the system resources irrespective of the other groups or users running queries
concurrently. A RSG cannot receive more than the allocated system resources no matter if it is
the only group (or a user belonging to the RSG) running queries on the Netezza appliance. Say, a
RSG, has Resource maximum defined as 60%, then the maximum resources the group gets is not
more than 60% at any given situation.
The resources parameters can be defined on either through the NzAdmin interface or it
can be done through the Netezza SQL commands.
Once the RSGs are defined, it is now the responsibility of the GRA scheduler to schedule
the plans for different RSGs on the Netezza appliance. GRA is enabled by default on a Netezza
server but it does not come into effect until the resource groups are created and defined with their
respective minimum percentage allocations.

44
GRA setting can be found on the Netezza system registry settings. GRA can be
enabled(if disabled) or disabled using the Netezza ‘nzsystem set’ command by changing the
value of host.schedGRAEnabled setting to yes, for enabling and no, for disabling GRA.
On each group, the GRA maintains the list of short and long queries. Every RSG has
priority of queries defined such as short queries having higher priority than the long queries and
priorities of critical to low within a set of queries. GRA scheduler schedules to make sure that the
shorter queries are run before the longer queries and high priority ones before the lower ones.
This is done in order to maintain compliance on the Netezza server.
GRA scheduler computes the allocation of system resources on the fly. Let’s take a
scenario where in there are four RSGs defined on a Netezza server. Group A has 40% resources,
Group B has 30% resources, Group C has 20% resources and Group D has 10% resources. All
the groups are defined with their respective resource minimum and consider each group to be
having Resource maximum as 100%.
Resource allocations for an ADMIN take up at least half of available system resources at
any given time. As the ADMIN consumes lot of resources, it is therefore not advisable to run any
queries or perform any operations as ADMIN unless there is a critical need. An alternate
approach to this is to create a resource group for the administrators.
Priority Query Execution
As said earlier, multiple queries are run concurrently on a Netezza server and there is a
probability that one or more users out the multiple users have critical jobs running along with the
lower priority at the same time. Multiple users belonging to a single resource sharing group runs
queries simultaneously and not necessary that all the users are running equal priority jobs

45
wherein one of the users runs a critical job and the other users running low priority jobs. Though
the GRA is enabled and the resource minimum is being shared among the multiple users of the
group, the high priority jobs cannot finish quicker than the low priority ones. In this situation the
GRA needs to be reallocated among the different users in a group based on the priority of the
jobs. Netezza has a solution to this situation and that is to assign the priorities among the jobs
being run by multiple users belonging to a single resource sharing group. Netezza calls this as
Priority Query Execution (PQE). Priorities are assigned to the jobs based on the level of
criticality. Once the priorities are assigned to the users on a RSG, the GRA gradually reallocates
the system resources based on the priority level of jobs and the higher priority jobs are allocated
with more percentage of resources compared to the lower ones. Also, Netezza schedules to run
the jobs based on the priority level where in high priority is run before the lower one.
Netezza altogether has six different levels of priority for query execution where in four
are at user level and two specifically designed for Netezza system.
Table 2
Query Priority Levels
System Critical Top most system priority operations
Critical Highest user priority
High Priority jobs
Normal Default level jobs
Low Lowest priority job not affecting others
System Background Lowest priority system jobs
Priority Query Execution can be assigned to a single user among multiple users on a
RSG, or even to a RSG. User’s priority overrides the groups’ priority when priorities are defined
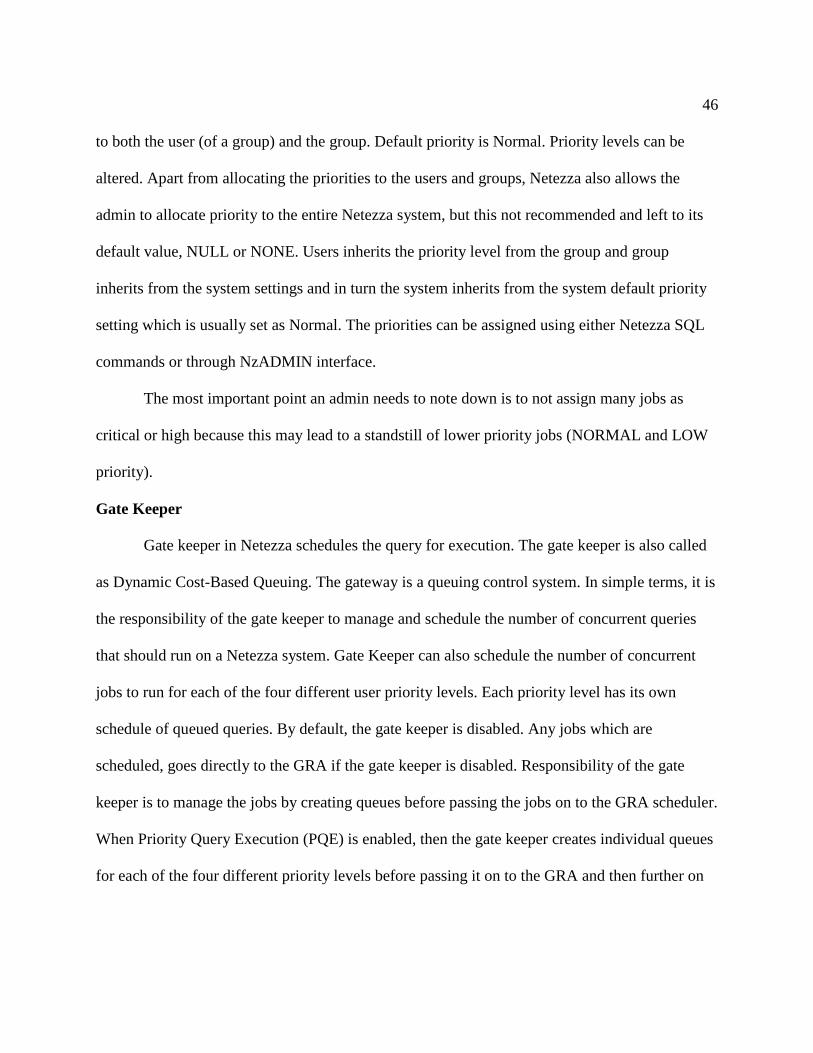
46
to both the user (of a group) and the group. Default priority is Normal. Priority levels can be
altered. Apart from allocating the priorities to the users and groups, Netezza also allows the
admin to allocate priority to the entire Netezza system, but this not recommended and left to its
default value, NULL or NONE. Users inherits the priority level from the group and group
inherits from the system settings and in turn the system inherits from the system default priority
setting which is usually set as Normal. The priorities can be assigned using either Netezza SQL
commands or through NzADMIN interface.
The most important point an admin needs to note down is to not assign many jobs as
critical or high because this may lead to a standstill of lower priority jobs (NORMAL and LOW
priority).
Gate Keeper
Gate keeper in Netezza schedules the query for execution. The gate keeper is also called
as Dynamic Cost-Based Queuing. The gateway is a queuing control system. In simple terms, it is
the responsibility of the gate keeper to manage and schedule the number of concurrent queries
that should run on a Netezza system. Gate Keeper can also schedule the number of concurrent
jobs to run for each of the four different user priority levels. Each priority level has its own
schedule of queued queries. By default, the gate keeper is disabled. Any jobs which are
scheduled, goes directly to the GRA if the gate keeper is disabled. Responsibility of the gate
keeper is to manage the jobs by creating queues before passing the jobs on to the GRA scheduler.
When Priority Query Execution (PQE) is enabled, then the gate keeper creates individual queues
for each of the four different priority levels before passing it on to the GRA and then further on

47
to the SPU’s. The gate keeper can control the number of the each priority jobs that can run
concurrently on the Netezza system.
The gate keeper has hardcoded configuration setting which restricts the maximum
number of concurrent critical priority level jobs to 36. At any given time, maximum number of
critical jobs that can run concurrently on the Netezza system is 36 and this value cannot be
changed on the gate keeper registry setting.
Apart from configuring the gate keeper to schedule the number of concurrent queries
based on the priority levels, the gate keeper can also be configured based on the estimated run
time of a query. This impacts the overall performance of the Netezza system wherein the gate
keeper can be configured to run more number of shorter queries than the queries which
comparatively takes more time to run.
Short Query Bias (SQB)
Netezza categorizes the queries into two types–Short and Long. Short queries typically
run very fast and Netezza defines a short query as the one with the run time less than two
seconds. Long queries on the other side takes many seconds, minutes or hours to run depending
upon factors ranging from the amount of data being pulled by the business intelligence team to
complex queries having many joins and conditions. With SQB enabled, users running short
queries are not impacted by the complex queries run by other users.
Netezza favors the shorter queries over the longer queries, with the SQB enabled on the
system. SQB is enabled by default on the Netezza system. With SQB enabled, Netezza reserves
memory and system resources so that the shorter queries are run with no hindrance from the
longer queries. This affect can make a large impact on performance. A short query typically

48
includes a query which does either a quick look up to retrieve data or dimensional data lookups.
The run time duration of a short query can be changed but this change will require a system
pause and resume operation. Long queries a said include multiple join operations which takes
large amount of time for the system to process it.
Netezza is smart enough to differentiate the run of different queries. And this is because
of Netezza’ s internal feature ‘prep’ snippet which analyzes the run time of a query much before
it is run on the system. Not only are the prep snippets but there other factors Netezza system
relies on to distinguish run time of queries–Just-In-Time stats and zone maps. The queries
usually go through the GRA and Snippet scheduler by forming queues. When the queues are
occupied with no more queries being accepted by the scheduler, the scheduler then releases the
additional allocated memory for the shorter queries, which is nothing but a separate queue for the
shorter queries. Each of the schedulers, GRA and Snippet, reserves slots for the shorter queries.
As described earlier that changes made to alter the estimated run time of a query requires
system pause using the nzsystem pause command. After the registry changes are completed,
resume the system using the command nzsystem resume.
Tools and Technology
Following are tools and technology that have been used to design, implement and test the
complete research. Performance of a system can be calculated and estimated with the help of
netezza’s graphical user interface tools, NzAdmin, and NZ web portal. Similarly, “nzsqa
schedqueues” is a powerful inbuilt script on a Netezza machine which tends to provide the
current running queries along with the consumption of resources.

49
Netezza Inbuilt tool–‘nzsqa schedqueues’. An inbuilt command tool which displays the
current running queries along with the amount of resources the query is running with.
The nzsqa schedqueues command displays the following parameters.
Displays the current system date and time.
SCHED TIME: 2015-12-04 01:17:35.887 EST
Displays the scheduler policy, which includes the parameters defined for each of the
workload management settings.
SCHEDULER POLICY: Gatekeeper Disabled max slots = 2048 GRA Enabled max slots = 48 SQB slots = 10 Snippet Enabled max slots = 40 SQB slots = 10 SQB (< 2s) Enabled SN Limiting Enabled baseline = 8 GRALoad Enabled Null I/O -> Ceilings:on Available:on Expected:on SNLimit:on
Displays the respective resource groups on a system along with the defined minimum
and maximum resource group attributes. This section illustrates ‘JobMax’ parameter,
which is nothing but the maximum number of jobs a resource group can run
concurrently.
KNOWN RESOURCE GROUPS: OID= 4900 Min 100 Max 100% JobMax 0 (off) "ADMIN" OID= 4901 Min 5 Max 100% JobMax 0 (off) "PUBLIC" OID= 203683 Min 60 Max 100% JobMax 0 (off) "resource_batch_grp" OID=27433791 Min 20 Max 100% JobMax 0 (off) "resource_app_grp" OID=27433792 Min 15 Max 100% JobMax 0 (off) "resource_misc_grp"
Next is the GRA scheduler parameter. This section displays the number of queries in
“waiting” and “running” state along with the level of activity for each resource group
on the system.

50
GRA SCHED:
Short Long | Resource | Waiting 0 0 | Horizon 300s | Running 0 1 | Interval 5s | Activity 0.0%
GroupOID= 4900 Allowed:Exp 1: 0%h 33: 9%i Used 0%h 0%i
Exempt "ADMIN" GroupOID= 4901 Allowed:Exp 0: 0%h 0: 0%i Used 0%h 0%i
Balanced "PUBLIC" GroupOID=27433792 Allowed:Exp 0: 0%h 0: 0%i Used 0%h 0%i
Balanced "resource_misc_grp" GroupOID=27433791 Allowed:Exp 0: 0%h 0: 0%i Used 0%h 0%i
Balanced "resource_app_grp" GroupOID= 203683 Allowed:Exp 0: 0%h 0: 0%i Used 0%h 0%i
Balanced "resource_batch_grp"
Following section, snippet scheduler, displays the host memory, blade memory,
channels, distributes, spu2hosts, broadcasts. This section displays each of the above
parameters for short and long queries. This section concludes with a wide range of
information which includes the attributes of a query–Plan-ID, type of SQL, current
data slice number the query is running on, snippet number, resource memory etc.
SNIPPET SCHED: Avail Avail Short Long InUse Max Delta Reserved Host Memory 16084 15572 300 16384 0 512 Blade Memory 10437 10037 13 10450 0 400 Channels 99 99 1 100 Distributes 50 49 0 50 0 1 Spu2Hosts 99 99 1 100 0 0 Broadcasts 99 99 0 100 0 0 Short Long | Resource | Waiting 0 0 | Horizon 600s | SPU Running 0.0/0 1.0/1 | Interval 10s | Activity 0.0% Host Running 0 0 GroupOID= 4900 Allowed:Exp 0: 0%h 0: 0%i Used 0%h 0%i Exempt "ADMIN" no work RUNNING (count 1) planid cmd slice est:plan/sched p snip c mem:h/s/s_act temp wt/req age:snip/plan/nullio scan % client sd rules flags

51
--------- --- ------ ------- ------- - --- --- - ----- ---- ---- ------- ---- ---- ------ ------ ------ -- -- --- ----------------- -- ------ -------- 56118 SEL #92 208.3 49.1 N 2 2 1 300 13 3 0 100%/100% 5.4 5.4 1 1 0 446/140549/353391 Rnj GroupOID= 4901 Allowed:Exp 0: 0%h 0: 0%i Used 0%h 0%i Balanced "PUBLIC" no work GroupOID=27433792 Allowed:Exp 0: 0%h 0: 0%i Used 0%h 0%i Balanced "resource_misc_grp" no work GroupOID=27433791 Allowed:Exp 0: 0%h 0: 0%i Used 0%h 0%i Balanced "resource_app_grp" no work GroupOID= 203683 Allowed:Exp 0: 0%h 0: 0%i Used 0%h 0%i Balanced "resource_batch_grp" no work
Figure 8. “nzsqa schedqueues”–1

52
Figure 9. “nzsqa schedqueues”–2
Netezza Admin Graphical User Interface
NzAdmin is a windows client tool for the netezza machine. It provides an interface to
easily manage the interactions of database objects. It is through this interface hardware
information about a netezza machine can be gathered and diagnosed along with other aspects
such as active sessions, active queries, database users, database objects, database groups, backup
and restore information.

53
Figure 10. NzAdmin Tool Interface
The hardware section on the NzAdmin interface displays the server’s hardware
components including number of racks, memory modules, SPU count and failure hardware
components if any.
Figure 11. NzAdmin–Netezza Hardware Specifications

54
Figure 12. NzAdmin – Netezza SPU Specifications
On the SPU hardware information screen, there are various options a user can click on to
get detailed specifications. This includes DAC ID, Status of the SPU, parent SPU, rack ID, slot
number, serial number of the SPU, and other hardware details which includes number of FPGA
engines including its version. Disks associated with respect to each SPU are displayed on
clicking each SPU slot.

55
Figure 13. NzAdmin–Netezza SPU Details
Netezza Web Portal
Netezza web portal is a web based GUI interface to administer and manage the netezza
machine. Database objects and various other technical aspects can be monitored. Web portal runs
through the IP address of a netezza machine.
Following actions can be performed on a netezza web portal.
Monitor database objects, active queries and active sessions.
Run SQL queries.
DML operations can be performed.
Validate events and configuration rules.
Diagnosis and troubleshoot workload management.
Capacity Planning.
Flexible ability to create custom performance charts based on the needs of business.

56
Figure 14. Netezza Web Interface

57
Aginity Workbench
Figure 15. Aginity Workbench
Netezza’s developer tool Aginity Workbench was developed by Aginity. This tool works
a GUI interface along with a SQL interface to run SQL queries. Other features includes
comparing database object definitions, migrate database objects over databases and servers, load
data from flat files or by using netezza’s data loading feature – NzLoad.
Technology
The entire tests were carried out on a Netezza TwinFin model. Following are the
attributes of a Netezza twinFin model.
Host Name: testnzaa
Testnza is hostname of the netezza machine on which the research and validations are
carried out. Each netezza machine has two hosts, primary host A and secondary host
B. The tests were carried out on the primary host hence the naming convention

58
testnzaA. Secondary host is up only when the primary host is failed over. There is no
downtime required while the hosts switch to and fro primary and secondary. The end
user will notice no difference regardless of which host is up and running.
Model Number: IBM PureData System for Analytics N1001-010
This is the model number for a netezza machine. N100X series represents the twinfin
family of machines. N200X represents the next series of netezza machine, striper
model. N300X represents the mako server which is by far the most advanced and
latest netezza model in the market. The number system followed by the model
number represents the number of racks pertained on a server.
Table 3
Netezza Machine Models
Netezza Model Number of Racks
N1001-002
N1001-005 ½ rack
N1001-010 Full rack
N1001-015 1 and ½ rack2
N1001-020 2 racks
N1001-030 3 racks
N1001-040 4 racks
N1001-060 6 racks
N1001-080 8 racks
N1001-100 10 racks
N2001-005 ½ rack
N2001-010 Full rack
N2001-020 2 racks
N2001-040 4 racks

59
Software Revision: 7.0.4.6p3, 7.2.0.5p1,7.2.0.5p2 and 7.2.0.6
IBM releases a number of upgrades and patches over the time based on the criticality
of the bug and enhancements. The release notes for each NPS version is covered in
the appendices section.
Snippet Processing Array: 2
Describes the number of snippet processing arrays on a netezza machine. Each SPA
consists of several SPUs. Multiple SPA’s contribute towards the overall functionality
and performance of a netezza system. Losing a SPA can decrease the performance of
system and may crash the NPS server.
Snippet Processing Unit: 14
Each SPU contributes towards the performance of a system. Losing a SPU can
decrease the throughput and performance of a machine. testnzA has 14 SPUs
altogether caged and split among two SPAs. Each SPU has a FPGA turbo engine,
memory module, a CPU and network cables. Losing a SPU here can decrease the
performance of a system by 7.14%.
Number of DataSlices: 92
TestnzA has altogether 92 data slices shared among 14 SPUs. If a data slice is
corrupted the mirror information resides on a different data slice on another SPU.
Data loaded on a netezza machine is distributed equally among each data slice to
avoid skew.

60
Total Storage: 45.608TB
This represents the total size of testnzA server in compressed format where in the
entire displayed size is user usable. Additional racks can be added to the machine to
expand the data storage.
Power/rack (Max. Watts/rack): 7,635
This denotes the maximum power, in terms of watts, which is generated out of each
rack on a netezza machine. Adding additional racks increases the overall power
consumption of a netezza machine.
FDT Version: FDT 4.1.0.0, 4.1.1.0, 4.1.2.0
FDT stands for Firmware Diagnostics and Tools. Contains firmware updates about
each hardware component on a netezza machine. The tests were carried out across
three different FDT versions due to new releases scheduled by the product owner.
Red Hat Version: Red Hat Enterprise Linux Server release – 5.9, 5.10 (Tikanga)
Netezza machine runs on Linux platform – Red Hat. Over the time, new versions
were released to match up with the same level FDT and NPS versions.
HPF Version: 5.3.4.5, 5.3.5.0
HPF stands for Host Platform. This piece updates the software version of a netezza
machine including kernel version, firmware updates, host versions etc. HPF upgrade
involves error-checking, backups and logging.
Supported APIs: SQL, OLE DB, ODBC 3.5, JDBC V 3.0 Type 4
Denotes the supported application programming interfaces on a netezza machine.

61
In-Database Analytics: nzAnalytics, R Analytics, Scientific Analytics
Programming Languages: Java, Python, R, FORTRAN and C/C++
Netezza supports a few programming languages on its Linux platform which includes
Java, C, C++, R language and FORTRAN. These languages are written and executed
in binary or hexa format and needs to be converted into a readable text format to have
users view it.
Parallel Analytic Engines: nzMatrix, nzEngine for R, nzEngine for Hadoop
Netezza is compatible to run with other appliances to support additional functionality
and richness in a data warehouse environment.

62
Chapter IV
DATA PRESENTATION AND ANALYSIS
Introduction
In this chapter, a brief introduction is illustrated on how the performance of a query can
be calculated and tweaked to achieve leverage in performance. Each workload management
feature will be illustrated in this chapter. Runtime of a query depends upon various factors from
leveraging the hardware components such as CPU, I/O bandwidth, disk size to toggling the
software pieces of a machine such as system resource management and configuring system
registry parameters. Since this paper is limited to only the components of a workload
management and how the runtime of a query can be excelled; the paper describes on how the
components of netezza’s workload management can be added, tweaked and combined to achieve
best performance.
Data Presentation and Analysis
The following sections describe and illustrate the impact of each workload feature on a
Netezza database system. Each component of a workload feature consists of a few to several
system configuration parameters pertained to it. Tweaking these parameters can result in a large
variance in terms of query runtime and query performance. This section covers the attributes of a
resource group on database system along with their performance measure using the “nzsqa
schedqueues” inbuilt script. Performance graphs are illustrated depicting the consumption of
memory resources by resource groups over a period of time. With the introduction of a new
workload feature “Scheduler Rules” in the recently released version 7.2.0.5, the gatekeeper

63
feature has been disabled. Custom rules along with the impact are illustrated in the scheduler
rules section.
Each of the below workload features illustrates different scenarios which impacts the
performance of a database system.
Guaranteed Resource Allocation
Resource groups created on a database server are allocated with a certain amount of
system resources for a query to execute with. A resource group is configured to run with a
minimum and maximum percentile of system resources at any given time on a system. The
maximum percentage a resource group can be assigned is 100%. Netezza by default comes with
a default resource group “Public”. By default all the users are added to the Public group.
Multiple resource groups can created based on the role of the application users or groups. To
begin with, following commands are run to create and assign resources to a resource group.
SYSTEM (ADMIN) => CREATE GROUP DEVELOPER WITH RESOURCE MINIMUM 50 RESOURCE
MAXIMUM 100;
To change the resource minimum of a group to 30% from 50%
SYSTEM (ADMIN) => ALTER GROUP DEVELOPER WITH RESOURCE MINIMUM 30%;
Add user ‘mmuddu’ to the group DEVELOPERS
SYSTEM (ADMIN) => ALTER GROUP DEVELOPERS ADD USER MMUDDU;
Following example illustrates the system resources the user ‘mmuddu’ is running with
when there is no active query running on a system.
User mmuddu belongs to resource group ‘resource_misc_grp’. In addition, another user
‘mmudduadm’ with higher resource percentages is assigned to ‘resource_batch_grp’.

64
Figure 16. User and User Group Information
For example, resource_misc_grp is running with a resource minimum of 15% and
maximum of 100%.
Figure 17. “resource_misc_grp” Group Information
Similar to the above resource group, there are other groups defined along with their share
of resource percentages.
Figure 18. Resource Groups
User ‘mmuddu’ runs a sample query to display all the records in a table. The system
resources a query are running with can be captured on another terminal connected to the same

65
server. Netezza’s inbuilt tool “nzsqa schedqueues” is run to calculate the system resource a
query is running with at any given moment.1
SQL: select * from table_name;
Figure 19. “nzsqa schedqueues” Output
In the above picture, one can see the amount of resources the query is running with when
you have no other active sessions running. The “wt/req” percentage displayed is the amount of
system resources the query is utilizing.
Say, there are two queries running concurrently against the system. User ‘mmuddu’ runs
a sample query to extract all the data from table1 and another user ‘mmudduadm’ with higher
resource percentage runs a similar query to extract data from table22. In order to calculate the
system resources utilized by the two users, a simple inbuilt tool can be run - ‘nzsqa
schedqueues’.
1 This test is carried out a Netezza TwinFin server running on 7 active SPU’s with a disk storage capacity
of 45.703 TB. The entire testing piece was carried out on a quiet system with no other active queries. 2Both the users run the same query on two different tables. Table2 is a copy of Table1 having same data.
The users run a query to retrieve the count of records in each table.

66
Figure 20. “nzsqa schedqueues” GRA Output
Apart from assigning min and max resource percentages to a resource group; a database
administrator can place several controls over the Resource Sharing Groups (RSG) such as
● Job Maximum–Total number of concurrent queries a RSG can run. Typically not
more than 48 should be set.
● Querytimeout–Defines max runtime of a query before it gets terminated.
● Sessiontimeout–The idle time before a user session drops.
● Rowsetlimit–The number of rows to be returned on executing a query.
● Defpriority and Maxpriority–Four levels of priority given to a user in a RSG - critical,
high, normal, low.
If Group A has n number of equal priority queries running then each query will get 1/n of
40% of the resources to be shared among the n queries equally. Now, say at a given time Group
C and Group D have queries running concurrently, the GRA scheduler re-computes the
allocation of resources on the fly in such a way that Group C gets 20/30(~67%) and Group D

67
gets 10/30(~33%) of the system resources. If only the Group D has queries running, then it
would get 100% of the available system resources.3
As described earlier, the JOB MAXIMUM attribute defines the number of concurrent
queries a group can run at any given time. Additional queries running concurrently beyond the
defined JOB MAXMIMUM are queued up until the active queries have finished running. One
can define the JOB MAXIMUM attribute with the values -1, 0 and 1 to 48.
➢ A value of -1 state that the JOB MAXIMUM value is calculated based on the GRA
and the group’s resource minimum in order to decide the number of concurrent
queries a particular group can run. If a group has RESOURCE MINIMUM defined as
30% and the JOB MAXIMUM would be 30% multiplied by 48 (max no of concurrent
queries) which is approximately 14.
➢ A value of 0 states that the group has no restrictions on the number of maximum jobs
runs concurrently.
➢ A value of 1 to 48 sets the count of the number of job maximum value.
Figure 21. Job Max Information
3 This has been tested on the Netezza model twinfin with four different resource groups running different
queries concurrently. Only the users in group A are assigned with equal priorities.

68
Query priority and GRA can defined on a Resource Sharing Group wherein the queries
are run with priorities ranging from low to critical. Assigning high priority to one query and low
priority to another query in a RSG does not mean that the high priority query runs before the low
priority one. In order to balance the allocation of resources for each job, Netezza has an in built
registry setting to define the weights for each priority query. It is host.snPriorityWeights.
The values of this registry setting are predefined internally by Netezza wherein 1 – Low, 2 –
Normal, 4–High and 8–Critical.
Figure 22. User Group Priorities
To illustrate a scenario on how GRA and query priority works together, consider a
Resource Sharing group ‘DEVELOPERS’ having RESOURCE MINIMUM as 50% and assume
two jobs are being scheduled to run by this group. One is critical priority and the other is low
priority. The ratio is 8:1, which means the resource allocated to the group DEVELOPERS is
shared by the two queries in the ratio of 8:1.
Critical job gets 8/(8+1) share of the resources, which is approximately 89% of the
resources allocated to the DEVELOPERS group 50% allocation which is about 44.5% of the
resources and the Low priority job gets 1/(1+8) share of the resources, which is approximately

69
11% of the resources allocated to the DEVELOPERS group 50% allocation which is about 5.5%
of the resources.4
Table 4
GRA Compliance Settings
host.schedGRAHorizon
Time range for which GRA scheduler calculates the
compliance of RSG
host.schedGRAVeryUnderLimit
Percentage under which the GRA is said to be much
underserved.
host.schedGRAUnderLimit
Percentage under which the GRA is said to be
underserved.
host.schedGRAOverLimit Percentage over which the GRA is said to be over served.
host.schedGRAVeryOverLimit
Percentage over which the GRA is said to be very over
served.
Each parameter displayed in the table above illustrates various functionality of a GRA
workload management. Threshold parameter can be set up which provides notification if a
resource group is very underserved, underserved, overserved or very overserved.
Figure 23. GRA System Registry Configurations
There are three ways to monitor GRA Utilization
4 Two resource groups were created on a Netezza twinfin model. Group A has critical priority assigned to it
and Group B has low priority to it. The priorities were assigned to the resource group unlike to each individual users
in the resource group. Also, both the resource groups were allocated same number of resources.

70
➢ There are Netezza system tables and views which display the information about the
ongoing resource allocation among the groups.
o System views which tracks the GRA :
▪ _v_sched_gra_ext and _v_sched_sn_ext
Displays the GRA historical information about the
allocation among various resource groups.
▪ _v_sched_gra_ext_latest, _v_sched_sn_ext_latest
Displays the GRA allocation among various resource
groups in the past ten minutes.
▪ _v_plan_resource
Supports the WLM by troubleshooting issues. Keeps track
of 2000 records of query plan activity.
▪ _v_system_util
This system view displays information about the system
resources utilization.
➢ Also, NzPortal which is a Netezza performance portal can be used to display
information about the resource allocation.
➢ NzADMIN interface also displays the information about the resource allocation.
Resource Allocation Performance summary can be seen on NzADMIN interface which
displays various stats about the resource allocation among groups. To view the Resource
Allocation Performance, on the NzADMIN interface click on Tools -> Workload Management -
> Performance -> Summary.

71
Figure 24. NzAdmin Resource Allocation Performance
Resource Performance history displays the information about the last one hour track of
utilization of system resources. To view the Resource Performance History, on the NzADMIN
interface click on Tools -> Workload Management -> Performance -> History.
Resource Performance Graph compares and displays the allocation of resources among
different groups on a day to day basis. Up to 14 different groups can be compared and analyzed.
Figure 25. Resource Allocation Performance History

72
Figure 26. Resource Performance Graph
Gate Keeper
As the name states this feature in the workload management is designed to manage
jobs/queries based on their priority. User groups are usually assigned with a priority based on
their role in an environment. Queries run of different priorities are submitted to the gatekeeper
which is responsible to sort out the queries based on their priorities. High priority queries are run
at first place while the other priority queries are queued up unless there are system resources
available for them to jump in.
Gatekeeper is disabled by default. It can always be enabled by toggling the system
registry setting ‘host.gkEnabled’ to yes in the postgresql.conf configuration file5. There are up to
four levels of priority a user or a user group can be assigned with ranging from low (normal,
high) to critical. One can set the number of maximum queries a resource group can run at any
given instance. Gatekeeper queues up any additional queries when it has reached its max limit
defined for each prioritized resource group. If a resource group with job priority set to critical
5 postgresql.conf configuration file can be found under /nz/data/config/ directory. Any changes made to this
file will need a database server restart to have the changes in effect.

73
has been assigned 40 as ‘jobmaximum’, the maximum number of queries it can run is 40 at any
given time. Additional queries lined up from the same resource group will have to wait in queue
until a system resource is available for it to sneak in.
Two registry settings needs to be configured in order to make the gatekeeper settings
affective.
-host.gkMaxPerQueue
This registry setting controls the maximum number of queries that can run concurrently
out of a queue.
-host.gkQueueThreshold
This registry setting is used to define the different estimated run times of a queue.
host.gkQueueThreshold setting is used to set the number of queues as well as the run time of the
queries. In the following example, three query runtime queues are created separated by a comma.
First queue is for the queries with the run time of less than a second. Second queue is for the
queries with the run time between 1-10 seconds and then the last queue is for the queries having
run time 10-60 seconds. The maximum number of gate keepers that can be set is four.
host.gkQueueThreshold=1, 10, 60
Now that the queues have been set up along with the query run times, next step is to set
up the number of concurrent queries that can run through each of the queues and this can be done
with the registry host.gkMaxPerQueue.
host.gkMaxPerQueue=10, 5, 3
The numbers of concurrent queries are 10 for the queries having run time of less than a
second, 5 for the queries having run time of 1-10 seconds, and 3 for the queries having run time

74
of more than 60 seconds. More number of shorter queries is being sent to the SPU for processing
compared to the longer queries. The numbers of queries are being sent to SPU for processing is
controlled by the host.gkMaxPerQueue registry.
Priority Query Execution
A resource group or a user can be assigned to a priority level ranging from Low to
Critical. There is a need to assign priority based on the role of a user or user group in a data
warehouse environment. Jobs with higher priority are assigned with more system resources
compared to other priority level jobs. High priority jobs are allowed to run before the lower
priority jobs when you have multiple jobs on a system with different priority levels. It is always
recommended to enable the Gatekeeper along with the priority query execution workload
management feature.
Netezza SQL command to set system‘s default and maximum priority.
- SET SYSTEM DEFAULT [DEFPRIORITY | MAXPRIORITY ] TO [ CRITICAL | HIGH |
NORMAL | LOW | NONE ]
Figure 27. Resource Group Priorities6
6 Priorities are set on resource groups unlike to each individual user. Users in each resource group acquire
the attributes of a resource group they belong to.

75
Following are the Netezza SQL commands to assign a user and a group with a priority
level
-ALTER USER MMUDDU WITH DEFPRIORITY HIGH MAXPRIORITY CRITICAL;
-ALTER GROUP GROUP_NAME WITH DEFPRIORITY NORMAL MAXPRIORITY HIGH;
Apart from assigning priorities to a user or a group, Netezza also supports in assigning
priorities to the user sessions. A user may have multiple high priority jobs to run throughout a
single session. Using the ‘ALTER SESSION’, admin can grant the priority level to the session.
Also, ‘nzsession priority’ can be used to assign the priority levels to a user session. The
‘nzsession’ command displays the current user sessions on a Netezza system along with the idle
sessions. As mentioned earlier, the priority of a session can be altered using the ‘nzsession
priority’.
nzsession priority –CRITICAL –id SESSION_ID;7
SYSTEM(ADMIN) => ALTER SESSION SESSION_ID SET PRIORITY TO CRITICAL;
Short Query Bias
Netezza categorizes the queries into two types – Short and Long. Short queries typically
run very fast and Netezza defines a short query as the one with the run time less than two
seconds. Long queries on the other side takes many seconds, minutes or hours to run depending
upon factors ranging from the amount of data being pulled by the business intelligence team to
complex queries having many joins and conditions. With SQB enabled, users running short
queries are not impacted by the complex queries run by other users.
7 nzsession is an inbuilt netezza tool which displays the active and idle sessions on a netezza server. For
more usage run “nzsession -?”

76
Netezza favors the shorter queries over the longer queries, with the SQB enabled on the
system. SQB is enabled by default on the Netezza system. With SQB enabled, Netezza reserves
memory and system resources so that the shorter queries are run with no hindrance from the
longer queries. This effect can make a large impact on performance. A short query typically
includes a query which does either a quick look-up to retrieve data or dimensional data lookups.
The run time duration of a short query can be changed but this change will require a system
pause and resume operation. Long queries include multiple join operations across large tables
which takes large amount of time for the system to process it.
Netezza is smart enough to differentiate the run of different queries. And this is because
of Netezza’ s internal feature ‘prep’ snippet which analyzes the run time of a query much before
it is run on the system. Not only are the prep snippets but there are other factors the Netezza
system relies on to distinguish run time of queries–Just-In-Time stats8 and zone maps
9. The
queries usually go through the GRA and Snippet scheduler by forming queues. When the queues
are occupied with no more queries being accepted by the scheduler, the scheduler then releases
the additional allocated memory for the shorter queries, which is nothing but a separate queue for
the shorter queries. Each of the schedulers, GRA and Snippet, reserves slots for the shorter
queries.
8 Netezza system automatically runs statistics on tables when a user queries against it. This is useful since it
helps the optimizer function more efficiently thereby reducing the query run time. 9 Zone maps are internal tables built virtually over the base tables. Netezza eliminates the need of having a
query run over a large table by cutting it short to run over the zone maps. A zone map table is built on the table
columns the query is running against more often.

77
Figure 28. Short Query Bias System Registry Configuration
Table 5
Short Query Bias System Configuration Parameters
host.schedSQBEnabled Enables SQB. Set to 1/true to enable.
host.schedSQBNominalSecs Defines the “short” query definition duration. Default
value 2.
host.schedSQBReservedGraSlots Defines the number of GRA slots that are reserved for
short queries. Default value is 10.
host.schedSQBReservedSnSlots Defines the number of snippet scheduler slots that are
reserved for short queries.
host.schedSQBReservedSnMb Memory reserved on SPU for short query execution.
host.schedSQBReservedHostMb Memory reserved on host for short query execution.

78
As described earlier, changes made to alter the estimated run time of a query requires
system pause using the nzsystem pause command. After the registry changes are completed,
resume the system using the command nzsystem resume.
Scheduler Rules
IBM has released a new workload management feature since its new NPS version
release; v7.110
. A database administrator can write and set up custom rules which are executed
by the netezza server. Based on the resources allocated through the guaranteed resource
allocation, priorities set through the priority query execution and short query bias system’s
settings defined on a server, the scheduler executes a job. Scheduler rules take the priority over
all the other WLM features defined on a server.
Syntax:
● Create scheduler rule
Figure 29. Create Scheduler Rule
● Show defined scheduler rules
Figure 30. Current Scheduler Rules
10
IBM released nps7.1 through the package 7.1.0.1-P1-IM-Netezza-NPS-fp78666 on May 15, 2014.

79
In the above example, a rule is defined to limit the number of concurrent queries the user
‘mmuddu’ can run on a system. Any other job run in concurrency will be queued up in pending
state until the active job completes running.11
Figure 31. Query Pending State
Similarly, a scheduler rule can be modified to change its actions or conditions or both the
action and condition. Using the alter command a scheduler name as well as a tag attached to it
11
The scheduler rules has been tested on a newer NPS version, 7.1.0.1.

80
can be renamed. Lastly, a scheduler rule can be dropped by running the drop scheduler
command.
Figure 32. Drop Scheduler Rule
Scheduler Rule Syntax:
● One action
● Zero or more conditions to a defined action.
● To which users the action is applicable to.
Every job that is submitted to the system undergoes through the scheduler. Jobs which
satisfy the scheduler rules undergoes through the defined action, else the job executes without
any changes.
Scheduler rule are of two types:
Limitation: This rule limits the number of jobs that can run in parallel. For example the
following rule limits the number jobs to 3 that can run concurrently with the group
resource_misc_grp.
IF GROUP IS resource_misc_grp THEN LIMIT 3;
Any new jobs submitted are queued up until any one of the running job executes.
Modifying: This rule alters the job condition or in simple terms it alters the attributes of a
job submitted to the scheduler. For example, the following rule changes the priority of a job
submitted for the user group resource_misc_grp.
IF GROUP IS resource_misc_grp THEN SET PRIORITY TO HIGH;

81
Chapter V
IMPLICATIONS, CONCLUSION, AND RECOMMENDATIONS
Introduction
A fine mixture and combination of various workload management features needs to be
tweaked and configured to achieve the best possible performance in a data warehouse
environment. Based on the frequency of jobs that are run by the application teams a database
administrator needs to configure the workload management on a server. This section provides the
solutions to the study questions that were imposed in the earlier sections of the paper. A brief
explanation is provided about the recommendations an external user can concur through this
paper.
Implications
By configuring the workload management a database administrator can enforce the way a
query runs on a server. Workload management rules are imposed based on the frequency of jobs
run by the application teams. To conclude this section, each of the study questions imposed
earlier in this paper will answered and justified.
1. How can the workload management feature enhance the Netezza system to handle
concurrent queries of various complexities without much hassle?
Jobs run by the various application teams are in large volume. Netezza is capable of
handling up to 48 concurrent queries submitted to a system at any given instant. Not all the
queries can run with the same complexity level, granularity and importance. One of the most
recommended practices is to place priorities and allocate system resources to the jobs based on
the database groups identified. With no priorities and resources configured, for example, a user

82
running a query against a terabyte sized table can hamper the daily load jobs which run on a
scheduled basis. Assigning system resources can help certain application teams as well as the
batch jobs to utilize most of the available system resources to run the jobs faster. Moreover,
having priorities placed in addition will provide an extra edge of boost in performance by having
the higher priority jobs run before the lower ones.
2. The tools and bash scripts required to configure the workload management and
how the predefined system configurations can be tweaked on the lines of workload
management to achieve improvised performance?
Workload management can be observed using the NzAdmin GUI interface. Three
different ways you can visualize the resource management on a server.
The following figure illustrates the resource allocation summary of the four resource
groups defined on a server. The graph in the figure depicts the system resources with which the
jobs are running. X-axis denotes the time in 2hrs window and Y-axis denoted the number of jobs
that have run during that specific time frame.12
12
Resource allocation summary is one of the tools that exist on the netezza NzAdmin GUI interface.
Concurrent queries were run between 2am - 8.15am EDT. The graph displays the percentage of system resources the
queries ran with between 2:00- 8.15 am EDT.

83
Figure 33. GRA Performance Summary
Figure 34. GRA Performance History

84
In order to check the history of the resource allocation, there is an option under the tools
menu in the NzAdmin tool. The output of which can be seen in the Figure 26.
Workload management can be enabled, configured, and disabled through the system
settings. Bash scripts can be designed to code the workload management. Other way around
following are the various system parameters once can tweak under each workload management
features.
Short Query Bias:
Figure 35. Short Query Bias System Configuration Registry
There are two ways one can configure the workload management, temporary and
permanent.
Temporary:
a. Pause the system – nzsystem pause
b. nzsystem set -arg setting=value
c. Resume the system – nzsystem resume

85
Permanent:
Parameter needs to be added, modified or removed in the configuration file in order to have the
changes taking effect. The parameters can be found in the system.cfg configuration file. System
needs to be restarted unlike pause to have the settings take place.
3. On what basis the workload management features needs to be assigned and allocated
to? How the workload management is configured based upon the role of a database
user or a database group?
Workload management needs to be configured based on the role of application teams and
batch jobs. It is always tricky for a database environment to have an ideal and static workload
management setting since it needs to be tweaked often on a certain basis. With the dynamic
change in data and application roles, the configurations are required to be tuned on a regular
basis. User ‘admin’ carry the highest priority with majority of system resources allocated to it.
And, there are user groups and applications teams which run the load jobs followed by the other
user groups.
Conclusion
Although Netezza server runs on AMPP architecture, workload management needs to be
configured in order to make the server run efficient and faster thereby providing rapid results.
Various factors contribute to a performance of a server, including user data, database changes,
and workload changes on an application level. A database server must be tweaked on a regular
basis to achieve higher levels of performance. A smart mixture of guaranteed resource allocation
(GRA), priority execution (PQE), gatekeeper (GK) configuration, and short query bias (SQB) is
required to run the data warehouse system faster and easier. Improper system configurations can
86
lead to a disaster. Performance of a database server is directly proportional to the performance of
the system resources. The better the allocation of resources the better the server performs.
Workload management parameters and system configuration needs to be assigned based on the
role of users and user groups in a data warehouse environment. It is the responsibility of a Data
modeler and database administrator to design the environment and identify the jobs and
applications which require the higher priority edge over the other jobs. With no workload
management configured jobs that are submitted to the system are going to run with the same
allocation of resources. With resource allocation configured jobs assigned with higher allocation
are going to run faster.
Future Work
The research in this paper can possibly be extended to a point where the entire process
can be automated with minimal activity for a database administrator. Future scope relies on the
number of additional configurations that are released by the product owner and the way it shapes
a data warehouse environment. With a wide variety of workload management features and
system configuration parameters there is a wide variance in configuring a data warehouse
environment. Netezza currently comes with five predefined workload features along with more
than a hundred system configuration parameters linked to each WLM feature. There is always a
tremendous potential in solving numerous performance problems based on the data a company
deals with along with the configurations of a workload management and system configurations.
Automating the workload management reduces the overhead work and high cost of
ownership of maintaining a database administrator. With the newly released feature, Scheduling
Rules, workload management can be automated greatly. Prior to this release, cron job was an

87
option to automate the workload management. With scheduler rules, micro management of
system resources has become possible. Using scheduling rules one can limit or enforce the
number of concurrent queries, allocate system resources, and assign priorities, all this apart from
custom rules that can be created.

88
References
Benoit, D. G. (2000). Automated diagnosis and control of DBMS resources. In EDBT PhD.
Workshop, 2000.
Chen, W. J., Comeau, B., Ichikawa, T., Kumar, S.S., Miskimen, M., . . . Väättänen, T. (2008).
DB2 Workload Manager for Linux, Unix, and Windows.” IBM RedBooks.
IBM. (2010a). IBM to acquire Netezza. Retrieved from
http://www03.ibm.com/press/us/en/pressrelease/32514.wss
IBM. (2010b). IBM completes acquisition of Netezza. Retrieved from
http://www03.ibm.com/press/us/en/pressrelease/32955.wss
IBM. (n.d.a).The IBM Netezza data warehouse appliance architecture. Retrieved from
http://www.mysiriuszone.com/company/sirius-library/webcasts-
videos/doc_download/7762-ibm-netezza-data-warehouse-appliance-architecture-white-
paper
IBM. (n.d.b). IBM Knowledge Center. Retrieved from
http://www01.ibm.com/support/knowledgecenter/SSULQD_7.1.0/com.ibm.nz.adm.doc/c
_sysadm_wlm_nz_appliance.html
Krompass, S., Kuno, H., Dayal, U., & Kemper, A. (n.d.). Dynamic workload management for
very large data warehouses—juggling feathers and bowling balls. In Proc. of 33rd Intl.
Conf. on Very Large Data Bases (VLDB’07). Austria. pp. 1105-1115.

89
Krompass, S., Scholz, A., Albutiu, M. C., Kuno, H., Wiener, J., Dayal, U., & Kemper, A. (2008).
Quality of service-enabled management of database workloads”. In Special Issue of IEEE
Data Engineering Bulletin on Testing and Tuning of Database Systems, IEEE Computer
Society.
Microsoft Corp. (2015). Managing SQL server workloads with resource governor. Retrieved
from http://msdn.microsoft.com/en-us/library/bb933866.aspx
Schroeder, B., Harchol-Balter, M. Iyengar, A., & Nahum, E. M. (2006). Achieving class-based
QoS for transactional workloads. In Proceedings of the 22nd International Conference on
Data Engineering, ICDE 2006, page 153.
Weikum, G., Hasse, C., M¨onkeberg, A., & Zabback, P. (1994). The COMFORT automatic
tuning project. Information Systems, 19(5), 381-432.
Zhang, M. (2014). Autonomic workload management for database management systems.
Retrieved from
https://qspace.library.queensu.ca/bitstream/1974/12181/1/Zhang_Mingyi_201404_PhD.p
df
90
Appendix
Following are the netezza release notes which describes the improvements in the
technical functionality, bug fixes and also the new features that are introduced in each of the
released version,
NPS7.0.4.6p3
87682 - Fixes an issue where an NPS backup operation did not capture changes made by
CREATE TABLE AS transactions that were running at the time of the previous backup
increment.
87771 - Updates the Netezza Platform Software (NPS) and clients to use OpenSSL 0.9.8zb. This
OpenSSL update includes a number of fixes and updates for reported vulnerabilities including
CVE-2014-3505, CVE-2014-3506, CVE-2014-3507, CVE-2014-3508, and CVE-2014-3510.
Refer to http://www.openssl.org/news/vulnerabilities.html for more information about the
OpenSSL vulnerabilities and fixes.
89132 - Corrects an optimization rule to check whether joins between dimension tables and fact
tables have hash joinable restrictions so that the optimizer can take advantage of pre-broadcast
tables for join performance improvements.
NPS7.2.0.5p1
100729 -Fixes an issue where the nzhw command failed with an authentication error when using
a database user account that has a cached password.

91
22907 (40482) - Improves the performance of queries that process large IN-LISTs due to a
problem where runtimes could increase when the system appends values to the end of the list.
This change speeds up the append process for the lists to reduce the query runtime.
71488 - Restores internal view lookup behavior to ensure that NPS uses the object name for
lookups if the initial lookup of the object by internal object ID yields no results.
77183 - Fixes an issue where the runaway query event did not attach the query plan files to the
event email in NPS release 7.0 and later.
86335 - Fixes an issue where NPS hosts showed false alerts that the hosts had exceeded the
average power usage threshold. This nzhealthcheck monitoring has been disabled because it is
not intended for the hosts in NPS appliances.
86472 - Fixes an issue where the query internal code generation calculated an invalid record size
resulting in a SPU reset.
86638 - Fixes an issue where, after a restored database is renamed, backed up, and restored
again, the restore fails to create views that reference other views because the view definitions
reference the old database name. If users in your environment often rename databases between
backup operations, consider running new full backups for those databases after you upgrade to a
version of NPS that contains this fix.
87396 - Fixes an issue where internal routines that process expressions in the query planning did
not record all the column information used in an expression, leading to a database restart.
88350 - Fixes an issue where privileges granted on system objects were failing.
88561 - Fixes an issue where a query that has a restrict operation that involves a join expression
with a boolean equality operator could sometimes result in a database restart.

92
92148 - Fixes an internal query plan optimization that improves the performance of queries
against the system catalog that join on multiple attributes.
92159 - Adds a notice message that can alert users when their queries return a subset of results
because of a configured rowset limit for the user or the user's group. If a query returns a subset of
results, the system writes the message "NOTICE: Rowset limit of <limit> applied" to the pg.log
file. For ODBC/JDBC users, the SQLGetDiagRec()/ getwarning functions can show the notice
when it occurs.
93333 - Adds a new command SHOW TEMP TABLE that lists all the temp tables that exist at
the time the command runs, and size of the tables on the SPUs. The database user must have the
System privilege to execute this command.
93514 - Fixes an issue where the ScanNode object in the plan file did not show the correct
schema name for an object.
94002 - Fixes an issue where query performance for queries on the _v_odbc_columns* or
_v_jdbc_columns* views took longer to complete.
94316 - Adds changes to help reduce query runtimes and memory consumption for queries that
have nested selects and function calls in the projection list, such as select func(select(func(x))).
94656 - Fixes an issue where the nzload command failed with a "reference zone 1" error when
the first column of the record to be loaded is defined as nullable and contains a null value.
94813 - Updates the internal nzdumpschema Support tool to collect more parameters like
enable_simple_jit_avoidance to troubleshoot queries.
93
94886 - Fixes an issue where loads to a versioned table failed with errors such as 'ERROR:
Column reference "rowid" not supported for views.' for special user table attributes referenced in
the load.
95076 - Fixes an issue where the nzrestore command fails with an error "Cross Database Access
not supported for this type of command."
95119/90082 - Adds a series of improvements to the CASE WHEN support to resolve issues
such as pg_atoi errors that stemmed from internal temporary variable initialization problems.
95212 - Fixes an issue for IBM Netezza Replication Services environments where the
subordinate nodes might not have received updated metadata files.
95217 - Fixes an issue where a join to a pre-broadcast table created a negative startup cost and
biased the cost to ignore other more optimal join paths. If you had set the
enable_2phase_cost_adj variable to false as a workaround for this issue, you should change the
variable value back to true after you upgrade to NPS 7.0.4.9.
95251 - Fixed a rare timing issue where a system that had hundreds of concurrent sessions
encountered a lock that prevented Netezza commands from running on the system.
95315 - Fixes an issue where the NzAdmin interface could hang when trying to access a locked
database.
95695 - Fixes an issue where a query failed with the error "ERROR: parsenodes_mutator:
Unexpected node type 103."
95830 - Fixes an issue where a false warning appeared for a backup and restore connector
argument that did not apply for the backup connector specified in the command.

94
96038 - Adds support for Netezza backup and restore operations with a 64-bit Tivoli Storage
Manager 7.1.x client.
96060 - Fixes an out-of-memory issue triggered when the single-slice throughput enhancement
evaluates OR restrictions against a table's distribution key.
96182 - Fixes an issue where the optimizer ignored an additional filtering join to a pre-broadcast
table even though the just-in-time (JIT) scan had identified that the pre-broadcast join was
beneficial.
96338 - Fixes an issue where new database users created on an NPS system that is configured for
LDAP authentication could not log in due to an expired password. The problem was due to an
internal time representation change for password ranges.
96362 - Adds support for a Netezza file system backup connector option,
FSYNC_DEST_BYTES, that throttles the host writes to an external file system by flushing the
modified buffers after a specified number of bytes and waiting for the device to finish. This
option helps to reduce cases where NPS host could restart and failover while writing data to a
slow external file system. You can use the FSYNC_DEST_BYTES option to set a maximum
write size before flushing the buffers, for example:
nzbackup -dir /home/user/backups -u user -pw password -db db1-v -connectorArgs
FSYNC_DEST_BYTES=65536
Note that the option will increase the overall time of the backup process, so you should not use
this option unless file system backups are causing your NPS host to restart.
96545 - Fixes an issue where a database restore with the -nodata option created a view that had a
different definition than the original view in the backup.

95
96614 - Fixes an issue where a query that called an EXISTS condition in a subselect could
encounter a planner loop that caused NPS to restart.
96703 - Fixes an issue where the lastupdate column of _v_restore_history did not show the
completion time of the restore operation.
96705 - In Netezza Replication Services environments, fixes an issue with parsing distribution
keys in a by-value replication process that could cause a subordinate to suspend.
96792 - Fixes an issue where the nztmpwatch script was not cleaning up old dbos and sysmgr log
files. The script was selecting files based on last access time, not last modified time, so older
files were lingering beyond the cleanup date.
96948 - Adds support to verify that extent IDs never exceed the defined limit for their data type.
Data slices which have invalid, large extent IDs could encounter problems that prevent zone
maps from being created for those data slices.
97259 - In a Netezza Replication Services environment, adds the replHeartbeatLatency variable
to control how long the system waits for a heartbeat before considering it a missed hearbeat, and
the replHeartbeatMaxMissedInterval variable to specify how many consecutive heartbeats can be
missed before the system triggers a missed heartbeat event. These settings help to tune the event
notifications for the replication environment.
97330 - Fixes an issue where a GENERATE STATISTICS command failed with the error
"Table size too big for caching."
97350 - Fixes a stored procedure issue where two processes attempt to drop the same transient
table.

96
97472 - Adds a session variable enable_pullup_notexists_sublink that allows a user to disable
ANSI standard behavior for correlated subqueries used in NOT IN/NOT EXISTS anti-join
evaluation. Netezza behavior prior to 46364 (made in 7.0.2.11-P1 and later) did not follow ANSI
standard behavior in terms of evaluating correlated subquery predicates that solely referenced the
"outer" result set. The default for this session variable is true to use the ANSI standard behavior.
To restore the original, non-ANSI, Netezza behavior, set the enable_pullup_notexists_sublink
session variable to false.
97508 - Fixes an issue where a multi-stream restore from Tivoli Storage Manager backup tape
drives could be blocked from completing.
97550 - Fixes an issue where in NzAdmin, displaying the object privileges for a database did not
display any results. The NzAdmin interface now prompts the user for a database and a schema to
display the privileges.
98178 - Fixes an issue where an external table contains an incorrect value INF for numerics and
for cases where float and double data types are empty.
98188 - Fixes an issue where NPS upgrades that include a catalog upgrade (such as between
major releases like 7.0.4.x to 7.1.0.x), the custom settings for system settings such as
QUERYTIMEOUT, SESSIONTIMEOUT, ROWSETLIMIT, MAXPRIORITY or
DEFPRIORITY were reset back to their default values.
98226 - Fixes an issue that caused an NPS restart while the system was reassembling a stored
procedure definition and validating its UTF-8 correctness. This validation occurs when
procedure definitions are stored in segments.

97
98427 - Fixes an issue where table statistics are not reset after a TRUNCATE table command. In
7.2.0.5 and later, NPS automatically resets table statistics after a TRUNCATE command. You
can set the value to false to maintain the current 7.2.0.4 behavior to retain the table statistics and
rowcount of the table before the TRUNCATE, which increase over time as new rows are inserted
to the table. For more information, see http://www-
01.ibm.com/support/docview.wss?uid=swg21959596.
98491 - Fixes an issue where the SPU kernel scheduler process checked the wrong task for a
possible restart operation. This problem typically occurred on SPUs that were running many
concurrent processes.
98691 - Fixes an issue where several system tables returned a "did not find any relation" error
when used with the nzsql \d (describe) option.
98763 - Fixes an issue where the command to create a materialized view incorrectly returned the
error "CTAS not permitted because of conflicting backup transaction."
98916 - Fixes system catalog performance for queries that directly or indirectly reference the
system _v_obj_relation, _v_obj_relation_xdb, and _v_object_data views.
99210 - In Netezza Replication Services environments, fixes an issue where a delete by value
command failed with an ambiguous column error because a user table column name matched an
internal replication column alias. The change updates the internal alias names with a CSN suffix.
99310 - Fixes an issue in the internal casting of string literals used in SET operations which
could result in invalid string literal values that cause the query to fail and restart the NPS
software

98
99520 - Fixes an issue where TRUNCATE operations on tables did not clean up some internal
resources, resulting in out-of-memory conditions on SPUs.
99533 - Improves call home behavior to ensure that user-initiated events do not cause a PMR to
be opened unless they are specifically test events.
99741 - Changes the default setting to disable the snippet results cache feature on upgrades to
7.1.0.6 because it was optimized for specific types of workloads. For more information, see
http://www-01.ibm.com/support/docview.wss?uid=swg21960526.
99742 - Changes the default setting to disable the single slice optimization feature on upgrades to
7.2.0.5 because the feature was optimized for specific types of workloads. For more information,
see http://www-01.ibm.com/support/docview.wss?uid=swg21960527.
99790 - Fixes an issue where the IBM Netezza Software Support tools were not upgraded along
with the NPS upgrade in a 7.2 patch release.
NPS7.2.0.5p2
95530 - Fixes an issue where all queries fail with the error "storage transaction table is full" and
the user must stop and restart the system.
96684 - Fixes a code generation issue that added multiple nodes for a user-defined function,
resulting in SPU resets.
98709 - Fixes an issue where the change for 85397 prevented the planner from leveraging the
right outer join optimization for queries that join with fact tables. This change adds a variable
enable_setop_dispersion_adj to disable the 85397 join dispersion improvement changes in cases
where the right outer join optimization is more beneficial.

99
100813 - Improves the performance of bridge queries that compare a 32-bit integer data type to
an OID data type.
100977 - Improves the performance of queries against system catalog views that were using a
less efficient index to access the ACL system table.
101046 - Fixes an issue in multi-stream restore operations where a database backup that had
user-defined functions required a long time to load the UDX objects.
101572 - Fixes an issue where a routine that reserves space in a metadata log for data slices was
failing and preventing NPS from starting.
NPS7.2.0.6
92154 - Fixes an issue where a backup operation could fail if a vacuum operation ran
concurrently with the backup. The system now aborts a vacuum operation when there is a backup
already running on the system.
94159 - Adds support for Windows 8 in the NPS clients and drivers.
94868 - For NEC InfoFrame DWH Appliance models ZA25 and ZA50, fixes an issue where the
nznetw command displays an incorrect status for the switch ports.
95530 - Fixes an issue where all queries fail with the error "storage transaction table is full" and
the user must stop and restart the system.
96246 - Improves workload scheduling to check system resource utilization and, when lower
utilization is detected, to schedule more queries to run to increase concurrency and utilization.
96999 - Improves support for the includeHeader feature of CREATE EXTERNAL TABLE to
include alias names in the column names.

100
97067 - Fixes an issue that can help to reduce the time needed to generate a plan for a query.
97621 - Fixes an issue that prevented scheduler rules from supporting the serialization of
INSERT INTO <table> VALUES... commands.
97334 - For IBM Netezza replication services environments, improves transaction management
and queueing algorithms to improve the throughput of queries that are running on subordinate
nodes.
97335 - For Netezza replication service environments, improves an internal troubleshooting tool
to show which plan is in progress when a replapply is waiting to finish.
98232 - For an IBM PureData System for Analytics N3001-001 appliance, fixes an issue where a
SPU could not be activated on the second host after the second host had restarted.
98454 - Fixes an issue where a blade memory check routine failed and caused DBOS to restart.
The memory check failure occurred after a previous system pause/resume operation after which
queries were automatically restarted.
98519 - Fixes an object lookup issue that caused an nzrestore to restart the NPS software when a
user-defined function referenced in a view could not be resolved by the restore logic.
98687 - Fixes a rare timing issue that occurred when an internal routine that tracks SPU resource
usage referenced a plan that was aborted, causing a database restart.
98696 - Fixes an issue where an UPDATE operation to an altered table that references rows by
row ID failed with the error " List error in nth()."
98747 - Fixes an issue where an optimization that transforms qualifying OR lists into a subplan
expression did not correctly handle certain cases where the OR list was enclosed in a NOT
operator.
101
98814 - Fixes an issue where the data skew value shown in the _v_table_only_storage_stat view
did not show the correct skew percentage.
98922 - Fixes an issue where a query that compares nchar or nvarchar data using operators such
as < , <= , > , >=, BETWEEN, or LIKE could result in poor estimates and less efficient join
processing.
98946 - Fixes an issue where a windowing aggregate query failed with a "pqFlush() --
connection not open" error.
99049 - Fixes an issue where the word AUTHORIZATION changed to become a reserved
keyword. It should be a non-reserved keyword available for table or column names.
99055 - Fixes an issue where an nzrestore -incrementlist command unlocked a database.
99291 - Fixes an issue where the nzload command fails on a Windows client with "Error: NULL
delimiter is not allowed for DateStyle : MONDY."
99775 - Fixes an issue where an upgrade to a patch release did not update some system views to
apply changes that provide a performance improvement for queries that use those views.
99865 - Fixes an issue where a query that calls LAST_VALUE and uses a window aggregate
was incorrectly converted to a FIRST_VALUE call for optimization, resulting in a "Partition
rowcount limit exceeded" error.
100152 - Improves the latency based scheduler to apply the algorithms to High priority queries
in addition to Normal priority queries.
100163 - Fixes an nzloader issue where the loader failed because of an unterminated record, but
the failure message referred to an erroneous line feed character that is actually not present.

102
100263 - Fixes an issue where a query that uses a range between typecast values failed with the
error "convert_timevalue_to_scalar: unsupported type 23" because unsupported data types were
not handled correctly by internal casting routines.
100658 - Improves the ODBC and JDBC system views to improve performance. This change
corrects an issue where the system views for version "2" (those named _V_JDBC_FUNCTION2,
for example) were returning cross-database results; the views now return results for only the
database where the query is running.
100866 - Fixes an issue where the NPS Linux ODBC driver manager did not set the client
information fields for query connections, causing client information to be unavailable in the
query history database.
100980 - Fixes an issue where a table is considered for pre-broadcasting but at the stage of
consideration not all information is present to identify all columns that need projection. In such
cases the table will not be considered as a pre-broadcast candidate.
101309 - Fixes an issue where a cross-database query run from a user database and which
referenced a fully qualified SYSTEM view name used a view defined in the user database.
101348 - Fixes a timing issue in the SPU Linux kernel that could cause the SPU to lock up and
require a SPU restart.
101535 - Fixes an issue in a SQL UPDATE command where the updated relation has an alias
and the alias is used to reference a column in the target list.
101980 - Fixes an issue where queries on the system catalog run by a non-admin user account
were not completing as quickly as for the admin user.