PURE AND APPLIED SCIENCES - Covenant...
9
-
Upload
truongduong -
Category
Documents
-
view
218 -
download
0
Transcript of PURE AND APPLIED SCIENCES - Covenant...


EDITORMZ Khan, SENRA Academic PublishersBurnaby, British Columbia, Canada
ASSOCIATE EDITORSErrol Hassan, University of QueenslandGatton, Australia
Paul CH Li, Simon Fraser UniversityBurnaby, British Columbia, Canada
EDITORIAL STAFFJasen NelsonWalter LeungSara AliHao-Feng (howie) LaiBen Shieh
MANAGING DIRECTORMak, SENRA Academic PublishersBurnaby, British Columbia, Canada
Board of Editorial Advisors
Richard CallaghanUniversity of Calgary, AB, CanadaDavid T CrambUniversity of Calgary, AB, CanadaMatthew CooperGrand Valley State University, AWRI, Muskegon, MI, USAAnatoly S BorisovKazan State University, Tatarstan, RussiaRon ColeyColey Water Resource & Environment Consultants, MB, CanadaChia-Chu ChiangUniversity of Arkansas at Little Rock, Arkansas, USAMichael J DreslikIllinois Natural History, Champaign, IL, USADavid FederUniversity of Calgary, AB, CanadaDavid M GardinerUniversity of California, Irvine, CA, USAGeoffrey J HayUniversity of Calgary, AB, CanadaChen HaoanGuangdong Institute for drug control, Guangzhou, ChinaHiroyoshi ArigaHokkaido University, JapanGongzhu HuCentral Michigan University, Mount Pleasant, MI, USAMoshe InbarUniversity of Haifa at Qranim, Tivon, IsraelSA IsiorhoIndiana University - Purdue University, (IPFW), IN, USABor-Luh LinUniversity of Iowa, IA, USAJinfei LiGuangdong Coastal Institute for Drug Control, Guangzhou, ChinaCollen KellyVictoria University of Wellington, New ZealandHamid M.K.AL-NaimiyUniversity of Sharjah, UAEEric L PetersChicago State University, Chicago, IL, USARoustam LatypovKazan State University, Kazan, RussiaFrances CP LawSimon Fraser University, Burnaby, BC, CanadaGuangchun LeiRamsar Convention Secretariat, SwitzerlandAtif M MemonUniversity of Maryland, MD, USASR NasyrovKazan State University,Kazan, RussiaRussell A NicholsonSimon Fraser University, Burnaby, BC, CanadaBorislava GutartsCalifornia State University, CA, USASally PowerImperial College London, UK
Gordon McGregor ReidNorth of England Zoological Society, UKPratim K ChattarajIndian Institute of Technology, Kharagpur, IndiaAndrew Alek TuenInstitute of Biodiversity, Universiti Malaysia Sarawak, MalaysiaDale WrubleskiInstitute for Wetland and Waterfowl Research, Stonewall, MB, CanadaDietrich Schmidt-VogtAsian Institute of Technology, ThailandDiganta GoswamiIndian Institute of Technology Guwahati, Assam, IndiaM Iqbal ChoudharyHEJ Research Institute of Chemistry, Karachi, PakistanDaniel Z SuiTexas A&M University, TX, USASS AlamIndian Institute of Technology Kharagpur, IndiaBiagio RicceriUniversity of Catania, ItalyZhang HemingChemistry & Environment College, Normal University, ChinaC VisvanathanAsian Institute of Technology, ThailandIndraneil DasUniversiti Malaysia, Sarawak, MalaysiaGopal DasIndian Institute of Technology , Guwahati, IndiaMelanie LJ StiassnyAmerican Museum of Natural History, New York, NY, USAKumlesh K DevBio-Sciences Research Institute, University College Cork, Ireland.Shakeel A KhanUniversity of Karachi, Karachi, PakistanXiaobin ShenUniversity of Melbourne, AustraliaMaria V KalevitchRobert Morris University, PA, USAXing JinHong Kong University of Science & Tech.Leszek CzuchajowskiUniversity of Idaho, ID, USABasem S AttiliUAE University, UAEDavid K ChiuUniversity of Guelph, Ontario, CanadaGustavo DavicoUniversity of Idaho, ID, USAAndrew V SillsGeorgia Southern University Statesboro, GA, USACharles S. WongUniversity of Alberta, CanadaGreg GastonUniversity of North Alabama, USA
Volume 4, Number 2June 2010
Editorial OfficeE-mail: [email protected]
The Canadian Journal of Pure and AppliedSciences (CJPAS-ISSN 1715-9997) is apeer reviewed multi-disciplinary specialistjournal aimed at promoting researchworldwide in Agricultural Sciences,Biological Sciences, Chemical Sciences,Computer and Mathematical Sciences,Engineering, Environmental Sciences,Medicine and Physics (all subjects).
Every effort is made by the editors, boardof editorial advisors and publishers to seethat no inaccurate or misleading data,opinions, or statements appear in thisjournal, they wish to make clear that dataand opinions appearing in the articles arethe sole responsibility of the contributorconcerned. The CJPAS accept noresponsibility for the misleading data,opinion or statements.
7845 15th Street BurnabyBritish Columbia V3N 3A3 Canadawww.cjpas.netE-mail: [email protected]
Academic PublishersSENRA
CANADIAN JOURNAL OFPURE AND APPLIED SCIENCES
Print ISSN 1715-9997Online ISSN 1920-3853
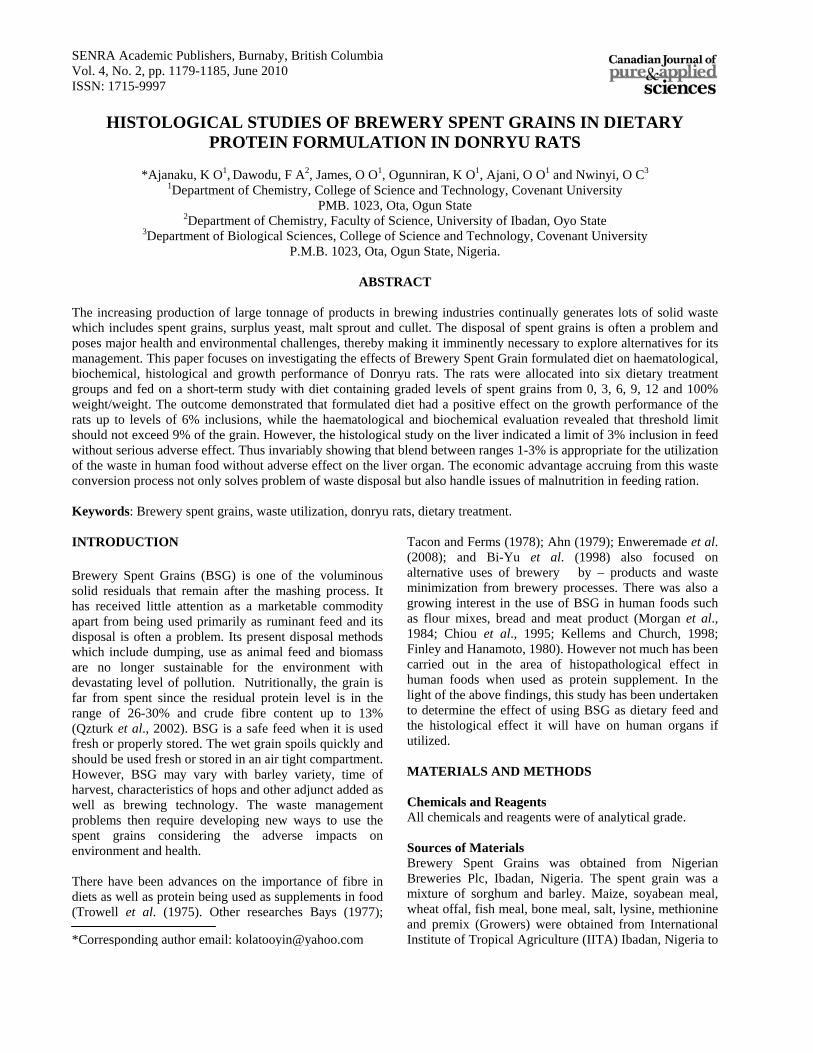
SENRA Academic Publishers, Burnaby, British Columbia Vol. 4, No. 2, pp. 1179-1185, June 2010 ISSN: 1715-9997
HISTOLOGICAL STUDIES OF BREWERY SPENT GRAINS IN DIETARY PROTEIN FORMULATION IN DONRYU RATS
*Ajanaku, K O1, Dawodu, F A2, James, O O1, Ogunniran, K O1, Ajani, O O1 and Nwinyi, O C3
1Department of Chemistry, College of Science and Technology, Covenant University PMB. 1023, Ota, Ogun State
2Department of Chemistry, Faculty of Science, University of Ibadan, Oyo State 3Department of Biological Sciences, College of Science and Technology, Covenant University
P.M.B. 1023, Ota, Ogun State, Nigeria.
ABSTRACT The increasing production of large tonnage of products in brewing industries continually generates lots of solid waste which includes spent grains, surplus yeast, malt sprout and cullet. The disposal of spent grains is often a problem and poses major health and environmental challenges, thereby making it imminently necessary to explore alternatives for its management. This paper focuses on investigating the effects of Brewery Spent Grain formulated diet on haematological, biochemical, histological and growth performance of Donryu rats. The rats were allocated into six dietary treatment groups and fed on a short-term study with diet containing graded levels of spent grains from 0, 3, 6, 9, 12 and 100% weight/weight. The outcome demonstrated that formulated diet had a positive effect on the growth performance of the rats up to levels of 6% inclusions, while the haematological and biochemical evaluation revealed that threshold limit should not exceed 9% of the grain. However, the histological study on the liver indicated a limit of 3% inclusion in feed without serious adverse effect. Thus invariably showing that blend between ranges 1-3% is appropriate for the utilization of the waste in human food without adverse effect on the liver organ. The economic advantage accruing from this waste conversion process not only solves problem of waste disposal but also handle issues of malnutrition in feeding ration. Keywords: Brewery spent grains, waste utilization, donryu rats, dietary treatment. INTRODUCTION Brewery Spent Grains (BSG) is one of the voluminous solid residuals that remain after the mashing process. It has received little attention as a marketable commodity apart from being used primarily as ruminant feed and its disposal is often a problem. Its present disposal methods which include dumping, use as animal feed and biomass are no longer sustainable for the environment with devastating level of pollution. Nutritionally, the grain is far from spent since the residual protein level is in the range of 26-30% and crude fibre content up to 13% (Qzturk et al., 2002). BSG is a safe feed when it is used fresh or properly stored. The wet grain spoils quickly and should be used fresh or stored in an air tight compartment. However, BSG may vary with barley variety, time of harvest, characteristics of hops and other adjunct added as well as brewing technology. The waste management problems then require developing new ways to use the spent grains considering the adverse impacts on environment and health. There have been advances on the importance of fibre in diets as well as protein being used as supplements in food (Trowell et al. (1975). Other researches Bays (1977);
Tacon and Ferms (1978); Ahn (1979); Enweremade et al. (2008); and Bi-Yu et al. (1998) also focused on alternative uses of brewery by – products and waste minimization from brewery processes. There was also a growing interest in the use of BSG in human foods such as flour mixes, bread and meat product (Morgan et al., 1984; Chiou et al., 1995; Kellems and Church, 1998; Finley and Hanamoto, 1980). However not much has been carried out in the area of histopathological effect in human foods when used as protein supplement. In the light of the above findings, this study has been undertaken to determine the effect of using BSG as dietary feed and the histological effect it will have on human organs if utilized. MATERIALS AND METHODS Chemicals and Reagents All chemicals and reagents were of analytical grade. Sources of Materials Brewery Spent Grains was obtained from Nigerian Breweries Plc, Ibadan, Nigeria. The spent grain was a mixture of sorghum and barley. Maize, soyabean meal, wheat offal, fish meal, bone meal, salt, lysine, methionine and premix (Growers) were obtained from International Institute of Tropical Agriculture (IITA) Ibadan, Nigeria to *Corresponding author email: [email protected]

Canadian Journal of Pure and Applied Sciences 1180
prepare the rats feed. The rats for the experiment were obtained from the animal farm of Cocoa Research Institute (CRIN) Ibadan having life average weight range of 49.92 ± 5.69g. The rats were in the family of Donryu species and were four weeks old before the commencement of the experiments. The ethnic use of the animals was also obtained from the Institute. Treatment of Brewery Spent Grains Sample The BSG samples were collected in wet form, sundried and later dried at 40oC for six hours in an electric oven. It was then stored in an airtight container till the time of use. The dried BSG was milled to increase the surface area. The moisture content, ash content, crude fat, crude protein, crude fibre and the nitrogen-free extract of the BSG were determined. The BSG were mixed with rats feed at levels of 0, 3, 6, 9, 12 and 100% w/w. The 0% was the control, while the 100% serves as the extreme use of BSG alone. Treatment of Animals The thirty six (Donryu) rats were allocated into six dietary treatment groups of six rats each and confined into individual cages during the experimental period. The animals were free from externals and internal parasites. The study was conducted during the rainy season and the cages were built for easy collection of the faeces and urine. They were weighed at the beginning of the experiment as zero (0) day; fed according to their group levels with the BSG compounded feeds and subsequently weighed at daily intervals in a short time study of fifteen days. Preparation of Blood Samples On the sixteenth day of the experiment, the rats were humanely slaughtered using cervical dislocation method of Euthanasia Klaunberg et al. (2004). Their blood samples were collected into two heparinized tubes for the studies; one tube contains ethylene diaminetetracetic acid (EDTA) with calcium serving as anticoagulant in the blood samples for the haematology tests while the second tubes, which did not contain EDTA, were stored at -20oC for the biochemical studies. The internal organs of the rats (liver, heart and kidney) were collected and weighed. The microscopic slide of the liver organs were then prepared and observed. Analysis of Heamatological and Biochemical Parameters Red blood Cell (RBC) and white blood cell (WBC) counts were determined using Neubauer haemocytometer. Packed cell volume (PVC) was determined using haematocrit centrifuge. Haemoglobin was determined by cyanmethemoglobin method (MCH), Mean Corpuscular Haemoglobin (MCH) and Mean Corpuscular Haemoglobin Concentration (MCHC) were determined according to the methods of Jain (1986). Glutamate
Pyruvate Transaminose (GPT), Glutamate Oxaloacetate Transaminase (GOT), Globulin (GLB), Albumin (ALB) and Alkaline Phosphatase (ALP) were analysed spectrophotometrically by using commercially available diagnostic kits. STATISTICAL ANALYSIS The data collected were subjected to statistical analysis of variance and means compared by the Duncan’s Multiple Range Test (Steel and Torrie, 1980). RESULT AND DISCUSSION The proximate analysis of the Brewery Spent Grains (BSG) samples is presented in table 1. The carbohydrate level was high with value of 51.38% and coupled with the 38% of nitrogen-free extract and crude protein of 23.19% gives a clue of a balanced formulation if the BSG is compounded as feed blends. The high protein values observed in the sample was due to the protein rest and washing operation of the grains during the brewing process. Table 1. Proximate Analysis of the Brewery Spent Grains (BSG) Samples.
Analysis Percentage Mean Amount (%)
Crude Protein Crude Fibre Crude Fat Moisture Content Ash Content Carbohydrate Total Nitrogen Nitrogen – Free Extract
23.20 12.85 2.79 6.14
16.99 51.39 3.71
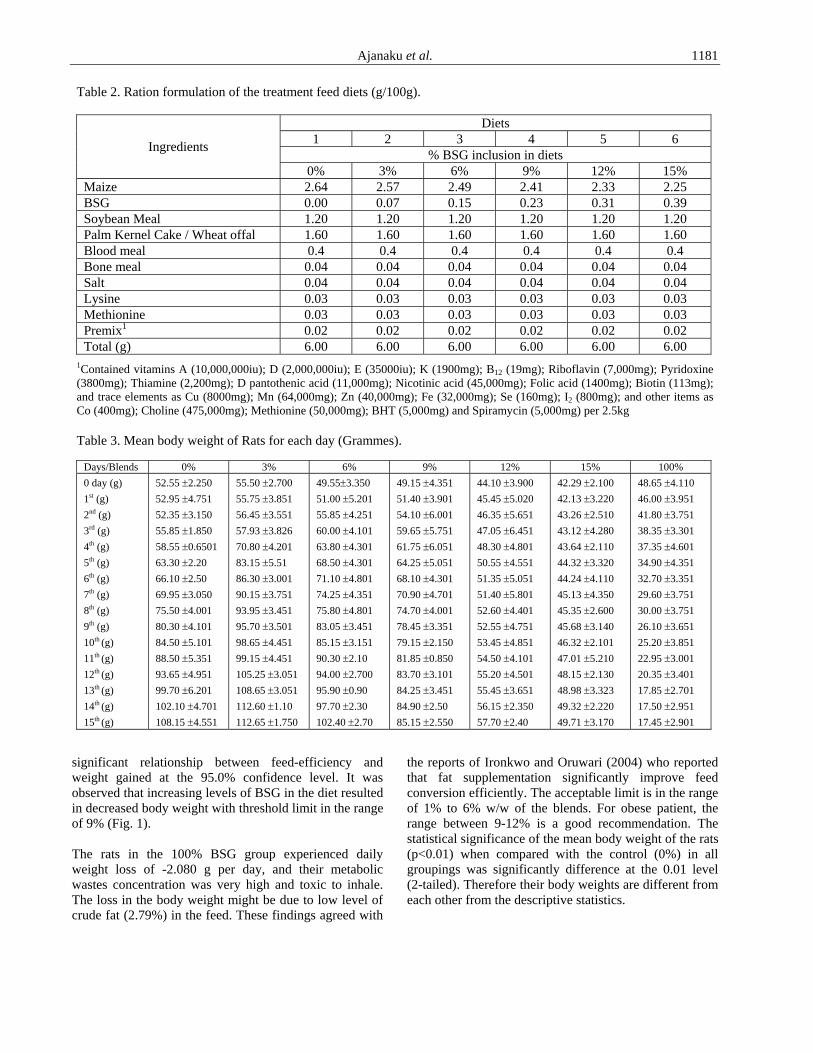
38.03 The ration formulation for the feed diet is shown in table 2 while the effect of spent grains on the weight of the rats and the average weights of the rats are shown in tables 3 and 4. The effect of BSG blend on the weight of the rats was commendable. The 3 and 6% BSG blends gave an average daily weight gain of 3.810 and 3.520g respectively, which was higher than the value of 3.706g obtained for the control (0% BSG). There was significance increase (p < 0.05) in the average weight gained by the rats fed in all the groupings except in the 100% group. This implied a high feed-efficiency due to increased level of blending of the spent grains. The statistical analysis shows that the results fits a linear model of 0.532024 - 0.154247 x Weight Gain in order to describe the relationship between the feed-efficiency and weight gain. This also revealed 84.58% of the variability in feed-efficiency while the correlation coefficient indicated a strong relationship between the variables. Since the p-value is < 0.05, there is a statistically
Ajanaku et al.
1181
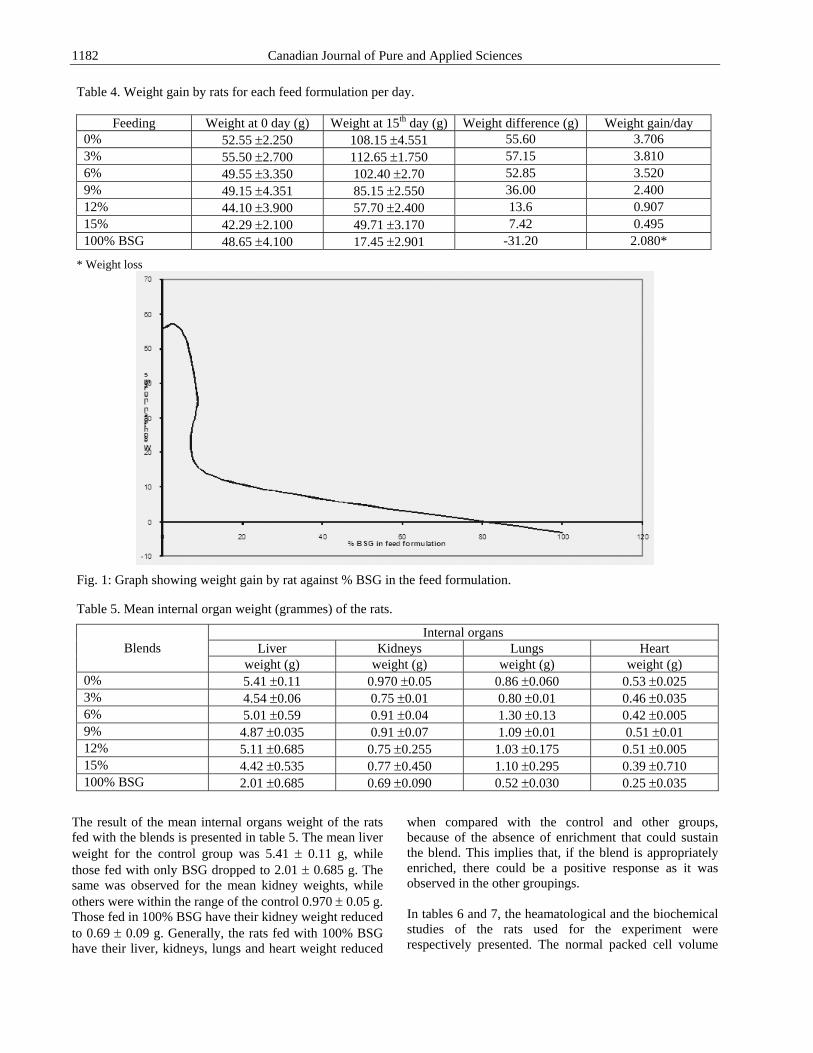
significant relationship between feed-efficiency and weight gained at the 95.0% confidence level. It was observed that increasing levels of BSG in the diet resulted in decreased body weight with threshold limit in the range of 9% (Fig. 1). The rats in the 100% BSG group experienced daily weight loss of -2.080 g per day, and their metabolic wastes concentration was very high and toxic to inhale. The loss in the body weight might be due to low level of crude fat (2.79%) in the feed. These findings agreed with
the reports of Ironkwo and Oruwari (2004) who reported that fat supplementation significantly improve feed conversion efficiently. The acceptable limit is in the range of 1% to 6% w/w of the blends. For obese patient, the range between 9-12% is a good recommendation. The statistical significance of the mean body weight of the rats (p<0.01) when compared with the control (0%) in all groupings was significantly difference at the 0.01 level (2-tailed). Therefore their body weights are different from each other from the descriptive statistics.
Table 2. Ration formulation of the treatment feed diets (g/100g).
Diets 1 2 3 4 5 6
% BSG inclusion in diets Ingredients
0% 3% 6% 9% 12% 15% Maize 2.64 2.57 2.49 2.41 2.33 2.25 BSG 0.00 0.07 0.15 0.23 0.31 0.39 Soybean Meal 1.20 1.20 1.20 1.20 1.20 1.20 Palm Kernel Cake / Wheat offal 1.60 1.60 1.60 1.60 1.60 1.60 Blood meal 0.4 0.4 0.4 0.4 0.4 0.4 Bone meal 0.04 0.04 0.04 0.04 0.04 0.04 Salt 0.04 0.04 0.04 0.04 0.04 0.04 Lysine 0.03 0.03 0.03 0.03 0.03 0.03 Methionine 0.03 0.03 0.03 0.03 0.03 0.03 Premix1 0.02 0.02 0.02 0.02 0.02 0.02 Total (g) 6.00 6.00 6.00 6.00 6.00 6.00
1Contained vitamins A (10,000,000iu); D (2,000,000iu); E (35000iu); K (1900mg); B12 (19mg); Riboflavin (7,000mg); Pyridoxine (3800mg); Thiamine (2,200mg); D pantothenic acid (11,000mg); Nicotinic acid (45,000mg); Folic acid (1400mg); Biotin (113mg); and trace elements as Cu (8000mg); Mn (64,000mg); Zn (40,000mg); Fe (32,000mg); Se (160mg); I2 (800mg); and other items as Co (400mg); Choline (475,000mg); Methionine (50,000mg); BHT (5,000mg) and Spiramycin (5,000mg) per 2.5kg Table 3. Mean body weight of Rats for each day (Grammes).
Days/Blends 0% 3% 6% 9% 12% 15% 100% 0 day (g) 1st (g) 2nd (g) 3rd (g) 4th (g) 5th (g) 6th (g) 7th (g) 8th (g) 9th (g) 10th (g) 11th (g) 12th (g) 13th (g) 14th (g) 15th (g)
52.55 ±2.250 52.95 ±4.751 52.35 ±3.150 55.85 ±1.850 58.55 ±0.6501 63.30 ±2.20 66.10 ±2.50 69.95 ±3.050 75.50 ±4.001 80.30 ±4.101 84.50 ±5.101 88.50 ±5.351 93.65 ±4.951 99.70 ±6.201 102.10 ±4.701 108.15 ±4.551
55.50 ±2.700 55.75 ±3.851 56.45 ±3.551 57.93 ±3.826 70.80 ±4.201 83.15 ±5.51 86.30 ±3.001 90.15 ±3.751 93.95 ±3.451 95.70 ±3.501 98.65 ±4.451 99.15 ±4.451 105.25 ±3.051 108.65 ±3.051 112.60 ±1.10 112.65 ±1.750
49.55±3.350 51.00 ±5.201 55.85 ±4.251 60.00 ±4.101 63.80 ±4.301 68.50 ±4.301 71.10 ±4.801 74.25 ±4.351 75.80 ±4.801 83.05 ±3.451 85.15 ±3.151 90.30 ±2.10 94.00 ±2.700 95.90 ±0.90 97.70 ±2.30 102.40 ±2.70
49.15 ±4.351 51.40 ±3.901 54.10 ±6.001 59.65 ±5.751 61.75 ±6.051 64.25 ±5.051 68.10 ±4.301 70.90 ±4.701 74.70 ±4.001 78.45 ±3.351 79.15 ±2.150 81.85 ±0.850 83.70 ±3.101 84.25 ±3.451 84.90 ±2.50 85.15 ±2.550
44.10 ±3.900 45.45 ±5.020 46.35 ±5.651 47.05 ±6.451 48.30 ±4.801 50.55 ±4.551 51.35 ±5.051 51.40 ±5.801 52.60 ±4.401 52.55 ±4.751 53.45 ±4.851 54.50 ±4.101 55.20 ±4.501 55.45 ±3.651 56.15 ±2.350 57.70 ±2.40
42.29 ±2.100 42.13 ±3.220 43.26 ±2.510 43.12 ±4.280 43.64 ±2.110 44.32 ±3.320 44.24 ±4.110 45.13 ±4.350 45.35 ±2.600 45.68 ±3.140 46.32 ±2.101 47.01 ±5.210 48.15 ±2.130 48.98 ±3.323 49.32 ±2.220 49.71 ±3.170
48.65 ±4.110 46.00 ±3.951 41.80 ±3.751 38.35 ±3.301 37.35 ±4.601 34.90 ±4.351 32.70 ±3.351 29.60 ±3.751 30.00 ±3.751 26.10 ±3.651 25.20 ±3.851 22.95 ±3.001 20.35 ±3.401 17.85 ±2.701 17.50 ±2.951 17.45 ±2.901
Canadian Journal of Pure and Applied Sciences 1182
The result of the mean internal organs weight of the rats fed with the blends is presented in table 5. The mean liver weight for the control group was 5.41 ± 0.11 g, while those fed with only BSG dropped to 2.01 ± 0.685 g. The same was observed for the mean kidney weights, while others were within the range of the control 0.970 ± 0.05 g. Those fed in 100% BSG have their kidney weight reduced to 0.69 ± 0.09 g. Generally, the rats fed with 100% BSG have their liver, kidneys, lungs and heart weight reduced
when compared with the control and other groups, because of the absence of enrichment that could sustain the blend. This implies that, if the blend is appropriately enriched, there could be a positive response as it was observed in the other groupings. In tables 6 and 7, the heamatological and the biochemical studies of the rats used for the experiment were respectively presented. The normal packed cell volume
Table 4. Weight gain by rats for each feed formulation per day.
Feeding Weight at 0 day (g) Weight at 15th day (g) Weight difference (g) Weight gain/day 0% 52.55 ±2.250 108.15 ±4.551 55.60 3.706 3% 55.50 ±2.700 112.65 ±1.750 57.15 3.810 6% 49.55 ±3.350 102.40 ±2.70 52.85 3.520 9% 49.15 ±4.351 85.15 ±2.550 36.00 2.400 12% 44.10 ±3.900 57.70 ±2.400 13.6 0.907 15% 42.29 ±2.100 49.71 ±3.170 7.42 0.495 100% BSG 48.65 ±4.100 17.45 ±2.901 -31.20 2.080*
* Weight loss
Fig. 1: Graph showing weight gain by rat against % BSG in the feed formulation. Table 5. Mean internal organ weight (grammes) of the rats.
Internal organs Liver Kidneys Lungs Heart Blends
weight (g) weight (g) weight (g) weight (g) 0% 5.41 ±0.11 0.970 ±0.05 0.86 ±0.060 0.53 ±0.025 3% 4.54 ±0.06 0.75 ±0.01 0.80 ±0.01 0.46 ±0.035 6% 5.01 ±0.59 0.91 ±0.04 1.30 ±0.13 0.42 ±0.005 9% 4.87 ±0.035 0.91 ±0.07 1.09 ±0.01 0.51 ±0.01 12% 5.11 ±0.685 0.75 ±0.255 1.03 ±0.175 0.51 ±0.005 15% 4.42 ±0.535 0.77 ±0.450 1.10 ±0.295 0.39 ±0.710 100% BSG 2.01 ±0.685 0.69 ±0.090 0.52 ±0.030 0.25 ±0.035
Ajanaku et al.
1183
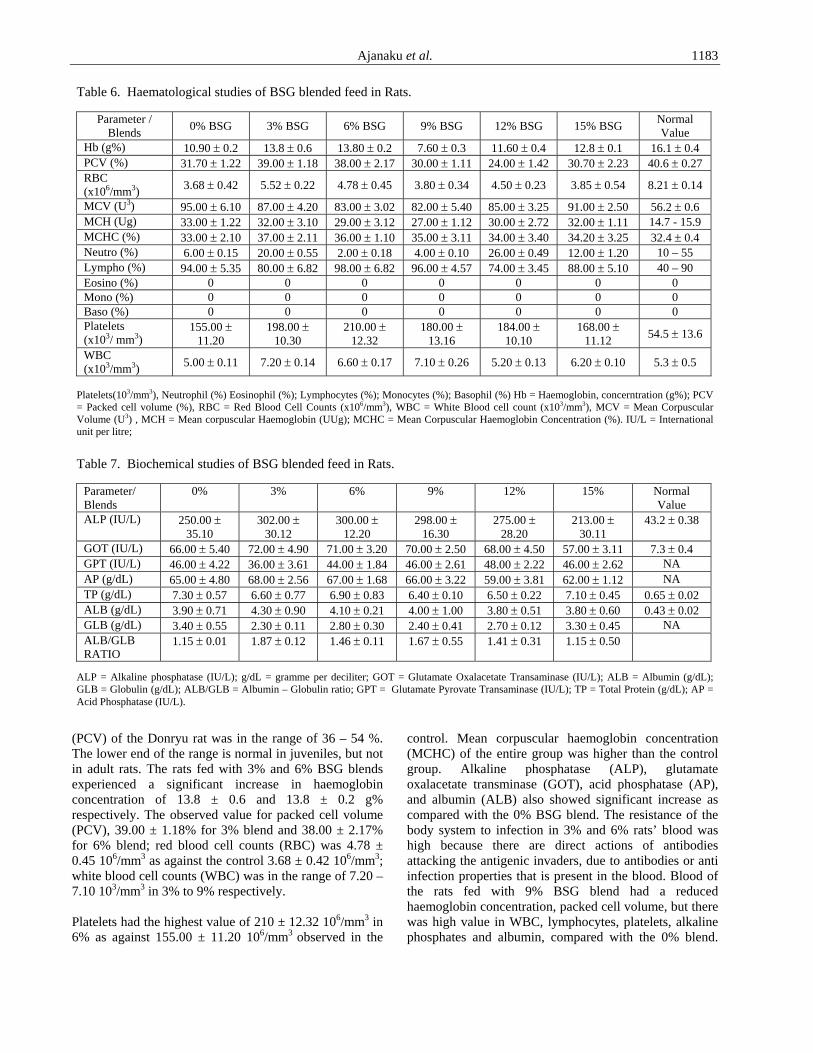
(PCV) of the Donryu rat was in the range of 36 – 54 %. The lower end of the range is normal in juveniles, but not in adult rats. The rats fed with 3% and 6% BSG blends experienced a significant increase in haemoglobin concentration of 13.8 ± 0.6 and 13.8 ± 0.2 g% respectively. The observed value for packed cell volume (PCV), 39.00 ± 1.18% for 3% blend and 38.00 ± 2.17% for 6% blend; red blood cell counts (RBC) was 4.78 ± 0.45 106/mm3 as against the control 3.68 ± 0.42 106/mm3; white blood cell counts (WBC) was in the range of 7.20 – 7.10 103/mm3 in 3% to 9% respectively. Platelets had the highest value of 210 ± 12.32 106/mm3 in 6% as against 155.00 ± 11.20 106/mm3 observed in the
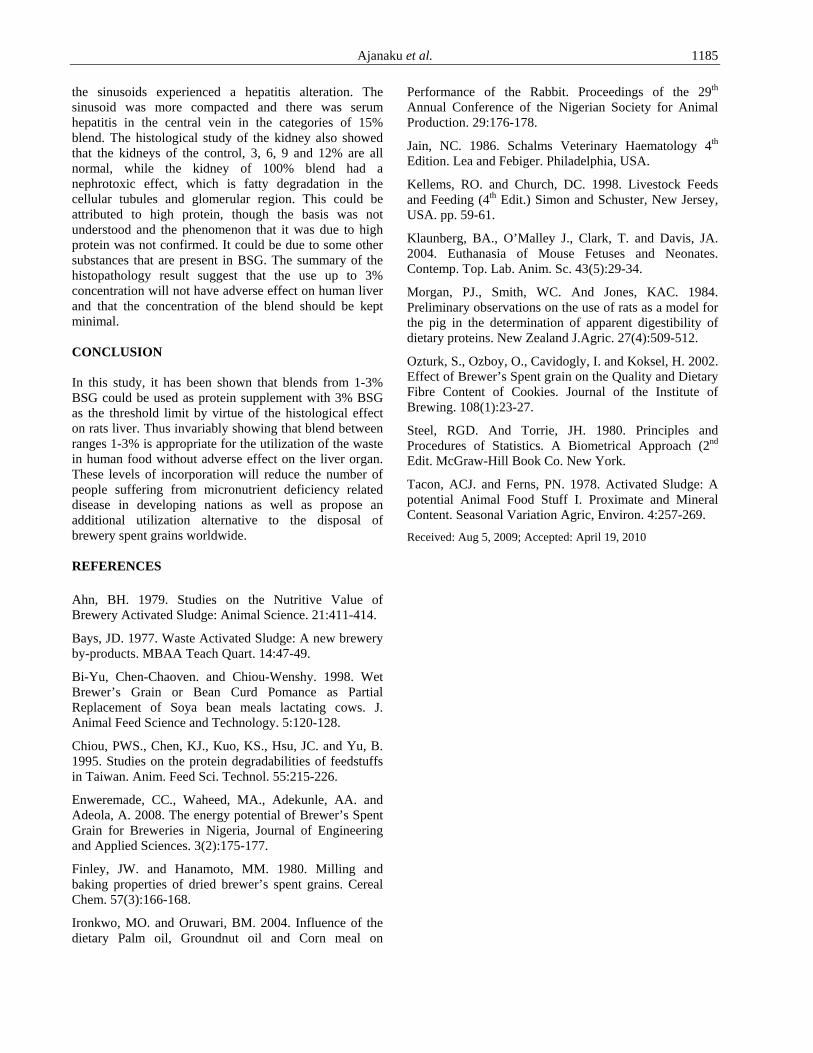
control. Mean corpuscular haemoglobin concentration (MCHC) of the entire group was higher than the control group. Alkaline phosphatase (ALP), glutamate oxalacetate transminase (GOT), acid phosphatase (AP), and albumin (ALB) also showed significant increase as compared with the 0% BSG blend. The resistance of the body system to infection in 3% and 6% rats’ blood was high because there are direct actions of antibodies attacking the antigenic invaders, due to antibodies or anti infection properties that is present in the blood. Blood of the rats fed with 9% BSG blend had a reduced haemoglobin concentration, packed cell volume, but there was high value in WBC, lymphocytes, platelets, alkaline phosphates and albumin, compared with the 0% blend.
Table 6. Haematological studies of BSG blended feed in Rats.
Parameter / Blends 0% BSG 3% BSG 6% BSG 9% BSG 12% BSG 15% BSG Normal
Value Hb (g%) 10.90 ± 0.2 13.8 ± 0.6 13.80 ± 0.2 7.60 ± 0.3 11.60 ± 0.4 12.8 ± 0.1 16.1 ± 0.4 PCV (%) 31.70 ± 1.22 39.00 ± 1.18 38.00 ± 2.17 30.00 ± 1.11 24.00 ± 1.42 30.70 ± 2.23 40.6 ± 0.27 RBC (x106/mm3) 3.68 ± 0.42 5.52 ± 0.22 4.78 ± 0.45 3.80 ± 0.34 4.50 ± 0.23 3.85 ± 0.54 8.21 ± 0.14
MCV (U3) 95.00 ± 6.10 87.00 ± 4.20 83.00 ± 3.02 82.00 ± 5.40 85.00 ± 3.25 91.00 ± 2.50 56.2 ± 0.6 MCH (Ug) 33.00 ± 1.22 32.00 ± 3.10 29.00 ± 3.12 27.00 ± 1.12 30.00 ± 2.72 32.00 ± 1.11 14.7 - 15.9 MCHC (%) 33.00 ± 2.10 37.00 ± 2.11 36.00 ± 1.10 35.00 ± 3.11 34.00 ± 3.40 34.20 ± 3.25 32.4 ± 0.4 Neutro (%) 6.00 ± 0.15 20.00 ± 0.55 2.00 ± 0.18 4.00 ± 0.10 26.00 ± 0.49 12.00 ± 1.20 10 – 55 Lympho (%) 94.00 ± 5.35 80.00 ± 6.82 98.00 ± 6.82 96.00 ± 4.57 74.00 ± 3.45 88.00 ± 5.10 40 – 90 Eosino (%) 0 0 0 0 0 0 0 Mono (%) 0 0 0 0 0 0 0 Baso (%) 0 0 0 0 0 0 0 Platelets (x103/ mm3)
155.00 ± 11.20
198.00 ± 10.30
210.00 ± 12.32
180.00 ± 13.16
184.00 ± 10.10
168.00 ± 11.12 54.5 ± 13.6
WBC (x103/mm3) 5.00 ± 0.11 7.20 ± 0.14 6.60 ± 0.17 7.10 ± 0.26 5.20 ± 0.13 6.20 ± 0.10 5.3 ± 0.5
Platelets(103/mm3), Neutrophil (%) Eosinophil (%); Lymphocytes (%); Monocytes (%); Basophil (%) Hb = Haemoglobin, concerntration (g%); PCV = Packed cell volume (%), RBC = Red Blood Cell Counts (x106/mm3), WBC = White Blood cell count (x103/mm3), MCV = Mean Corpuscular Volume (U3) , MCH = Mean corpuscular Haemoglobin (UUg); MCHC = Mean Corpuscular Haemoglobin Concentration (%). IU/L = International unit per litre; Table 7. Biochemical studies of BSG blended feed in Rats.
Parameter/ Blends
0% 3% 6% 9% 12% 15% Normal Value
ALP (IU/L) 250.00 ± 35.10
302.00 ± 30.12
300.00 ± 12.20
298.00 ± 16.30
275.00 ± 28.20
213.00 ± 30.11
43.2 ± 0.38
GOT (IU/L) 66.00 ± 5.40 72.00 ± 4.90 71.00 ± 3.20 70.00 ± 2.50 68.00 ± 4.50 57.00 ± 3.11 7.3 ± 0.4 GPT (IU/L) 46.00 ± 4.22 36.00 ± 3.61 44.00 ± 1.84 46.00 ± 2.61 48.00 ± 2.22 46.00 ± 2.62 NA AP (g/dL) 65.00 ± 4.80 68.00 ± 2.56 67.00 ± 1.68 66.00 ± 3.22 59.00 ± 3.81 62.00 ± 1.12 NA TP (g/dL) 7.30 ± 0.57 6.60 ± 0.77 6.90 ± 0.83 6.40 ± 0.10 6.50 ± 0.22 7.10 ± 0.45 0.65 ± 0.02 ALB (g/dL) 3.90 ± 0.71 4.30 ± 0.90 4.10 ± 0.21 4.00 ± 1.00 3.80 ± 0.51 3.80 ± 0.60 0.43 ± 0.02 GLB (g/dL) 3.40 ± 0.55 2.30 ± 0.11 2.80 ± 0.30 2.40 ± 0.41 2.70 ± 0.12 3.30 ± 0.45 NA ALB/GLB RATIO
1.15 ± 0.01 1.87 ± 0.12 1.46 ± 0.11 1.67 ± 0.55 1.41 ± 0.31 1.15 ± 0.50
ALP = Alkaline phosphatase (IU/L); g/dL = gramme per deciliter; GOT = Glutamate Oxalacetate Transaminase (IU/L); ALB = Albumin (g/dL); GLB = Globulin (g/dL); ALB/GLB = Albumin – Globulin ratio; GPT = Glutamate Pyrovate Transaminase (IU/L); TP = Total Protein (g/dL); AP = Acid Phosphatase (IU/L).

Canadian Journal of Pure and Applied Sciences 1184
The rats fed with 12% blend had a low value in PCV, MCV, MCH, lymphocytes, AP, but increased value in ALP, Hb, RBC and WBC in comparison with the control. The 15% blends had a reduced MCV, MCH, ALP and lymphocytes values but an increased PCV, Hb, RBC, MCHC, WBC and platelets values. This result revealed that BSG presence activates oxygen in the blood cell thereby making the haemoglobin in the red blood cell inactive, a state which is termed hypoxia, and this enhances increase in the production of red blood cell counts and haemoglobin stimulating synthesis. It was observed that the histopathology result varies with the weather, climate, and region under which the experiment was carried out. The temperate and tropical region may have slight difference from each other in their blood result. In spite of this, it was observed that the rats fed with high concentration was adversely affected, hence low concentration of the blend is appropriate without side effects. Eosinophils count, monocytes and basophils counts are not significantly different in the blood of the rats, hence no significant change. The statistical
significance of the histophatology on blood of the different blends at the 0.01 level (2-tailed) of 99% confidence interval showed significant difference, but they are not significantly different at 0.05 level (2-tailed) at 95% confidence interval, p<0.05, when compared with the control. The histopathology study of the liver of the rats used as experimental model is shown in Plate 1 and Table 8. This revealed that the control blend cell looks normal, the central vein was seen and there was no visible lesion, the sinusoids were normal and the epithelium lining remained. In the 3% blend; the cell appeared normal but the sinusoids became larger and the space between sinusoids was bigger when compared to the control. There were mild periportal lymphocytic infiltrates noticed in the central vein. In 6% blend, the sinusoids became widened which encloses the central vein and the epithelia lining was affected too. The sinusoids almost disappeared and the hepatic cells were affected when the 9% blend was observed. For 12% blend, the central vein was seen and
Table 8. Histopathology result of rats’ liver.
Histology Formulation Sinusoids Central Vein 0% Normal No visible lesions 3% Normal Mild periportal lymphocytic infiltrates 6% Widening Epithelia lining affected 9% Almost disappeared Epithelia lining affected 12% Inflammatory Hepatitis 15% Compacted Hepatitis
Plate 1. Microscopic view of rats’ liver fed with BSG compounded feeds.
Ajanaku et al.
1185
the sinusoids experienced a hepatitis alteration. The sinusoid was more compacted and there was serum hepatitis in the central vein in the categories of 15% blend. The histological study of the kidney also showed that the kidneys of the control, 3, 6, 9 and 12% are all normal, while the kidney of 100% blend had a nephrotoxic effect, which is fatty degradation in the cellular tubules and glomerular region. This could be attributed to high protein, though the basis was not understood and the phenomenon that it was due to high protein was not confirmed. It could be due to some other substances that are present in BSG. The summary of the histopathology result suggest that the use up to 3% concentration will not have adverse effect on human liver and that the concentration of the blend should be kept minimal.
CONCLUSION In this study, it has been shown that blends from 1-3% BSG could be used as protein supplement with 3% BSG as the threshold limit by virtue of the histological effect on rats liver. Thus invariably showing that blend between ranges 1-3% is appropriate for the utilization of the waste in human food without adverse effect on the liver organ. These levels of incorporation will reduce the number of people suffering from micronutrient deficiency related disease in developing nations as well as propose an additional utilization alternative to the disposal of brewery spent grains worldwide. REFERENCES Ahn, BH. 1979. Studies on the Nutritive Value of Brewery Activated Sludge: Animal Science. 21:411-414.
Bays, JD. 1977. Waste Activated Sludge: A new brewery by-products. MBAA Teach Quart. 14:47-49.
Bi-Yu, Chen-Chaoven. and Chiou-Wenshy. 1998. Wet Brewer’s Grain or Bean Curd Pomance as Partial Replacement of Soya bean meals lactating cows. J. Animal Feed Science and Technology. 5:120-128.
Chiou, PWS., Chen, KJ., Kuo, KS., Hsu, JC. and Yu, B. 1995. Studies on the protein degradabilities of feedstuffs in Taiwan. Anim. Feed Sci. Technol. 55:215-226.
Enweremade, CC., Waheed, MA., Adekunle, AA. and Adeola, A. 2008. The energy potential of Brewer’s Spent Grain for Breweries in Nigeria, Journal of Engineering and Applied Sciences. 3(2):175-177.
Finley, JW. and Hanamoto, MM. 1980. Milling and baking properties of dried brewer’s spent grains. Cereal Chem. 57(3):166-168.
Ironkwo, MO. and Oruwari, BM. 2004. Influence of the dietary Palm oil, Groundnut oil and Corn meal on
Performance of the Rabbit. Proceedings of the 29th Annual Conference of the Nigerian Society for Animal Production. 29:176-178.
Jain, NC. 1986. Schalms Veterinary Haematology 4th Edition. Lea and Febiger. Philadelphia, USA.
Kellems, RO. and Church, DC. 1998. Livestock Feeds and Feeding (4th Edit.) Simon and Schuster, New Jersey, USA. pp. 59-61.
Klaunberg, BA., O’Malley J., Clark, T. and Davis, JA. 2004. Euthanasia of Mouse Fetuses and Neonates. Contemp. Top. Lab. Anim. Sc. 43(5):29-34.
Morgan, PJ., Smith, WC. And Jones, KAC. 1984. Preliminary observations on the use of rats as a model for the pig in the determination of apparent digestibility of dietary proteins. New Zealand J.Agric. 27(4):509-512.
Ozturk, S., Ozboy, O., Cavidogly, I. and Koksel, H. 2002. Effect of Brewer’s Spent grain on the Quality and Dietary Fibre Content of Cookies. Journal of the Institute of Brewing. 108(1):23-27.
Steel, RGD. And Torrie, JH. 1980. Principles and Procedures of Statistics. A Biometrical Approach (2nd Edit. McGraw-Hill Book Co. New York.
Tacon, ACJ. and Ferns, PN. 1978. Activated Sludge: A potential Animal Food Stuff I. Proximate and Mineral Content. Seasonal Variation Agric, Environ. 4:257-269.
Received: Aug 5, 2009; Accepted: April 19, 2010