Purchasing Practices and Their Impact on Toy & Children’s ... · Toy & Children’s Juvenile...
37
1 Purchasing Practices and Their Impact on Toy & Children’s Juvenile Product Factories: Balancing Marketplace Realities and Social Compliance Standards
Transcript of Purchasing Practices and Their Impact on Toy & Children’s ... · Toy & Children’s Juvenile...

1
Purchasing Practices and Their Impact on Toy & Children’s Juvenile Product Factories: Balancing Marketplace Realities and Social Compliance Standards

April 24, 2013 Slide 2
Question and Answer Period
Please keep all questions general … details about specific issues will not be addressed.
To communicate with the webinar moderator at any time during this session, please select either of the following options:
– Send a question using the “Q&A” drop down menu near the middle of the LiveMeeting navigation bar
– Start a private chat by double-clicking on “Stacy Leistner – TIA Administrator” in the list of participants under the “Attendees” drop-down menu
To submit a question for review during the open dialogue, use the “Q&A” drop down menu near the middle of the LiveMeeting navigation bar
Download a copy of the presentation slides from the “Handouts” drop down menu (the graphic looks like three sheets of stacked papers) on the right-hand side of the LiveMeeting navigation bar

April 24, 2013 Slide 3
Objective
During this one-hour webinar – part of an ongoing series of TIA education updates – toy industry stakeholders will gain a deeper understanding of updates on recent and upcoming ICTI CARE Process activities aimed at eliminating substandard health, safety and labor practices in toy factories around the world.

April 24, 2013 Slide 4
Today’s Presenters
MODERATOR
Ed Desmond Executive Vice President
External Affairs
PRESENTER
Mark Jones Chief Marketing and
Product Officer
PRESENTER
Christian Ewert CEO and President

April 24, 2013 Slide 5
Overview of Today’s Presentation
This webinar will consist of two parts:
– Part One … 50 minutes • Introductions • Global Industry Observations • Children’s Products Industry Perspective • Best Practices in the Children’s Products Industry • Business Case
– Part Two … 10 minutes • Question and answer period
NOTE: Questions may be submitted throughout the session via the
Question/Answer component of LiveMeeting


7
Global Industry Observations

The Uniqueness of Industry Categories
8
Category Practice Social Issue Solution
Electronics New product launch Recruiting – student workers Longer lead time
Apparel Lead times, seasonality Working hours Longer lead time
Discounters One off buys Wages, working hours
Consolidate purchasing
Footwear Lead times, multiple factories, small orders
Everything Consolidate purchasing, longer lead time
Direct importers Price chase smaller factories Everything Pick the right
factory

Sourcing Strategy
9
Units Purchased
Total Production 10,000 25,000 50,000 75,000 100,000 125,000 150,000 175,000 200,000 250,000 300,000 350,000 400,000 500,000 600,000 700,000 800,000 1,000,000 1,250,000 1,500,000 2,000,000 2,500,000 Total
100,000 46 1 1 48250,000 32 1 3 36500,000 15 1 2 6 4 7 2 37
1,000,000 6 7 1 1 1 1 2 2 4 3 2 301,500,000 2 6 1 1 1 1 3 4 3 1 2 1 262,000,000 4 1 2 2 2 1 1 2 1 2 2 6 2 2 5 352,500,000 9 2 2 4 3 1 4 1 2 2 4 2 363,000,000 1 1 1 1 3 2 1 1 113,500,000 4 3 4 2 2 2 2 2 1 224,000,000 2 1 1 45,000,000 3 1 46,000,000 4 1 1 2 1 1 2 127,000,000 8 4 1 1 1 3 2 2 2 3 1 28
133 20 17 2 14 13 5 4 4 18 11 9 4 3 18 9 6 14 4 5 11 5 329
1. High purchasing leverage = high influence 2. Top 3 customer = some influence 3. Consistently growing orders – some influence
10
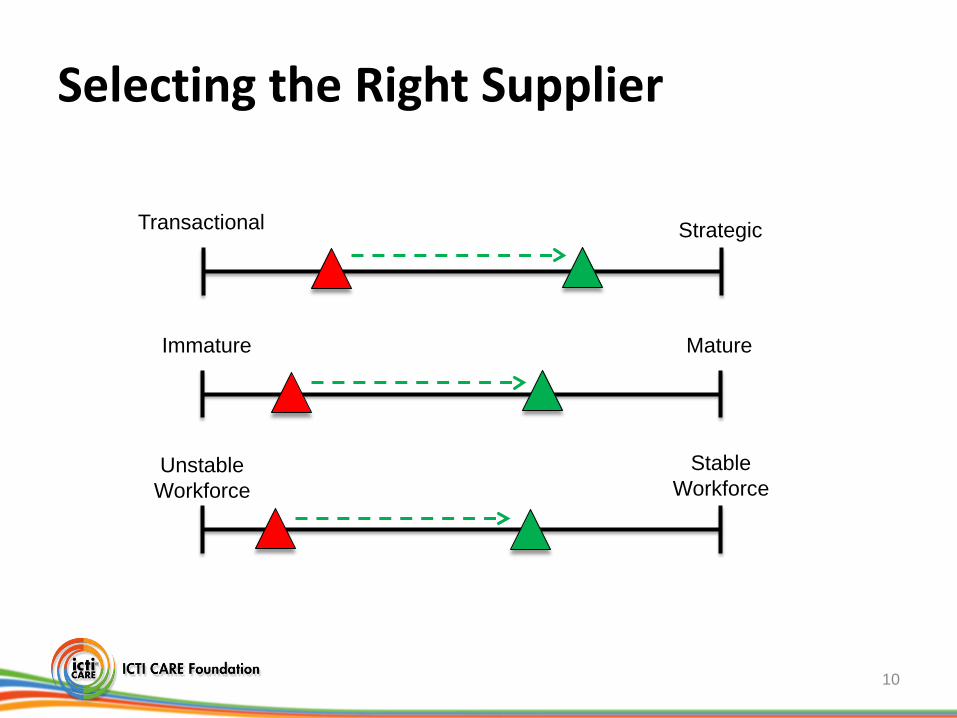
Unstable Workforce
Transactional Strategic
Selecting the Right Supplier
Immature Mature
Stable Workforce

The Factory Perspective
11
Purchasing practices that contribute to CSR challenges: – shorter lead times – nominating suppliers – late approvals – smaller order quantities – excessive sampling – payment terms – poor planning
2012 GSCP Survey and Interviews

The Reality
• Retailers and brands will source according to the demands of their customers.
• A factory is not going to be able to change a retailer who is trying to reduce the design to shelf cycle.
• Similarly, factories are not going to change order sizes when retailers are trying to better manage inventory.
12

It’s About Choice Retailers/Brands • Pick the right suppliers –
match your approach • Adopt SRM - supplier
relationship management • Be a better buyer
13
Suppliers • Pick the right customers • Align with the right agents • If bad buyer practices are
really an issue, document it, quantify the impact and share the findings
Presenter
Presentation Notes
Talk about 2 recent factory cases – align factory and smooth out purchasing Talk about 1 retailer – rationalize factory base Mention 1 brand – New launch challenge
14
Children’s Products Industry Perspective

About the ICTI CARE Process
• Who We Are – ICTI CARE Foundation, chartered in the US in 2004 is an independent non-profit organization (501.c6 ) that oversees the worldwide children’s product industry’s ethical manufacturing program, the ICTI CARE Process.
• Our Commitment – To improve working conditions for factory workers by eliminating substandard, health, safety and labor practices.
• Our Focus – Factory auditing and monitoring, auditor training, worker education and training, social compliance management, capacity building and best practices sharing.
15

16
ICTI CARE Process Overview: Current Status
Registered Factories
2,289
Certified Factories
1,490
ICP Committed
Companies
900 ____________________________________________________________
Class A 77%
Class B 4%
Class C 4%
On Probation 15%
As of March 2013
% of Certified Factories

17
ICTI CARE Process Overview: Current Status
Growing Acceptance of ICP
• Factory commitment up 5% in 2012.
• Toy brands signed up to ICP Committed Program (previously Date Certain) cover more than 75% of the global toy business.
• Five National Toy Associations have made the ICP Committed Program a firm condition for membership (Germany, Spain, Sweden and the US) – special solution for UK.
• Recognized by a growing number of retailers and licensors.
17

18 See full list on www.icti-care.org
And 900 more……
Growing Acceptance of ICP ________________________________________
18

Risks to ICP and Brand Reputation
Macro Economic Environment in China
• Seasonality of the Business
• Sluggish Business Environment
• Buyer “Just in Time” Delivery Expectation
• Constant Appreciation of the RMB
• Increasing Raw Material Costs
• Complexity of new Toy Safety Requirements (EN71-3 effective July 2013)
19

20
Risks to ICP and Brand Reputation Social Environment in China
• Shortage of labor (PRD & YRD)
• Low worker return rate following CNY
• Raise of worker’s compensation
• Urbanization/worker’s cost of living
• Limited factory management knowledge of HR management and worker expectations
• Different expectations from Generation “Y”
20
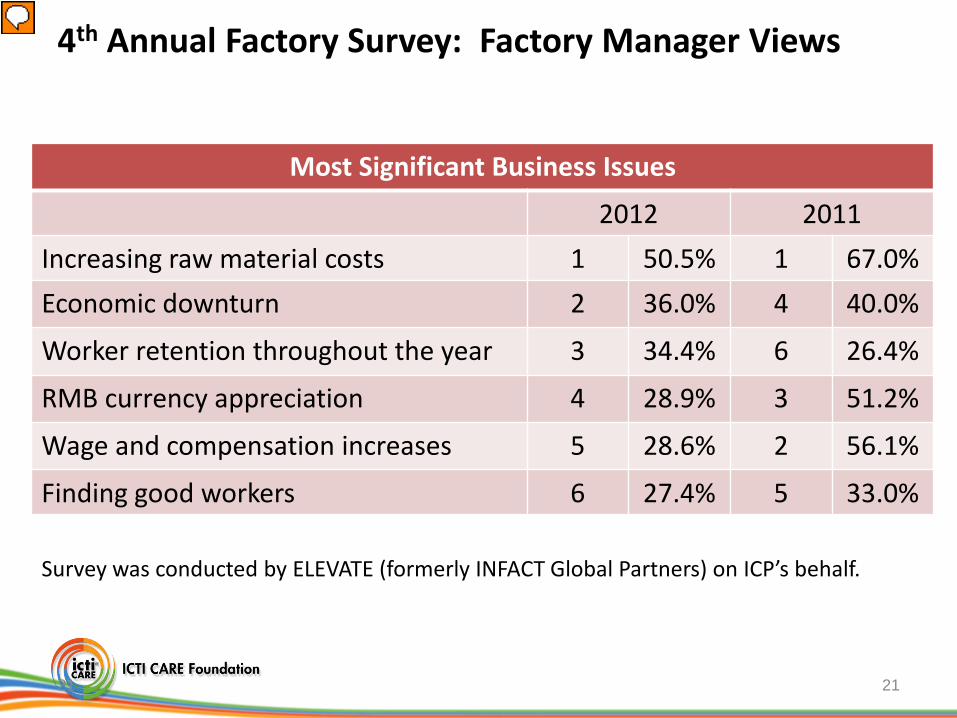
4th Annual Factory Survey: Factory Manager Views
21
Survey was conducted by ELEVATE (formerly INFACT Global Partners) on ICP’s behalf.
Most Significant Business Issues
2012 2011 Increasing raw material costs 1 50.5% 1 67.0% Economic downturn 2 36.0% 4 40.0%
Worker retention throughout the year 3 34.4% 6 26.4%
RMB currency appreciation 4 28.9% 3 51.2%
Wage and compensation increases 5 28.6% 2 56.1%
Finding good workers 6 27.4% 5 33.0%
21
Presenter
Presentation Notes
In comparison to the previous year’s results, the top six most significant business issues remain more or less the same. Increases in raw material costs continues to be the top challenge the factory is facing, whereas worker retention rose from number 6 to top 3. {I would note also that all the issues reduced, percentage-wise, from 2011 to 2012, except worker retention.}

4th Annual Factory Survey: Factory Manager View
22
Things that can help business the most 2012 2011
Better production planning (no last minute changes, realistic deadlines) 1 57.0% 1 55.1%
Larger order sizes 2 52.1% 2 52.3% More long-term/strategic partnership 3 46.4% 3 43.6% More insight into your customers strategic needs 4 30.5% 5 34.6%
Early order placement 5 29.1% 4 35.8% Efforts to improve worker-management communication 6 27.3% 6 26.3%
22
Presenter
Presentation Notes
From the respondent’s point of view, the top three things that can be helpful are better production planning, increased order volume and long-term strategic partnership. We can see that all top three measures are in regard to the buyers. Despite the fact that worker retention is a big challenge, respondents are less convinced that measures to improve worker-management communication would be of great benefit. Only approximately one fourth (27%) chose this option as one of the top three helpful measures.

ICP Helpline: Factory Worker View Top issues cited from 1 Jan-15 March 2013 (584 total)
17.3% • Dismissal
16.6% • Resignation
12.7% • Delayed Payment
11.1% • Holiday Leave/Leave Application
23

24
Best Practices in Children’s Products Industry

Three ICP Studies Conducted in 2012 Studies: • Misereor/University of Mannheim: Examines ICP contribution to improving
labor and social standards in the Chinese toy industry. • Shift: High-level gap analysis of how ICP aligns with the UN Guiding
Principles on Business and Human Rights. • Oxford University: A teaching case study, “ICTI CARE – A Case for Change”. Key Findings: • The factory auditing process and worker empowerment through capacity
building (“Train the Trainers,” CARE Card & Helpline) has been effective. • There are gaps that endanger validity and credibility of the ICP program: - No way to verify fulfillment of brand commitment and no penalties for non-fulfillment • One-sided focus on factories, with little brand/retailer/licensor/national
ICTI association involvement. All need to be equally committed.
25

Management Capacity Building Program
Social Accountability
Occupational Health & Safety
Lean Manufacturing
HR Management
Communication
• COC Awareness • Wages & Working Hours • Age • Related Social Issues
• OHS Awareness • OHS Management • Fire Safety • Chemical Safety • Machine Safety
• Production Lead Time • Labor Efficiency • Production Output • Quality Yield & Rework Output • Multi Skill Levels
• Complaints/Grievance Procedures • Worker – Management Dialogue • Factory – Brands • Workers Card • Helpline
• New Staff Mentoring • Training System • Performance System
IFIS
26

27
Business Case

Social Performance is a Function of Business Performance
28
Group Average
Group Leader
Country Average
Country Leader
Turnover 4.50% 10.10% 4.50% 3.20% 0.30%New Workforce to Total Workforce 42% 116% 42% 46% 16%Maximum % annual workforce change 59% 131% 59% 41% 4%
Production rate(average/month) per experienced wo 192.5 429.3 924.2 161.2 249.1Production rate(average/month) per new worker for 96.3 192.3 233.2 93.2 186.8Average Defect Rate 5.70% 7.00% 2.30% 11.80% 5.70%
Average % of workforce receiving incentives 88% 83% 54%Average Absenteeism 0.30% 0.80% 0.10% 0.50% 0.10%Injury Rate 0.10% 0.50% 0.10% 0.40% 0.00%
Average Working hours 50 58 50 50 45Average % of workers working less than or equal to 96% 76% 96% 96% 100%
Leading PerformanceAverage PerformancePoor Performance
KEY PERFORMANCE INDICATORS – Comparative Analysis
Based on January 2011 - December 2012 KPI Submissions
Factory A
Workforce Stability
Production
Worker Motivation
Social Performance
KEY:
Presenter
Presentation Notes
Social performance is a function of business performance Better business performers tend to be

Cost type Description Cost (USD)Separation Staff time for paperwork $ 1.11 Vacancy Overtime other staff less saved worker wages $ 13.63 Replacement Cost of staff to attract applicants & interview $ 4.12 Training Trainer & trainee salaries (orientation and on the job) $ 109.86 Opportunity costs
100% lost productivity during orientation and training and increased errors in the first month.
$ 231.29
TOTAL TURNOVER & REPLACEMENT COST/EMPLOYEE: $ 360.01
Total Cost Per Month - 70 replacement employees a month 25,200.43$ Annual Cost 302,405.10$
Savings from a 50% Reduction in New Hires 151,202.55$
The Cost of Turnover
Reduce turnover by 50%: savings of USD151,203
1,000 worker factory – replace 70 workers per month
Adapted from Corporate Social Responsibility in China’s Information and Communications Technology (ICT) Sector,” July 12, 2007, by Business for Social Responsibility
29
Presenter
Presentation Notes
One way of combatting the financial implications issue is to try to quantify productivity issues. In this case, we are looking specifically at the cost of worker turnover issue. Worker turnover in places like China and India can be really significant. Monthly worker turnover can range from 5% in apparel and footwear to 20% in electronics. Or it can be after a holiday. These losses can be 25% or more. In 2007 BSR did some work to try to understand the cost of turnover. We have adapted this for smaller factories. What they found was that the paperwork associated with separating workers, the cost of OT required where not an immediate replacement, training and lost productivity cost about 360USD per worker. With a 7% monthly worker loss rate, this would cost a factory 302,405USD a year. Just by reducing this by half, retaining 35 workers per month, the factory would save 151,202. This is money that would be used in offsetting any investment to retain those 35 workers.

ELEVATE low ELEVATE high BSR Study
Lost Workers - CNY 464.90 464.90 464.90
Cost per Worker 46.76$ 279.00$ 360.01$
Cost of workers lost 21,741$ 129,707$ 167,367$
Savings: retain half 10,870$ 64,854$ 83,683$
Investment 52,227$ 52,227$ 52,227$
Investment/Savings 4.805 0.805 0.624
Payback - months 57.65 9.66 7.49
Investment Payback
30
Presenter
Presentation Notes
changed Using a variety of estimated costs of turnover, we find that the savings for the most conservative cost or what is shown as INFACT low is $21,741. In other words, for every worker lost and replaced, the factory must spend $21,741. This includes costs of separating, finding, hiring, on-boarding and dealing issues arising during ramp up. What INFACT has seen as the highest cost is $279 USD per worker. The total cost of losing 465 workers would therefore be $129,707. Using the BSR cost per worker of 360 USD the cost would be 167,367. Huixun spent 52,227 USD on improvements. If we think back to earlier slides, payback represents how many months it takes for the savings to pay off the improvement costs. If we look at the BSR scenario, retaining half of the 465 workers (or 232 workers) would generate a savings of $83,683. This translates into a savings of $6,974 a month. As the total investment was $52,227, you would divide this by the monthly savings of $6,974. Payback would be 7.49 months. If you use the high cost per worker INFACT has seen, payback is 9.66 months. Were we to apply the lowest estimated cost per worker of 47 USD, the payback would be 57.65 months or 4.8 years. This does not look to be a particularly good deal. This highlights an important point when approaching factory management. You need credible estimates of worker replacement costs. Where payback is less than 12 months, factory management can probably be persuaded. More than that and it is a long term investment. Remember, factories are running businesses too.

KPMG/IDH/INFACT Report Business case analysis for responsible electronics
31
Lean manufacturing
AC, heat
shields
Better recruit, training,
info
Improve relation workers
supervisors
WMD training, promote
worker involve, worker-driven op efficiency

Learnings • There is a business case for better social
performance. • Many of social compliance root causes are
related to business performance issues. By fixing the business issue, can position to address the social.
• Better reporting can help make more informed choices.
32

Benefits of ICP Brand Commitment
• Capacity building - ICP Factory Improvement System (IFIS) Program trains factory managers and workers.
• Supplier transparency - Enablon software platform allows real-time visibility on supplier performance/compliance, ethical sourcing.
• Manage social compliance and reputation risks - Audits and Helpline protect workers, allow brands to meet ethical business standards.
33

Q&A
34

April 24, 2013 Slide 35
Question and Answer Period
Please keep all questions general … details about specific issues will not be addressed.
To communicate with the webinar moderator at any time during this session, please select either of the following options:
– Send a question using the “Q&A” drop down menu near the middle of the LiveMeeting navigation bar
– Start a private chat by double-clicking on “Ed Desmond– TIA Moderator” in the list of participants under the “Attendees” drop-down menu
To submit a question for review during the open dialogue, use the “Q&A” drop down menu near the middle of the LiveMeeting navigation bar
Download a copy of the presentation slides from the “Handouts” drop down menu (the graphic looks like three sheets of stacked papers) on the right-hand side of the LiveMeeting navigation bar

April 24, 2013 Slide 36
Resources
www. icti-care.org – ICTI CARE Process (ICP) website
www.toyassociation.org – Knowledge Network
(education and training services)
– Members Only Bulletins (Legislative, Safety, etc.)
– Industry Facts (research, reports and statistics)
– Press Room (news items on standards, legislation and more)
www.ToyInfo.org – Consumer-facing website

Thank you for participating!
For more information in TIA’s Knowledge Network, please visit: www.toyassociation.org