PUMP PERFORMANCE - CaltechAUTHORSauthors.library.caltech.edu/58686/1/N-56.pdf · summary pump...
34
CALIFORNIA INSTITUTE OF TECHNOLOGY Hydrodynamics laboratories PUMP PERFORMANCE OF THE MARK 40 PUMP JET A REPORT ON RESEARCH CONDUCTED UNDER CONTRACT WITH THE BUREAU OF ORDNANCE OF THE DEPARTMENT OF THE NAVY AND OFFICE OF NAVAL RESEARCH
-
Upload
trinhkhanh -
Category
Documents
-
view
217 -
download
0
Transcript of PUMP PERFORMANCE - CaltechAUTHORSauthors.library.caltech.edu/58686/1/N-56.pdf · summary pump...

CALIFORNIA INSTITUTE OF TECHNOLOGY
Hydrodynamics laboratories
PUMP PERFORMANCE OF THE
MARK 40 PUMP JET
A REPORT ON RESEARCH CONDUCTED UNDER CONTRACT WITH
THE BUREAU OF ORDNANCE OF THE DEPARTMENT OF THE NAVY
AND OFFICE OF NAVAL RESEARCH


August 1949
•
Department or the Navy Bureau or Ordnance Contract NOrd-9612
and orrice or Naval Research
Contract N6-onr-244
PUMP PERFORMANCE OF THE MARK 40 PUMPJET
by
John H. Beveridge Mechanical Engineer
Hydraulic Machinery Laboratory California Institute or Technology
Pasadena, California
Robert T. Knapp, Director
Report No. N-56

' .......

Acknowledgment.
Summary •.••
Introduction ••
Purpose ••
Test setup.
Measurements.
Ope rat ion . . •
Test results
TABLE OF CONTENTS
. .
Characteristic Curves for Mark 40 Pump jet, Fig. 1.
Performance Curves for Mark 40 Pump jet, Fig. 2 • Comparison Curves for Mark 40 Pumpjet and Granby
Model Pump, Fig. 3 • • • • • • • • • • • • • Curves of Pumpjet Performance vs. Drag Coefficient
Fig. 4 . . . . . . . . · . . . . . . . . . . .
Curves of Pumpjet Performance vs. Jet Area, Fig. 5
Discussion of test results ••
Conclusions •
Appendix I
Sample calculations of pumpjet characteristics from
Page No.
iii
1
1
1
1
2
2
3
4
5
6
7
8
9
test data. . . . . . . . . . . . . . . . . . . . . 11
Appendix II
Determination of the Mark 40 Pumpjet operating point • 13
Bibliography 23

..

aunt ±££141 Kif
Acknowledgment
The Mark 40 Pumpjet was tested at the request or the
u. s. Naval Ordnance Test Station, Pasadena Annex.
The tests were conducted with the aid of funds rrom
Contracts NOrd 9612 and N6-onr-244, Task Order No. 2.
111

...

Summary
PUMP PERFORMANCE OF THE MARK 40 PUMPJET
CHARACTERISTIC CURVES FOR THE MARK 4:0 PUMPJET IN NORMAL PUMP AND REVERSE TURBINE REGIONS OF OPERATION
From the results .of tests conducted 1n the Hydraulic Machinery Laboratory at the CalLfornia Institute of Technology, the pump performance was analyzed
1*
and found to be satisfactory for the pumpjet installation in the Mark 40 Torpedo. The pump will operate at or very near the point of best efficiency, which is 84.5 ~ 1.0 per cent at a projectile speed of 80 knots.
The propulsion unit was tested from zero flow rate point through zero head point into the reverse turbine range. The performance was found to be very similar to that of a conventional centrifugal pump fitted with a diffuser vane case or a volute case.
Introduction
The Mark 40 Torpedo is to be powered with a turbo-pumpjet. The turbo-pumpjet is a gas-turbine-powered centrifugal pump. Water enters the pump through a cylindrical duct in the torpedo nose and is discharged through eight nozzles 1n the form of high velocity jets. The reaction of the jets furnish the thrust necessary to overcome the projectile drag.
The complete hydraulic propulsion unit, namely, the entrance duct, the pump impeller, the diffuser casing and discharge nozzles, is referred to 1n this report as the "pumpjet."
Purpose
The object of the tests was to find the head, brake horsepower, and efficiency, vs. flow rate relationships for the Mark 40 pumpjet in the normal pumping, power dissipation, and the reverse turbine regions of operation (Figs. 1- 5}. Under normal operating conditions the ram effect on the projectile nose assures high positive suction pressure and eliminates the possibility of cavitation. Thus, in this series of tests, cavitation studies were not made.
Test Setup
Hydraulically, the pumpjet unit used in these tests was an exact, full scale, duplicate of the Mark 40 installation. The U. S. Naval Ordnance Test Station, in Pasadena, California, furnished the Laboratory with a Mark 40 nose section and a pumpjet impeller. The nose section contains, in one casting, the entrance duct and the diffuser casing up to the straightener vanes which precede the discharge nozzles. The Mark 40 nozzle section was impractical to use in the test setup, hence, a set of eight duplicate nozzles and straightener vanes, more adaptable to test purposes, was made in the Laboratory shop and installed in the test unit.
* See bibliography at end of report.

2
The test setup is shown diagrammatically in Figs. 6 and 7. The pumpjet was placed in a closed hydraulic circuit. The entrance duct was fitted to a contraction nozzle designed to deliver a uniform energy flow to the impeller which is the condition that would be experienced by the prototype. Preceding the nozzle was a long, straight length of 12 in. pipe. The eight discharge nozzles were each followed by a needle type regulating valve which was used to equalize the flow in all nozzles. The regulating valves were adjusted with the pumpjet operating at the best efficiency point. This adjustment was necessary because the pressure in the discharge manifold, unlike that on the actual torpedo, was not everywhere equal. The torus-like discharge manifold merely afforded a convenient means of collecting the flow from the various jets.
The pumpjet was powered by the Laboratory dynamometer through a direct drive. Figs. 8 through 12 show the test unit in various stages of completion.
Measurements
The dynamometer standard torque mechanism was used to obtain the input torque for normal pump and power dissipation regions of operation and the output torque for the reverse turbine tests. The dynamometer speed was measured and controlled by the existing standard frequency speed control.
The rate of flow through the unit was measured by the appropriate size venturimeter permanently located in the Laboratory. The meters were located in the pump discharge line.
The differential head generated by the pump was measured by a differential pressure gage. On the suction side of the pump the pressure tap was located on a piezometer slot in the inlet duct. On the discharge side of the pump a pressure tap was located at a point just ahead of the grid straightener· vanes in each of the discharge nozzle passages (Fig. 7). The discharge pressure lines from the eight nozzles were led to a common manifold (Fig. 11) and then to the gage. The differential head, so determined, did not include the losses incurred in the grids or the nozzles. In preliminary tests the discharge pressure was measured approximately ~2 in. downstream from the grids in two nozzles only. The differential pressure across the pump, in this case, was of the order of 2 per cent less than that obtained when the discharge pressure was measured ahead of the grids.
Operation
The tests were conducted without any mechanical difficulties from the pumpjet with the exception of the outboard ball bearing. This bearing, exposed to fresh water, failed after an estimated operating time of 5-10 hours. It was run at speeds up to 4000 rpm, the highest test speed. It was found that packing the bearing in the test unit with commercial automobile water pump grease greatly extended its life. It is unlikely that this bearing will fail from this cause in the prototype since its time of operation is very short.
Test Results
The results of the tests are presented graphically in Figs. 1 through 5

100
90
80
.... z ~ a: IAJ a..
10'
6o
50
40
30-
20-
10
0-
-~ F6 11~o.
L 1\ I \ 6.0
v ~ 5.0
30
25 I
~FFtCIENC'I'
"-'e 4.0 I I IPINP ~;;: ..
~ .. ... 0 3.0 ~AL +
( 0 I'"'..; C!N 2 I ~ - 2.0 I ~ ... I V ~~
~ 1/ CD '.-/--< A. BHP sp, Qr.•lO
A. 1,0
i '\ ~l\ ~ :i .. 0
1\ 1\ a: l&J
~ -1.0
'= "\ NORMAL PUMP ~REVERSE TURBINE-+ f/)
"'TIOII \ --1 a: -~
-2.0
\ 1\ i l&J -3.0 ~
CHARACTERISTIC aRIES FOR f\\ C( a:
MARK40 P~ al -4.0
~uuc MACHH:RY L~~ ' ~ -SD ORNA INSTITUTE OF -TESTED BY J.H. BEVERIDGE JuNE, 1949 \ \ SYMBOLS:
-ao D--4>l ST'D AREA JET OPERATING POINT
~\ A RUN N &6-123 - 14 o RlM N 58-tz:s- 15
-7.0 + RUN N 56-12:5-16
\\
20
15
10
!5
0
-15
-20
-30
35
1..--'"'8.() 0 -.5 1.0 L5 2.0 2.5 3.0 3~ 4.0
40
FLa.¥ RATE, c.ls. per IOOOrpm
Fig. 1
.. -:--- --- ~
·-E e 0 0 0
... Q) Q.
.: -
3

4
1-z I.IJ (.) 0:: I.IJ ll.
00
90
8 0
70.
60
5().
->(.) z I.IJ 0 u. u. I.IJ
4().
30-
00
10
0
I ;:I
~ ~
I 1\ IF'-Q'Ii. RATE; \ 6.0
/-JHEAO I 30
v v ~ 5 .0 2!5
I v ~FFICIENC'I'
~ 4.0 j !Co•0.08- I I 20
LL ;: fo•o.o6 /POMP "\URBI:E Q.
~i ... --~ ~ 0 "3.0 <:o>"~v 15
0 fro-< ~ (
.. _ Q E
Q. - 2.0 10 ... .... I ~ "i
~ 1/ 0 eJ ~-;: J~ 0 Q.
_l_ BHP sp. Qr.•I.O 0 1.0 5 -Q.
~ '\ ~~t -.1: 4 ...
0 0 Q) -
\~ 0. a:: ...; I.IJ
~ -~ -1.0
I~[R ' -5 -0 "' NORMAL PUMP 01111- ~REVERSE TURBINE+ 4 (/)
""TION \ "' a:: -2.0 -10 :%: ~ i '\ 1\ I.IJ -3.0 -1!5
~
1\\ 4 PERFORMANC€ ~SFOR a:: MARK 40 PUMPJET CD ""4.0 -20
~uuc MACHJERY L~f~ ' ~ - !5.0 ORNA NSTITUTE OF -2!5 TESTED BY J.H. BEVERIDGE JUNE, 1949 \ \ SYMBOLS:
-6,0 o--c ST'D MEA JET OPERATING POINT
~\ -30
A RUN M 01-123-14 o ""* N S.-IU- 15
-7.0 + RUN N M-IU-1• 3!5
\\ ~-e.oo
.!5 1.0 1.!5 2.0 2.!5 3.0 31 -40-
<lO
FLOW RATE, c.f.a. p~r 1000 rpm
Fig. 2
1.0
0 .9
0 .8
0.7 .. ,~-. ...: -0.6 d -
0.5 ~ 4
~ a:::
0.4
~ 0
0.3 ..J u.
0.2
0 . 1
0
10 0
9 0
8 0
7 ·o-
1-z W6 4o)
0
a: w O..s
->-04 z w
o-
0
<3 i:L30 1.1.. w
2 0
0
0
6.0
5,0
~ 4.0
a. ... 0 3.0 0 Q ~
2 .0 .... II a.
1.0 a. .1:: -'l
- 0 a: w ~
~ -to w (/) a: -2.0 0 ~
w -3.0 ~ <t a: CD -4.0
-5.0
-6.0
-7.0
~-e.o
... -----~ - . 5
Q r
£ ~ ~ I 0 r\ f \
l }
l ~ " I ~FFJCIENCY
.d___GRANBYJ /PUMP ~~ 7-t H~Ellrl_ 'fr•~ -c~ ( J ~
~BH~r.•td~~ lf_
v ' ~r\t 1\ 1\ ~OWER ' NORMAL PUMP f+REVERSE TURBINE• OISSI-
lf'llTIOH \ i
~ ~ I COMPARISON CURVES FOR ~~ MARK 40 PUMPJET 8 GR~~
SINGLE VOLUTE MODEL PlA1P _\ ~ HYDRAUUC MACHINERY UfORATORY CAIJFORNIA INSTITUTE OF ECHNOLOGY TESTED BY J.H . BEVERIDGE JUNE, 1949 \ \ SYMBOLSs D---<J ST'D AREA JET OPERATING POINT
~\ ~ RUN N 56-123-14 o RUN N 56-123- 15 + RUN N 56-123- 16
NOTE• IMPELLERS FROM SAME PATTERN \\ MARK 40- 7f" OIA., GRANBY- 7t" OIA.
3(
25
20
15 ........ E Q
10 ... 0 0 0
5
... II
0 Cl.
..: --5 .
0 <t w
-10 :::t
-15
-20
-25
-30
-3t!
0 .5 LO 1.5 2.0 2.5 3.0
FLOW RATE, c. f.s. per 1000 rpm
Fig. 3
6
0 8 0 0 - 7 .. Q
~ 6 a.. Cl)
2
I
0
~ .. ~ .. ~ u z "" -u iL ... "" z 0 -(I) ~
E f 100
~90 • .eo ao;
~70 "" §so ... ... "'50 ... "" ~40 ~ 2 ~30
20
10
10 15
9 14
8 13
+ .. A.
7 ..: 12 12 .A X
<l 0 .. 0 • - ... .. =6 .ill ull .. "" "" 0 ~ ti 0 - ~ a:: ,. "" ~5 ~~o ~.0 0
"" 0 ~ % % ... ... ... ... "' "" &&.1 .,4 .,9 .,9 ~ a. ~ 2 2 2 ::::) ::::) ::::) ~ ~ ~
3 ~ 8
.. , <lij, ~~
.05
I I BHP 1SP. GR.•I.O -
j I I HEAD
~/
J "/~
1/ [;"
A r
/ v; FLOW RATE
~ If .~,.. .... /4 ~X J
/ I ,/ v~ ~PEED
..-( . I
J~ ~ .,.. I
~., PUMP '"'EFFICIEN_CY I
PRO~LSIOIN E~FICIENCY I ~
~--~~~ -
PUMPJET PERFORMANCE
vs DRAG COE FFIC I EN T
for STANDARD AREA JETS PROJECTILE SPEED= 80 KNOTS C.I.T. MAY, 1949 J. H. BEVERIDGE
.06 .rn .08 .09 DRAG COEFFICIENT,C 0
Fig. 4

0
8 1.80 ~ • 0. ., ... u 1.60 ..
LJJ
~ a: 1.40
~ ..J u. 1.20
1.00
.80
-
0 T
'7
7- A - v PROPULSION / EFFICIENCY
~ / ~ / ~
>-.. 68
/ ~ v 0 / I z
LJJ /
/ .... / - / 0 u. 16
~ /~ u. LLJ ...,.4
~ ./ v ..,; - 64 ,......... CJ) .... ~
...J .,., ::) Q.
~ ~~
0 0:: 62
~~~ Q. < ~ II"' FLOW RATE
~ ~ ~
--~ .. sa ... >-0 z LJJ ...,
r&.......... -0 56 OVERALL iL ~,~FFIGIENCY u. LLJ
~ ' ...J
S4 ' ..J ..... ' 4 ] a: --LLJ Pl.NP£T PERFORMANCE vs JET AREA > 0 ~ C. LT. MAY, 1941 J. H. IEVERIDG£
SYMBOLS: o c.•o.~a PROJECTILE SPEED • 10 K
0 ... 6 Ce• 0.07 ST'D JET AREA • 0.0431 ftl ~ c c.• o.os
100 115 130
PERCENT OF STANDARD JET AREA
Fig. 5

8
Discussion o£ Test Results
The characteristic curves were obtained £or three contiguous regions o£ operation, nam~ly, normal pump, power dissipation, and reverse turbine. All three flows were in the same direction, that is, £rom the suction nozzle to the discharge. The normal pump region of characteristic curves was used to obtain the steady state operating conditions of the pumpjet for the proposed projectile velocity ot 80 knots. (See Appendix II). The steady state operating point is marked on the characteristic curves 1n Figs. 1 through 3. The steady state operating point indicated in Fig. 1 is based on an assumed drag coefficient of 0.08. It is seen that the operating point is at or very near the point of best efficiency.
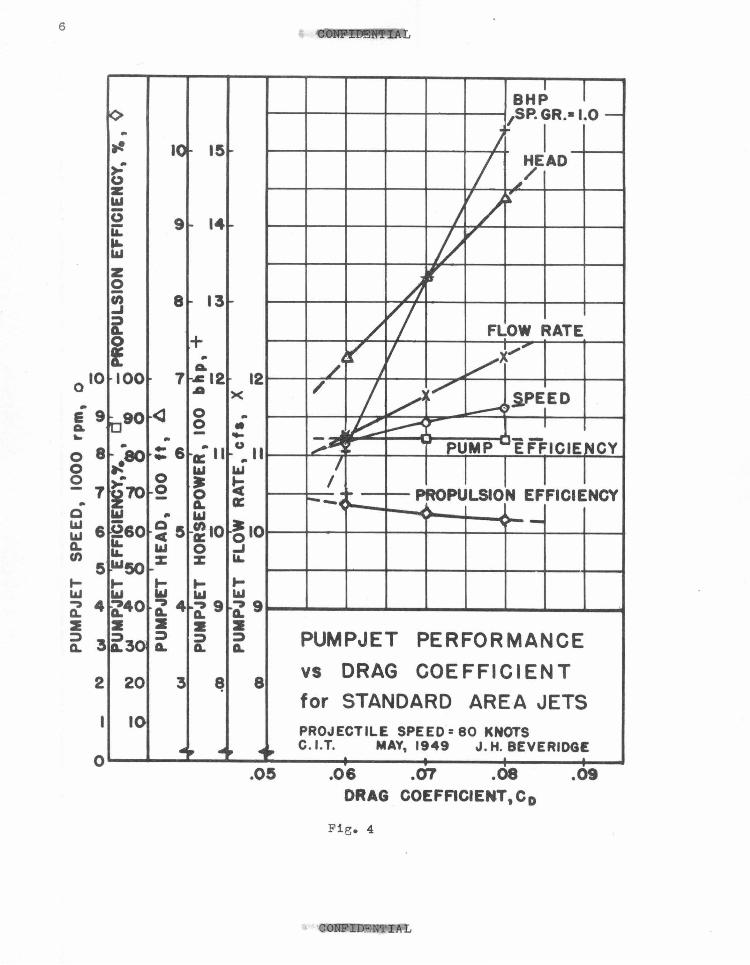
The position of the unit operating point of the pumpjet is dependent upon the drag coefficient of the projectile. The term 11 unit operating point" ref'ers to the operating point on the characteristic curves having coordinates of flow rate per 1000 rpm, head per (1000 rpm) 2 and brake horsepower per (1000 rpm) 3 • A series of drag coefficients from 0.06 to 0.08 was assumed 1n the calculations and the pumpjet unit operating point co~responding to each drag coefficient was found and plotted in Fig. 2. It is to be noted in Fig. 2 that the position of the unit operating point does not vary greatly over the range of drag coefficients chosen. However, Fig. 4 shows that the pumpjet speed, flow rate, head, and brake horsepower do vary widely over the range of drag coefficients chosen. Thus the difficult and somewhat speculative determination of the correct drag coefficient is not as critical a problem in locating the pumpjet unit operating point as might at first be anticipated.
A change in the throat area of the discharge nozzles, and hence the area of the jets, also changes the pumpjet unit operating point. This effect is indicated in Fig. 5 for the same projectile speed of 80 knots and for various drag coefficients. The total throat area of the nozzles tested, denoted in this report as the standard jet area, was 0.0431 sq. ft on a diameter of 0.994 in. It can be concluded from Fig. 5 that the nozzles used were very close to the optimum for the given set of operating conditions.
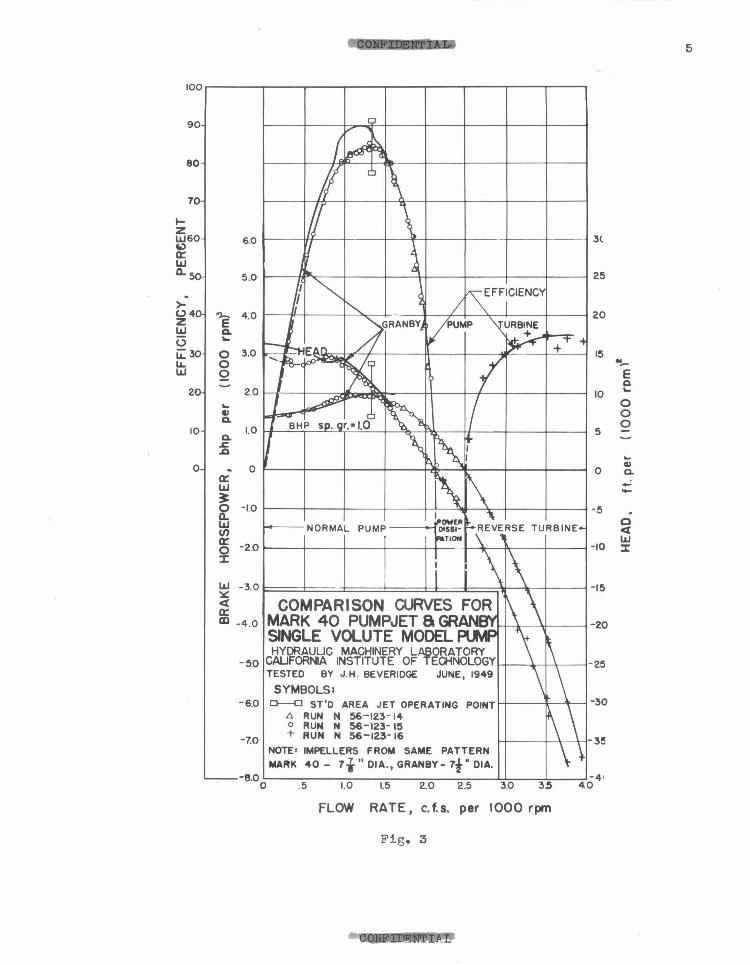
It is of interest to compare the characteristic curves of the unit tested, which uses a slightly modified Grariby model pump impeller, and the Byron Jackson Granby model pump. Comparison shows (Fig. 3) that the conversion from a normal single volute case to the diffuser jet case does not materially alter the general character of the characteristic curves. The fact that the test unit does not show as high a peak efficiency as the Granby model pump is not too surprising if it is noted that the surface area, hence the skin friction loss, of the diffuser jet oase is considerably greater than that fotmd in the single volute case.
0

Conclusions
1. The characteristic curves o£ the Mark 40 Pumpjet are very similar to the characteristic curves of a modern centrifugal pump.
9
2. The Mark 40 Pumpjet operating point is at or very near the point of maximum efficiency. There are no instabilities in the characteristic curves near the anticipated operating point.
3. The Mark 40 Pumpjet pump efficiency and propulsion efficiency are relatively insensitive to variation of projectile drag over the range of drag coefficients from 0.06 to o.oa.
4. The present total jet area (0.0431 sq. ft) is very satisfactory as far as the overall efficiency of the Mark 40 Pumpjet is concerned.
For detailed information as to the procedure employed in calculating the pump head, flow rate, brake horsepower, and efficiency from the test data, reference should be made to Appendix I which presents, in outline form, complete sample calculations of these quantities. In Appendix II is outlined the method used in estimating the pumpjet operating point for the proposed projectile speed of 80 knots.

J.O
DYNAMOMETER
SUCTION PIEZOMETER RING -------.......
·~~~l'lii
DRIVE SHAFT
Fig. 6
DISCHARGE MAHIFOL
DISCHARGE PIEZOMETER TAP
MARK 40 NOSE
Fig. 7
OUTLET
NOZZLE
TEST CIRCUIT

APPENDIX I
SAMPIE CALCULATIONS OF PUMPJET CHARACT::ERISTICS FROM TEST DATA
Run N-56-123-15, Point Number 27
The test data taken from the above run is introduced in the step of the calculations to which 1t pertains.
I. Pump Speed, N, rpm
Speed preset at 2200 rpm Note: The speed is controlled by setting the
speed control gear box to the nearest 0.5 rpm.
II. Torque
Torque = dynamometer lower torque reading = 00.00 + " upper " + zero + windage + friction
" = 54.99
= -05.70
Total torque = 49.29 ft lbs Note: Windage and friction losses include
pumpjet no-load bearing friction but not the John Crane seal friction.
III. Brake Horsepower, BHP
Total BHP input to pump BHP
BHP
BRP
= speed x torque x constant 2rr = 2200 X 49.29 X 6QxS$Q
= 20.64
Unit brake horsepower, 20.64
bhplOOO = (2200)3
bhp1000 , bhp per (1000 rpm) 3
= 1.94 bhp/ (1000 rpm) 3
1000
BHP for speed n is
BHP n = 1.94 ( 10~0) 3
IV. Flow Rate, Q, cfs
Total Q
2g X f.q X
144
(A\ 2 -1:; - 1
(.Q}!a_- 1) 0~0
11

12
v.
g =
flow rate, cfs
coefficient of discharge of meter = 1.0
area of entrance end of meter = 26.0 1n.2
throat area of meter = 11.23 1n.2
differential head across meter, ft Hg
ratio sp. wt. Hg to sp. wt. H20 = 13.6
gravitational acceleration = 32.2 ft/sec2
For the above test
~q = 1.008 ft Hg Q = lje.os x llq
Q = 2.4'7 cfs
Unit flow rate, q1000 , cfs per 1000 rpm
-2'.4'7 = = 1.12 ofs/1000 rpm 2200 'IO"W
Flow rate at speed, n,
1.12 (-n--) cfs 1000
=
Head Generated by Pump, H, ft of water
Total H 2 2 H =
144 (P3 - P2 ) +
V3-V2 or, 1n terms of Q,
0 2g
144 (P3- P2 ) Q2 [ l l ~ H = 0 + - --:-2" - --:;z 2g A3 A2
where sUbscript 2 refers to the pump suction and 3 to a point just ahead of the straightener vanes 1n the nozzle passages. ~ (See Fig. 7 and page 14.)
P3 - P2 = liP, differential pressure across pump + gage correction, psi.
0 = sp. wt. of fresh water = 62.4 lbs/ft3
For the above example
H = 144(26.1 + 0.6) _ (0. 80) 62.4
H = 60.8 ft

2 Unit head, hlOOO' rt per (1000 rpm)
"looo = 60•8 )2 = 12.56 r~(1ooo
(mg Head at speed, n,
H = 12.56 (....!L_) 2
n 1000
VI. Pump Efrioienoy, ~p' per oent
WHP ~ p = B'H:J.5'
i'Jp
J./p
WHP = water horsepower
0! X 100 = -ox BHP
= (62.4)(2.47)(60.8)(100) (550) (20.64)
?Jp = 82.7 per oent
VII. Results
BHP = 20.64
bhplOOO = 1.94 bhp/(1000 rpm)3
Q = 2.47 ofs q1000 = 1.12 cfs/(1000 rpm)
H = 60.8 ft
hlOOO = 12.56 ft/(1000 rpm)2
7)p = 82.7 per cent
N = 2200 rpm
APPENDIX II
DETERMINATION OF THE MARK 40 PUMPJET OPERATING POINT 2
I. Data
d = projectile dia. = 21 in.
13
dt = discharge nozzle throat dia. = jet dia. = 0.994 in. ~ = inclination of jets to axis or projectile = 15° v1 = projectile velocity = 80 knots or 135 ft/seo.

14
II. Projectile Drag, D, lbs -------
pv 2 D = CD X Af X ----
1- where
2
Af = frontal cross sectional area of projectile
= p = mass density of fluid (fresh water)
62.4 =--32.2
v1 = projectile velocity = 135 ft/sec
CD = drag coefficient. Assumed values are: o.oo, o.o7, o.oa .• These drag coefficients were chosen 1n lieu of drag studies 1n progress 1n the Hydrodynamics Laboratory water tunnel. In Ref. (2) en • 0.049 was used 1n prel1m1nary cnlculations.
2 D = (0.08) (2.40) (62 • 4 ) J.l35 )
32.2 2
D = 3390 lbs for CD = o.oa
D = 2970 lbs for CD = Oe07
D = 2540 lbs for CD = 0.06
CD= o.os is used 1n the following calculations.
III. Pumpjet flow rate, Q, ofs
- FREE STREAM
PROJECTILE BODY
For steady state operation the axial thrust of the jets, T, is equal to the drag of the projectile, D.
co

rv.
From momentum considerations
T = po. ['4 cosa - v 1J T = thrust, lbs
fi = mass density,
Q, = .flow rate, c.fs
v4 = jet velocity,
where
fresh water
.ft per sec
a = inclination o.f nozzles to projectile
vl = .free stream velocity, ft per sec
In terms of Q,
T = ;00. [ ~4 cos a - v~ or
T = 62.4 [0.966 0,2 - 135 ~ 32.2 0.0431
T = 43.5 o.2 - 262 Q,
For T = D = 3390 lbs
Q, = 12.3 ofs
Pumpjet head, H, ft
[ 2 J [) v 2
+ z~ H P3 v3 + _g_ = - +- + z3 -
· " 2g 2g
where p = static pressure, ft '3
v2 = velocity head, ft 2g
z = elevation, ft
Assume
Ram efficiency = 100 per cent
axis
Discharge nozzle efficiency = 100 per cent
H=
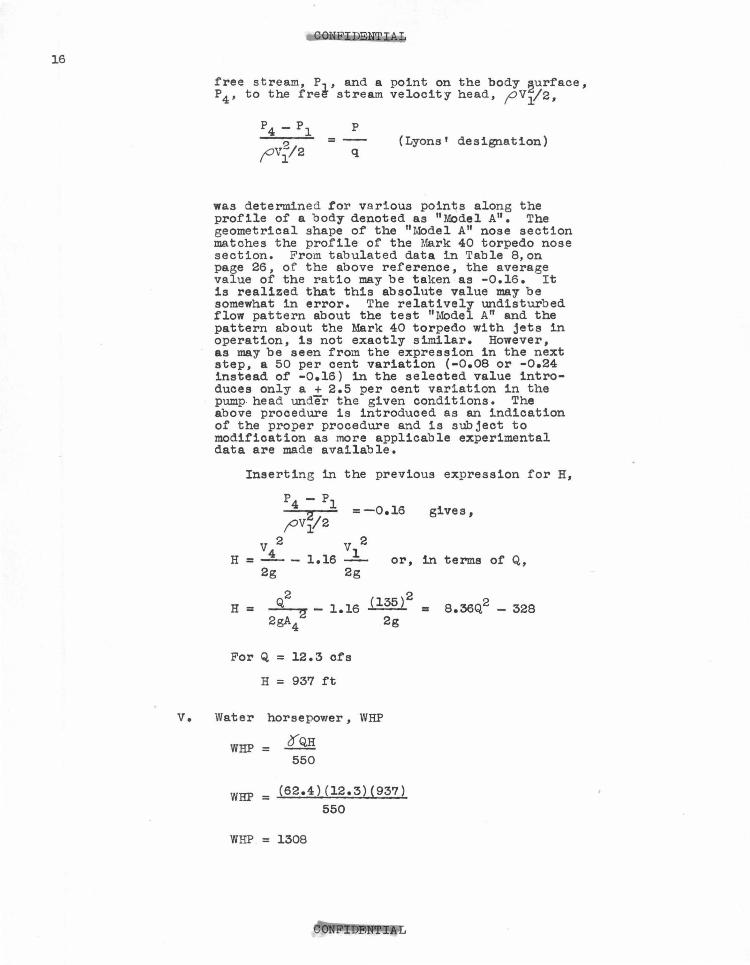
To estimate P4 , the pressure about the circumferential surface of the projectile in the vicinity o.f the discharge nozzle ports, re.ference was made to the experimental work by Lyons3 in which the ratio of the pressure drop between a point in the
15
16
v.
free stream, P1 , and a point on the body ~urface, P4 , to the fre~ stream velocity head, f?Vl/2,
p
= (Lyons' designation) q
was determined tor various points along the profile of a body denoted as "Model A". The geometrical shape of the "Model A" nose section matches the profile of the ~~rk 40 torpedo nose section. From tabulated data in Table 8,on page 26, of the above reference, the average value of the ratio may be taken as -0.16. It is realized that this absolute value may be somewhat in error. The relatively undisturbed flow pattern about the test "Model A" and the pattern about the :Mark 40 torpedo with jets in operation, is not exactly similar. However, as may be seen from the expression in the next step, a 50 per cent variation (-0.08 or -0.24 instead of -0.16) 1n the selected value introduces only a + 2.5 per cent variation in the pump head under the given conditions. The above procedure is introduced as an indication of the proper procedure and is subject to modification as more applicable experimental data are made available.
Inserting 1n the previous expression for H,
p4 - pl =-0.16 gives,
,ov}2
v 2 v 2 H 4 1.16 1 or, 1n terms of Q, = ---
2g 2g
H Q2
1.16 (135) 2 2 = 2gA4 2 -
= 8.36Q - 328 2g
For Q = 12.3 ofs
H = 937 ft
Water horsepower, WHP
WHP = oQH 550
WHP = {62.4)(12.3){937) 550
WHP = 1308

VI. Thrust horsepower, THP
THP = drag x Erojeotile velooit::z: 550
THP = ( 3390 ) ~ 135 )
550
THP = 832
VII. Pump speed to satisfy items III and IV, N, rpm
VIII.
unit flow rate =flow rate, cfs = 12.3 = 0 •401 ')unit head '}head, ft 1[9:37
On the performance curves, Fig. 2, the ratio
unit flow rate is plotted against unit capacity
ljunit head
for various points on the pump HQ curve. Entering
this plot at unit flow rate = 0.401 indicates the l)unit head
corresponding unit capacity
qlOOO = 1.325 cfs/1000 rpm
Thus
N = 12.3 = 9283 rpm 1.325 1000
Pump operating point on unit HQ curve
Step VII above automatically locates the desired point.
Thus from performance curves
10.85 ft/ ( 1000 2
hlOOO = rpm)
bhplOOO = 1. 91 bhp/ ( 1000 rpm) 3
?Jp = 84.5 per cent
It is interesting to check h 1000 and bhplOOO against the H and BHP values previously determined.
H = (lo.85)(i~~5) 2
= 935 rt
BHP = (1.91) (i~~) 3
= 1528
1'7

18
IX. Propulsion e£f1o1ency ryj' per cent
THPxlOO ry~ =
J WHP = (832) (100) 1308
ry3 = 63.7 per oent
x. Overall efficiency, ? , per cent
WHP THP 7') = -X - • 7} X 7) 4 = (84.6) (63.7)
BHP WHP p "
7} = 53.8 per cent
XI. Specific speed of pump
n = NV"Ct = s H"/4 9180 v'12.3
(937) ~4
n8
= 190 (Q in cfs)
n8
= 4030 (Q 1n gpm)
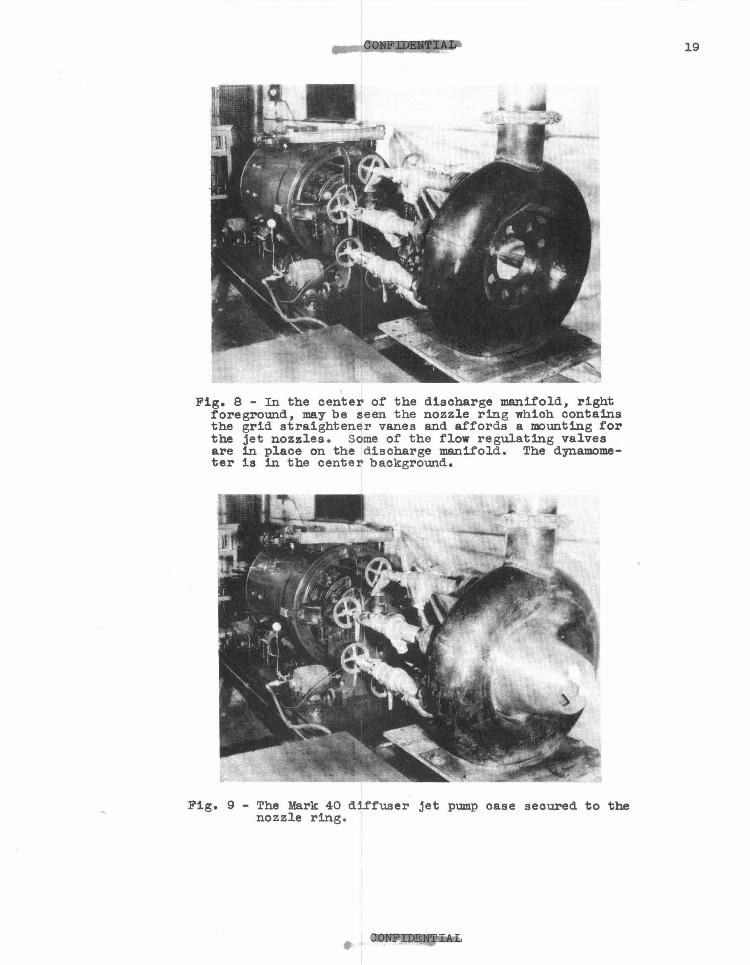
Fig. 8 - In the center of the discharge manifold, right foreground, may be seen the nozzle ring which contains the grid straightener vanes and affords a mounting for the jet nozzles. Some of the flow regulating valves are in place on the discharge manifold. The dynamometer is in the center background.
Fig. 9 - The Mark 40 diffuser jet pump oase secured to the nozzle ring.
19

20
Fig. 10 - View from the drive end of the pumpjet. The nozzle ring with the discharge nozzles and their throat sections are visible behind the flow regulating valves.
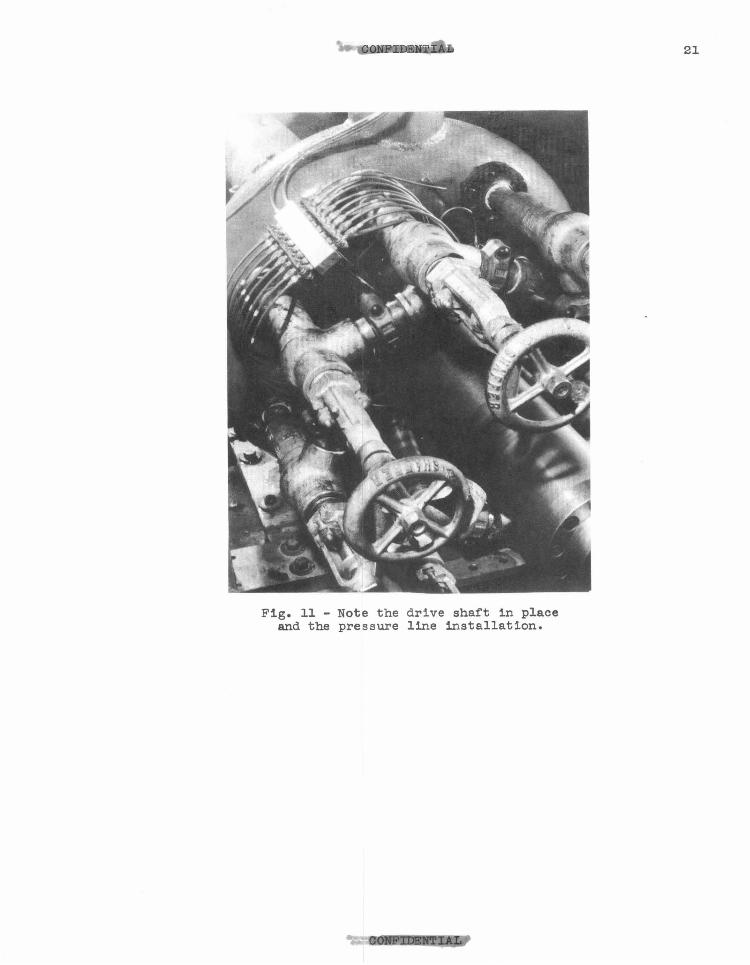
Fig. 11 - Note the drive sha~t in place and the pressure line installation.
21

22
Fig. l2 - Laboratory setup for testing full soale pump for the pumpjet propulsion unit for the Mk 40 Torpedo.

BIBLIOGRAPHY
1. Knapp, R. T., 11 The Hydraulic Machinery Laboratory at the Calif'ornia Institute of Technology," Trans. ASME, Nov. 1936.
2. Brumfield, R. C., Tech. Memo. OUM 29.?, 28 May 194?.
3. Lyons, H. M., "Effect of Turbulence on Drag of Airship Models" (refer- "Form A") H. M. Stationery Office, Adastra House, Kingsway, London, Aug. 1932.
23
Copy No.
1 - 1.5
16
17
18
19
20- 21
22 - 23
24
25
26
27
28
29
30- 31
32- 36
37
38- 40
42- 44
45
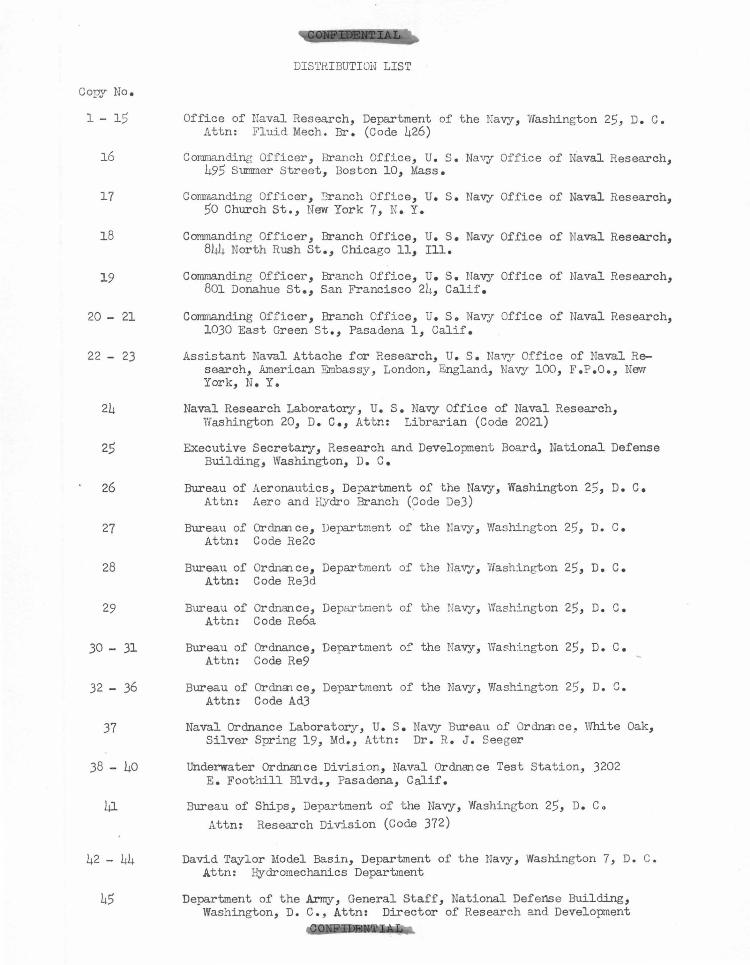
DIS1'RIBUTIOH LIST
Office of naval Research, Department of the Navy, Washington 25, D. c. Attn: Fluid Mech. Br. (Code 426)
Commanding Officer, Branch Office, u. s. Navy Office of Naval Research, 49.5 Surmner Street, Boston 10, Mass.
Comraanding Officer, Branch Office, U. s. Navy Office of Naval Research, )0 Church St., New York 7, N.Y.
CO!'II1landine Officer, Branch Office , u. s. Navy Office of Naval Research, 844 North Rush St., Chicago 11, Ill.
Commanding Officer, Branch Office, u. s. Na~r Office of Naval Research, 801 Donahue St., San Francisco 24, Calif.
Commanding Officer, Branch Office , u. s. Na~J Office of Naval Research, 1030 East Green St., Pasadena 1, Calif.
Assistant Naval Attache for Research, u. s. Navy Office of Naval Research, American Embassy, London, England, Na~J 100, F .P.o., New York, N.Y.
Naval Research Laboratory, u. s. Navy Office of Naval Research, Vlashington 20, D. c., Attn: Librarian (Code 2021)
Executive Secretary, Research and Development Board, National Defense Building, Washing:ton, D. c.
Bureau of Aeronautics, Department of the Navy, Washington 2.5, D. c. Attn: Aero and HYdro Branch (Code De3)
Bureau of Ord.run ce, Department of the Navy, Washington 2.5, D. C. Attn: Code Re2c
Bureau of Ordnance 1 Department of the Navy, Washington 2.5, D. C. Attn: Code Re3d
Bureau of Ordnance, Department of the Navy, Washington 2.5, D. " uo
Attn: Code Re6a
Bureau of Ordnance, Department of the Navy, Washington 2.5, D. C. Attn: Code Re9
Bureau of Ordn<n ce, Department of the Navy, Washington 25, D. " Uo
Attn: Code Ad3
Naval Ordnance Laboratory, u. s. Navy Bm"eau of Ordn<nce, Yfuite Oak, Silver Spring 19, Md., Attn: Dr . R. J. Seeger
Underwater Ordnance Division, Naval Ordnance Test Station, 3202 E. Foothill Blvd. , Pasadena, Calif.
Bureau of Ships, Department of the Nav<J, Washington 2.5, D. C. Attn: Research Division (Code 372)
David Taylor Model Basin, Department of the Navy, Washington 7, D. C. Attn: Hydromechanics Department
Department of the Army, General Staff, National Defense Building, Washington, D. C., Attn: Director of Research and Development

Copy No.
46
47
48
49
50
51
52
53
54
55
56
57
58- 59
60- 61
62- 63
64- 65
66 - 67
68- 69
70
71
72
Arnzy- Chemical Center, Medical Division, Maryland, Attn: Dr. F. A. Odell
Ballistic Research Laboratories, Department oi the Army, Aberdeen Proving Ground, Maryland, Attn: Mr. R. H. Kent
Director of Research, National Advisory Committee for Aeronautics, 1724 F. Street, N. w., Washington 25, D. c.
Director, Langley Aeronautical Laboratory, National Advisory Committee far Aeronautics, Langley Field, Virginia
Dr. J. H. Wayland, Division of Civil and Mechanical Eng. and Aeronautics, California Institute of Technology, Pasadena, California
Professor G. Birkhoff, Department of Mathematics, Harvard University, 576 Widener Library, Cambridge 38, Massachusetts
Dr. K. S. M. Davidson, Experimental Towing Tank, Stevens Institute of Technology, Hoboken, New Jersey
Dr. J. H. McMillen, Naval Ordnance Laboratory, Naval Gun Factory, Washington 25, D. C.
Dr. F. A. Maxfield, Bureau of Ordnance, (Code Re6a), Department of the Navy, Washington 25, D. C.
Dr. A. Miller, Bureau of Ordnance (Code Re3d), Department of the Navy, Washington 25, D. c.
Dr. H. Rouse, Iowa Institute of HYdraulic Research, State University, of Iowa, Iowa City, Iowa
Dr. J. V. Wehausen, Hydromechanics Department, David Taylor Model Basin, Department of the Navy, Washington, D. C.
Superintendent, U. s. Navy Postgraduate School, Annapolis, Maryland
Director, U. s. Naval Electronics Laboratory, Point Lorna, San Diego, California
Research Analysis Group, National Research Council, 2101 Constitution Avenue, Washington, D. c.
Coi1111landing Officer, Naval Torpedo Station, Newport, Rhode Island
Commander, Naval Ordnance Test Station, Inyokern China Lake, Calif.
Coi1111lander, Naval Ordnance Laboratory, White oak, Silver Spring 19, Md.
Director, Ordnance Research Laboratory, Pennsylvania State College Pa. Via: Developnent Contract Officer, Pennsylvania State ' College, State College, Pa.
Worcester Polytechnic Institute, Alden HYdraulic Laboratory, Worcester, Mass. Attn: Prof. J. L. Hooper, Via: Inspector of Naval Material, Attn: Development Contract Section, 495 Summer Street, Boston 10, Mass.
Inspector of Naval Material, Development Contract Section, l2o6 South Santee Street, Los Angeles 15, California
.... •
-
•