PulteGroup Investor Presentation December...
28
PulteGroup Investor Presentation December 2015
Transcript of PulteGroup Investor Presentation December...

PulteGroup Investor Presentation December 2015
Forward-Looking Statements
This presentation includes “forward-looking statements.” These statements are subject to a number of risks, uncertainties and other factors that could cause our actual results, performance, prospects or opportunities, as well as those of the markets we serve or intend to serve, to differ materially from those expressed in, or implied by, these statements. You can identify these statements by the fact that they do not relate to matters of a strictly factual or historical nature and generally discuss or relate to forecasts, estimates or other expectations regarding future events. Generally, the words “believe,” “expect,” “intend,” “estimate,” “anticipate,” “project,” “may,” “can,” “could,” “might,” “will” and similar expressions identify forward-looking statements, including statements related to expected operating and performing results, planned transactions, planned objectives of management, future developments or conditions in the industries in which we participate and other trends, developments and uncertainties that may affect our business in the future.
Such risks, uncertainties and other factors include, among other things: interest rate changes and the availability of mortgage financing; continued volatility in the debt and equity markets; competition within the industries in which PulteGroup operates; the availability and cost of land and other raw materials used by PulteGroup in its homebuilding operations; the impact of any changes to our strategy in responding to the cyclical nature of the industry, including any changes regarding our land positions; the availability and cost of insurance covering risks associated with PulteGroup's businesses; shortages and the cost of labor; weather related slowdowns; slow growth initiatives and/or local building moratoria; governmental regulation directed at or affecting the housing market, the homebuilding industry or construction activities; uncertainty in the mortgage lending industry, including revisions to underwriting standards and repurchase requirements associated with the sale of mortgage loans; the interpretation of or changes to tax, labor and environmental laws; economic changes nationally or in PulteGroup's local markets,including inflation, deflation, changes in consumer confidence and preferences and the state of the market for homes in general;legal or regulatory proceedings or claims; our ability to generate sufficient cash flow in order to successfully implement our capital allocation priorities; required accounting changes; terrorist acts and other acts of war; and other factors of national, regional and global scale, including those of a political, economic, business and competitive nature. See PulteGroup's Annual Report on Form10-K for the fiscal year ended December 31, 2014, and other public filings with the Securities and Exchange Commission (the “SEC”) for a further discussion of these and other risks and uncertainties applicable to our businesses. PulteGroup undertakes no duty to update any forward-looking statement, whether as a result of new information, future events or changes in PulteGroup's expectations.
1
2
Presentation Agenda
• PulteGroup
Company Profile and Strategic Focus
Review of macro conditions
• Land Strategy
• Serving Distinct Buyer Groups
• Capital Allocation Aligned with
Value Creation
2
3
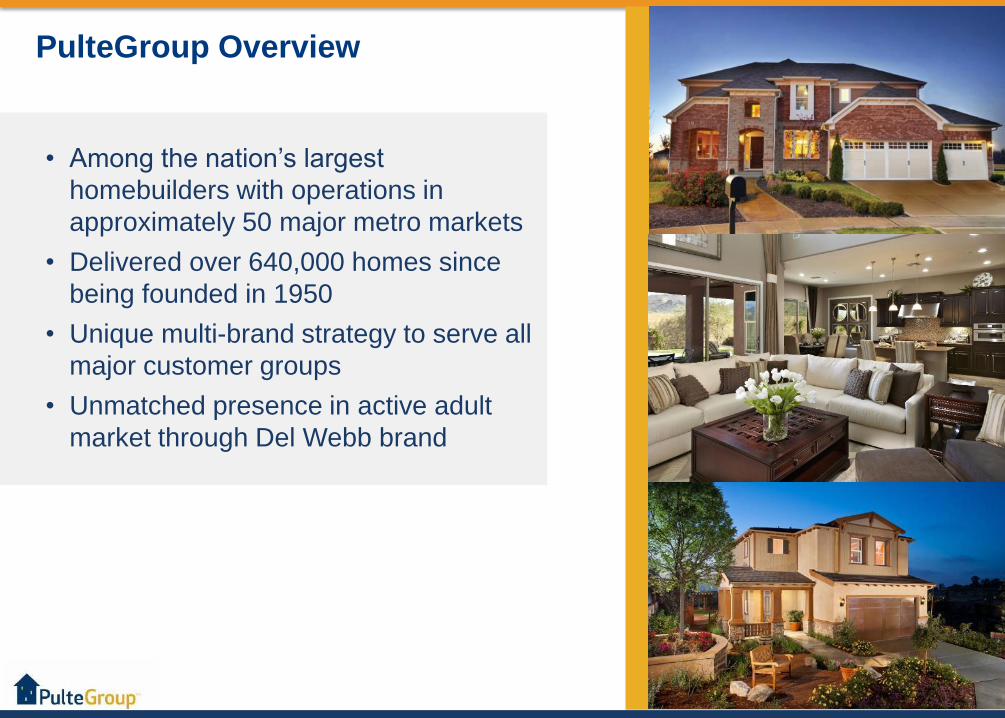
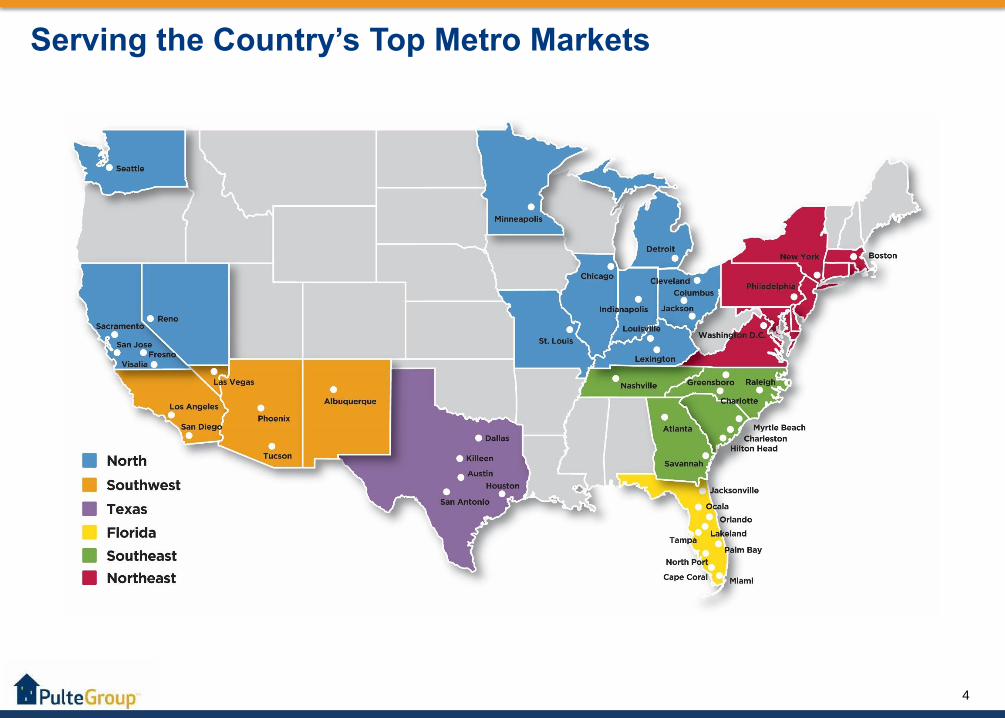
PulteGroup Overview
• Among the nation’s largest
homebuilders with operations in
approximately 50 major metro markets
• Delivered over 640,000 homes since
being founded in 1950
• Unique multi-brand strategy to serve all
major customer groups
• Unmatched presence in active adult
market through Del Webb brand
4
27% 41% 32%
Serving the Country’s Top Metro Markets
5
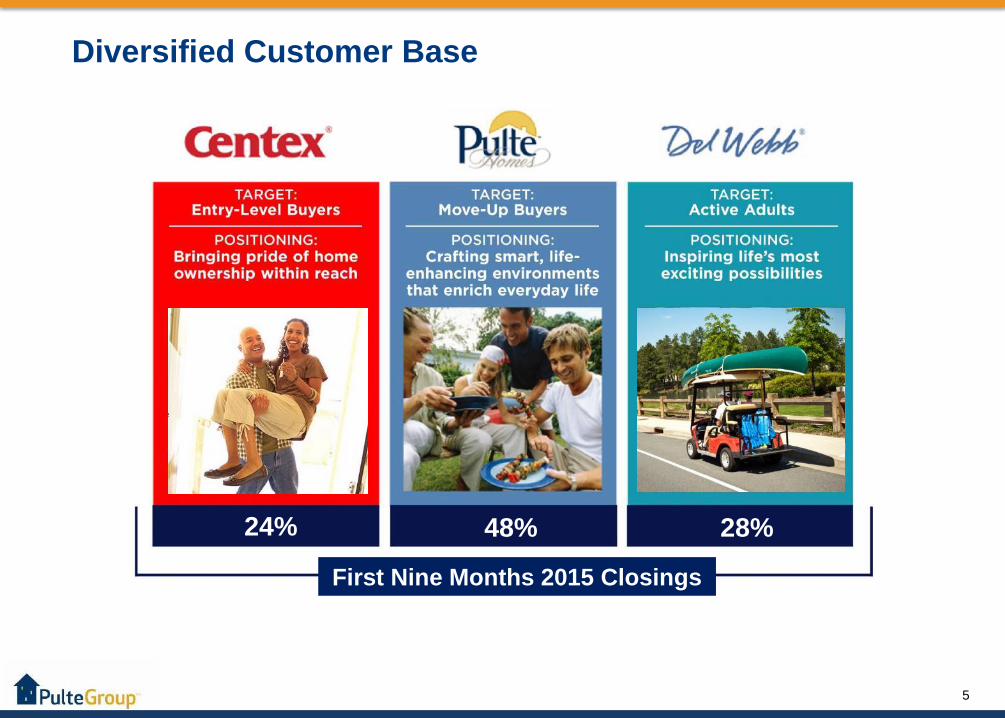
Diversified Customer Base
48% 28%24%
First Nine Months 2015 Closings
6
0
200
400
600
800
1,000
1,200
1,400
1963 1967 1971 1975 1979 1983 1987 1991 1995 1999 2003 2007 2011 2015
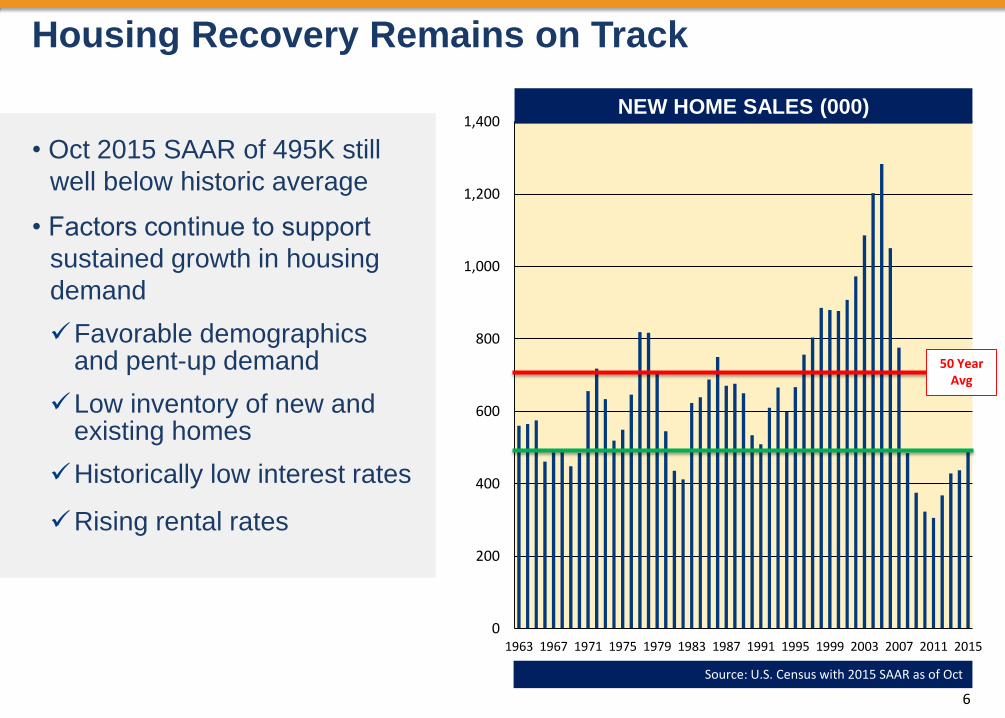
NEW HOME SALES (000)
Housing Recovery Remains on Track
• Oct 2015 SAAR of 495K still
well below historic average
• Factors continue to support
sustained growth in housing
demand
Favorable demographics and pent-up demand
Low inventory of new and existing homes
Historically low interest rates
Rising rental rates
50 Year Avg
Source: U.S. Census with 2015 SAAR as of Oct

7
Supports for Sustained Growth in Demand
Share of Children Ages 18 - 34
Still Living With Parents
U.S. Household Estimates
(millions)
7
24%
25%
26%
27%
28%
29%
30%
31%
32%
2007 2014
109
110
111
112
113
114
115
116
117
118
119
2009 2010 2011 2012 2013 2014 2015

8
Land Strategy

9
Land Investment Reflective of Demand Environment
301 303 285321
377
158 166156
138
127
241 201
136139
107
$0
$500
$1,000
$1,500
$2,000
$2,500
0
100
200
300
400
500
600
700
800
2011 2012 2013 2014 2015 *
Pulte Homes Del Webb
Centex Land Spend
• Land investment weighed toward
serving move-up homebuyers
through Pulte branded
communities
• Harvesting prior investment in
large Del Webb communities Investing in smaller projects to
serve a broader segment of the
active adult market
• Difficult to find replacement entry
level Centex communities as
slow absorption paces hinder
returns Serving more affluent first-time
buyers looking for a more urban
location
Community Count and Land Spend ($ millions)
* 2015 figures: community count as of Q3; land spend is full-year forecast as
of Sept 30, 2015
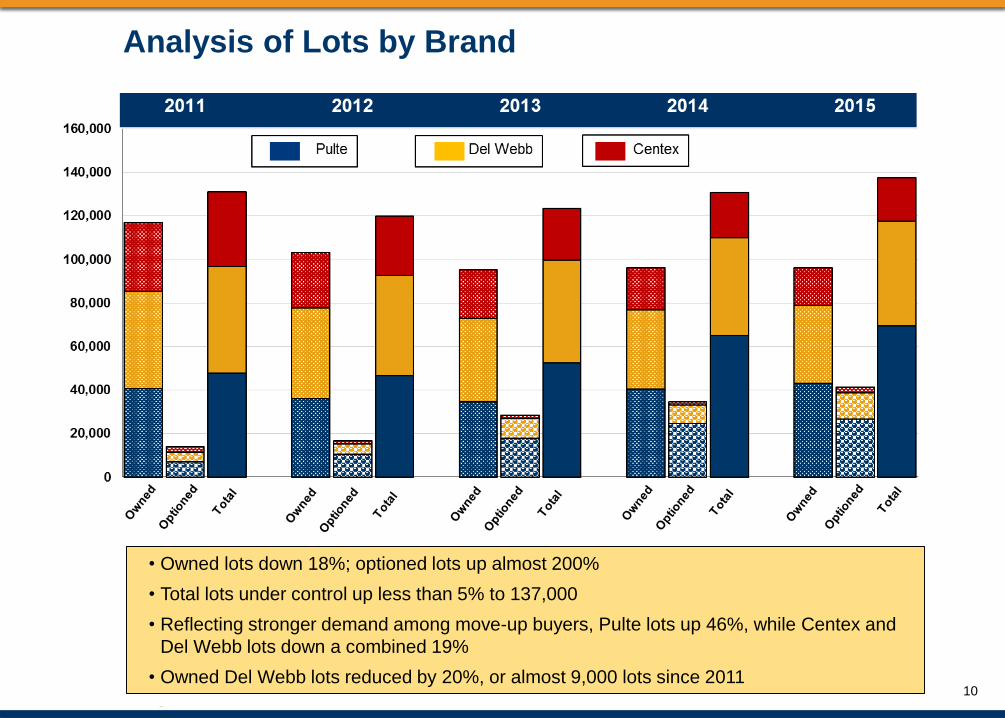
Analysis of Lots by Brand
• Owned lots down 18%; optioned lots up almost 200%
• Total lots under control up less than 5% to 137,000
• Reflecting stronger demand among move-up buyers, Pulte lots up 46%, while Centex and
Del Webb lots down a combined 19%
• Owned Del Webb lots reduced by 20%, or almost 9,000 lots since 201110
11
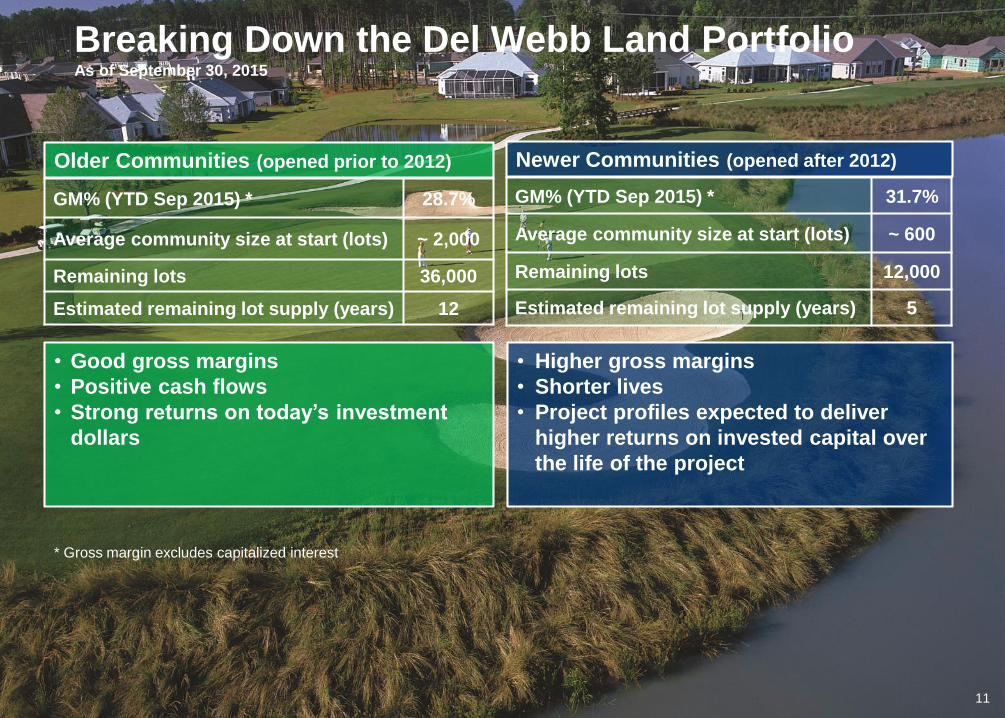
GM% (YTD Sep 2015) * 28.7%
Average community size at start (lots) ~ 2,000
Remaining lots 36,000
Estimated remaining lot supply (years) 12
Breaking Down the Del Webb Land Portfolio As of September 30, 2015
GM% (YTD Sep 2015) * 31.7%
Average community size at start (lots) ~ 600
Remaining lots 12,000
Estimated remaining lot supply (years) 5
Older Communities (opened prior to 2012) Newer Communities (opened after 2012)
• Good gross margins
• Positive cash flows
• Strong returns on today’s investment
dollars
• Higher gross margins
• Shorter lives
• Project profiles expected to deliver
higher returns on invested capital over
the life of the project
11
* Gross margin excludes capitalized interest

12
Serving Distinct Homebuyer Groups

13
First-Time Buyer Strategy
• Potentially a long-term opportunity, but headwinds remain
Lack of jobs/higher wage jobs
Increased student loan debt
Constrained mortgage availability
• Sustained buyer demand realized in closer-in communities
• Centex Q3 2015 ASP of $219,000 targets the higher end of the category
• Absorption pace is critical driver of ROIC
Business can deliver high returns, but margins are lower

14
• Investing in entry level projects that
generate acceptable returns
Not targeting the bottom of the buyer range
as Centex ASP $219,000
Focus on closer-in communities; not betting
on outlying, albeit lower cost, land positions
• Areas of investment focus: Texas, the
Midwest, Florida, the Carolinas and
California
• Ongoing work to lower overall product
costs, but not targeting the lower price
points of the segment
First-Time Buyer Strategy

15
First-Time Buyer Strategy
• Serving first-time buyers looking for a
more urban location
Older Millennials seeking closer-in
locations and willing to accept attached
product
Better financial profile with greater access
to mortgage market than entry-level buyer
• Entitlement/development is challenging,
but higher ASP’s and margins make this
an attractive product category
• Currently represents about 10% of
PulteGroup communities
Opportunities to target this buyer in most
markets across the country
Georgia
Massachusetts
California
16
Sustained Strength of the Move-Up Buyer
• Move-up buyers have driven the first leg of the
housing recovery and currently accounts for majority
of housing demand
Higher likelihood of children and need for more space
Financially capable and benefitting from recovery in stock
market
Greater access to mortgage financing
May be capturing some older first-time buyers
• Recent Census data showed home ownership among
individuals age 35 to 54 exceeded 65%
17
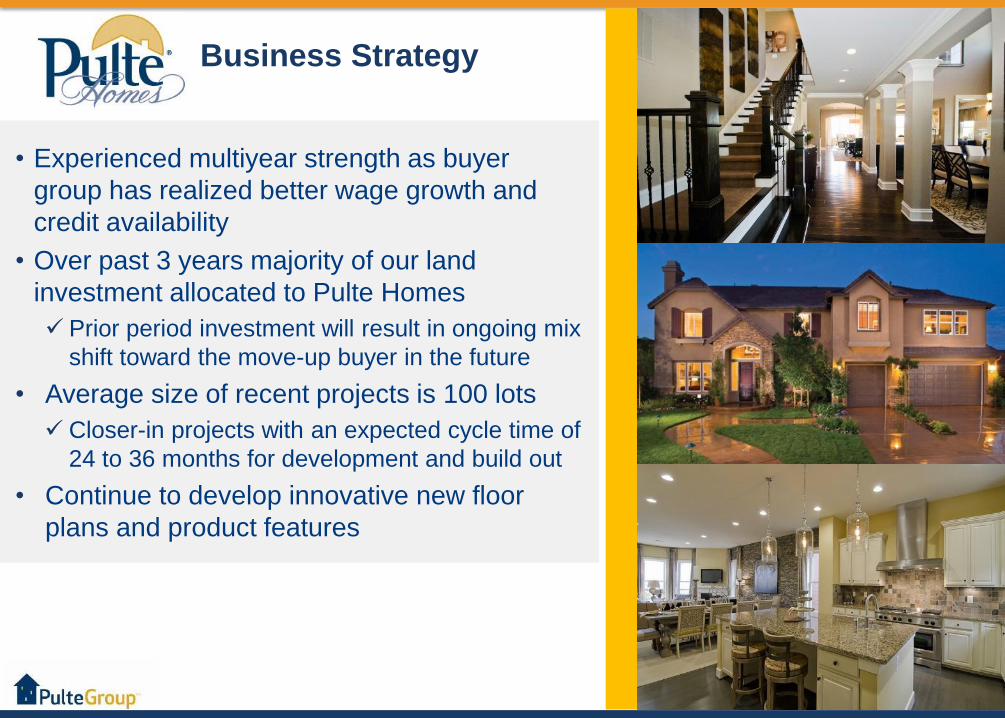
Business Strategy
• Experienced multiyear strength as buyer
group has realized better wage growth and
credit availability
• Over past 3 years majority of our land
investment allocated to Pulte Homes
Prior period investment will result in ongoing mix
shift toward the move-up buyer in the future
• Average size of recent projects is 100 lots
Closer-in projects with an expected cycle time of
24 to 36 months for development and build out
• Continue to develop innovative new floor
plans and product features
18
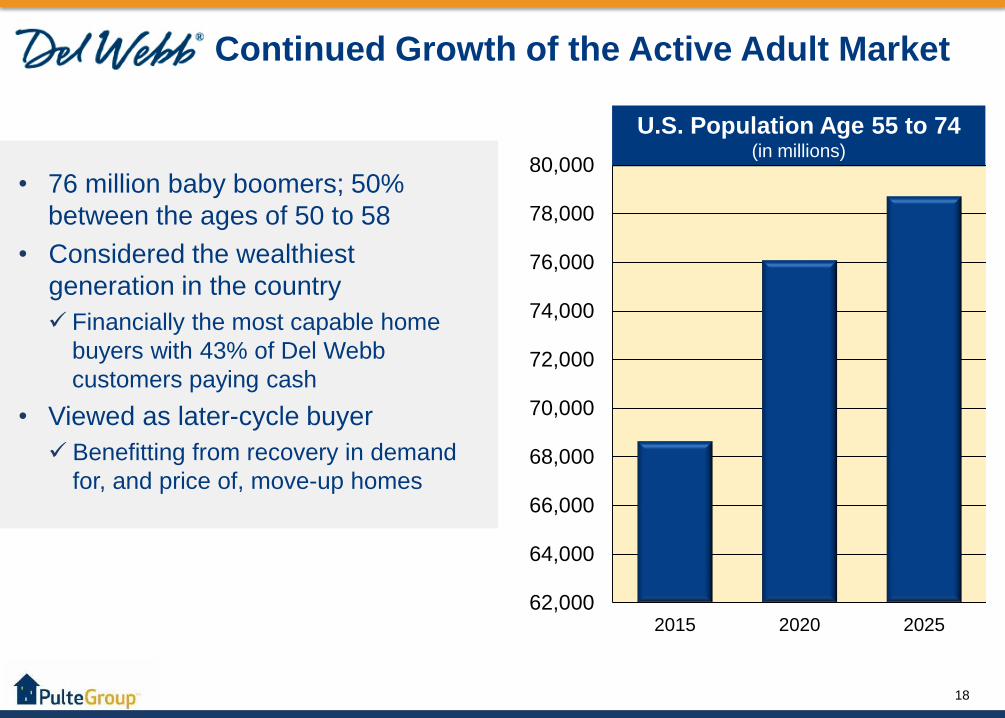
Continued Growth of the Active Adult Market
• 76 million baby boomers; 50%
between the ages of 50 to 58
• Considered the wealthiest
generation in the country
Financially the most capable home
buyers with 43% of Del Webb
customers paying cash
• Viewed as later-cycle buyer
Benefitting from recovery in demand
for, and price of, move-up homes
U.S. Population Age 55 to 74(in millions)
62,000
64,000
66,000
68,000
70,000
72,000
74,000
76,000
78,000
80,000
2015 2020 2025

19
Business Strategy
• Legacy investment in large, highly
amenitized Del Webb communities
Continue to work down investment and
redeploy capital to other opportunities
36,000 owned Del Webb lots as of Q3 2015,
down from 47,000 as of 12/31/11
• Company’s highest gross margins, so
keeping paces high is important
• Changing profile of Webb projects;
1,000 to 1,500 lots with right-sized amenity
Closer-in projects with good returns/less risk
Faster turning and less capital intensive
communities
Carolina Arbors in North Carolina

20
Expanding Penetration of Active Adult Market
• Assessing opportunities to expand
penetration of active adult market
Potential to offer smaller, non-age restricted
communities
Focus on product with “lite” or no amenity
package
Would not carry the Del Webb brand
Municipalities often more receptive to
community profile given lower impact on local
infrastructure: roads, schools, water
Test communities have demonstrated the
concept resonates with the consumer group
33%
30%
37%
No Interest Neutral Appealing
Interest in Age Restricted Lifestyle
Communities
New
Opportunity

21
Capital Allocation Aligned with
Value Creation
22
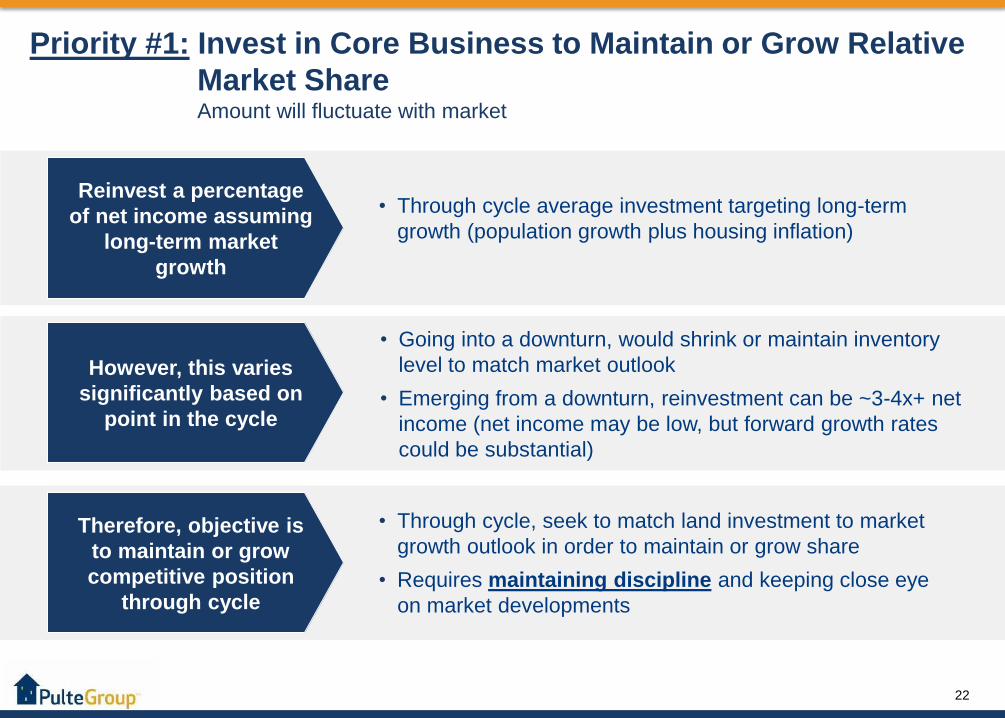
Priority #1: Invest in Core Business to Maintain or Grow Relative
Market Share Amount will fluctuate with market
Reinvest a percentage
of net income assuming
long-term market
growth
• Through cycle average investment targeting long-term
growth (population growth plus housing inflation)
However, this varies
significantly based on
point in the cycle
• Going into a downturn, would shrink or maintain inventory
level to match market outlook
• Emerging from a downturn, reinvestment can be ~3-4x+ net
income (net income may be low, but forward growth rates
could be substantial)
Therefore, objective is
to maintain or grow
competitive position
through cycle
• Through cycle, seek to match land investment to market
growth outlook in order to maintain or grow share
• Requires maintaining discipline and keeping close eye
on market developments

23
Priority #2: Our Dividend Policy
• Research indicates companies paying a larger dividend realize higher
P/E multiples as long as the dividend is deemed sustainable
• We ultimately target a dividend equivalent to ~2.0% to 3.0% yield
Endeavor to maintain sufficient liquidity to continue funding our dividend
through normal market downturns
• We declared an $0.08 per share dividend payable in January 2015
60% increase over then existing dividend
Approximately $115 million aggregate annualized dividend stream
• Future dividend declarations subject to Board of Director approval
which will depend on market conditions, expected cash flows and other
variables

24
Priority #3: Opportunistic M&A
• Continue to evaluate available opportunities as land transactions –
we will not chase growth for growth’s sake
• Interested in transactions that:
Provide depth/fill a production gap in markets where we operate today
Offer an opportunity to access attractive markets
• Willing to flex above 40% leverage for the right opportunities –
provided there is a plan to return to desired range in a reasonable
timeframe
• Only pursue if accretive to earnings and returns
25
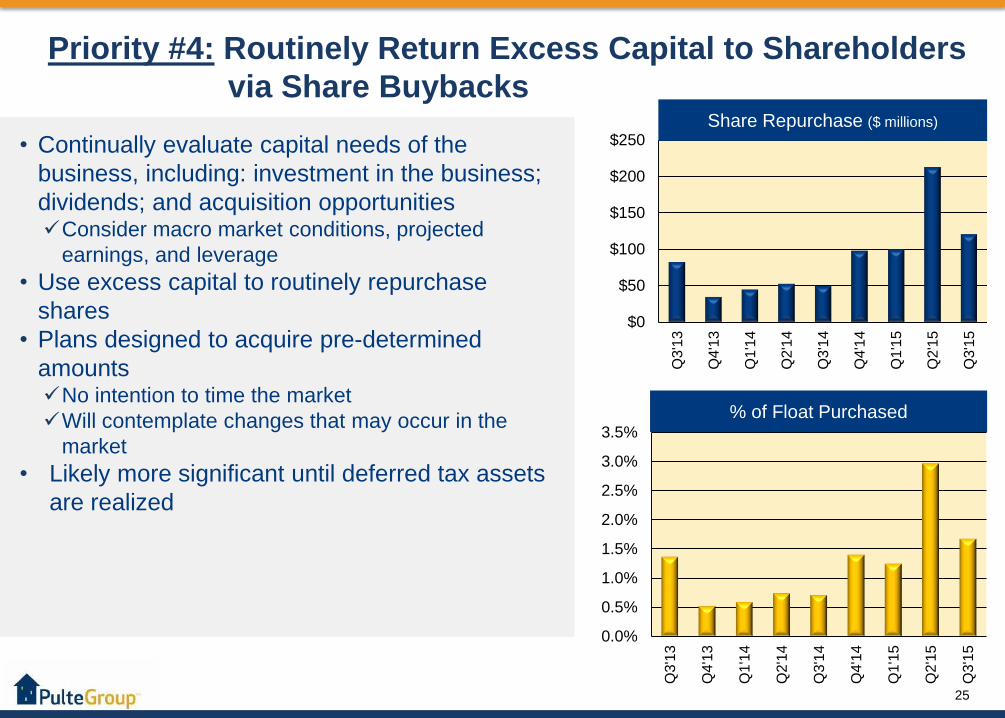
Priority #4: Routinely Return Excess Capital to Shareholders
via Share Buybacks
• Continually evaluate capital needs of the
business, including: investment in the business;
dividends; and acquisition opportunitiesConsider macro market conditions, projected
earnings, and leverage
• Use excess capital to routinely repurchase
shares
• Plans designed to acquire pre-determined
amountsNo intention to time the market
Will contemplate changes that may occur in the
market
• Likely more significant until deferred tax assets
are realized
$0
$50
$100
$150
$200
$250
Q3
'13
Q4
'13
Q1
'14
Q2
'14
Q3'1
4
Q4
'14
Q1
'15
Q2
'15
Q3
'15
Share Repurchase ($ millions)
0.0%
0.5%
1.0%
1.5%
2.0%
2.5%
3.0%
3.5%
Q3
'13
Q4
'13
Q1
'14
Q2
'14
Q3
'14
Q4
'14
Q1
'15
Q2
'15
Q3
'15
% of Float Purchased
26
In Summary
• Articulated strategy focused on long-term success
• Unmatched ability to serve all major buyer groups
• Value Creation strategy goal to deliver better
ROIC over the housing cycle and top quartile TSR
over time
• Return excess capital to shareholders
27
We Build Consumer Inspired
Homes and Communities to
Make Lives Better