Pulse Metrology Tool and Burst-Mode Laser Amplifier for the ...
127
Pulse Metrology Tool and Burst-Mode Laser Amplifier for the Free-Electron Laser in Hamburg Dissertation Z UR E RLANGUNG DES DOKTORGRADES an der Fakultät für Mathematik, Informatik und Naturwissenschaften FACHBEREICH P HYSIK DER U NIVERSITÄT H AMBURG vorgelegt von HERRN DIPL .-P HYS .ROBERT R IEDEL Hamburg, 2013
Transcript of Pulse Metrology Tool and Burst-Mode Laser Amplifier for the ...

Pulse Metrology Tool and Burst-Mode LaserAmplifier for the Free-Electron Laser in Hamburg
DissertationZUR ERLANGUNG DES DOKTORGRADES
an der Fakultät für Mathematik, Informatik und NaturwissenschaftenFACHBEREICH PHYSIK
DER UNIVERSITÄT HAMBURG
vorgelegt vonHERRN DIPL.-PHYS. ROBERT RIEDEL
Hamburg, 2013

Erstgutachter: Prof. Dr. Markus DrescherZweitgutachter: Prof. Dr. Franz X. KärtnerTag der Dissertation: 02.12.2013Gutachter der Disputation: Prof. Dr. Dieter Horns
Prof. Dr. Markus DrescherProf. Dr. Franz X. KärtnerPD Dr. Tim LaarmannProf. Dr. Peter Schmelcher
AbstractThe full scientific potential of high repetition rate free-electron lasers is still not exploited. Theattainable resolution of time-resolved experiments is limited by fluctuating temporal pulse prop-erties due to the self-amplified spontaneous emission process. To overcome this limitation, thetemporal characterization of free-electron laser pulses was improved by the development of asingle-shot temporal pulse metrology tool, based on a solid-state cross-correlation technique.The method is based on probing the optical transmission change of a transparent solid ma-terial pumped by a free-electron laser pulse. A comprehensive theoretical model allows thereconstruction of the free-electron laser pulse structure. Pulse duration measurements were per-formed at the Free-Electron Laser in Hamburg, FLASH, yielding 184 fs at 41.5 nm wavelengthand sub-40 fs at 5.5 nm. Online measurements during a running experiment are possible with aresidual soft-X-ray transmission of 10–45%. A resolution of sub-10 fs can be attained, providedthat sufficiently short optical probe pulses are available.
Achieving the full performance of high repetition rate free-electron lasers, such as FLASH,requires also optical laser systems with a high repetition rate. A novel burst-mode optical para-metric chirped-pulse amplifier is being developed for high-resolution pump-probe experimentsand seeding of FLASH at its full repetition rate of 100 kHz–1 MHz. In this work, a first pro-totype was tested, delivering 1.4 mJ pulse energy and a spectral bandwidth supporting sub-7 fspulse duration at 27.5 kHz intra-burst repetition rate. A passive pump-to-signal synchroniza-tion method was developed for long-term stability with sub-7 fs root mean square jitter betweenpump and signal pulses. The developed amplifier technology is scalable to high average powersfor the future generation of kilowatt-pumped ultrashort laser amplifiers.


Kurzfassung in deutscher SpracheDas Potential moderner Freie-Elektronenlaser im Röntgenbereich ist noch nicht voll ausge-schöpft, da starke Schwankungen der zeitlichen Pulseigenschaften die erreichbare Auflösungin zeitaufgelösten Experimenten limitieren. Um die Auflösung zu verbessern, wurde eineEinzelschuss-Röntgenpulsdiagnostik entwickelt, basierend auf dem Prinzip eines Plasmaschal-ters. Durch Abtasten der optischen Transmission einer mit dem Röntgenpuls angeregten Probewurde eine Kreuzkorrelation zwischen einem optischen Laserpuls und dem Röntgenpuls ge-messen. Ein theoretisches Modell zur Beschreibung der Ionisationsdynamik und der damit ver-bundenen optischen Transmissionseigenschaften wurde entwickelt und zur Rekonstruktion desRöntgenpulses verwendet. Pulsdauermessungen, welche am Freie-Elektronen-Laser in Ham-burg, FLASH, durchgeführt wurden, ergaben eine Pulsdauer von 184 fs bei einer Wellenlängevon 41.5 nm sowie < 40fs bei 5.5 nm. Da bei sehr dünnen Proben eine Resttransmissionweicher Röntgenstrahlung von 10–45% zu erwarten ist, ist eine gleichzeitige Pulsdiagnostikwährend eines laufenden Experimentes möglich. Die theoretisch erreichbare Auflösung desMessverfahrens beträgt < 10fs, wenn ein vergleichbar kurzer optischer Laserpuls zur Abtas-tung verwendet wird.
Freie-Elektronenlaser mit hohen Repetitionsraten profitieren in besonderem Maße von op-tischen Lasern mit hohen Repetitionsraten, da bei zeitaufgelösten Anregungs-Abfrage-Experi-menten für jeden Röntgenpuls ein optischer Puls zur Verfügung stehen muss. Ein entsprechen-der Hochleistungslaser wird für FLASH entwickelt, basierend auf optisch-parametrischer Breit-bandverstärkung. Dieser soll sowohl für die Femtosekundenspektroskopie in der Experimen-tierhalle, als auch für das Seeding bei Repetitionsraten von 100 kHz–1 MHz eingesetzt wer-den. In der vorliegenden Arbeit wurde ein erster Prototyp aufgebaut und getestet. Dieserlieferte 1.4 mJ Pulsenergie bei einer spektralen Bandbreite, welche Pulsdauern < 7fs unter-stützt. Die Repetitionsrate innerhalb eines Pulszuges betrug 27.5 kHz. Für die Verbesserung derLangzeitstabilität wurde ein passives Synchronisationskonzept für Pump- und Signalpulse ent-wickelt. Dabei wurde ein Synchronisationsjitter < 7fs im quadratischen Mittel erreicht. Diesezukunftsweisende Verstärkertechnologie ist theoretisch auf hohe mittlere Ausgangsleistungenvon mehreren einhundert Watt skalierbar.


Dedicatedto
my beautiful wife


List of publications: peer-reviewed journalsR. Riedel, M. Schulz, M. J. Prandolini, A. Hage, H. Höppner, T. Gottschall, J. Limpert,M. Drescher and F. Tavella. Long-term stabilization of high power optical parametricchirped-pulse amplifiers. Optics Express accepted (2013)
R. Riedel, A. Al-Shemmary, M. Gensch, T. Golz, M. Harmand, N. Medvedev, M. J. Pran-dolini, K. Sokolowski-Tinten, S. Toleikis, U. Wegner, B. Ziaja, N. Stojanovic and F. Tavel-la. Single-shot pulse duration monitor for extreme ultraviolet and X-ray free-electronlasers. Nature Communications 4:1731 (2013)
A. Willner, A. Hage, R. Riedel, I. Grguras, A. Simoncig, M. Schulz, T. Dzelzainis,H. Höppner, S. Huber, M. J. Prandolini, B. Dromey, M. Zepf, A. L. Cavalieri, F. Tavella.Coherent spectral enhancement of carrier-envelope-phase stable continua with dual-gashigh harmonic generation. Optics Letters 37:3672–3674 (2012)
M. Schulz, R. Riedel, A. Willner, S. Düsterer, M. J. Prandolini, J. Feldhaus, B. Faatz,J. Rossbach, M. Drescher and F. Tavella. Pulsed operation of a high average powerYb:YAG thin-disk multipass amplifier. Optics Express 20:5038–5043 (2012)
A. Willner, F. Tavella, M. Yeung, T. Dzelzainis, C. Kamperidis, M. Bakarezos, D. Adams,M. Schulz, R. Riedel, M. C. Hoffmann, W. Hu, J. Rossbach, M. Drescher, N. A. Papado-giannis, M. Tatarakis, B. Dromey and M. Zepf. Coherent Control of High HarmonicGeneration via Dual-Gas Multijet Arrays. Physical Review Letters 107:175002 (2011)
M. Schulz, R. Riedel, A. Willner, T. Mans, C. Schnitzler, P. Russbueldt, J. Dolkemeyer,E. Seise, T. Gottschall, S. Hädrich, S. Düsterer, H. Schlarb, J. Feldhaus, J. Limpert,B. Faatz, A. Tünnermann, J. Rossbach, M. Drescher and F. Tavella. Yb:YAG Innoslabamplifier: efficient high repetition rate subpicosecond pumping system for optical para-metric chirped pulse amplification. Optics Letters 36:2456–2458 (2011)
A. Willner, F. Tavella, M. Yeung, T. Dzelzainis, C. Kamperidis, M. Bakarezos, D. Adams,M. Schulz, R. Riedel, M. C. Hoffmann, W. Hu, J. Rossbach, M. Drescher, V. S. Yakovlev,N. A. Papadogiannis, M. Tatarakis, B. Dromey and M. Zepf. Efficient control of quantumpaths via dual-gas high harmonic generation. New Journal of Physics 13:113001 (2011)


List of publications: contributions to conference proceedingsS. Banerjee, M. Baudisch, J. Biegert, A. Borot, A. Borzsonyi, D. Charalambidis, T. Dit-mire, Z. Diveki, P. Dombi, K. Ertel, M. Galimberti, J. Fulop, E. Gaul, C. L. Haefner,M. Hemmer, C. Hernandez-Gomez, M. Kalashnikov, D. Kandula, A. Kovacs, R. Lopez-Martens, P. D. Mason, I. Marton, I. Musgrave, K. Osvay, M. Prandolini, E. Racz, P. Racz,R. Riedel, I. Ross, J. Rosseau, M. Schulz, F. Tavella, A. Thai and I. Will. Conceptual De-sign of the Laser Systems for the Attosecond Light Pulse Source. Conference on Lasersand Electro-Optics (CLEO) CTu2D.6 (June 9–14 2013, San José, California USA)
F. Tavella, R. Riedel, A. Willner, M. Schulz, M. J. Prandolini, S. Düsterer, J. Feldhaus,M. Drescher and B. Faatz. Optical Parametric Chirped Pulse Amplification at HighRepetition Rate Free Electron Laser Facility. Frontiers in Optics (FiO) conference 2012FTu5B.2 invited (October 14–18 2012, Rochester, New York USA)
M. Schulz, A. Willner, R. Riedel, M. J. Prandolini, S. Düsterer, J. Feldhaus, B. Faatz,M. Drescher and F. Tavella. Kilowatt level burst-mode OPCPA pump amplifier con-cepts. Frontiers in Optics (FiO) conference 2012 FM4G.1 invited (October 14–18 2012,Rochester, New York USA)
M. Schulz, A. Willner, R. Riedel, M. J. Prandolini, S. Duesterer, J. Feldhaus, B. Faatz,J. Rossbach, M. Drescher and F. Tavella. Kilowatt level Yb:YAG thindisk pump laseramplifier system for seeding FLASH2. Conference on Lasers and Electro-Optics (CLEO)CM1D.1 (May 6–11 2012, San José, California USA)
K. Honkavaara et al. Status of the FLASH II Project. Proceedings of the Free-ElectronLaser Conference (FEL) WEPD.07 (August 22–26 2011, Shanghai, China)
A. Willner, M. Schulz, R. Riedel, M. Yeung, T. Dzelzainis, C. Kamperidis, M. Bakarezos,D. Adams, V. Yakovlev, J. Rönsch-Schulenburg, B. Dromey, N. Papadogiannis, M. Tata-rakis, S. Düsterer, S. Schreiber, B. Faatz, M. Drescher, J. Rossbach, M. Zepf and F. Tavella.A new XUV-source for seeding a FEL at high repetition rates. SPIE Proceedings8075:80750L (April 18 2011, Prague, Czech Republic)
M. Först, M. Gensch, R. Riedel, F. Tavella, E. A. Schneidmiller, N. Stojanovic, M. V. Yur-kov. Optical Afterburner for SASE FEL: First Results from FLASH. Proceedings of theInternational Particle Accelerator Conference (IPAC) THPC.084 (September 4–9 2011,San Sebastián, Spain)
F. Tavella et al. High Repetition Rate mJ-level Few- Cycle Pulse Laser Amplifier forXUV-FEL seeding. High Intensity Lasers and High Field Phenomena (HILAS) confer-ence HThD.1 (February 16–18 2011, Istanbul, Turkey)


List of Figures
1.1 Delay jitter in pump-probe experiments with optical lasers and FEL pulses. . . 61.2 Present status and future scenario of extreme-ultraviolet free-electron lasers . . 8
2.1 Influence of the higher-order dispersion on the pulse shape . . . . . . . . . . . 152.2 Non-collinear phase-matching geometry for broadband OPA . . . . . . . . . . 222.3 Calculated gain and wave-vector mismatch for non-collinear phase-matching in
BBO . . . . . . . . . . . . . . . . . . . . . . . . . . . . . . . . . . . . . . . . 232.4 Self-phase-modulation (SPM) of a GAUSSIAN pulse . . . . . . . . . . . . . . 252.5 White-light supercontinuum generation in YAG . . . . . . . . . . . . . . . . . 262.6 Multiphoton-ionization-assisted avalanche ionization dynamics during an in-
tense laser pulse . . . . . . . . . . . . . . . . . . . . . . . . . . . . . . . . . . 282.7 Electronic properties of silicon . . . . . . . . . . . . . . . . . . . . . . . . . . 312.8 Attenuation length of Si, fused silica and Si3N4 . . . . . . . . . . . . . . . . . 322.9 Temporal dynamics of the electron density within fused silica . . . . . . . . . . 342.10 Complex refractive index of a free-electron plasma . . . . . . . . . . . . . . . 362.11 Schematic setup of an intensity cross-correlator . . . . . . . . . . . . . . . . . 382.12 Schematic of the spectral interference for direct electric field reconstruction
(SPIDER) technique . . . . . . . . . . . . . . . . . . . . . . . . . . . . . . . 39
3.1 Setup and principle of the single-shot cross-correlator . . . . . . . . . . . . . . 433.2 Monte-Carlo simulation of the free-electron density within fused silica during
the irradiation with an ultrashort XUV pulse . . . . . . . . . . . . . . . . . . . 463.3 Simulation of the transmission function, G(t) . . . . . . . . . . . . . . . . . . 473.4 Simulation algorithm . . . . . . . . . . . . . . . . . . . . . . . . . . . . . . . 493.5 Cross-correlation measurement, S(∆t) . . . . . . . . . . . . . . . . . . . . . . 513.6 Single-shot cross-correlations using fused silica samples . . . . . . . . . . . . 523.7 Single-shot cross-correlation using the Si3N4 membrane . . . . . . . . . . . . 533.8 Transmission function, G(t,λ ) calculated for different optical wavelengths . . . 563.9 Calculated cross-correlations, S(∆t), of GAUSSIAN double pulses . . . . . . . . 583.10 Performance simulation of the FEL pulse retrieval under the presence of noise . 593.11 Simulated cross-correlation, S(∆t), of a seeded FEL pulse . . . . . . . . . . . . 603.12 Schematic experimental setup of the compact OPA tested for the generation of
20 fs pulses at FEL beamline endstations . . . . . . . . . . . . . . . . . . . . . 613.13 Characterization of the amplified pulses . . . . . . . . . . . . . . . . . . . . . 62
4.1 Chirped-pulse amplification (CPA) . . . . . . . . . . . . . . . . . . . . . . . . 654.2 Evaluation of the phase-matching bandwidth of different nonlinear crystals . . 68
13
4.3 Schematic of the high power optical parametric chirped-pulse amplifier (OPCPA) 704.4 SPIDER pulse duration measurement used to test the dispersion compensation
scheme . . . . . . . . . . . . . . . . . . . . . . . . . . . . . . . . . . . . . . 724.5 Second harmonic generation of the compressed Yb:YAG Innoslab pulses . . . . 734.6 Spectral distribution of amplified optic parametric fluorescence along different
internal non-collinear angles . . . . . . . . . . . . . . . . . . . . . . . . . . . 734.7 Amplified spectral bandwidth of the three-stage OPCPA . . . . . . . . . . . . 754.8 Evaluation of the compressible pulse duration . . . . . . . . . . . . . . . . . . 754.9 White-light continuum generation in laser host materials . . . . . . . . . . . . 784.10 Experimental setup of the WLG-seeded OPCPA . . . . . . . . . . . . . . . . . 794.11 Experimental results of the WLG-seeded OPCPA . . . . . . . . . . . . . . . . 804.12 Evaluation of different YAG crystal lengths for an optimized WLG stability . . 824.13 Experimental setup for the pump-to-WLG delay measurement . . . . . . . . . 834.14 Long-term stability and intrinsic temporal jitter from WLG . . . . . . . . . . . 844.15 Evaluation of the idler-absorption in OPCPA . . . . . . . . . . . . . . . . . . . 854.16 Simulated temperature profiles in 1 kW pumped BBO and LBO . . . . . . . . . 864.17 Thermal effects on non-collinear OPCPA with BBO and LBO crystals . . . . . 87
B.1 Matrix transfer method . . . . . . . . . . . . . . . . . . . . . . . . . . . . . . V

List of Tables
2.1 Effective energy gap of different materials . . . . . . . . . . . . . . . . . . . . 33
4.1 Nonlinear optical crystal parameters. . . . . . . . . . . . . . . . . . . . . . . . 694.2 Dispersion Management of the signal path . . . . . . . . . . . . . . . . . . . . 714.3 Nonlinear refractive index and optical band gap in different materials . . . . . . 78
A.1 SELLMEIER-coefficients of different nonlinear crystals. . . . . . . . . . . . . . III

Contents
1 Introduction 31.1 Problems and challenges . . . . . . . . . . . . . . . . . . . . . . . . . . . . . 31.2 Jitter limitations at FELs . . . . . . . . . . . . . . . . . . . . . . . . . . . . . 51.3 Present and future scenario for FLASH . . . . . . . . . . . . . . . . . . . . . . 71.4 Thesis outline . . . . . . . . . . . . . . . . . . . . . . . . . . . . . . . . . . . 9
2 Theoretical background 112.1 Principle of free-electron lasers . . . . . . . . . . . . . . . . . . . . . . . . . . 112.2 Propagation of ultrashort pulses . . . . . . . . . . . . . . . . . . . . . . . . . 122.3 Dispersion . . . . . . . . . . . . . . . . . . . . . . . . . . . . . . . . . . . . . 162.4 Nonlinear optical phenomena . . . . . . . . . . . . . . . . . . . . . . . . . . . 18
2.4.1 Optical parametric amplification . . . . . . . . . . . . . . . . . . . . . 182.4.2 Phase-matching in nonlinear optical crystals . . . . . . . . . . . . . . . 212.4.3 Third-order processes . . . . . . . . . . . . . . . . . . . . . . . . . . . 242.4.4 Filamentation and supercontinuum generation in solids . . . . . . . . . 25
2.5 Ionization dynamics in insulators and semiconductors . . . . . . . . . . . . . . 302.5.1 Excitation processes . . . . . . . . . . . . . . . . . . . . . . . . . . . 302.5.2 Numerical Methods . . . . . . . . . . . . . . . . . . . . . . . . . . . . 312.5.3 Effective energy gap . . . . . . . . . . . . . . . . . . . . . . . . . . . 322.5.4 Electron dynamics within fused silica . . . . . . . . . . . . . . . . . . 332.5.5 Optical properties of a free-electron plasma . . . . . . . . . . . . . . . 34
2.6 Temporal characterization of ultrashort pulses . . . . . . . . . . . . . . . . . . 372.6.1 Intensity cross-correlation and autocorrelation . . . . . . . . . . . . . . 372.6.2 Phase-sensitive methods . . . . . . . . . . . . . . . . . . . . . . . . . 38
3 Single-shot pulse duration measurements at XUV and X-ray free-electron lasers 413.1 Measuring the FEL pulse duration: an overview . . . . . . . . . . . . . . . . . 423.2 Single-shot cross-correlator . . . . . . . . . . . . . . . . . . . . . . . . . . . . 423.3 Physical model and data evaluation . . . . . . . . . . . . . . . . . . . . . . . . 45
3.3.1 Monte-Carlo simulation . . . . . . . . . . . . . . . . . . . . . . . . . 453.3.2 Calculation of electron density . . . . . . . . . . . . . . . . . . . . . . 463.3.3 Optical transmission function . . . . . . . . . . . . . . . . . . . . . . 473.3.4 Fitting algorithm . . . . . . . . . . . . . . . . . . . . . . . . . . . . . 48
3.4 Single-shot measurements . . . . . . . . . . . . . . . . . . . . . . . . . . . . 503.4.1 Data processing . . . . . . . . . . . . . . . . . . . . . . . . . . . . . . 503.4.2 Target material: fused silica . . . . . . . . . . . . . . . . . . . . . . . 50
1
2 CONTENTS
3.4.3 Target material: silicon nitride membrane . . . . . . . . . . . . . . . . 533.4.4 Discussion on the measured pulse duration . . . . . . . . . . . . . . . 53
3.5 Error analysis . . . . . . . . . . . . . . . . . . . . . . . . . . . . . . . . . . . 543.5.1 Resolution and sensitivity . . . . . . . . . . . . . . . . . . . . . . . . 543.5.2 Pointing jitter . . . . . . . . . . . . . . . . . . . . . . . . . . . . . . . 54
3.6 Perspectives: reaching the few-fs resolution . . . . . . . . . . . . . . . . . . . 543.6.1 Imaging resolution . . . . . . . . . . . . . . . . . . . . . . . . . . . . 553.6.2 Dispersive effect on shortest probe pulses . . . . . . . . . . . . . . . . 553.6.3 Spectral investigation of the gating process . . . . . . . . . . . . . . . 553.6.4 Complex pulse shapes . . . . . . . . . . . . . . . . . . . . . . . . . . 56
3.7 Compact laser amplifier for increased temporal resolution at existing pump-probe beamlines . . . . . . . . . . . . . . . . . . . . . . . . . . . . . . . . . . 60
4 High repetition rate optical parametric chirped-pulse amplifier 634.1 State-of-the-art Ti:sapphire amplifiers . . . . . . . . . . . . . . . . . . . . . . 644.2 Optical parametric chirped-pulse amplification . . . . . . . . . . . . . . . . . . 66
4.2.1 Choice of nonlinear optical crystal . . . . . . . . . . . . . . . . . . . . 684.3 OPCPA setup and results . . . . . . . . . . . . . . . . . . . . . . . . . . . . . 694.4 Passive pump-to-seed overlap stabilization . . . . . . . . . . . . . . . . . . . . 76
4.4.1 Supercontinuum-generation in laser host materials . . . . . . . . . . . 774.4.2 Optical parametric amplification of supercontinuum pulses . . . . . . . 774.4.3 Long-term stability and intrinsic temporal jitter . . . . . . . . . . . . . 81
4.5 OPCPA at high average powers . . . . . . . . . . . . . . . . . . . . . . . . . . 854.5.1 Absorption of signal, idler and pump . . . . . . . . . . . . . . . . . . 854.5.2 Temperature dependence of gain bandwidth . . . . . . . . . . . . . . . 86
5 Conclusion and Outlook 89
Appendices I
A Refractive indices of nonlinear crystals III
B The transfer matrix formalism V
Bibliography VII
Chapter 1
Introduction
The full potential of fourth-generation extreme-ultraviolet (XUV) and X-ray free-electron lasers(FELs) is still not accessible. Time-resolved experiments in this wavelength region show themost promising applications, enabling outstanding insight into ultrafast processes on the nano-scale with a huge impact on a broad scientific community. The Free-Electron Laser in Hamburg,FLASH, is to date the only light source generating intense ultrashort pulses in the XUV and softX-ray spectral region at a high repetition rate [1]. This unique property benefits the qualitativeand quantitative scientific output from a single experimental beam time. However, such excel-lent performance is still not accessible for the great majority of time-resolved experiments. Thisis, on one hand, due to the lack of FEL pulse metrology tools, and, on the other hand, due to thelimited performance of the applied optical laser systems.
This doctoral thesis treats the development of novel techniques, improving the performanceof time-resolved experiments at state-of-the-art and future XUV and X-ray free-electron lasers.Foremost, a precise and versatile metrology tool for the temporal properties of single FELpulses was developed at FLASH [2]. Furthermore, a new high repetition rate optical parametricchirped-pulse amplifier (OPCPA) is being developed [3] for the application as pump-probe laserand seeding laser. This will allow increased experimental statistics and improved temporal reso-lution at pump-probe experiments performed at FLASH. In addition, the temporal and spectralpulse stability as well as the synchronization can be improved by future seeding of the FEL at ahigh repetition rate. The achieved laser parameters are worldwide unique and will consolidatethe position of FLASH at the forefront of FEL science. The aim of this work is to contributeto an enhanced performance of future experiments that involve the powerful combination ofultrashort XUV and X-ray FELs and optical lasers.
1.1 Problems and challengesToday, FELs are operated as user facilities, relying on large-scale linear electron accelerators(LINACs) and state-of-the-art precision undulator technology [1, 4–7]. Pulse durations in the10 fs range at gigawatts of optical power are achieved with a high degree of spatial and temporalcoherence compared to conventional synchrotron sources. However, despite the unique scien-tific capabilities of FELs, the main handicap is insufficient characterization of the statisticallyfluctuating temporal pulse properties, limiting the resolution of time-resolved experiments atFELs.
One of the scientific goals of XUV and X-ray free-electron laser science is the time-resolved
3

4 CHAPTER 1. INTRODUCTION
investigation of structural dynamics of matter with atomic resolution [8]. Foremost, instanta-neous coherent diffractive imaging of a single biomolecule in its functional environment istraded as the outstanding FEL application [9–12]. The investigation of inner-shell photoexcita-tion [13–16] and nonlinear processes in atoms, molecules and clusters [17–19] on ultrafast timescales reveals groundbreaking understanding of the microscopic world. Collective charge trans-fer [20, 21] and spin dynamics in condensed matter has been spotlighted to push the frontiers ofsolid-state physics and information technology [22, 23]. In addition, the generation of tailoredhigh-density states of matter and their temporal evolution has become accessible [24–27] tostudy astronomic phenomena in the laboratory and to improve laser-induced inertial fusion [28].Major improvements are expected by solving the following problems and challenges at currentFELs addressed in this thesis:
• FEL arrival time jitter: A versatile temporal diagnostic method for FEL pulses wasdeveloped. Despite possible FEL and optical laser pulse durations in the 10 fs regime,the temporal resolution is limited by the statistical deviations of the arrival time delay,∆t, between the optical laser and the FEL, which is on the order of 100 fs root meansquare (rms) [29–31]. This jitter is introduced by the electronic locking between opticallaser and FEL, by the self-amplified spontaneous emission (SASE) process, by drifts inthe accelerator modules, and by environmental influence on the whole facility, such astemperature, humidity and vibration. Optical synchronization [32] and external seeding[33] are possible solutions to reduce the jitter to sub-30 fs rms. But still, in order toapproach the possible resolution limit, the arrival time delay needs to be measured on asingle-shot basis. The developed pulse metrology tool developed in this work is capableto achieve sub-10 fs resolution [2].
• FEL pulse duration: The temporal pulse properties of SASE FELs underlie strong fluc-tuations. Precise knowledge of the FEL electric field is required, especially for the in-vestigation of nonlinear processes in the XUV [34] or X-ray regime [35]. The availablepulse metrology techniques are complex and time consuming. Therefore, the temporal di-agnostic method was extended to pulse duration measurements, relying on a single-shotcross-correlation. The method can be operated simultaneously to an experiment [2].
• FEL seeding: Present SASE FELs suffer from fluctuations of many pulse parameters,such as beam profile, pulse energy, pulse duration, spectrum, coherence and arrival time.Fully coherent FEL pulses with stable pulse parameters can be achieved via direct seed-ing of the FEL process by a defined external laser pulse [7, 36–39]. For the new FELFLASH2, the seeding with high gain harmonic generation (HGHG [7]) is planned at thefull intra-burst repetition rate of 100 kHz to 1 MHz. Therefore, a high repetition rate seed-ing laser is being developed (see next point). Even though the FEL seeding itself is nottreated in this thesis, the developed temporal diagnostic method is an essential technologyfor the characterization and optimization of the seeding process.
• High repetition rate laser development: A high repetition rate burst mode OPCPA isbeing developed for the application as seeding laser and as pump-probe laser. FLASHis operated in a 10 Hz burst mode with an intra-burst repetition rate of up to 1 MHz,corresponding to 8000 pulses per second. Many experiments suffer from a very low light-matter interaction cross-section. The high repetition rate is beneficial for reducing theintegration time, yielding an increased data rate, and hence, an increased scientific output

CHAPTER 1. INTRODUCTION 5
from a single beam time. Therefore, the burst operation mode should be also providedby the seeding laser and the optical pump-probe laser. The current burst mode laser atFLASH delivers only 4000 pulses per second with pulse energies of 10 µJ, which is notsufficient for seeding. The alternative 10 Hz system delivers single pulses with 10 mJ.The bottleneck is the laser amplifier technology. The planned OPCPA aims for intra-burstrepetition rates from 100 kHz to 1 MHz for seeding and pump-probe experiments. Thedeveloped system is capable to generate shortest optical pulses down to the sub-10 fsregime with about 1 mJ pulse energy. This enables high temporal resolution in pump-probe experiments and sufficient energy for FEL seeding.
1.2 Jitter limitations at FELsThe common method for time-resolved experiments is the pump-probe technique. At least twoultrashort pulses are used, a pump-pulse and a probe-pulse. The pump-pulse triggers an event,for instance an excitation to a non-equilibrium state. The probe pulse is used to investigate theexcited state after a certain time delay, ∆t, with respect to the pump pulse. The parameter to beprobed, f (t), must reflect the state of the investigated system, often described by a dedicatedtheoretical framework. The parameter f (t) may describe, for example, the optical transmis-sion change due to electronic population dynamics after an optical excitation. By repeatingthe measurement for different delays, a stroboscopic recording of the system’s evolution fromthe non-equilibrium state to a new equilibrium state can be performed. Because the detectionsystem is slow compared to the duration of the pulses, the measured signal is the convolution,
S(∆t) =∫ +∞
−∞f (t)G(t −∆t)dt, (1.1)
with a gating function, G(t), that is directly related to the probe laser intensity (via the corre-sponding light-target interaction). If the probe pulse is short compared to the ultrafast process,it can be regarded as a DIRAC δ function and the measured signal is directly proportional tothe parameter to be measured, S(∆t) ∝ f (∆t). If the process is comparable to the gating pulseduration, the parameter f (t) is obtained via a deconvolution. As a signal deconvolution is not al-ways possible without considerable errors, the shortest possible probe pulse duration is desiredfor the highest possible temporal resolution.
Temporal pulse metrology of ultrashort pulses in the XUV and X-ray regime is challenging.Various techniques for direct [40–46] and indirect [47–51] measurements exist. For autocorrela-tion and cross-correlation methods [42–44, 52] certain limitations exist concerning the photonenergies and the range of measurable pulse durations. The main disadvantage is that these meth-ods average over many pulses and are thus no single-pulse diagnostics. Light-field streakingmeasurements [40, 41, 45, 53] yield information about the single-shot pulse duration, the linearfrequency chirp and the FEL arrival time, but require either a dedicated terahertz undulator inthe FEL beamline [54, 55] or a laser-driven terahertz source [56, 57].
In particular at pump-probe experiments comprising an optical pump and an FEL probepulse, or vice versa, the temporal resolution is not only determined by the pulse durations. Itis also limited by the jitter of the delay, ∆t, due to the fluctuations arising from the SASEprocess and various influences in the accelerator environment. Even with direct seeding oroptical synchronization methods, a residual jitter is expected. A solution is to measure ∆tdirectly at the experimental station and simultaneously to the experiment.
6 CHAPTER 1. INTRODUCTION
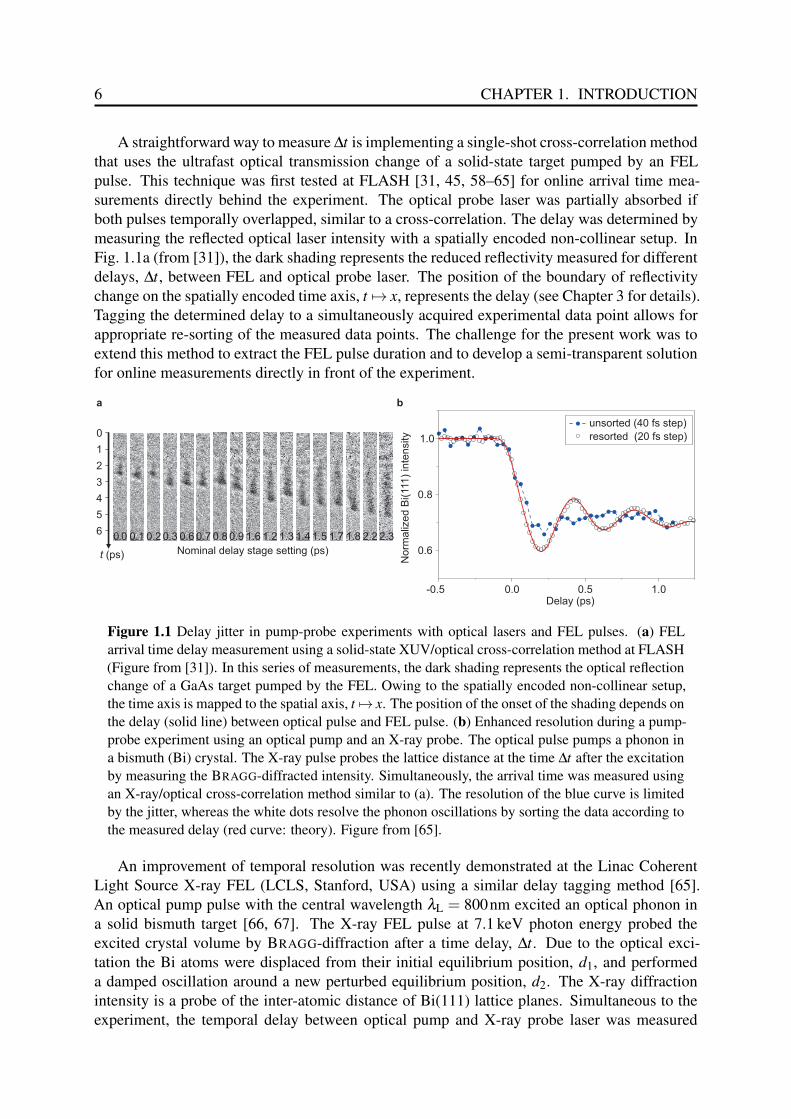
A straightforward way to measure ∆t is implementing a single-shot cross-correlation methodthat uses the ultrafast optical transmission change of a solid-state target pumped by an FELpulse. This technique was first tested at FLASH [31, 45, 58–65] for online arrival time mea-surements directly behind the experiment. The optical probe laser was partially absorbed ifboth pulses temporally overlapped, similar to a cross-correlation. The delay was determined bymeasuring the reflected optical laser intensity with a spatially encoded non-collinear setup. InFig. 1.1a (from [31]), the dark shading represents the reduced reflectivity measured for differentdelays, ∆t, between FEL and optical probe laser. The position of the boundary of reflectivitychange on the spatially encoded time axis, t 7→ x, represents the delay (see Chapter 3 for details).Tagging the determined delay to a simultaneously acquired experimental data point allows forappropriate re-sorting of the measured data points. The challenge for the present work was toextend this method to extract the FEL pulse duration and to develop a semi-transparent solutionfor online measurements directly in front of the experiment.
0.6
0.8
1.0
-0.5
No
rma
lize
d B
i(111
) in
ten
sity
Delay (ps)
unsorted (40 fs step)
resorted (20 fs step)
0.0 0.5 1.0
ba
(ps)t
0
1
2
3
4
5
6
Nominal delay stage setting (ps)
0.0 0.1 0.2 0.3 0.6 0.7 0.8 0.9 1.6 1.2 1.3 1.4 1.5 1.7 1.8 2.2 2.3
Figure 1.1 Delay jitter in pump-probe experiments with optical lasers and FEL pulses. (a) FELarrival time delay measurement using a solid-state XUV/optical cross-correlation method at FLASH(Figure from [31]). In this series of measurements, the dark shading represents the optical reflectionchange of a GaAs target pumped by the FEL. Owing to the spatially encoded non-collinear setup,the time axis is mapped to the spatial axis, t 7→ x. The position of the onset of the shading depends onthe delay (solid line) between optical pulse and FEL pulse. (b) Enhanced resolution during a pump-probe experiment using an optical pump and an X-ray probe. The optical pulse pumps a phonon ina bismuth (Bi) crystal. The X-ray pulse probes the lattice distance at the time ∆t after the excitationby measuring the BRAGG-diffracted intensity. Simultaneously, the arrival time was measured usingan X-ray/optical cross-correlation method similar to (a). The resolution of the blue curve is limitedby the jitter, whereas the white dots resolve the phonon oscillations by sorting the data according tothe measured delay (red curve: theory). Figure from [65].
An improvement of temporal resolution was recently demonstrated at the Linac CoherentLight Source X-ray FEL (LCLS, Stanford, USA) using a similar delay tagging method [65].An optical pump pulse with the central wavelength λL = 800nm excited an optical phonon ina solid bismuth target [66, 67]. The X-ray FEL pulse at 7.1 keV photon energy probed theexcited crystal volume by BRAGG-diffraction after a time delay, ∆t. Due to the optical exci-tation the Bi atoms were displaced from their initial equilibrium position, d1, and performeda damped oscillation around a new perturbed equilibrium position, d2. The X-ray diffractionintensity is a probe of the inter-atomic distance of Bi(111) lattice planes. Simultaneous to theexperiment, the temporal delay between optical pump and X-ray probe laser was measured
CHAPTER 1. INTRODUCTION 7
by a cross-correlation on a solid-state target, as explained before. The measurement is shownin Fig. 1.1b. The first measurement was performed without simultaneous delay measurement(blue dotted curve). Although the transition between the equilibrium positions was traced, theoscillations were not resolved, because the temporal resolution was limited by the large delayjitter. In comparison, the white-dotted curve was achieved by simultaneously measuring the X-ray/optical cross-correlation and sorting the data points according to their respective delay. Thetemporal resolution could be increased to the sub-10 fs range [65], demonstrating the potentialof this cross-correlation method. However, in the X-ray regime, the implementation benefitsfrom the low target absorption. In comparison, such a simultaneous cross-correlation measure-ment suffers from the strong target absorption in the XUV regime. In the present work, thefeasibility for such simultaneous measurements was demonstrated at FLASH using ultra-thinsilicon nitride membranes pumped at an FEL wavelength of 5.5 nm.
1.3 Present and future scenario for FLASHIn the present scenario, most XUV and X-ray FELs are operated in SASE mode. A typicalSASE FEL layout is shown in Fig. 1.2a. Because the FEL pulses are amplified from a statisticalshot noise in the undulator section, the pulse properties vary from shot to shot. This affects notonly the pulse energy and spatial beam properties, but in particular also the spectral and tempo-ral properties of the pulse. In addition, due to the amplification of multiple longitudinal modes,the resulting pulse structure of SASE FELs can be very complicated [41]. As a consequence,the intensity envelope may consist of multiple sub-pulses that fluctuate from shot to shot. InFig. 1.2c, a theoretical simulation of the temporal profile is shown (from [1]) to demonstratethe shot-to-shot fluctuations in SASE mode. Here, three different single-shot profiles were ob-tained (thin lines), each featuring three longitudinal modes. The mean pulse duration (solidline) is 10 fs and yields P = 3 GW of optical power. The most intense single pulse has a pulseduration of less than 5 fs and a power exceeding 10 GW.
Due to the shot-to-shot fluctuations of SASE FELs, a single-shot temporal diagnostic methodat the experimental station is indispensable. In Fig. 1.2b, a possible scenario is described on howa high repetition rate XUV FEL, such as FLASH, may look in the future. The general schematicis similar to the SASE FEL (Fig. 1.2a). At the experimental station, before or behind the ex-periment, the single-shot cross-correlator developed in this work may be implemented as anonline diagnostic tool. The arrival time and the pulse duration of each FEL pulse in the burstcan be measured with a fraction of the burst-mode optical parametric chirped-pulse amplifier(OPCPA), which is also part of this work, and tagged to the corresponding experimental datapoint. The burst-mode OPCPA pump-probe laser in the experimental hall provides the exper-iment with mJ-level optical pulses with pulse durations down to sub-10 fs. The combinationof cross-correlator and OPCPA allows for time-resolved studies with unprecedented resolution.The temporal synchronization of the laser systems can be realized electronically using opticalfiber links locked to a master laser oscillator [32]. This type of synchronization is currently be-ing installed at FLASH. In this future scenario, the FEL is externally seeded via HGHG [7, 68]at high burst repetition rate with intense ultraviolet (UV) pulses from the seeding OPCPA. Thisallows the generation of fully coherent XUV pulses, improving the temporal and spectral sta-bility for FEL experiments. Furthermore, the direct synchronization to the pump-probe OPCPAmay be possible using a fraction of the seeding laser. The HGHG seeding scheme has been suc-cessfully implemented for user operation at the low repetition rate XUV FEL FERMI@Elettra

8 CHAPTER 1. INTRODUCTION
injectorlaser
experim.hall
synchronization
mod. radiator onlinediag.
PPlaser
seedinglaser
seedingsource
chicane
direct optical synchronization
injectorlaser
experim. hallLINAC undulator section
0
2
4
6
8
10
12 Erad
P(G
W)
t (fs)
= 40 Jμ
10 20 30 40 50
a
c
λu
OPCPA OPCPA
1.2
1.0
0.8
0.6
0.4
FE
Lin
tensity (
a.u
.)
0.2
0.038.35
38.25
38.15
38.05 0
Photon energy (eV)100
200300
400
FEL shot (no.)
500
b
d
SASE FEL
HGHG-seeded FEL
LINAC
Figure 1.2 Present and future status of extreme-ultraviolet (XUV) free-electron lasers (FELs).(a) Present status: schematic of a self-amplified spontaneous emission (SASE) FEL. Injector laser:generation of ultrashort electron bunches on a photocathode. LINAC: linear electron accelerator.Undulator section: alternating magnetic field with period λu for emission of radiation. Experimen-tal hall: Beam transportation, beam diagnostics, pump-probe laser, experimental setups. (b) Futurescenario: high gain harmonic generation (HGHG) seeding of the FEL [7, 68] at the full repeti-tion rate, using a burst-mode optical parametric chirped-pulse amplifier (OPCPA) as seeding laser(highlighted). The generated ultraviolet (UV) pulses (seeding source) are coupled into the modula-tor for HGHG seeding. The temporal pulse properties are monitored with an online XUV/opticalcross-correlator (online diag., highlighted). In the experimental hall, a burst-mode OPCPA providessub-10 fs pump-probe pulses with mJ pulse energies. The pump-probe laser (highlighted) couldbe directly synchronized with a fraction of the seeding laser. Commonly, the synchronization isachieved by electronic locking of all lasers. (c) Theoretical simulation of single-shot SASE pulses(thin lines). The temporal evolution of the optical power, P, is plotted. The averaged profile (thickline) features a pulse duration of 10 fs. From [1]. (d) Series of single-shot spectra measured at theHGHG-seeded FEL FERMI@Elettra. From [7].
CHAPTER 1. INTRODUCTION 9
in Trieste, Italy [7]. The measurement in Fig. 1.2d shows 500 stable single-shot spectra of theseeded FERMI FEL lasing at the 7th harmonic at 38.2 nm [7]. Due to the lack of adequatesingle-shot temporal diagnostic methods at current free-electron lasers, the temporal shape ofthe seeded pulses is still not measurable.
In summary, the improvements will enable pump-probe experiments with increased tempo-ral resolution and high pulse repetition rate at FLASH and future FELs. With the seeding andthe temporal diagnostics, intense XUV and X-ray pulses with full control over the temporalpulse properties will be possible.
1.4 Thesis outlineThe contribution of this thesis to the outlined problems and possible improvements in FEL sci-ence comprises the development of an XUV and X-ray single-shot temporal diagnostic methodand a prototype of a high-power laser amplifier for future application as seeding laser and pump-probe laser at FLASH. The thesis is subdivided in three main chapters, addressing these pointsseparately:
• Chapter 2: Theoretical Background. A brief overview about the principle of free-electron lasers and different seeding schemes is given. The theoretical background forultrashort pulse propagation and nonlinear phenomena is treated. In particular, the broad-band optical parametric amplification with non-collinear phase-matching is discussed asthe method of choice for the development of the high-power laser amplifiers. In order toprovide the theoretical fundamentals for the FEL pulse duration measurement technique,the ionization dynamics in solids irradiated with XUV and X-ray pulses are explainedin detail. An overview about optical pulse duration measurement techniques, such ascross-correlation and autocorrelation, is given at the end of the chapter.
• Chapter 3: Single-shot pulse duration measurements at XUV and X-ray free-electronlasers. In the main chapter, an overview about existing pulse duration measurement meth-ods is given. Subsequently, the key results of this work are presented: a method forFEL pulse duration measurement was further developed, based on a single-shot cross-correlation between the FEL and the optical laser pulse on a solid-state target [2, 31, 45,60–65]. With this method, the FEL pulse duration and the arrival time can be determinedwithin a single shot. Furthermore, the possible application as an online tool is shown.Afterwards, a theoretical evaluation of the resolution limit is performed, including theinfluence of the signal-to-noise ratio. For increasing the temporal resolution of the cross-correlation method, a dedicated ultrashort laser amplifier is presented.
• Chapter 4: Development of a high repetition rate laser amplifier. For the applicationsas high-repetition rate pump-probe laser and seeding laser at FLASH, the development ofa burst-mode, mJ-class, broadband optical parametric chirped-pulse amplifier (OPCPA)is required. In this chapter, the demands on the laser systems are defined in detail andthe concepts of chirped-pulse amplification and OPCPA are reviewed. Experimental re-sults on a first burst-mode OPCPA prototype system are presented. To ensure reliablelong-term stability of such high-power OPCPAs, a novel passive pump-to-signal synchro-nization technique for OPCPA was developed. The method relies on white-light supercon-

10 CHAPTER 1. INTRODUCTION
tinuum generation. In the end of the chapter, the scaling prospects for kilowatt-pumpedhigh-power OPCPAs are theoretically investigated.

Chapter 2
Theoretical background
2.1 Principle of free-electron lasersExtreme ultraviolet (XUV) and X-ray free-electron lasers (FELs) are operated as single-pass,high-gain FELs, mostly in self-amplified spontaneous emission (SASE) mode [69, 70]. Thebasic principle of a SASE FEL, such as FLASH, is illustrated in Fig. 1.2a on p. 8. Initially, anultrashort pulse of electrons, hereafter referred to as an electron bunch, is generated by focusingan ultrashort laser pulse on a photocathode1 (injector laser) [71]. This electron bunch is injectedto a microwave-driven LINAC and accelerated to relativistic kinetic energies in the GeV regime.In order to keep the bunch short, temporal compression is introduced by magnetic chicanes. Theradiation emission is achieved in the undulator, a periodic structure of transverse magnetic fieldswith alternating poles. The emission wavelength is given by the resonance condition [69, 70],
λFEL =λu
2γ2
(1+
K2
2+ γ2Θ2
), (2.1)
where λu is the undulator period, γ = (Ekin +mec2)/(mec2) represents the kinetic energy of therelativistic electron, c is the vacuum speed of light, me is the rest mass of the electron and Θ isthe divergence angle in the laboratory frame. Characteristic parameters are the undulator period,λu, and the undulator parameter,
K =eB0λu
2πmec, (2.2)
where e is the elementary charge and B0 is the maximum magnetic field strength. In this initialphase of SASE, the spontaneously emitted electric field (shot noise) couples to the electronbunch, which leads to a periodic longitudinal density modulation with a period of λFEL, calledmicro-bunching2 [69, 70]. Electron micro-bunches separated by λFEL radiate in phase. Thismodulation effect increases quadratically over the propagation distance. The larger fractionof the electron bunch coherently emits a short pulse [69, 70]. As the shot noise is emittedspontaneously, the final pulse properties vary from shot to shot. This affects not only the pulseenergy and spatial beam properties, but in particular also the spectral and temporal properties of
1At FLASH, a highly efficient Cs2Te photocathode is placed at the back plane of a radio-frequency accelerationcavity
2More precisely, micro-bunching is a result of energy dispersion in the undulator. The electric field imprints anenergy modulation on the bunch, depending on the relative phase between electrons and electric field. Owing toenergy dispersion in the undulator, this energy modulation is converted into a density modulation.
11

12 CHAPTER 2. THEORETICAL BACKGROUND
the pulse. In general, a multitude of micro-bunched regions is generated, depending on the ratiobetween λFEL and the electron bunch length. This leads to the radiation of multiple longitudinalmodes, spatially and spectrally separated, with no defined phase relation between them. Dueto this limited longitudinal coherence, the resulting pulse structure of SASE FELs can be verycomplicated. The intensity envelope may consist of multiple sub-pulses that fluctuate from shotto shot.
Seeding of the FEL enables the generation of controllable, temporally coherent pulses withenhanced pulse-to-pulse stability. The modulation of the electron bunch is achieved by anexternal laser pulse in the undulator, rather than by the stochastic shot noise. This can be realizedusing several schemes. In the direct seeding scheme, the FEL is seeded directly at its emissionwavelength, λseed = λFEL [72, 73]. The same undulator section as in SASE operation can beused. The FEL can be viewed as an amplifier for the seeding pulse, which is generated by higher-harmonic generation (HHG) using ultrashort laser pulses. The attainable FEL wavelength rangeis limited by the available seed laser sources and seed power in the required wavelength regime.At FLASH, an efficient HHG dual gas target was developed to achieve intense XUV pulses inthe λseed = 60 . . .10nm wavelength range [74–76].
In the high-gain harmonic generation (HGHG) scheme, the FEL is seeded at higher wave-lengths in the ultraviolet (UV), where more optical power can be obtained [7, 68]. The seedwavelength is a sub-harmonic of the FEL wavelength, λseed = q ·λFEL . The undulator sectionis different compared to the SASE undulators (compare Fig. 1.2a). For HGHG seeding at XUVFELs, UV laser pulses are first coupled in a modulator (a short undulator) for energy modula-tion of the electron bunch. The modulated electron bunch is sent through a magnetic dispersivechicane. The energy modulation is projected into a density modulation with the period λseed.Finally, the density-modulated bunch passes the radiator (a long undulator), which is tuned tothe higher harmonic of the seeding wavelength, λFEL = λseed/q, where q ≈ 4 . . .15 is the har-monic number. This scheme can be cascaded for reaching even shorter wavelengths down to thesoft-X-ray region. An alternative approach, to circumvent multiple HGHG cascades, is the echo-enabled harmonic generation (EEHG) scheme [77]. The EEHG scheme requires an additionalmodulator, a second seed laser pulse and a second dispersive chicane, after the first modulatorand the first chicane, and before the radiator. After the second modulator and chicane, a veryefficient density modulation at the higher harmonic can be achieved, λFEL = λseed/q.
In a passive seeding approach, the FEL is seeded by SASE radiation. After SASE in a firstundulator section, the electron bunch passes a magnetic chicane, whilst the SASE pulse is spec-trally filtered in a single-crystal diamond monochromator. The filtered pulse seeds the bunchin a second undulator section. This seeding scheme, referred to as self-seeding, is favorablefor X-ray FELs, where no external seeding sources are available. Self-seeding increases thelongitudinal coherence and reduces the spectral bandwidth, leading to improved spectral bright-ness and spectral stability. The implementation of self-seeding for XUV FELs is more difficult,because the long beam path in the complex grating monochromator needs to be compensatedby a large magnetic chicane.
2.2 Propagation of ultrashort pulsesIn classical electrodynamics, the propagation of light is described by the coupling of electricand magnetic fields, E and H, respectively. James Clerk MAXWELL formulated the accordingsystem of differential equations, the MAXWELL-equations [78]. In this system, the light-matter
CHAPTER 2. THEORETICAL BACKGROUND 13
interaction is treated purely phenomenologically in terms of polarization and magnetization ofthe medium, P and M, respectively, and under the presence of external charges and currents.In this context, ultrashort light pulses are described as electric field wave packets that representsolutions to a proper wave equation, obtained from the coupled system of MAXWELLs equations[79]. In the case of non-magnetic isotropic media (and under absence of external charges andcurrents) with a linearly polarized electric field propagating as plane wave along the propagationaxis, z, the one-dimensional scalar wave equation is obtained:(
∂ 2
∂ z2 −1c2
∂ 2
∂ t2
)E(z, t) = µ0
∂ 2
∂ t2 P(z, t), (2.3)
where c = 2.99 · 108 ms−1 is the vacuum speed of light, and µ0 = 4π · 10−7 VsA−1m−1 is thevacuum permeability. On the right-hand side, the polarization, P(z, t) acts as a source termfor radiation and describes the response of the medium under presence of an electric field. Ingeneral, this response has a finite duration, which has consequences on the absorption anddispersion properties of the medium. In the frequency domain, the polarization is expressed as
P(ω,z) = ε0
[χ(1)(ω) ·E(ω ,z)+PNL(χ(n)(ω)En(ω,z))
](2.4)
where ε0 = 8.854 ·10−12 Fm−1 is the vacuum permittivity, and χ(1)(ω) is the linear susceptibil-ity, which is the linear response of the medium. The nonlinear response is summarized in thenonlinear polarization term PNL(χ(n)(ω)En(ω ,z)). While the nonlinear polarization is treatedin Section 2.4.1, it is neglected here to point out the effect of linear optical elements on thepropagation of ultrashort light pulses. The linear part of the polarization is
PL(ω,z) = ε0 [ε(ω)−1]E(ω ,z), (2.5)
with the frequency-dependent relative permittivity of the medium,
ε(ω) =[1+χ(1)(ω)
]. (2.6)
The linear propagation of ultrashort pulses is commonly described in the frequency domain.Hence, the corresponding wave equation is obtained by Fourier-transformation of Eq. (2.3).Making use of the relation ∂/∂ t → iω and Eq. (2.5) yields:[
∂ 2
∂ z2 +µ0ω2ε(ω)
]E(ω,z) = 0. (2.7)
The general solution to Eq. (2.7) is
E(ω,z) = |E(ω,0)|ei(ω t−k(ω)z), (2.8)
where |E(ω,0)| is the spectral amplitude, and k(ω) is the propagation constant with the disper-sion relation
k2(ω) = ω2ε(ω)µ0 =ω2
c2 ε(ω). (2.9)
A one-dimensional ultrashort optical pulse, E(t,z), is represented as a wave packet, i.e. a co-herent superposition of plane waves of different frequencies, ω . In the frequency domain an

14 CHAPTER 2. THEORETICAL BACKGROUND
ultrashort pulse is completely described by its spectral amplitude, |E(ω ,0)|, and its spectralphase,
φ(ω) = ω t − k(ω)z. (2.10)
The temporal representation of the wave packet is obtained by FOURIER-transformation,
E(t,z) =1π
∫ +∞
−∞|E(ω,0)|ei(ω t−k(ω)z)dω . (2.11)
A linear phase, φ(ω) = ω t, leads to a constructive superposition of all spectral componentsin the time domain. This yields the shortest possible wave packet, commonly referred to theFOURIER-limited (FL) pulse, oscillating at a frequency, ωc, referred to as the carrier frequency.A defined phase relation between the spectral components is essential. A random phase yieldsonly a random electric field in the time domain, rather than a confined pulse. In contrast, aquadratic phase,
φ(ω) =β2
2(ω −ωc)
2 , (2.12)
leads to a confined pulse in the temporal domain, which is temporally stretched, as compared tothe FL pulse. Further, this leads to a time-dependent variation of the instantaneous frequency,ω = ω(t), a so-called chirp. Here, β2 is the group-delay dispersion (GDD), expressed in
[fs2].
The GDD is a common figure-of-merit to quantify the chirp of an ultrashort pulse. Its physicalmeaning clarifies considering the pulse propagation through an optical material (see Section2.3). In analogy, around the carrier frequency, ωc, higher-order phase coefficients are definedby expanding the phase,
φ(ω)|ωc= φ(ωc)+
N
∑n=1
βn
n!(ω −ωc)
n , (2.13)
withβn = d(n)φ(ω)/dφ(ω)(n)
∣∣∣ωc. (2.14)
In order to study the influence of quadratic and cubic phase terms on the temporal pulse shape,a FOURIER-transformation was carried out (Eq. (2.11)) using a GAUSSIAN spectrum (Fig. 2.1a,grey) and the corresponding phase (dashed lines). The constant phase (black dashed) yieldsthe FOURIER-limited (FL) pulse shape with a pulse duration of 9.2 fs full width at half maxi-mum (FWHM), as shown in Fig. 2.1b for the intensity (black) and the electric field (red). Thequadratic phase (blue dashed) with a GDD of β2 = 40fs2 introduces broadening and chirp(Fig. 2.1c), whereas the cubic phase with a third-order dispersion coefficient (TOD) of β3 =720fs2 leads to an asymmetric pulse broadening with multiple satellite pulses (Fig. 2.1d).
The optical pulse in the time domain is described by an envelope function for the amplitude,A(t,z), and an oscillation term, ei(ω t−k(ω)z), according to
E(t,z) =12
A(t,z)ei(ω t−k(ω)z)+ c.c.. (2.15)
In order to obtain a first-order propagation equation from the second-order wave-equation (Eq.2.3), the slowly-varying envelope approximation (SVEA) is applied, which is valid, if∣∣∣∣ d2
dz2 A(t,z)∣∣∣∣≪ ∣∣∣∣k(ωc)
ddz
A(t,z)∣∣∣∣ and
∣∣∣∣ d2
dt2 A(t,z)∣∣∣∣≪ ∣∣∣∣ωc
ddt
A(t,z)∣∣∣∣ (2.16)

CHAPTER 2. THEORETICAL BACKGROUND 15
2.2
inte
nsity (
),(a
.u.)
It
el. fie
ld(
)E
t
time (fs)t
spectr
al in
tensity (
) (a
.u.)
Iω
angular frequency (PHz)ω
a b
-1.0
-0.5
0.0
0.5
1.0
intensity
intensity
el. field
el. field
-20
-10
0
10
20
FL
GDD
TOD
phase
()
(rad)
φω
0.0
0.2
0.4
0.6
0.8
1.0spectrum
2.4 2.6 2.8 3.02.01.8 0 20 40-40 -20
time (fs)t
0 20 40-40 -20
time (fs)t
0 20 40-40 -20
inte
nsity (
),(a
.u.)
It
el. fie
ld(
)E
t
-1.0
-0.5
0.0
0.5
1.0
inte
nsity (
),(a
.u.)
It
el. fie
ld(
)E
t
-1.0
-0.5
0.0
0.5
1.0c d
FL
GDD = 40 fs² TOD = 720 fs³intensity
el. field
Figure 2.1 Influence of the higher-order dispersion on the pulse shape of a 9.2 fs pulse. (a) Spectralintensity (grey), spectral phase of a FOURIER-limited pulse (FL, black), quadratic spectral phase,β2 = 40fs2 (GDD, blue), cubic spectral phase, β3 = 720fs3 (third-order dispersion, TOD, red). (b)-(d) Corresponding calculated temporal intensities (black) and electric fields (red), see legends. Thequadratic phase leads to a pulse broadening and a linear frequency chirp (a). The cubic phaseintroduces asymmetric broadening and satellite pulses (d).

16 CHAPTER 2. THEORETICAL BACKGROUND
The envelope is considered to change only very slowly compared to the carrier frequency dur-ing the propagation. Thus, the slowly evolving pulse envelope, A(t,z), is split from the rapidoscillation. In vacuum, the SVEA yields[
k(ωc)∂∂ z
+µ0ωcε(ωc)∂∂ t
]A(t,z) = 0. (2.17)
Even though it is mathematically correct to describe a pulse with only a few optical cycles usingthe SVEA, it should be carefully checked for the particular problem whether the approximationdescribes the correct propagation behavior during light-matter interaction.
2.3 DispersionDuring the propagation over a distance, z = l through a material, the pulse properties changein the temporal domain, as the spectral phase accumulates according to ∆φ(ω) = k(ω) · l. Theamount of accumulated phase is different for different spectral components. In the dispersionrelation, k(ω) (Eq. (2.9)), the relative permittivity, ε(ω), is frequency-dependent. The phys-ical meaning of the phase change becomes clear by developing the propagation constant in aTAYLOR-series around the carrier frequency,
k(ω)|ωc= k(ωc)+
dkdω
∣∣∣∣ωc
(ω −ωc)+12
d2kdω2
∣∣∣∣ωc
(ω −ωc)2 + . . . (2.18)
The first term is related to the phase velocity, vph, at ωc within the material:
1vph
=k(ωc)
ωc(2.19)
The first-order derivative describes the group velocity, vG, i.e. the speed of the wave packetwithin the material,
1vG
=dkdω
∣∣∣∣ωc
. (2.20)
From the group velocity, we can calculate the temporal shift of the pulse, thus the group delay(GD). It corresponds to the first derivative of the phase,
TG = t − zvG
= t − dkdω
· z
=dφ(ω)
dω.
(2.21)
The second-order term is related to the group velocity dispersion (GVD). Multiplied by thepropagation distance, z, the group delay dispersion (GDD)is obtained, which was introduced inSection 2.2. It equals the second derivative of the optical phase,
dkdω
· z = dTG
dω
=d2φ(ω)
dω2
= β2.
(2.22)
CHAPTER 2. THEORETICAL BACKGROUND 17
If a pulse propagates through a dispersive medium with β2 = 0, different frequency componentswill propagate with different group velocities. In the temporal domain, this leads to a chirp, asdescribed in Section 2.2. The GDD is a common figure-of-merit to quantify the chirp of anultrashort pulse. In analogy, the higher-order phase terms are defined according to Eq. 2.14.In particular for ultrashort pulses in a complex optical system, such as a laser amplifier, thedispersion introduced by each optical element needs to be carefully taken into account in orderto achieve a proper pulse compression as close to the FL as possible.

18 CHAPTER 2. THEORETICAL BACKGROUND
2.4 Nonlinear optical phenomenaHigh peak intensities can be reached with ultrashort pulses. The response of matter to the cor-responding strong electric field can become nonlinear. The field of nonlinear optics includes agreat variety of phenomena, governed either by electronic responses or by phononic responses,i.e. response of the crystal lattice. Electronic responses that do not change the quantum me-chanical state of the material are referred to as parametric processes. Classically, the electronsare perturbed within the atomic potential by the driving force of the electric field. This inducesa polarization, P, which acts as a source term for radiation in the wave equation (see Eq. (2.7)),resulting for example in frequency mixing and self-phase modulation. However, electronic ef-fects exist that change the quantum mechanical state of matter, such as saturable absorption,multiphoton absorption or above-threshold ionization. In this section, first the second-orderprocesses are introduced by means of the optical parametric amplification (OPA) and the non-collinear phase-matching for broadband OPA is described. Further, the basic third-order pro-cesses, self-focusing and self-phase-modulation are explained, followed by white-light super-continuum generation, which includes also nonlinear ionization phenomena.
Parametric processes are treated as instantaneous, which means that the response time ismuch shorter one optical cycle of the electric field. If the electric field strength is on the orderof the characteristic atomic electric field strength, Eat ≈ 5 ·1011 Vm−1, the higher-order contri-butions in the general description of the polarization (Eq. 2.4) are no longer negligible [80],
PNL(ω,z) = ε0
[χ(2)E2(ω ,z)+χ(3)E3(ω,z)+ · · ·
], (2.23)
where χ(2) and χ(3) denote the second- and third-order susceptibilities. Generally, E and P aretreated as vectors. The susceptibilities, χ(n), appear as (n+1)-th rank tensors.
2.4.1 Optical parametric amplificationOptical parametric amplification (OPA) is a second-order mixing processes, where two lightwaves interact in a medium with non-vanishing χ(2). Let us consider the interaction of twolight waves,
Em = Em,0eiωPt−k(ωP)z +Em,0eiωst−k(ωs)z, (2.24)
with different carrier frequencies, ωp and ωs. The nonlinear coupling of the vector componentsof the electric field, Em, to the vector components of the nonlinear polarization, Pl , is describedby3
P(2)l = ε0
3
∑m=1
3
∑n=1
χ(2)lmnEmEn, (2.25)
where χ(2)lmn is the second-order susceptibility tensor element. The interaction of two light waves
leads to the generation of new frequency components in the second-order polarization. Thismodulated polarization is the source of new electro-magnetic waves oscillating at the sum-frequency, ωp +ωs (SFG), and the difference-frequency, ωp −ωs (DFG). Further, a constantterm occurs, referred to as optical rectification with ω = 0.
3provided that KLEINMAN’s-symmetry is valid, which is typically the case for optical frequencies that aresmaller than the resonance frequency of the material [80].

CHAPTER 2. THEORETICAL BACKGROUND 19
Optical parametric amplification (OPA) is a special case of DFG, where an idler wave atωid is generated by mixing a pump wave and a signal wave, resulting in ωid = ωp −ωs. Oncethe idler wave is present in the medium, it again mixes with the pump field to generate a signalwave, ωs = ωp −ωid. The mixing continues as idler and signal generate a pump wave. Allfrequencies generated in this interaction obey the energy conservation law, ωp = ωid +ωs. InOPA, the signal and idler waves are amplified by transferring energy from the pump wave to thesignal and idler. For a coherent buildup of the signal and idler amplitudes, the phase velocitiesof all involved waves have to be matched, according to momentum conservation. This meansthat the wave vectors fulfill the phase-matching condition,
kp = ks +kid. (2.26)
Accordingly, the phase-mismatch is defined as ∆k = kp −ks −kid. During the propagation, theamplitudes are enhanced until the accumulated phase of the waves reaches |∆k| · z = ∆k · z = π .Then, the energy flow reverses back to the pump.
For a certain phase-matching condition, for example for linear polarization of the electricfield, and at a particular interaction geometry, the tensor-description can be reduced to a scalardescription. Owing to a certain symmetry of the nonlinear crystal, an effective nonlinear opticalcoefficient, deff, can be defined. For example, in β -barium borate (BBO) with type I phasematching condition (parallel polarizations of the signal and idler waves), it can be expressed as
deff = d31 sinθ −d22 cosθ sin(3ϕ), (2.27)
where dl p =12 χ(2)
lmn is a reduced notation for the nonlinear coefficient4 [80]. If signal and idlerwaves have orthogonal polarization (type II phase matching condition), the expression gives
deff = d22 cos2 θ cos(3ϕ), (2.28)
The angle θ denotes the angle between the wave-vector and the crystal’s optical axis, the angleϕ denotes the azimuthal angle between the electric field vector (polarization direction) and theprincipal plane spanned by the wave-vector and the optical axis of the crystal.
With these symmetry considerations and the SVEA (Eq. 2.16), the energy transfer betweenthe three waves in OPA can be described by the nonlinear coupled equations [81, 82],
dAs
dz= i
ωsdeff
n(ωs)cA∗
idApei∆kz,
dAid
dz= i
ωiddeff
n(ωid)cA∗
s Apei∆kz,
dAp
dz= i
ωpdeff
n(ωp)cAsAide−i∆kz,
(2.29)
where As, Aid and Ap are the complex amplitudes of the signal, idler and pump wave, and n(ω)denotes the refractive index. This coupled system of one-dimensional first-order differentialequations is derived by solving the wave equation (Eq. (2.1)) using the SVEA The analyti-cal solution is given by JACOBI elliptic functions [83], neglecting dispersion and higher-ordernonlinear effects. Alternatively, it can be calculated by numerical methods.
4KLEINMAN’s symmetry with mn → p prescription [80]
20 CHAPTER 2. THEORETICAL BACKGROUND
For a more descriptive analysis, commonly the undepleted pump approximation is used,where the system of equations is reduced to a homogeneous second-order differential equationby assuming dAp/dz = 0. In the nomenclature of laser physics, this corresponds to the small sig-nal gain regime. The parametric intensity gain after an interaction length L within the nonlinearcrystal yields
Gs(L) = 1+Γ2
g2 sinh2(gL), (2.30)
for the signal and
Gid(L) =ωid
ωs
Γ2
g2 sinh2(gL), (2.31)
for the idler, with
g =
√Γ2 −
(∆k2
)2
, (2.32)
and
Γ2 = d2eff
ωsωid∣∣Ap
∣∣2n(ωs)n(ωid)c2 . (2.33)
The signal intensity evolves according to
Is(L) = 2ε0cns|As(z = 0)|2Gs(L), (2.34)
the idler intensity evolves according to
Iid(L) = 2ε0cnid|As(z = 0)|2Gid(L), (2.35)
if zero initial idler intensity is assumed, Iid(z = 0) = 0.The evolution of the phases of signal, idler and pump is of particular interest, especially
in the case of ultrashort pulses. The expressions for the phases are obtained by solving theimaginary parts of Eqs. (2.29), as described in [84]:
φs(z) = φs(0)−∆kz2
+∆kγ2
s2
∫ dzf + γ2
s,
φid(z) = φp(0)−φs(z = 0)− π2− ∆kz
2,
φp(z) = φp(0)−∆k2
∫ f dz1− f
.
(2.36)
Here, γs is the input photon intensity ratio for the signal and f is the fractional depletion of thepump,
γ2s =
ωp
ωs
Is(0)Ip(0)
and f = 1−Ip(z)Ip(0)
. (2.37)
From these equations, important statements for OPA are derived: First, the signal phase isindependent from the pump phase. As a consequence, spatial phase aberrations of the pumpwavefront are not transferred to the signal wavefront and thus do not affect the spatial beamquality of the amplified beam. Furthermore, also the temporal phase is not transferred to thesignal, and a temporally chirped pump beam can be used. Second, parametric phase changesoccur only if a phase mismatch is present, ∆k = 0. The amount of phase change is larger for

CHAPTER 2. THEORETICAL BACKGROUND 21
large fractional pump depletion, 0 < f ≤ 1. Third, the idler phase depends only on the initialsignal and pump phase and the phase mismatch. The best conversion efficiency corresponds toa phase relationship, Θ = φp −φid −φs = −π/2. The initial idler phase self-adjusts to φid =φp(0)− φs(0) + π/2. After a certain propagation distance and at a certain degree of pumpdepletion, no more energy can be transferred to the signal and idler, Θ = 0. The energy flowsfrom signal and idler back to the pump for Θ > 0. The corresponding characteristic propagationlength is the coherence length,
lc =π∆k
. (2.38)
2.4.2 Phase-matching in nonlinear optical crystalsIn order to fulfill the phase-matching condition (Eq. (2.26)) of interacting waves in a nonlinearcrystal, several techniques have been developed. The quasi phase matching (QPM) techniquerelies on periodic modulation of deff along the propagation axis to keep the phase mismatch∆k < π . This can be achieved for example by periodic poling of ferroelectric crystals, such aslithium niobate (PPLN: periodically poled lithium niobate) [85]. Birefringent phase-matchingtechniques make use of the matching of the refractive-index ellipsoids for different interactingfrequencies at different polarizations. An overview about the different types of birefringence ofnonlinear crystals can be found in [86]. For example, for type-I phase-matching in a negativeuniaxial crystal, the extraordinary refractive index of the pump wave can be matched to the ordi-nary refractive index of the signal and idler waves, np(θ) = ns,id by tuning the phase-matchingangle θ . The refractive indices are related by
1ne(θ)2 =
sin2 θn2
e+
cos2 θn2
o(2.39)
Alternatively, non-critical phase matching can be achieved by utilizing thermally induced re-fractive index changes.
In the present work, a high spectral gain bandwidth is pursued that supports pulse durationsshorter than 10 fs. In general, broadband phase matching can be expressed by expanding thephase mismatch in a TAYLOR-series around a spectrally varying signal frequency, ∆ω =ω−ωc,
∆k|ωc= ∆k(ωc)+
∂∆k∂ω
∣∣∣∣ωc
∆ω +12
∂ 2∆k∂ω2
∣∣∣∣ωc
(∆ω)2 +O[(∆ω)3] . (2.40)
In order to achieve amplification for the maximum spectral bandwidth, all terms in Eq. (2.40)must vanish. The term ∆k(ωc) = |∆k| refers to a matching of the phase-velocities, as describedin Eq. (2.26). The first-order derivative corresponds to a matching of the group velocitiesof idler and signal, as will be shown below. Higher-order terms, O
[(∆ω)2], require a higher
degree of freedom in the phase-matching configuration, such as using angularly dispersed beamgeometries [84, 87]. The required group velocity matching can be achieved by introducing anon-collinear angle, α , between the pump and the signal wave vector. In Fig. 2.2, the wavevector diagram for non-collinear type I phase-matching is shown. In order to fulfill the phase-matching condition for different signal wave vectors, ks +dks, the idler and the signal form theangle Ω. The relation between the phase-matching angle, θ , and the non-collinear angle, α , isobtained by applying the cosine rule,
k2p = k2
s + k2id −2kskid cosα , (2.41)

22 CHAPTER 2. THEORETICAL BACKGROUND
Sp
kp
ks kidoptical a
xis
θα
ρz
y
dks
dkidΩ
Sp
kp
ks
optical a
xis
θ
αρz
y
a bTPM PVWC
Figure 2.2 Non-collinear phase-matching geometry for broadband OPA. (a) In the chosen interac-tion plane within a negative uniaxial crystal (e.g. the xy-plane), the extraordinarily polarized pumpwave vector, kp (green), forms the phase-matching angle, θ , with respect to the optical axis. Owingto the birefringence, the pump wave vector is adjustable by rotating the crystal, kp = kp(θ). The or-dinarily polarized signal wave vector, ks, forms the non-collinear angle, α , with respect to the pumpwave vector. For a broadband signal with ks+dks, the idler wave vectors, kid+dkid, self-adjust in or-der to fulfill the momentum conservation condition and form the angle Ω. Thus, the generated idlerbeam is spatially dispersed. The pump wave vector forms the POYNTING-vector walk-off angle, ρ ,with respect to the POYNTING-vector, SP, indicating the direction of the energy flow. The presentedgeometry, with a signal angle of θ −α with respect to the optical axis, is referred to as tangentialphase-matching (TPM), (b) POYNTING-vector walk-off compensation (PVWC) scheme with θ +α .The idler wave-vector is not shown.
with the extraordinarily polarized pump, kp =ωpc np(θ) (Eq. 2.39). The variation of the signal
wave vector is addressed by the derivative
∂∂ks
[2kpks(1− cosα) = k2
id − (kp − ks)2] ,
2kp(1− cosα) = 2kid∂kid
∂ks+2(kp − ks)(
∂kp
∂ks−1).
(2.42)
From the energy conservation, we obtain ∂ωid/∂ωs =−1. Thus, the term,
∂kid
∂ks=− ∂kid
∂ωid
(∂ks
∂ωs
)−1
=−vG,i
vG,s, (2.43)
expresses the group velocities of the signal and the idler. Combining Eqs. (2.41) and (2.42)yields the group velocity matching in non-collinear geometry [88]:
vG,s = vG,i cosΩ. (2.44)
For a fixed geometry of the signal and the pump, the idler wave vector will be angularly dis-persed. Equation (2.44) can be equally expressed as [89]
Ω = sin−1(
kp
kidcosα
). (2.45)
Non-collinear OPA can be implemented in two geometries: Tangential phase-matching(TPM) and POYNTING-vector walk-off compensation scheme (PVWC). TPM is achieved ifthe signal travels with an angle θ −α (with respect to the optical axis), the different directionsof the POYNTING-vectors of the pump and the signal wave will lead to a spatial walk-off effect,i.e. the different directions of the energy flows will loose their spatial overlap after a certain
CHAPTER 2. THEORETICAL BACKGROUND 23
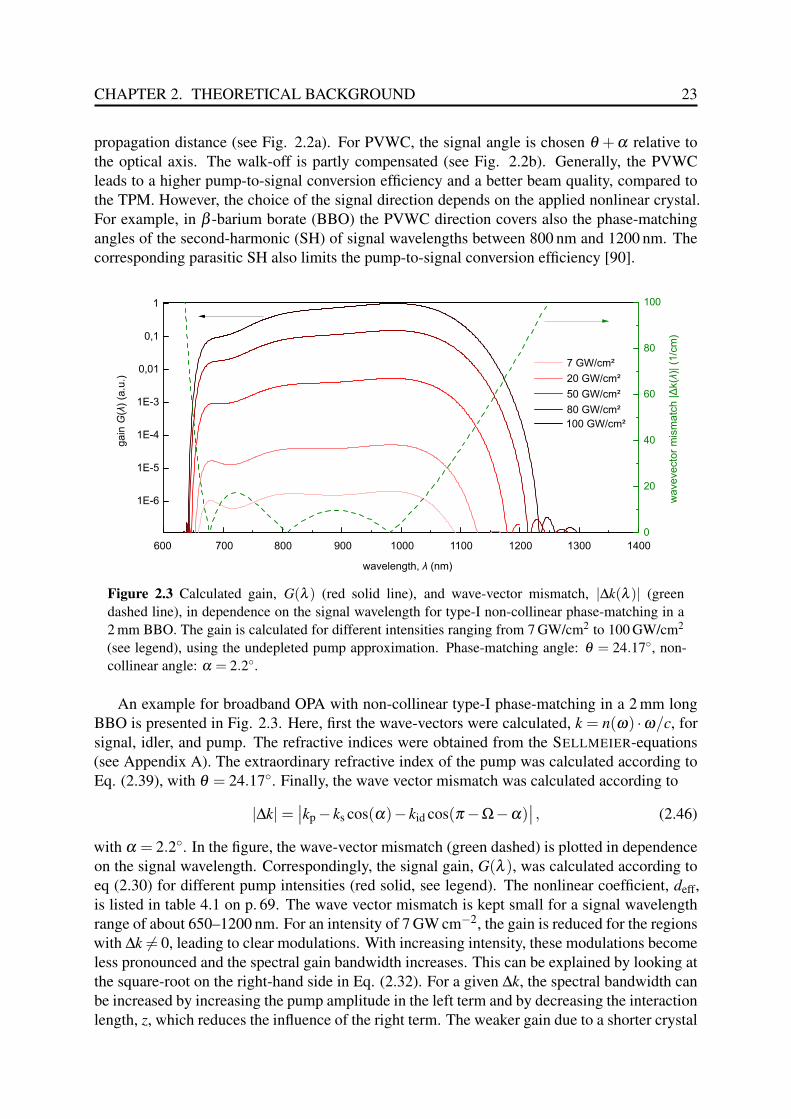
propagation distance (see Fig. 2.2a). For PVWC, the signal angle is chosen θ +α relative tothe optical axis. The walk-off is partly compensated (see Fig. 2.2b). Generally, the PVWCleads to a higher pump-to-signal conversion efficiency and a better beam quality, compared tothe TPM. However, the choice of the signal direction depends on the applied nonlinear crystal.For example, in β -barium borate (BBO) the PVWC direction covers also the phase-matchingangles of the second-harmonic (SH) of signal wavelengths between 800 nm and 1200 nm. Thecorresponding parasitic SH also limits the pump-to-signal conversion efficiency [90].
1E-6
1E-5
1E-4
1E-3
0,01
0,1
1
gain
()
(a.u
.)G
λ
wavelength, (nm)λ
100 GW/cm²
7 GW/cm²
20 GW/cm²
50 GW/cm²
80 GW/cm²
0
20
40
60
80
100
wavevecto
r m
ism
atc
h |
k(
)| (
1/c
m)
Δλ
600 700 800 900 1000 1100 1200 1300 1400
Figure 2.3 Calculated gain, G(λ ) (red solid line), and wave-vector mismatch, |∆k(λ )| (greendashed line), in dependence on the signal wavelength for type-I non-collinear phase-matching in a2 mm BBO. The gain is calculated for different intensities ranging from 7 GW/cm2 to 100 GW/cm2
(see legend), using the undepleted pump approximation. Phase-matching angle: θ = 24.17, non-collinear angle: α = 2.2.
An example for broadband OPA with non-collinear type-I phase-matching in a 2 mm longBBO is presented in Fig. 2.3. Here, first the wave-vectors were calculated, k = n(ω) ·ω/c, forsignal, idler, and pump. The refractive indices were obtained from the SELLMEIER-equations(see Appendix A). The extraordinary refractive index of the pump was calculated according toEq. (2.39), with θ = 24.17. Finally, the wave vector mismatch was calculated according to
|∆k|=∣∣kp − ks cos(α)− kid cos(π −Ω−α)
∣∣ , (2.46)
with α = 2.2. In the figure, the wave-vector mismatch (green dashed) is plotted in dependenceon the signal wavelength. Correspondingly, the signal gain, G(λ ), was calculated according toeq (2.30) for different pump intensities (red solid, see legend). The nonlinear coefficient, deff,is listed in table 4.1 on p. 69. The wave vector mismatch is kept small for a signal wavelengthrange of about 650–1200 nm. For an intensity of 7 GW cm−2, the gain is reduced for the regionswith ∆k = 0, leading to clear modulations. With increasing intensity, these modulations becomeless pronounced and the spectral gain bandwidth increases. This can be explained by looking atthe square-root on the right-hand side in Eq. (2.32). For a given ∆k, the spectral bandwidth canbe increased by increasing the pump amplitude in the left term and by decreasing the interactionlength, z, which reduces the influence of the right term. The weaker gain due to a shorter crystal

24 CHAPTER 2. THEORETICAL BACKGROUND
can be compensated by a higher pump intensity. The intensity limit is given by the damagethreshold of the nonlinear crystal, which scales approximately with 1/
√tP, where tP is the pulse
duration [91]. In conclusion, for an efficient amplification of a broad spectral range, ultrashortpump pulses are required to reach the required high pump intensities. More details about theexperimental implementation of OPA are discussed in Chapter 4.
2.4.3 Third-order processesIn most transparent media that are of relevance in optics, the third-order nonlinear polarizationterm in Eq. (2.23) can be written as [79]
P(3) = ε0χ(3)E3 = ε0χ(3)(
38|A|2 Aeiωct +
18
A3ei·3ωct)+ c.c. (2.47)
This equation is valid for a one-dimensional linearly polarized pulse and the SVEA (see Section2.2). The 3ωc term describes the generation of a third-harmonic wave (THG). If the THG is notphase-matched and sufficiently weak not to affect the fundamental wave, the first term describesthe evolution of a nonlinear refractive index,
n2 =3χ(3)
4ε0n20c. (2.48)
This coefficient is often also referred to as KERR-nonlinearity. The corresponding nonlinearKERR-effect changes the material’s refractive index locally in time and space, traveling withthe intensity envelope of the laser pulse,
n(t,z) = n0 +n2I(t,z), (2.49)
where n0 is the linear refractive index. For non-resonant electronic third-order nonlinearities,the nonlinear refractive index is on the order of 10−19 cm2W−1 (gases) to 10−15 cm2W−1 (trans-parent glasses). The presence of a nonlinear refractive index change is the origin of a varietyof nonlinear effects, such as self-focusing (SF, or KERR-lensing), self-phase-modulation, cross-phase modulation, the formation of solitons and self-steepening [79].
Self-focusing occurs for a spatially inhomogeneous intensity profile. The resulting refrac-tive index profile affects the wavefront curvature and acts like a lens. For a GAUSSIAN beamprofile, a critical optical power can be defined for the onset of self-focusing[92],
Pcr ≈0.15λ 2
cn0n2
. (2.50)
The established GAUSSIAN lens focuses the optical beam (if n2 > 0). Owing to the relatedincrease of intensity, the focusing becomes gradually stronger and may even lead to a beamcollapse. Counteracting mechanisms are the linear diffraction of the beam or plasma-defocusingdue to multiphoton absorption.
Self-phase-modulation (SPM) means that also the spectral phase of the pulse is modulatedby the KERR-nonlinearity. Using the SVEA, the instantaneous frequency, ω(t), is written asthe derivative of the phase,
ω(t) =∂φ∂ t
= ωc −ωc
c∂n(t)
∂ tz, (2.51)
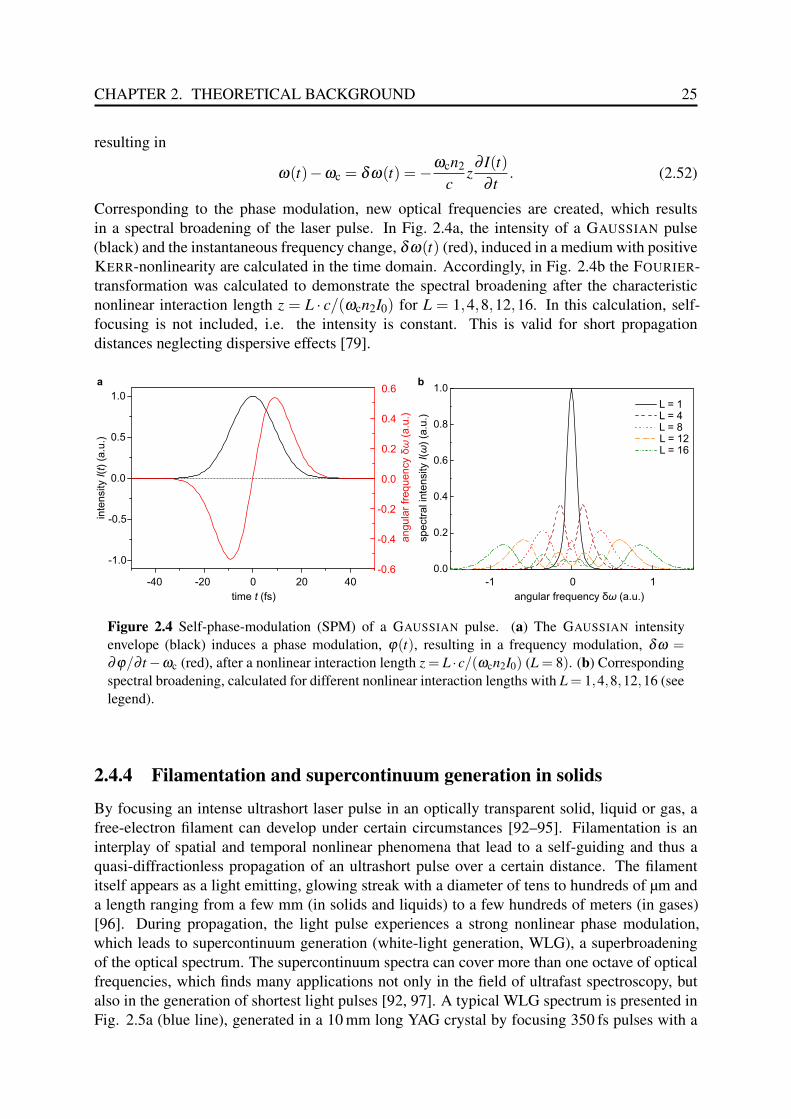
CHAPTER 2. THEORETICAL BACKGROUND 25
resulting in
ω(t)−ωc = δω(t) =−ωcn2
cz∂ I(t)
∂ t. (2.52)
Corresponding to the phase modulation, new optical frequencies are created, which resultsin a spectral broadening of the laser pulse. In Fig. 2.4a, the intensity of a GAUSSIAN pulse(black) and the instantaneous frequency change, δω(t) (red), induced in a medium with positiveKERR-nonlinearity are calculated in the time domain. Accordingly, in Fig. 2.4b the FOURIER-transformation was calculated to demonstrate the spectral broadening after the characteristicnonlinear interaction length z = L · c/(ωcn2I0) for L = 1,4,8,12,16. In this calculation, self-focusing is not included, i.e. the intensity is constant. This is valid for short propagationdistances neglecting dispersive effects [79].
-1.0
-0.5
0.0
0.5
1.0
inte
nsity (
) (a
.u.)
It
time (fs)t
-0.6
-0.4
-0.2
0.0
0.2
0.4
0.6
angula
r fr
equency
(a.u
.)δ
ω
0.0
0.2
0.4
0.6
0.8
1.0
spectr
al in
tensity (
) (a
.u.)
Iω
L = 1L = 4L = 8L = 12L = 16
-20-40 0 20 40 0-1 1
angular frequency (a.u.)δω
a b
Figure 2.4 Self-phase-modulation (SPM) of a GAUSSIAN pulse. (a) The GAUSSIAN intensityenvelope (black) induces a phase modulation, φ(t), resulting in a frequency modulation, δω =∂φ/∂ t −ωc (red), after a nonlinear interaction length z = L ·c/(ωcn2I0) (L = 8). (b) Correspondingspectral broadening, calculated for different nonlinear interaction lengths with L = 1,4,8,12,16 (seelegend).
2.4.4 Filamentation and supercontinuum generation in solids
By focusing an intense ultrashort laser pulse in an optically transparent solid, liquid or gas, afree-electron filament can develop under certain circumstances [92–95]. Filamentation is aninterplay of spatial and temporal nonlinear phenomena that lead to a self-guiding and thus aquasi-diffractionless propagation of an ultrashort pulse over a certain distance. The filamentitself appears as a light emitting, glowing streak with a diameter of tens to hundreds of µm anda length ranging from a few mm (in solids and liquids) to a few hundreds of meters (in gases)[96]. During propagation, the light pulse experiences a strong nonlinear phase modulation,which leads to supercontinuum generation (white-light generation, WLG), a superbroadeningof the optical spectrum. The supercontinuum spectra can cover more than one octave of opticalfrequencies, which finds many applications not only in the field of ultrafast spectroscopy, butalso in the generation of shortest light pulses [92, 97]. A typical WLG spectrum is presented inFig. 2.5a (blue line), generated in a 10 mm long YAG crystal by focusing 350 fs pulses with a
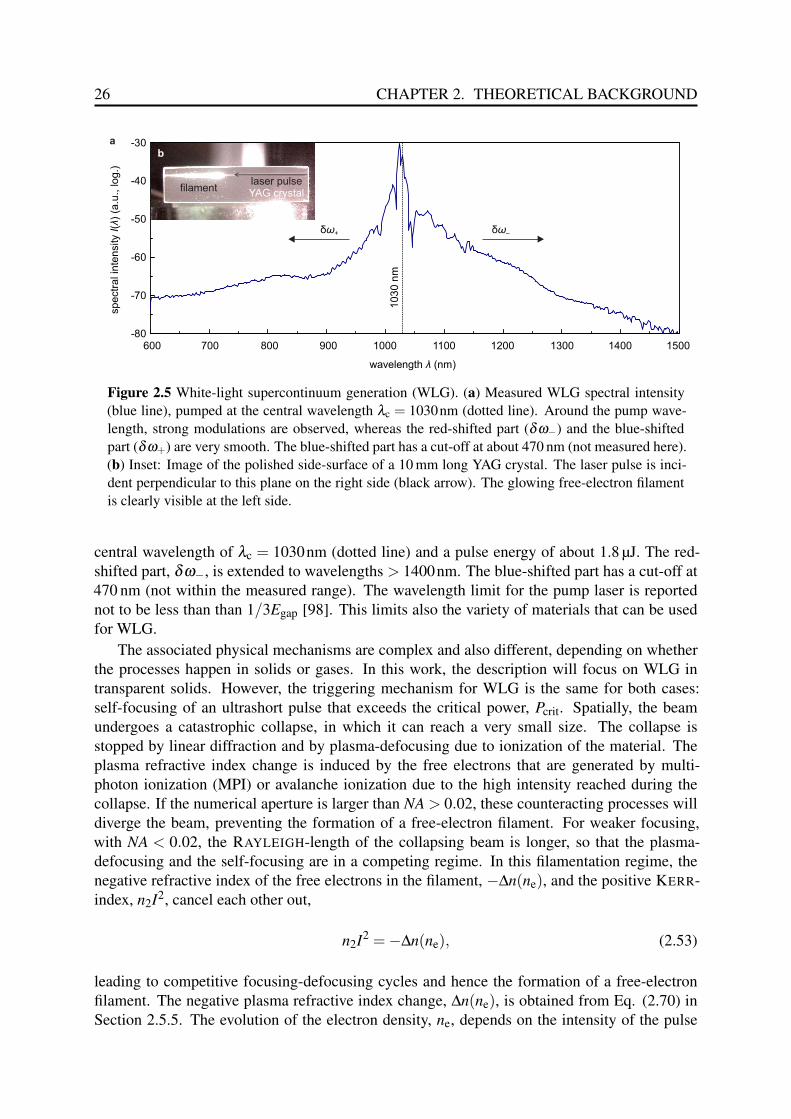
26 CHAPTER 2. THEORETICAL BACKGROUND
600-80
-70
-60
-50
-40
-30
spectr
al i n
tensity (
)(a
.u., log.)
Iλ
wavelength (nm)λ
103
0n
m
700 800 900 1000 1100 1200 1300 1400 1500
δω+ δω–
YAG crystalfilament
laser pulse
a
b
Figure 2.5 White-light supercontinuum generation (WLG). (a) Measured WLG spectral intensity(blue line), pumped at the central wavelength λc = 1030nm (dotted line). Around the pump wave-length, strong modulations are observed, whereas the red-shifted part (δω−) and the blue-shiftedpart (δω+) are very smooth. The blue-shifted part has a cut-off at about 470 nm (not measured here).(b) Inset: Image of the polished side-surface of a 10 mm long YAG crystal. The laser pulse is inci-dent perpendicular to this plane on the right side (black arrow). The glowing free-electron filamentis clearly visible at the left side.
central wavelength of λc = 1030nm (dotted line) and a pulse energy of about 1.8 µJ. The red-shifted part, δω−, is extended to wavelengths > 1400nm. The blue-shifted part has a cut-off at470 nm (not within the measured range). The wavelength limit for the pump laser is reportednot to be less than than 1/3Egap [98]. This limits also the variety of materials that can be usedfor WLG.
The associated physical mechanisms are complex and also different, depending on whetherthe processes happen in solids or gases. In this work, the description will focus on WLG intransparent solids. However, the triggering mechanism for WLG is the same for both cases:self-focusing of an ultrashort pulse that exceeds the critical power, Pcrit. Spatially, the beamundergoes a catastrophic collapse, in which it can reach a very small size. The collapse isstopped by linear diffraction and by plasma-defocusing due to ionization of the material. Theplasma refractive index change is induced by the free electrons that are generated by multi-photon ionization (MPI) or avalanche ionization due to the high intensity reached during thecollapse. If the numerical aperture is larger than NA > 0.02, these counteracting processes willdiverge the beam, preventing the formation of a free-electron filament. For weaker focusing,with NA < 0.02, the RAYLEIGH-length of the collapsing beam is longer, so that the plasma-defocusing and the self-focusing are in a competing regime. In this filamentation regime, thenegative refractive index of the free electrons in the filament, −∆n(ne), and the positive KERR-index, n2I2, cancel each other out,
n2I2 =−∆n(ne), (2.53)
leading to competitive focusing-defocusing cycles and hence the formation of a free-electronfilament. The negative plasma refractive index change, ∆n(ne), is obtained from Eq. (2.70) inSection 2.5.5. The evolution of the electron density, ne, depends on the intensity of the pulse

CHAPTER 2. THEORETICAL BACKGROUND 27
and can be calculated according to [93–95, 99]
dne(t)dt
=σK
Khωc|E(t)|2K +
σav
n2Egne(t) |E(t)|2 −
ne(t)τr
. (2.54)
The first term describes the MPI, with the order of the absorption process, K (K-photon absorp-tion), and the MPI cross-section, σK . The second term describes the avalanche ionization, i.e.the secondary impact ionization rate with the cross-section for inverse bremsstrahlung, σav, thematerial refractive index, n, and the material electronic band gap, Eg. The third term accountsfor the electron decay time, τr, which lasts in most cases longer than the laser pulse duration.
For describing the WLG during the filamentation, the SPM theory alone is not sufficient.It has been proposed that a strong SPM enhancement by the fast generation of electrons is theorigin of the spectral superbroadening [98]. In particular, the blue shifted components exhibit astrong spectral expansion, according to
δω+ =
(−∂φ
∂ t
)max
, (2.55)
the maximum rate of decrease of the nonlinear phase (see Eq. 2.51). This ionization-enhancedSPM occurs close to the beam collapse, in the onset of filamentation. The temporally trailingpart of the pulse experiences a sudden change in phase, originating from the increasing electrondensity triggered by the leading part of the pulse.
For generating a white-light continuum, the fast MPI contribution plays a key role in WLGusing ultrashort pulses. As can be seen from Eq. (2.54), the avalanche ionization term requiresa seed electron density within the conduction band. With the typical impurity concentrationin transparent solids of nimp ≈ 108 cm−3 [99], only very low electron densities can be reached(ne < 1013 cm−3 at an intensity of 1.9GW cm−2). Moreover, the avalanche ionization is veryslow, so the maximum of the electron density is established only after the pulse. However, inMPI-assisted avalanche ionization, the electrons from the fast MPI process seed the avalancheionization, leading to an efficient generation of free electrons within the conduction band. Thisis shown in Fig. 2.6, where the MPI-assisted avalanche ionization is calculated for two dif-ferent materials, sapphire and yttrium-aluminum-garnet (YAG), during an 850 fs GAUSSIAN
pulse with an optical peak power of 5.8 MW. Assuming a filament diameter of 10 µm, the peakintensity is 1.9GW cm−2. Owing to the different band-gap (sapphire: Egap = 8.2eV, YAG:Egap = 5.9eV), a 7-photon process is required in sapphire, whereas only a 5-photon process isrequired in YAG. This difference results in a lower MPI rate in sapphire (Fig. 2.6a, red line),compared to YAG (Fig. 2.6b, red line). Because in sapphire the avalanche contribution is dom-inant, the increase of the electron density is much slower and a major part is gained only atthe falling edge of the intensity envelope. In contrast, in YAG the MPI contribution dominates,leading to a fast increase of the electron density during the rising edge. In addition, the refrac-tive index difference between the nonlinear refractive index and the negative plasma refractiveindex, n2I −|∆n(ne)|, was calculated. In sapphire, the index change is dominated by the non-linear index (Fig. 2.6) and will not lead to filamentation, whereas in YAG, a fast and strongcontribution from the plasma index takes place within the FWHM of the falling edge (Fig. 2.6).This effect would be even more pronounced, taking into account also the self-steepening of thefalling edge due to the self-phase modulation during the beam collapse [95]. Numerical calcula-tions with the nonlinear SCHRÖDINGER-equation predict that the spatial and temporal interplaybetween the nonlinear processes are even more complex and the ultrashort pulse is drastically

28 CHAPTER 2. THEORETICAL BACKGROUND
time (ps)t
a
intensityMPI + avalancheMPI only ( =7)K
-0.010
-0.005
0.000
0.005
0.010
intensity
2.5x10¹² 10
20
1018
1016
1014
1012
1010
108
0.00.0 1.01.0 2.02.0 -1.0-1.0 -2.0-2.0
2.0x10
2.0x10
12
12
1.5x10
1.5x10
12
12
1.0x10
1.0x10
12
12
0.5x10
0.5x10
12
12
0.0
0.0
1020
1018
1016
1014
1012
1010
108
ele
ctr
on d
ensity
(cm
)
n-3
e
2.5x10¹²
2.0x10¹²
1.5x10¹²
1.0x10¹²
0.5x10¹²
0.0
inte
nsity (
) (W
cm
)
It
-2
inte
nsity (
) (W
cm
)
It
-2
Δn
KE
RR
e
0.0 1.0 2.0-1.0-2.0
time (ps)t
0.0 1.0 2.0-1.0-2.0
time (ps)ttime (ps)t
-0.010
-0.005
0.000
0.005
0.010
b
c d
intensityMPI + avalancheMPI only
refractive index change
intensity
refractive index change
inte
nsity (
) (W
cm
)
It
-2
( =5)K
ele
ctr
on d
ensity
(cm
)
n-3
e
inte
nsity (
) (W
cm
)
It
-2
+(
)Δ
nn
2.0x10¹²
1.5x10¹²
1.0x10¹²
0.5x10¹²
0.0
sapphire YAG
Δn
KE
RR
e+
()
Δn
n
Figure 2.6 MPI-assisted avalanche ionization dynamics and KERR-nonlinearity during an intenselaser pulse at a central wavelength of λc = 1030nm (photon energy hωc = 1.2eV). The GAUSSIAN
intensity envelope (grey dashed) has a pulse duration of 850 fs FWHM. (a) Temporal evolution ofthe electron density (black) in sapphire. The contribution of multiphoton ionization (MPI, red) ismore than 4 orders of magnitudes smaller compared to the slower MPI assisted avalanche ionization,because a 7-photon process is required (K = 7). (b) Temporal evolution of the electron density inyttrium-aluminum-garnet (YAG). Here, the MPI contribution is dominant, because only 5-photonsare required to overcome the electronic band-gap. Thus, the electron density increases much fasterand reaches ne = 1017cm−3 before the intensity maximum of the laser pulse. (c) Correspondingdifference between the nonlinear refractive index, ∆nKerr = n2I, and the plasma refractive index,∆ne, in sapphire (black). (d) Corresponding refractive index difference in YAG (black).
CHAPTER 2. THEORETICAL BACKGROUND 29
reshaped in space and time [93, 95, 100]. Dispersive effects lead, for example, to a complextemporal splitting and self-compression of the pulses.
In general, sapphire is a highly suitable and commonly used material for stable WLG fromsub-100 fs pump pulses at a center wavelength of λc = 800nm. In this case the MPI rate isincreased, because only a 6-photon process is required to overcome the band gap and higherintensities are reached in a shorter time.
The beam divergence of the spectrally broadened components (hereafter referred to as WLGpulse) is comparable to that of the pump pulse, even though the pump pulses suffered strongself-focusing. It is assumed, that self-guiding is the key mechanism to explain that unexpectedbehavior. The WLG pulse propagates along with the pump pulse and is guided by the competingfocusing-defocusing cycles of the pump. At the end of the filament, the WLG pulse is coupledout, comparable to a guided mode out of an optical fiber. The associated beam profile is verysmooth and has a GAUSSIAN intensity envelope, surrounded by a halo. Spatial filtering of thehalo by an aperture yields a GAUSSIAN beam [92].
Concerning the coherence properties, it has been shown that the red-shifted componentsas well as the blue-shifted components have a defined phase relationship [92]. It has alsobeen demonstrated that the broadband WLG pulses can be temporally compressed close tothe FOURIER-limit of a selected spectral range [97]. The amount of dispersion that has to becompensated corresponds approximately to the amount of crystal material. Correspondingly,it was observed that the WLG components are created very early, during the onset of the fila-mentation process [98]. This observation also agrees with the theory of SPM enhancement offree-electron generation described above. In conclusion, filamentation and WLG in transparentsolid materials is a promising method to achieve broadband, compressible pulses with a goodbeam quality for versatile scientific and technical applications. In this work, WLG in YAG (Sec-tion 4.4) and in sapphire crystals (Section 3.7) play a particularly important role for providingbroadband signal seed pulses for the optical parametric amplification of ultrashort light pulses.

30 CHAPTER 2. THEORETICAL BACKGROUND
2.5 Ionization dynamics in insulators and semiconductorsThe physical interaction between XUV or X-ray pulses with solid-state materials can be inves-tigated on an ultrafast timescale using free-electron lasers or table-top sources. Pulse durationsin the femtosecond-regime allow to observe fundamental electronic processes, such as electron-electron interactions or electron-lattice collisions. Electronic processes are much faster owingto the large mass ratio of about 10−4 compared to the lattice ions. This allows to separatelyinvestigate the dynamics within the electronic subsystem during the irradiation with ultrashortpulses. If the photon energy is larger than the band gap of the material, hω > Eg, direct pho-toionization occurs from bound states of deep atomic shells and the valence band to high-energystates of the conduction band.
2.5.1 Excitation processes
Direct photoionization
In Fig. 2.7 the partial density of states (DOS) is shown for the valence band and the conductionband formed by the 3s and 3p-states of solid silicon at room temperature [101, 102]. The DOSrepresents the number of quantum mechanical states per energy interval that can be occupiedby an electron. The L-edges and the K-edge (100 eV, 148 eV, 1.8 keV, respectively) can beconsidered as delta-functions. In the room temperature thermal equilibrium, mainly the valenceband states are occupied and the conduction band states are almost empty. An XUV or X-rayphoton can excite the system by transferring its energy and momentum to an electron with aprobability corresponding to the DOS. Depending on the photon energy, hωFEL, and the initialstate of the bound electron with an ionization potential, IP, it is lifted to a high energy state withthe initial energy:
Ee = hωFEL − IP. (2.56)
Correspondingly, after each electron excitation a hole remains within the valence band or adeeper shell with an energy of Eh =−IP. The energies are measured with respect to the lowestenergy state within the conduction band.
Secondary processes
After the primary ionization, the electron is treated as an energetic free electron. If the energy ofthis primary electron is sufficiently high, it will most likely transfer its energy to other electrons,triggering secondary ionization cascades. Either impact ionizations or AUGER-like decays mayoccur. As shown in the schematic band diagram of silicon in Fig. 2.7b (black arrows), a primaryelectron, e1, can ionize a second electron, e2, by collision if its energy exceeds a thresholdenergy, Emin
e ≈ Eg ≈ 1.2 eV, which is approximately as high as the indirect band gap, Eg [103].For an AUGER-like decay, a hole, h, with sufficient high energy deep in the valence band or
in a deep shell recombines with an electron in the upper valence band or in an upper shell. Theexcess energy is sufficient to ionize another electron from the upper valence band, eA, as alsoshown in Fig. 2.7b (blue arrows). The threshold energy in this case is Emin
h =−3 eV, measuredwith respect to the bottom of the conduction band. Below these thresholds, the primary electronswill not be able to trigger further secondary ionizations.

CHAPTER 2. THEORETICAL BACKGROUND 31
L P4 X
6
4
2
0
-2
-4
-6
e
ee
h
en
erg
y (
eV
)
k-vector
E
valenceband
conductionband
a b
E
E
g
emin
A
1
2
hmin
conductionband
valenceband
Figure 2.7 Electronic properties of silicon. (a) Density of States (DOS) within the valence band andthe conduction band [101]. The deeper shells are not plotted. (b) Impact ionization (yellow circles,black arrows) and AUGER decay (blue circles, blue arrows) in the schematic band diagram of siliconaccording to ref. [101]. Impact ionization may occur if the primary photoelectron, e1, transfers itssufficient energy of Emin
e to a second electron, e2, in the valence band by collision in order to allowthat secondary electron to overcome the indirect band gap, Eg. An AUGER-like decay may occur ifthe remaining hole, h, after the primary photoionization transfers its sufficient energy, Emin
h , to anAUGER-electron in the valence band. From [101].
2.5.2 Numerical Methods
The temporal evolution of the ionization dynamics within solid-state materials can be numer-ically studied [104–106]. Using a classical particle approach, the complex stochastic many-particle system can be solved efficiently with a dedicated Monte Carlo method [101, 104, 107–109]. The method is based on tracing individual particles event-by-event. In each time step theequations of motion for all involved particles (e.g. photons, electrons, holes) are solved in a de-terministic way. Probabilities for impact ionizations, elastic scattering and AUGER-like eventsare estimated with statistical cross-sections, σ , taken from quantum mechanics.
The simulation scheme is as follows [101]: First, the absorption of the XUV or X-ray pho-tons into the material is simulated, taking into account the attenuation length 1/αFEL. Forexample, the attenuation length within different materials is plotted in Fig. 2.8 for photon ener-gies ranging from 30 eV to 8 keV [110]. If the photon lies within the simulation box, its energyis transferred to a randomly chosen bound or free electron. The probability of which energystate the photoabsorption occurs is calculated from the corresponding attenuation lengths.
For modeling the cascading of secondary processes, first, all possible path lengths are de-termined corresponding to all possible collision events, taking into account the scattering cross-sections, σ . The shortest obtained length determines the choice of the bound electron to beionized. The energy transferred to the bound electron in the simplest case can be calculated asfollows:
∆Ee = Ee
[1+
(ba0
)2( Ee
2R
)2], (2.57)
where Ee is the kinetic energy of the primary free electron, b is the impact parameter betweenfree electron and bound electron, which is randomly chosen, a0 = 0.53Å is the Bohr radius,
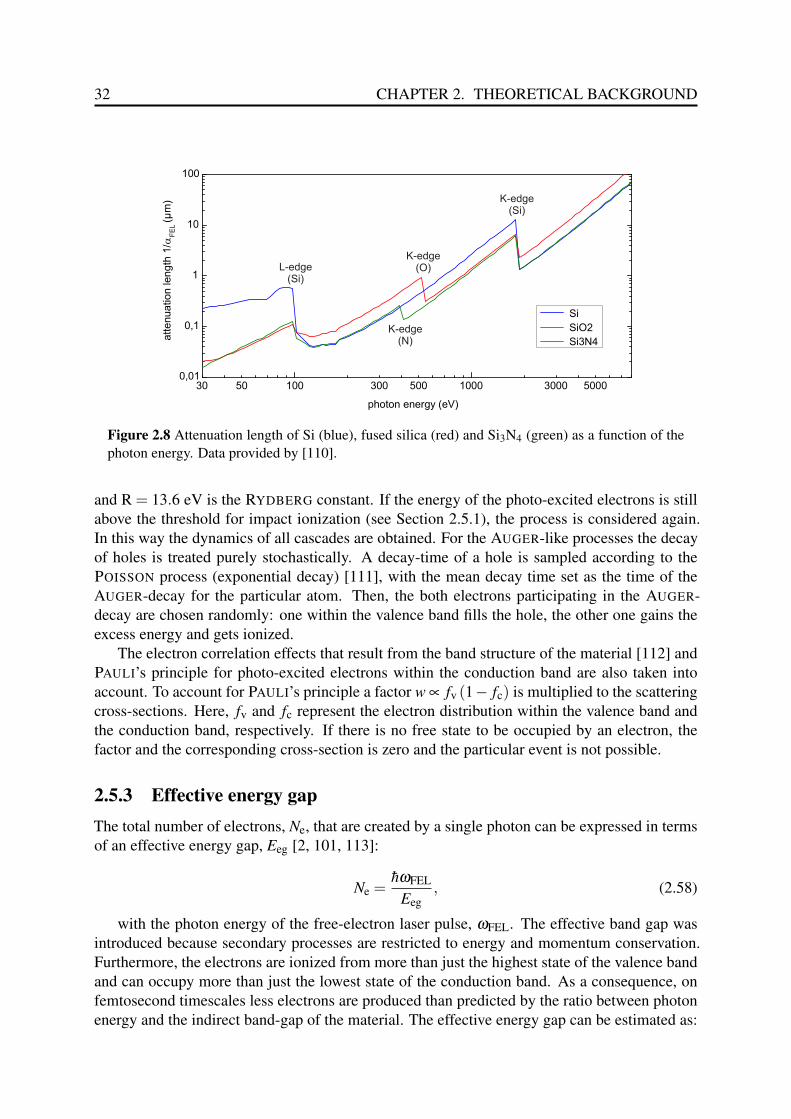
32 CHAPTER 2. THEORETICAL BACKGROUND
100 10000,01
0,1
1
10
100attenuation length
1/a
FE
L(µ
m)
photon energy (eV)
Si
SiO2
Si3N4
30 50 300 500 3000 5000
L-edge(Si)
K-edge(Si)
K-edge(O)
K-edge(N)
Figure 2.8 Attenuation length of Si (blue), fused silica (red) and Si3N4 (green) as a function of thephoton energy. Data provided by [110].
and R = 13.6 eV is the RYDBERG constant. If the energy of the photo-excited electrons is stillabove the threshold for impact ionization (see Section 2.5.1), the process is considered again.In this way the dynamics of all cascades are obtained. For the AUGER-like processes the decayof holes is treated purely stochastically. A decay-time of a hole is sampled according to thePOISSON process (exponential decay) [111], with the mean decay time set as the time of theAUGER-decay for the particular atom. Then, the both electrons participating in the AUGER-decay are chosen randomly: one within the valence band fills the hole, the other one gains theexcess energy and gets ionized.
The electron correlation effects that result from the band structure of the material [112] andPAULI’s principle for photo-excited electrons within the conduction band are also taken intoaccount. To account for PAULI’s principle a factor w ∝ fv (1− fc) is multiplied to the scatteringcross-sections. Here, fv and fc represent the electron distribution within the valence band andthe conduction band, respectively. If there is no free state to be occupied by an electron, thefactor and the corresponding cross-section is zero and the particular event is not possible.
2.5.3 Effective energy gapThe total number of electrons, Ne, that are created by a single photon can be expressed in termsof an effective energy gap, Eeg [2, 101, 113]:
Ne =hωFEL
Eeg, (2.58)
with the photon energy of the free-electron laser pulse, ωFEL. The effective band gap wasintroduced because secondary processes are restricted to energy and momentum conservation.Furthermore, the electrons are ionized from more than just the highest state of the valence bandand can occupy more than just the lowest state of the conduction band. As a consequence, onfemtosecond timescales less electrons are produced than predicted by the ratio between photonenergy and the indirect band-gap of the material. The effective energy gap can be estimated as:

CHAPTER 2. THEORETICAL BACKGROUND 33
Egap (eV) Emine (eV)
∣∣Eminh
∣∣ (eV) Eeg (eV)Si 1.15 1.2 3 2.26SiO2 8.9 13.5 12.5 17Si3N4
a 4.5 4.5 9 9a estimated from [114]
Table 2.1 The band gap energy, Egap, the threshold energy for impact ionization, Emine , the threshold
for AUGER-like processes,∣∣Emin
h
∣∣, and the corresponding effective energy gap, Eeg, for differentmaterials. Data provided by [113].
Eeg =12
(Egap +Emin
e +∣∣∣Emin
h
∣∣∣) . (2.59)
In Table 2.1, the band gap energy, Egap, the threshold energy for impact ionization, Emine , the
threshold for AUGER-like processes,∣∣Emin
h
∣∣, and the corresponding effective energy gap, Eeg,are listed for different materials. The values for Si and SiO2 are taken from [101]. The valuesfor Si3N4 are estimated from its electronic band structure [114].
2.5.4 Electron dynamics within fused silicaFor photon energies that are larger than the Eeg, secondary electron production starts to governthe increase of the free-electron density during the irradiation with an ultrashort XUV or X-raypulse. The temporal dynamics of this dependence was studied using the Monte Carlo simulationdescribed in Section 2.5.2 [109]. Calculations of the time-dependent free-electron density werecarried out on the timescale of 200 fs. The irradiation of a fused silica sample by a GAUSSIAN
FEL pulse with a pulse duration of 1 fs FWHM was simulated with varying photon energyranging from 20 eV to 10 keV (Fig. 2.9). For a photon energy of 20 eV (red solid), the risetime of the electron density is approximately as fast as the rise time of the FEL fluence. Withincreased photon energy up to 1 keV (green dashed), the rise time is on the order of a fewfemtoseconds. With further increased photon energy up to 10 keV (black dashed), the risetime is on the order of tens of femtoseconds, which is very slow compared to the FEL pulseduration. This can be explained by the high energy that a single photoelectron receives. Asmostly only a little fraction of the energy is lost in a single collision, multiple cascades ofsecondary processes are required to release this high energy. Thus, the density of lower-energyphotoelectrons increases due to the secondary ionizations, lasting for tens of femtoseconds inthe high energy case. For example, a photoelectron with Ee = 7 keV needs about 40 fs to releaseits energy by cascading secondary ionization processes. In contrast, a single photoionizationevent is expected to happen on the attosecond timescale [115].
Depending on the band structure of a particular material, additional loss channels may con-tribute to an ultrafast relaxation on the femtosecond scale [104, 116–118]. In fused silica, anultrafast decay of the electron density was observed with a time constant of τ ≈ 150 fs scale(see Fig. 2.9) [65, 119, 120]. This decay is attributed to the formation of excitons, which arestable electron-hole pairs formed closely below the conduction band with a binding energy ofup to 1 eV [121–123]. If no such ultrafast relaxation channels are present, the photoelectronscan be considered to remain stable in the conduction band on the femtosecond timescale. Thus,during the irradiation with an XUV or X-ray pulse the density of free electrons within the ma-terial will increase, and, after the pulse, the electrons will remain within the high energy states

34 CHAPTER 2. THEORETICAL BACKGROUND
for time scales of picoseconds to nanoseconds, if no additional ultrafast relaxation mechanismsare available.
Figure 2.9 Temporal dynamics of the electron density within fused silica during the irradiation witha 1 fs FEL pulse of different photon energy ranging from 20 eV (red solid) to 10 keV (black dashed).The absorbed fluence is kept constant. With increasing photon energy the rise time of the electrondensity increases, because the sequence secondary processes takes longer. Figure from [109].
2.5.5 Optical properties of a free-electron plasmaDRUDE model
The optical properties of the photo-excited material are changing dramatically owing to thepresence of the high density of free electrons, ne. The relative permittivity is derived by treatingthese electrons as a free-electron plasma, considering a uniformly distributed charge qe =−neewithin an arrangement of positively-charged static lattice ions. Here, e is the elementary charge.If an electric field, E, is applied to this system, the electrons are displaced by a distance x withrespect to the lattice, resulting in a polarization density,
p =−neex, (2.60)
and a restoring electric field,Er =
neexε0
. (2.61)
The motion of the electrons within the electric field is described by the restoring force,
med2xdt2 = eEr. (2.62)
An important property of plasmas, the rapid plasma oscillation, can be obtained by solvingEq. (2.62). Substituting E on the right-hand side by Eq. (2.61) yields a harmonic-oscillatorequation. Its solution describes an oscillatoric electron motion with the frequency
ω2P =
nee2
ε0me(2.63)
CHAPTER 2. THEORETICAL BACKGROUND 35
For electrons with low kinetic energy, this oscillation is an inherent property of the plasma andits frequency, ωP, only depends on the electron density. In the next paragraph it will be shownhow this affects the optical properties of the plasma.
We now let the electric field oscillate at an optical frequency, ω , resulting in Er = E(ω) =E0e−iω t . The polarization density will also oscillate, p = p(ω) = p0e−iω t . From Eqs. 2.60 and2.62 we derive
med2xdt2 =
meω2
nep0e−iω t = eE0e−iω t , (2.64)
and obtain the relation
p(ω) =− nee2
meω2 E(ω) (2.65)
According to Eq. (2.5) and (2.65), the relative dielectric permittivity is expressed as
ε(ω) = 1+p(ω)
ε0E(ω)= 1− nee2
meω2 . (2.66)
By use of the relation in Eq. (2.63) we obtain the relative permittivity as a function of the opticalfrequency and the plasma frequency:
ε(ω) = 1−ω2
Pω2 (2.67)
For optical frequencies that are higher than the plasma frequency, ω > ωP, the plasma is trans-parent as the dielectric function becomes positive. For smaller frequencies, ω < ωP, the plasmabecomes optically opaque. We can thus define a critical electron density,
nc =ε0me
e2 ω2, (2.68)
for the resonance case ω = ωP.
The model of Spitzer and Shkarofsky
Depending on the atomic structure of the material as well as on the energy and density of theelectrons, scattering at the lattice ions will affect the dielectric response. From the statisticallyaveraged Coulomb collisions, a mean collision time, τel−ion, and a corresponding mean collisionfrequency, ωel−ion = 2π/τel−ion, can be defined [124–126],
ωel−ion =4√
2πe4
(4πε0)2
neZeff
T 3/2e
ln(Λ) , (2.69)
taking into account the average degree of ionization, Zeff, the electron temperature, Te, andthe Coulomb-logarithm, ln(Λ), which represents a geometric impact parameter. The relativepermittivity with electron-ion collisions included is then expressed as:
ε(ω) = 1−ω2
Pω2
(1
1+ f 2 + if
1+ f 2
), (2.70)
with the damping factor, f = ωel−ion/ω .

36 CHAPTER 2. THEORETICAL BACKGROUND
Refractive index
The optical properties of the relative permittivity functions obtained from Eqs. (2.67) and (2.70)are evaluated in Fig. 2.10 for an electron density of ne = 1.7 ·1027 m−3. The complex refractiveindex,
n(ω) =√
ε(ω), (2.71)
is calculated for the case without electron-lattice collisions (dashed lines) and for the case withelectron-lattice collisions included (solid lines). The real part, ℜ(n), corresponds to the refrac-tion (usual refractive index), whereas the imaginary part, ℑ(n), is related to the absorption co-efficient. Without collisions, a sharp resonance occurs at the plasma frequency, ωP = 2.32 THz.In contrast, with collisions included, the resonance is damped and refraction and absorptionoccur simultaneously.
angular frequency (THz)ω
500
wavelength (nm)λ
1.0
0.8
0.6
0.4
0.2
0.0
1.5 2.0 2.5 3.0 3.5
6007001000 8001500
Re ñ( )ω
Re
,
ñ(
)ω
Imñ
()
ω
Re el.-ion coll.ñ( )ω
Im ñ( )ω
Im no coll.ñ( )ω
Im el.-ion coll.ñ( )ω
Re no coll.ñ( )ω
wP
Figure 2.10 Complex refractive index, n =√
ε(ω), of a free-electron plasma. Real part (black) andimaginary part (red) for an electron density of ne = 1.7 ·1027 m−3. It is calculated for the case of afree-electron plasma without electron-ion collisions (dashed line) and the free-electron plasma withelectron-ion collisions included (solid line), according to Eqs. 2.67 and 2.70, respectively. In thelatter case, ln(Λ) = 3, is assumed [124]. The electron temperature is Te = 10eV, according to theo-retical simulations. With the absence of collisions, a sharp resonance occurs at the plasma frequency,ωP = 2.32 THz. With collisions included, the resonance is damped and both contributions, ℜ [n(ω)]and ℑ [n(ω)] are present on each side.
CHAPTER 2. THEORETICAL BACKGROUND 37
2.6 Temporal characterization of ultrashort pulsesUltrashort laser pulses are the shortest signals artificially generated by mankind. Hence, ul-trashort pulse metrology must rely on ultrafast optical processes, such as nonlinear paramet-ric processes. The duration of a few-femtosecond pulse is orders of magnitudes shorter thanthe detector response time of a photodiode or electronic oscilloscopes (> 10ps at bandwidth< 100GHz). For that reason, the detector will always integrate over a temporal window thatis very large compared to the signal to be measured. This requires optical gating of one pulseagainst another for different time delays, ∆t. In this section, an intensity cross-correlation and aspectral interferometric method will be highlighted, as these are important optical pulse durationmeasurement techniques used in this work. Of course, many concepts and various experimentalimplementations exist, that cannot be discussed within the scope of this work. A basic reviewcan be found in [127].
2.6.1 Intensity cross-correlation and autocorrelationIn the situation where a well-defined ultrashort reference pulse is already available, the unknownoptical pulse can be sampled with this signal. From the intensity cross-correlation function,
S(∆t) =∫ +∞
−∞I1(t)I2(t −∆t)dt, (2.72)
between the intensity of the unknown laser pulse, I1(t) with the unknown pulse duration τ1, andthe reference pulse, I2(t) with the known pulse duration τ2, one can extract the intensity I1(t) bydeconvolution. For GAUSSIAN pulses, the cross-correlation function yields also a GAUSSIAN
function with a pulse duration of τ2S = τ2
1 + τ22 . The duration of the unknown pulse is obtained
by
τ1 =√
τ2S − τ2
2 . (2.73)
In the ideal case, the reference pulse is much shorter than the unknown pulse and can be consid-ered as a delta-function (τS = 0). For reference pulses that approach the pulse duration of theunknown pulse or are even longer, the error becomes very large.
In most situations, no well characterized reference pulse is available and the unknown pulseitself is used as the reference pulse, I2(t) = I1(t). This case corresponds to an intensity auto-correlation. However, because an infinite number of pulse shapes leads to similar symmetricautocorrelations, only rough information about the pulse shape and the actual pulse durationcan be extracted. But owing to its relatively simple experimental implementation, intensity-autocorrelation is a widely used method for the characterization of ultrashort pulses. In practi-cal situations, basic properties about the pulse shape can be assumed and allow for determiningthe pulse duration. For example, from Eq. (2.73) the pulse duration of a GAUSSIAN pulse isdetermined from its autocorrelation width, τAC = τS, according to
τ1 =1√2
τAC. (2.74)
Experimentally, an intensity auto- or cross-correlation is obtained by overlapping the two pulses(or two replicas) in a second-order nonlinear medium to obtain an intensity-dependent signal.Most commonly used is the sum-frequency generation (SFG) with type-I phase matching, as

38 CHAPTER 2. THEORETICAL BACKGROUND
Δt
Δt
E t- t2( )Δ
E t( )1
E t E t- t( ) ( )2
Δ1
SFG
DE
T
aperture
k1
k2
k3 1 2= k + k
Figure 2.11 Schematic setup of an intensity cross-correlator, relying on sum-frequency generationwith type-I phase-matching. The two pulses, E1(t), with wave vector k1 and E2(t −∆t) with wavevector k2 and delay ∆t (with respect to E1), are overlapped in a nonlinear crystal. The generatedsum-frequency is proportional to E1(t)E2(t −∆t) and its wave-vector is directed according to thephase-matching condition, k3 = k1 + k2. The background contributions are spatially separated andblocked by the aperture. The detector (DET) signal yields the intensity cross-correlation.
shown in Fig. 2.11. The delay, ∆t, is introduced by an optical delay stage. The sum-frequencysignal is generated by the overlapping electric field of both pulses, [E1(t)+E2(t −∆t)]2. Witha non-collinear setup, the fields of the fundamental frequency and their respective second-harmonic fields are spatially separated by an aperture. Because of momentum conservation,k3 = k1 + k2 (the wave vectors), only the contribution proportional to E1(t)E2(t −∆t), which isgenerated between k1 and k2 passes the aperture and reaches the detector, yielding
S(∆t) ∝∫ +∞
−∞|E1(t)E2(t −∆t)|2 dt ∝
∫ +∞
−∞I1(t)I2(t −∆t)dt, (2.75)
because the slow detector integrates the optical intensity over the time. In order not to distortthe measurement, the dispersion of all involved optical elements must be carefully taken intoaccount (or avoided). For the SFG, the phase-matching bandwidth must be larger than thebandwidth of the measured pulses, which requires a short coherence length, lc (Eq. 2.38).
2.6.2 Phase-sensitive methodsIn general, autocorrelation measurements are afflicted with ambiguities. Even higher-orderautocorrelations, S(∆t) =
∫+∞−∞ I(t)In(t −∆t)dt, with n > 1, only yield the intensity envelope5.
However, for many applications it is of importance to know the exact evolution of the electricfield. Thus, methods are developed that also allow for the unambiguous retrieval of the phase.One of such methods is the spectral interferometry for direct electric field reconstruction (SPI-DER) [128]. This technique makes use of measuring a single-shot spectral interferogram andapplying a linear phase retrieval procedure. The interferogram results from the interference oftwo pulse replicas, described by their complex electric fields in the frequency domain, E1(ωc)and E2(ωc +Ω), respectively (i.e. the inverse FOURIER-transformation of Eq. (2.15). The twopulses are spectrally sheared, i.e. the carrier frequency of the second pulse is shifted by Ω withrespect to the first pulse. Fig. 2.12 displays a schematic experimental implementation. First, thepulse is split by a beam splitting device (BS), whereupon one fraction is temporally stretchedand strongly chirped in a dispersive element (stretcher). The other fraction passes a MICHEL-SON-interferometer (M), where the two replicas, E1 and E2, are generated with a temporal delay,
5This is a consequence of the one-dimensional phase-retrieval problem. However, with additional measure-ments, for example the spectrum, one can iteratively calculate the spectral phase with reasonable accuracy [79]
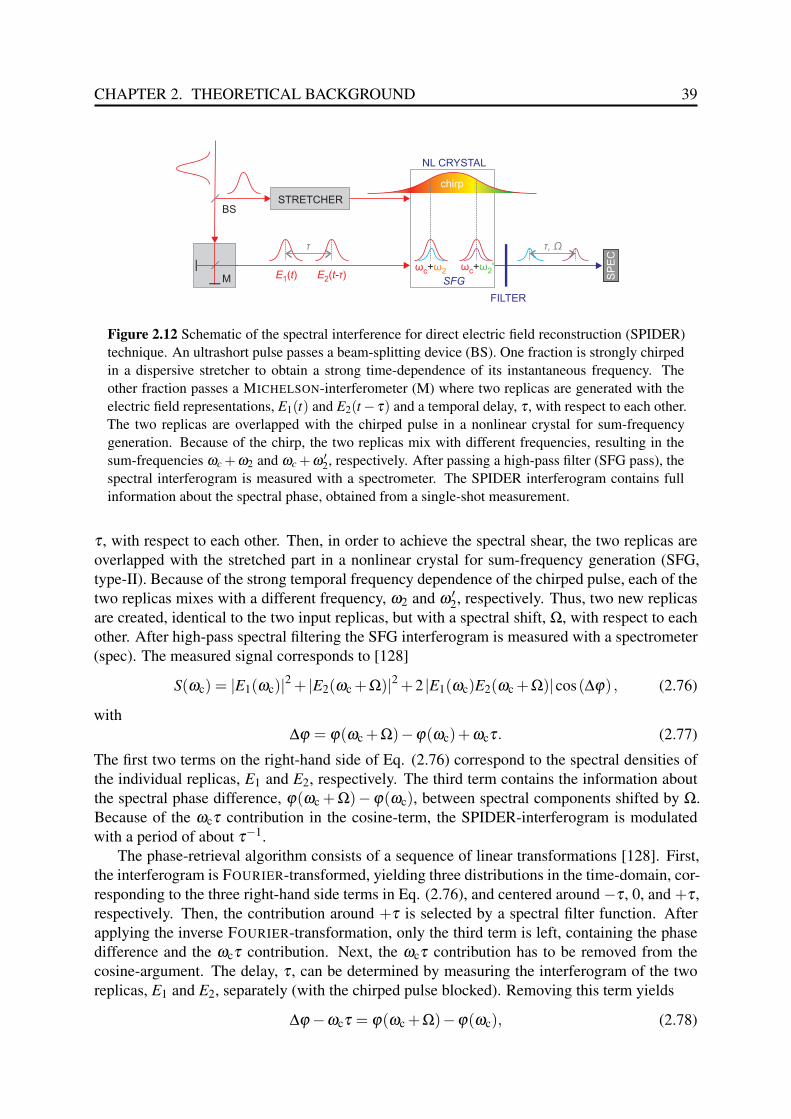
CHAPTER 2. THEORETICAL BACKGROUND 39
τ
E t-2( )τE t( )1 SFG SP
EC
τ Ω,
M
STRETCHER
FILTER
BS
chirp
ωc+ω2'ωc+ω2
NL CRYSTAL
SFG
Figure 2.12 Schematic of the spectral interference for direct electric field reconstruction (SPIDER)technique. An ultrashort pulse passes a beam-splitting device (BS). One fraction is strongly chirpedin a dispersive stretcher to obtain a strong time-dependence of its instantaneous frequency. Theother fraction passes a MICHELSON-interferometer (M) where two replicas are generated with theelectric field representations, E1(t) and E2(t −τ) and a temporal delay, τ , with respect to each other.The two replicas are overlapped with the chirped pulse in a nonlinear crystal for sum-frequencygeneration. Because of the chirp, the two replicas mix with different frequencies, resulting in thesum-frequencies ωc +ω2 and ωc +ω ′
2, respectively. After passing a high-pass filter (SFG pass), thespectral interferogram is measured with a spectrometer. The SPIDER interferogram contains fullinformation about the spectral phase, obtained from a single-shot measurement.
τ , with respect to each other. Then, in order to achieve the spectral shear, the two replicas areoverlapped with the stretched part in a nonlinear crystal for sum-frequency generation (SFG,type-II). Because of the strong temporal frequency dependence of the chirped pulse, each of thetwo replicas mixes with a different frequency, ω2 and ω ′
2, respectively. Thus, two new replicasare created, identical to the two input replicas, but with a spectral shift, Ω, with respect to eachother. After high-pass spectral filtering the SFG interferogram is measured with a spectrometer(spec). The measured signal corresponds to [128]
S(ωc) = |E1(ωc)|2 + |E2(ωc +Ω)|2 +2 |E1(ωc)E2(ωc +Ω)|cos(∆φ) , (2.76)
with∆φ = φ(ωc +Ω)−φ(ωc)+ωcτ. (2.77)
The first two terms on the right-hand side of Eq. (2.76) correspond to the spectral densities ofthe individual replicas, E1 and E2, respectively. The third term contains the information aboutthe spectral phase difference, φ(ωc +Ω)−φ(ωc), between spectral components shifted by Ω.Because of the ωcτ contribution in the cosine-term, the SPIDER-interferogram is modulatedwith a period of about τ−1.
The phase-retrieval algorithm consists of a sequence of linear transformations [128]. First,the interferogram is FOURIER-transformed, yielding three distributions in the time-domain, cor-responding to the three right-hand side terms in Eq. (2.76), and centered around −τ , 0, and +τ ,respectively. Then, the contribution around +τ is selected by a spectral filter function. Afterapplying the inverse FOURIER-transformation, only the third term is left, containing the phasedifference and the ωcτ contribution. Next, the ωcτ contribution has to be removed from thecosine-argument. The delay, τ , can be determined by measuring the interferogram of the tworeplicas, E1 and E2, separately (with the chirped pulse blocked). Removing this term yields
∆φ −ωcτ = φ(ωc +Ω)−φ(ωc), (2.78)
40 CHAPTER 2. THEORETICAL BACKGROUND
the phase-difference between the frequency intervals separated by Ω, which is proportional tothe group delay,
∆φ = Ωdφdω
. (2.79)
The spectral phase is obtained by integration
φ(ω) =− 1Ω
∫ ω
0∆φ(ω ′)dω ′. (2.80)
Finally, the spectral and temporal pulse properties are fully characterized by separately mea-suring the fundamental pulse spectrum, |E1(ω)|2. The temporal representation is obtained byFOURIER-transformation. According to the NYQUIST sampling limit, the pulse is reconstructedexactly if the spectral shear is smaller than Ω < 2π/τN , with τN being the temporal windowover which the pulse has a non-zero finite energy. Also using the SPIDER technique, the phase-matching bandwidth of the non-linear crystal must be larger than the spectral bandwidth of thepulse to be characterized. Another common technique is the frequency-resolved optical gating(FROG). Using this technique, a two-dimensional spectrogram is recorded,
S(ω,∆t) =∣∣∣∣∫ +∞
−∞E(t)G(t −∆t)e−iω tdt
∣∣∣∣2 , (2.81)
with a gating function, G(t−∆t), provided by an ultrafast nonlinear process, mostly involving asecond-order nonlinearity or a KERR-nonlinearity triggered by a replica of the pulse to be mea-sured. As the measured spectrogram corresponds to a two-dimensional phase retrieval problemwith an unambiguous solution, an iterative algorithm is applied. The experimental setup andthe retrieval algorithm is described in detail in [129, 130].

Chapter 3
Single-shot pulse duration measurementsat XUV and X-ray free-electron lasers
The performance of time-resolved experiments at XUV and X-ray free-electron lasers can bestrongly improved by reliable characterization of the temporal FEL pulse properties. Knowl-edge of the temporal characteristics of laser pulses and FEL pulses is of crucial importance formost time-resolved experiments. Foremost, pulse-duration sensitive experiments, such as non-linear light-matter interactions, require detailed knowledge about the FEL intensity envelope,IFEL(t). But also for FEL scientists it is important to access temporal photon pulse propertiesin order to study the influence of machine parameters on the amplification process and to gaincontrol over the FEL pulse properties. Time-resolved studies of ultrafast processes in pump-probe experiments using an optical pump and an XUV/X-ray probe pulse (or vice versa) areresolution-limited not only by the pulse durations, but also by pulse arrival time jitter.
SASE FELs suffer from pulse-to-pulse fluctuations. This affects also the temporal pulseproperties. As explained in Section 1.3, SASE FEL pulses consist of multiple longitudinalmodes, i.e. the temporal structure may feature a number of intensity maxima, depending on thenumber of modes. This number of modes as well as the individual mode intensity vary fromshot to shot. If a pump-probe experiment is carried out using an optical laser pulse and an FELpulse, also the synchronization between both pulses fluctuates statistically. This fluctuationof the time delay has various origins at an FEL, with its overall dimension of hundreds ofmeters. For example, the electron bunch arrival jitters due to the jitter of the radio-frequencydrivers of the acceleration modules. The statistical SASE process itself introduces jitter, aswell as the electronic synchronization between the optical master clock and the pump-probelaser. Optical path length drifts in the pump-probe amplifier and of the photon beam lines dueto environmental changes (temperature, humidity, pressure) cause additional drift. At FLASH,the synchronization jitter at the experimental hall is typically about 100 fs [29–31] and can bereduced to sub-30 fs rms by optical synchronization or external seeding [32, 33].
Single-shot diagnostic methods are required to characterize the temporal structure and thearrival time of single FEL pulses. In this work, a technique for the FEL pulse duration andarrival time measurement [31, 45, 60–65] was developed further. The method provides highflexibility compared to other methods developed so far [40–44, 46–51] and offers the potentialfor high-resolution measurements of complex FEL pulse shapes for a broad range of wave-lengths. Furthermore, promising measurements on ultra-thin samples show the capability forsingle-shot online measurements during an experiment.
41

42CHAPTER 3. SINGLE-SHOT PULSE DURATION MEASUREMENTS AT XUV AND
X-RAY FREE-ELECTRON LASERS
3.1 Measuring the FEL pulse duration: an overviewMeasuring the duration of ultrashort pulses in the XUV and X-ray regime is challenging. Directoptical correlation methods or phase-sensitive techniques that are common in the visible regimecannot be easily adapted. The availability of required optics and optical materials is limitedand by far not comparable to the visible regime. Experiments in the XUV must be realizedunder vacuum conditions, due to the strong absorption cross-sections of air. Pulse durationmeasurements are thus a topic of active research and various direct [40–46] and indirect [47–51] methods exist. However, most of those experimental implementations are highly invasiveand cannot be performed simultaneously with other pump-probe experiments.
The direct techniques are complex experiments on their own. For autocorrelation measure-ments [42, 43], multi-photon ionization of atomic transition levels in gaseous targets are usedas nonlinear process. The correlation signal is measured by detecting the electron current with atime-of-flight spectrometer. The two pulse replicas are generated using specially designed split-and-delay optics. For cross-correlating XUV pulses with optical laser pulses the same method isapplied [44, 52]. Owing to the discrete atomic transition levels, certain limitations exist concern-ing the photon energies and the range of measurable pulse durations. A further disadvantage isthat these methods average over many pulses and are thus no single-pulse diagnostics.
A very promising single-pulse method is the light-field streaking [40, 41, 45, 53]. Photo-electrons are detected, generated by XUV/X-ray absorption of the single FEL pulse. The vectorpotential of a strong terahertz-field is used to accelerate the photoelectrons, which leads to astreaking of the measured time-of-flight spectra. The spectral broadening contains informa-tion about the intensity and the frequency chirp of the FEL pulse. However, generating strongterahertz field amplitudes requires either a dedicated terahertz undulator in the FEL beamline[54, 55] or an external source, based on parametric conversion of an optical laser pulse [56, 57].
3.2 Single-shot cross-correlatorSeveral methods exist for the arrival time measurement. One category of diagnostics is designedonly to measure the arrival time of the electron bunches with respect to the pump-probe laser[131–133]. But in this case, the jitter within the optical beamlines is omitted, because thespatial distance between the undulator section and actual experiment is too large. Anothercategory of diagnostics is to directly measure the timing of the XUV pulses at the experimentalstation [31, 45, 58, 60–65, 134]. In this work, the concept of a temporal diagnostic, based on asolid-state cross-correlation [31, 45, 60–65], is further developed. The method was first testedat FLASH using GaAs targets for single-shot arrival time measurements and for determiningan upper limit for the FEL pulse duration [31, 58, 60]. The novelty of this work is to showthe possibility to extract the FEL intensity envelope and thus the actual pulse duration. Themeasurements were performed using fused silica glass and Si3N4 samples. A correspondingtheoretical model of the ionization process is presented, supported by a numerical Monte-Carlomodel. It is shown that the measured signal is similar to an optical-to-XUV cross-correlation inthe sense that a signal related to the FEL intensity envelope is sampled with an ultrashort opticalprobe pulse. The method works for a wide range of XUV and X-ray wavelengths and for pulsedurations ranging from few femtoseconds to hundreds of femtoseconds. The experiment wascarried out at the XUV free-electron laser FLASH.
The experimental setup is shown in Fig. 3.1a. The spatial encoding principle is shown in

CHAPTER 3. SINGLE-SHOT PULSE DURATION MEASUREMENTS AT XUV ANDX-RAY FREE-ELECTRON LASERS 43
XUV p
ulse
IR probelaser pulse
x0
x1
t1
t0
CCDδ
x
microscope objective
target sample
z
100
20 30 50 6040
-100
0
-200
10
dela
y(f
s)
Δt
shot number
20
60
100
140
x(µ
m)
c
b
FEL
objective
δ
CCD
IR probelaser
tele
scope
a
vacuumchamber
sample
Figure 3.1 Setup and principle of the single-shot cross-correlator. (a) Schematic experimental setup.The sample (fused silica, Si3N4, mounted on a motorized 3-dimensional translation stage) is placedin the focus of the FEL beam, which is incident under the angle δ with respect to the sample surface.The FEL intensity is about IFEL = 1012Wcm−2. The near-infrared probe laser is largely collimatedand illuminates the interaction area of FEL and sample surface homogeneously and with low inten-sity under normal incidence. The sample surface is imaged on a CCD using a microscope objective.(b) Principle of the spatial encoding setup. Different transverse positions on the sample, x0 and x1,are mapped to different points in time, t0 and t1, respectively. The sample is originally transparentfor the near-infrared probe laser, but becomes opaque after ionization with the XUV pulse. Thischange of transparency is probed by the near-infrared laser pulse under normal incidence, propagat-ing along z. The transmitted intensity is imaged onto a camera (CCD). (c) Series of 68 single-shotmeasurements. The the decrease in optical transmission (grey shading) along transversal axis, x, isdue to the XUV absorption. The turning point of the absorption occurs at a different position in eachshot, depending on the temporal delay, ∆t, between the FEL pulse and the near-infrared pulse.

44CHAPTER 3. SINGLE-SHOT PULSE DURATION MEASUREMENTS AT XUV AND
X-RAY FREE-ELECTRON LASERS
Fig. 3.1b. The FEL XUV pulse is focused on the sample (fused silica glass or Si3N4) undera shallow angle, δ , with respect to the sample surface. The FEL intensity is about IFEL =1012Wcm−2. Due to absorption and photoionization caused by the FEL at the sample surface,the sample transmission is changed. The interaction geometry with the shallow angle projectsthe absorption of the FEL pulse at different moments in time to different transverse positions onthe sample surface. Therefore, the different positions, x0 and x1, are mapped to correspondingpoints in time, t0 and t1. The spatio-temporal mapping, t 7→ x, is defined by
t =xc0
cos(δ ), (3.1)
where c0 is the vacuum speed of light. The observable temporal window, ∆T and the temporalresolution, δ t depend on the angle δ and the FEL beam diameter, dx,
∆T =dx
c0 tan(δ ). (3.2)
For example, with an FEL beam diameter of dx = 100µm, the temporal window is 1.3ps atδ = 14.2 and 334 fs at δ = 45.
The temporal resolution, δ t, depends on the imaged spatial resolution, δx, according to Eq.(3.1). The sample surface is imaged by a microscope objective1 onto a progressive scan charge-coupled device camera2. The imaging resolution was calibrated using a periodic micrometermask3, yielding δx = 3µm. According to Eq. (3.1), the temporal resolution given by theimaging resolution is δ t = 10fs at δ = 14.2 and δ t = 7fs at δ = 45.
The FEL penetrates the sample surface and causes photoionization. Hence, a high density ofenergetic free-electrons evolves during the FEL irradiation. The free-electron plasma changesthe refractive index for visible frequencies (as explained in Section 2.5.5), changing the sampletransmission. This transmission change is probed with an ultrashort optical laser pulse undernormal incidence. It is largely collimated (a few millimeters FWHM) to achieve a homogeneousillumination of the ionized region. The laser intensity is must be only sufficient to illuminatethe CCD. Because of the spatio-temporal encoding, both, the spatial near-field beam profile ofthe probe laser and the FEL focus, should be as homogeneous as possible, ideally top-hat, toreduce spatial features. The background correction is described in Section 3.4.1.
The optical pulse will be partly reflected and absorbed, depending on the electron density,ne(t), causing a shading of the transmitted light imaged onto the CCD. At FLASH, the pump-probe Ti:sapphire amplifier was used for the experiments (Coherent Hidra), which operatesat 10 Hz repetition rate. The pulse duration was measured with a single-shot second-orderautocorrelator (Coherent SSA), yielding τL = (64 ± 7) fs at the central wavelength of λL =800nm. The measured signal after transmission is given by the cross-correlation,
S(∆t) =∫ +∞
−∞G(t)IL(t −∆t)dt. (3.3)
where G(t)∈ (0,1) represents the optical transmission function (transmission of the free-electronplasma), IL(t) is the intensity envelope of the probe laser pulse, and ∆t is the temporal delaybetween the FEL and the optical laser pulse. With the spatio-temporal encoding setup, ∆t is
1Mitutoyo M Plan APO NIR, numerical aperture NA = 0.52CCD, Basler A311f, 659×494 pixels318 line-space cycles per millimeter

CHAPTER 3. SINGLE-SHOT PULSE DURATION MEASUREMENTS AT XUV ANDX-RAY FREE-ELECTRON LASERS 45
mapped to the spatial x-axis, allowing for single-shot measurements. Using a sufficiently shortoptical probe pulse, the transmission function can be obtained via a deconvolution. The evolu-tion of the optical transmission contains information about the temporal evolution of the FELintensity, G(t) = G [IFEL(t)]. To extract this information, a detailed study of the photoionizationdynamics and its influence on the optical properties was performed, as presented in sections3.3.1 and 3.3.
The temporal delay, ∆t, is directly obtained from the raw measurements for each shot. As anexample, in Fig. 3.1c a series of 68 single shots is shown, measured on fused silica. Here, thegrey shading indicates the transition from full transmission (yellow) to opacity (grey shaded).The transversal sample position, x, where this transition occurs, represents the time delay, ∆t,and can be defined by a transmission threshold. In the presented measurements, the thresholdwas 20% of the total transmission change, to be clearly distinguished from noise. An errorfunction fitting procedure can also be used [65]. In Fig. 3.1c, some measurement points are outof the temporal window (for example, shot number 10), because the temporal window was onlyabout 330 fs, at the angle δ = 45 and about 100 µm FEL beam diameter. The application of thissolid-state cross-correlation method for arrival time measurements was throughout investigatedin several works [31, 45, 60–65]. For example, a resolution improvement to sub-10 fs wasattained during an optical/X-ray pump-probe experiment using a similar technique (see alsoIntroduction, Section 1.2) [65]. Because this has been thoroughly investigated, the presentwork is focused on simultaneous duration measurements.
3.3 Physical model and data evaluationA comprehensive theoretical model was developed to evaluate the measured cross-correlations,S(∆t). In order to understand the relation between the transmission function, G(t), and theFEL intensity envelope, IFEL(t), first, the relation between FEL absorption and free-electrondensity was studied using a dedicated Monte-Carlo simulation. In a next step, the plasma re-fractive index was calculated to model the optical transmission due to reflection and absorptionof the optical probe pulse. Finally, theoretical cross-correlations for given FEL and optical laserparameters could be fitted to the experimental data.
3.3.1 Monte-Carlo simulationA dedicated Monte-Carlo simulation (see Section 2.5.2) was performed by N. MEDVEDEV fromthe Center for Free-Electron Laser Science (CFEL) in order to study the ionization dynamicswithin fused silica. The increase of the electron density was simulated during the irradiationwith an XUV pulse with 80 fs FWHM pulse duration and at different pulse energies and wave-lengths. The result at λFEL = 5.5nm (photon energy 214.2 eV) is presented in Fig. 3.2a. Theintensity is about IFEL = 2.45 · 1012 Wcm−2, corresponding to a fluence of F = 0.21Jcm−2.The electron density, ne(t), increases proportionally with the integrated intensity, reachinga final density of 5 · 1021 cm−3. The simulation was also performed at λFEL = 13.6nm andλFEL = 41nm. In Fig. 3.2b, the electron density, ne, is plotted in dependence on the fluence (theintegrated intensity) the different simulated FEL wavelengths and pulse energies: λFEL = 5.5nm(214.2 eV), EFEL = 20µJ, F = 0.21Jcm−2 (black); λFEL = 13.6nm (86.6 eV), EFEL = 6µJ,F = 0.048Jcm−2 (dashed blue); λFEL = 41nm (28 eV), EFEL = 40µJ, F = 0.12Jcm−2 (red).The gray shaded area represents the experimental conditions. As a very important conclusion,

46CHAPTER 3. SINGLE-SHOT PULSE DURATION MEASUREMENTS AT XUV AND
X-RAY FREE-ELECTRON LASERS
linear absorption can be assumed for fluences smaller than F < 0.05Jcm−2. At 41 nm, theelectron density starts to increase nonlinearly for F > 0.1Jcm−2. Nonlinear effects arise fromPAULI’s principle and the photoabsorption of excited electrons (see Section 2.5.2).
0 0.05 0.1 0.15 0.2 0.250
0.5
1
1.5
2
2.5
0.0
0.5
1.0
1.5
2.0
2.5
FEL fluence
time (fs)t
0
0.1
0.2
0.3
0.4
0.5
el density
FE
Lin
tensity (
)I
tF
EL
(10
Wcm
)12
-2
0 50 100 150 200 250 300ele
ctr
on d
ensity
ne
(10 cm
)
22
-3
fluence (Jcm )F-2
ele
ctr
on d
ensity
ne
(10 cm
)
22
-3
41 nm, 40 µJ
13.6 nm, 6 µJ
5.5 nm, 20 µJ
experim
ent
a b
Figure 3.2 Monte-Carlo simulation of the free-electron density, ne(t), generated by photoionizationwithin fused silica during the irradiation with an ultrashort XUV pulse. (a) Temporal evolution ofan 80 fs FEL pulse at 5.5 nm (grey shaded) and corresponding electron density (blue line). Theelectron density is proportional to the integrated FEL pulse. (b) Dependence of the electron densityon the FEL fluence for different wavelengths: λFEL = 5.5nm, EFEL = 20µJ (black); λFEL = 13.6nm,EFEL = 6µJ (blue dashed); λFEL = 41nm, EFEL = 40µJ (red). The gray shaded area represents theexperimentally used FEL pulse fluences F < 0.05Jcm−2 where linear absorption can be assumed.Simulation performed by N. MEDVEDEV (CFEL). Published in [2].
3.3.2 Calculation of electron density
According to the findings in section 3.3.1, the electron density grows linearly with the absorbedFEL photon flux,
Φph =F
hωFEL. (3.4)
This allows to find an analytical expression to obtain the electron density as a function of theFEL intensity. With a given absorption coefficient, αFEL, the FEL penetrates the sample materialby the penetration depth 1/αFEL along the z-axis and absorption takes place according to theBEER-LAMBERT law:
IFEL(t,z) = IFEL(t) · e−αFEL·z. (3.5)
So, for each point on the time axis, t ′ (sample x-axis), a certain amount of photons is absorbed.The photon flux within the material is obtained by temporal integration over the pulse,
Φph(t,z) =1
hωFEL
∫ t
t0IFEL(t ′,z)dt ′
= Φph(t) · e−αFEL·z.
(3.6)

CHAPTER 3. SINGLE-SHOT PULSE DURATION MEASUREMENTS AT XUV ANDX-RAY FREE-ELECTRON LASERS 47
The initial flux is zero, Φph(t0) = 0. Using Eq. (2.58), the obtained photon distribution withinthe sample is used to calculate the electron density caused by photoionization:
ne(t,z) =hωFEL
Eeg
∣∣∣∣∂Φph(t,z)∂ z
∣∣∣∣=
hωFEL
EegΦph(t) ·αFELe−αFEL·z
(3.7)
According to Eq. (3.7), it is assumed that the electron density instantaneously follows theintegrated FEL intensity envelope. According to the findings in Section 2.5.4, this assumption isvalid for the photon energies used in the experiment (< 1keV). In Fig. 3.3 the two-dimensionalelectron distribution, ne(t,z), is plotted, calculated according to Eq. (3.7) for the irradiation offused silica with a 50 fs GAUSSIAN FEL pulse at 5.5 nm wavelength. For each point in time, anexponentially decaying electron density profile is obtained. The thickness of this plasma layeris obtained from the penetration depth of the FEL, 1/αFEL = 144nm.
-100 -60 -200
100
200
300
400
500
600
700
depth
(nm
)z
electron density ( , ) (cm )n t ze-3
x1021
0.0 0.5 1.0 1.5 2.0 2.5nc
FE
Lin
tensity
((a
.u.)
It)
FE
L
0
0.5
1.0
FE
Lin
tensity
((a
.u.)
It)
FE
L
0.0
0.2
0.4
0.6
0.8
1.0
optical tr
ansm
issio
n(
Gt)
0.4
0.8
1.0
time (fs)t
0.0-50-100 50 100
0.6
I t)FEL(
G t)(
I t)FEL(
a b
0 20 40 60 80 100-40-80
time (fs)t
Figure 3.3 Simulation of the transmission function, G(t). (a) Two-dimensional electron densityprofile, ne(t,z), during the irradiation with a 5.5 nm FEL pulse, represented by its intensity envelope,IFEL(t) (white line). The critical electron density for an optical probe laser with λL = 800nm isnc = 1.7 ·1021 cm−3. The z-axis denotes the propagation axis of the optical laser and the penetrationdepth of the FEL. (b) Transmission function G(t) (red line) for an optical laser calculated from theelectron density in (a). The FEL intensity is also shown (black line).
3.3.3 Optical transmission functionAn optical laser probing the transmission of this sample will be partly reflected and absorbed.The sample transmission depends on the evolution of the FEL pulse on the time axis. Fort < 0fs, the transmission is high, owing to a low electron density. For t > 0, the transmissionis low, owing to a high electron density. The resulting time-dependent transmission function,G(t), is obtained by calculating the optical properties of the free-electrons. The time axis and the
48CHAPTER 3. SINGLE-SHOT PULSE DURATION MEASUREMENTS AT XUV AND
X-RAY FREE-ELECTRON LASERS
propagation axis are discretized in finite steps, tm and z j. For each step, the complex refractiveindex, n(tm,z j) =
√ε(tm,z j), is calculated from the corresponding electron density (Eq. 2.70),
n2(tm,z j) = 1−ne(tm,z j)
nc
(1
1+ f (tm,z j)2 + if (tm,z j)
1+ f (tm,z j)2
). (3.8)
For the single time-steps, the transmission of the optical laser is calculated using the transfer-matrix method [135, 136]. The refractive index gradient is approximated by a sequence of thinlayers of thickness z( j+1)− z j = 1nm. Taking into account the FRESNEL reflection, transmis-sion, absorption and interference effects between each z j and z( j−1), the propagation of theoptical prope pulse is described by the transfer matrix, M = ∏ j M j. Here, M j is the transfermatrix of a single thin layer. The procedure is explained in detail in Appendix B. At each timestep, the plasma transmission function, G(t), is obtained, as shown in Fig. 3.3. When the probepulse arrives earlier than the FEL pulse, i.e. when no free-electrons are present, the transmissionfunction is G(t ≪ 0) = 1. That means that all light from the optical probe pulse is transmitted.The constant reflection at the sample surfaces is neglected. Correspondingly, in that case wenormalize the cross-correlation to S(∆t ≪ 0) = 1. When the probe pulse arrives a few picosec-onds after the FEL pulse, it will be partially reflected and absorbed due to the optical propertiesof the free-electron plasma. The signal will remain on a constant level, S(∆t ≫ 0) = const. < 1.During the experiments, this constant transmission remained unchanged for a few picoseconds.The plasma can therefore be assumed to be stable. The actual cross-correlation measurementis obtained when both pulses overlap within the temporal window. In that case, the signalundergoes a transition from S(∆t < 0) = 1 to S(∆t > 0) = const. < 1.
3.3.4 Fitting algorithm
A start-to-end simulation was developed using the numerical procedure described in Section 3.3to retrieve the FEL pulse structure from a measured cross-correlation. A schematic chart of themodel is displayed in Fig. 3.4. First, an FEL pulse is defined by wavelength, pulse energy,beam size and intensity envelope, IFEL(t). Second, the electron density profile, ne(t,z), is cal-culated according to Eq. (3.7). From the electron density, the refractive index profile, n(t,z),is calculated according to Eq. (3.8). Third, using the transfer matrix method, the optical trans-mission function, G(t), is obtained for the particular FEL pulse shape. Fourth, the transmissionfunction,G(t), is cross-correlated with the optical laser, IL(t), according to Eq. (3.3). Thecalculated cross-correlation, S1(∆t), is fitted to the measured data, S(∆t), by optimizing theleast-square residual error,
[∆ f (∆t)]2 = [S1(∆t)−S(∆t)]2 , (3.9)
using a trust-region-reflective algorithm [137]. The fitting parameters are given by the FELpulse parameters mentioned above. For evaluating the experimental data, a GAUSSIAN FELpulse is assumed, because the probe pulse duration is too long to resolve detailed pulse structure.The GAUSSIAN pulse represents the temporal distribution obtained by averaging over manypulses that consist of multiple longitudinal SASE modes [41, 47]. Hence, the FWHM pulseduration, τFEL, is the main fitting parameter to be optimized.

CHAPTER 3. SINGLE-SHOT PULSE DURATION MEASUREMENTS AT XUV ANDX-RAY FREE-ELECTRON LASERS 49
pulse durationarrival timeintensityI tFEL( )
el. density
refractive index
n t z
n t z
e( , )
( , )
transmissionG t( )
t
t
L
FEL
pulse shapeI tL( )
fit to measured
square error
[ - ]²S t( )Δ S t1( )Δ
[ ( )]Δf x ²
FEL fit parameters
Probe laser parameters
~
ò
ò
linear absorption
transfer matrixmethod
cross-correlation S t t1(Δ )= dI t- tL( )xΔ G t( )
X
op
tim
iza
tio
n o
f[
()]
Δf
z²
n I t te FEL~ ( )d
Figure 3.4 Simulation algorithm. Initially, an FEL pulse intensity profile, IFEL(t), is defined withproper variable parameters. This pulse is used to calculate the electron density, ne(t,z), and the re-fractive index, n(t,z), within the sample. The plasma transmission function, G(t), is calculated usingthe transfer matrix method. This function is cross-correlated with the intensity of the optical laser,IL. The resulting cross-correlation, S1(∆t), is fitted to the measured signal, S(∆t), by optimizing thesquare error, [∆ f (x)]2, with varying FEL pulse parameters. For the measurements in this work, theFEL pulse was defined as a GAUSSIAN pulse and the fitting parameters were the pulse duration, thepulse energy and the beam diameter.

50CHAPTER 3. SINGLE-SHOT PULSE DURATION MEASUREMENTS AT XUV AND
X-RAY FREE-ELECTRON LASERS
3.4 Single-shot measurementsIn the following, the data processing is explained, i.e. the extraction of the cross-correlationsignal from the raw measurement (see Fig. 3.5). Afterwards, single-shot pulse duration mea-surements are presented. For the optical laser, a GAUSSIAN intensity envelope was assumed.Its pulse duration of τL = (64±7) fs was measured using an intensity autocorrelator (CoherentSSA).
3.4.1 Data processingFirst, the CCD images are corrected for the probe-laser background (without FEL pulse). Sec-ond, the correlation images are corrected for the FEL spatial profile. To this end, a referenceimage is acquired with the FEL pulse arriving significantly earlier than the probe pulse. Thereference image is shown in Fig. 3.5a with inverted colors. Black color corresponds to full opti-cal transmission, yellow corresponds to optical opacity. The opacity distribution is the footprintof the spatial FEL beam profile, representing the stable free-electron density after ionization.Third, the actual images that contain the correlation are acquired at temporal overlap of the FELand the optical pulse. An example of a correlation signal is shown in Fig. 3.5b. There is asmooth transition between full transmission (black) and opacity (color bar). Before the refer-ence is subtracted from the image, a region of interest (ROI) is chosen, indicated by the greyboxes in Figs. 3.5a and b. By integration over the vertical axis, y, lineouts are calculated, asshown in Fig. 3.5c for the reference (lineout A, grey) and the signal (lineout B, light red). Thecross-correlation is extracted by normalization:
S(∆t) = 1− 1−B1−A
· [1−min(B)] , (3.10)
with the factor (1−min(B)) accounting for the constant transmission level after the FEL pulse.The final cross-correlation is also shown in Fig. 3.5c (red line, blue rectangles). Due to pointingjitter of the FEL on the sample, a spatial alignment of the cross-correlation image with respectto the reference image might be required.
The ultrafast relaxation of the electron density within 150 fs, which has been reported inother studies using fused silica [119, 120], could not be observed. In the present experiments,the transmission remained at a constant level even for a delay of a few picoseconds. In previousworks, the relaxation was associated with the formation of self-trapped excitons, leading toa rapid capture of free carriers [138]. In the present work, the photoionization was triggeredby linear absorption of an intense XUV pulse. According to the theoretical calculations, theelectron density was up to two orders of magnitudes higher compared to the other experiments.Hence, it is postulated that, under the experimental conditions in the present work, a breakingof excitons occurred due to collisions with high energetic electrons within the conduction band[2]. The interpretation is supported by other studies, where it has been shown that excitons,which were formed by low fluence XUV radiation, can be destroyed by multiphoton absorptionof a optical pulse [139].
3.4.2 Target material: fused silicaThe first measurements were performed using a 1 mm thick fused silica slide as target. TheFEL was operated at two distinct wavelengths, λFEL. The first measurements were carried

CHAPTER 3. SINGLE-SHOT PULSE DURATION MEASUREMENTS AT XUV ANDX-RAY FREE-ELECTRON LASERS 51
y(µ
m)
10
20
x (µm)
y(µ
m)
10
20
300.6
0.7
0.8
0.9
1
x (µm)
no
rma
lize
d in
ten
sity
a
b
0
c
0.8
1.0
0.6
0.8
1.0
0.6
A lineout of (a)
B lineout of (b)
S t B A B( ) = 1-(1- )/(1- )*(1-min( ))D
A
B
0
40 50 60 70 80 90
20 90
10
20
10
20
0
0
20 40 60 80
0.8
1.0
0.6
x (µm)
y(µ
m)
y(µ
m)
d
e
0.8
1.0
0.6
10 30 40 50 60 70 800 0
Figure 3.5 Cross-correlation measurement, S(∆t). (a) and (b) CCD images of the probe laser trans-mission along the transverse coordinate x on the sample for different delays between probe pulse andFEL pulse (notice: inverse color scale). In the top image (a), the probe pulse arrived a few picosec-onds after the FEL. Because the plasma was fully evolved and stable within this temporal window,the measurement was used as reference to correct for the spatial FEL profile. In the signal image(b), both pulses arrived simultaneously. Resultingly, the transient change of transmitted intensityduring the absorption of the FEL pulse was measured. (c) Reconstruction of the cross-correlationS(∆t). Within the region of interest (grey boxes in (a) and (b)), lineouts were calculated for thereference (A, red line) and the signal (B, grey line) by integration over the vertical axis, y. The cross-correlation was obtained by inverting the signal lineout by 1−B and normalizing it with respect to1−A. The multiplication with 1−min(B) accounted for the constant transmission level after thetransient edge, which was min(B) = 0.7 in the present case. Published in [2]. (d) Reference imagein linear greyscale (white: full optical transmission, black: 60% optical transmission). (e) Signalimage in linear greyscale.

52CHAPTER 3. SINGLE-SHOT PULSE DURATION MEASUREMENTS AT XUV AND
X-RAY FREE-ELECTRON LASERS
out at λFEL = 41.5nm, the second measurements were carried out at λFEL = 5.5nm. For allmeasurements, the free-electron laser was operated in a 10 Hz single-pulse mode. The FELpulse energy was measured with the gas-monitor detector (GMD [140]).
At the FEL wavelength of λFEL = 41.5nm, the electron bunch charge was Q = 0.5nC andthe average pulse energy was EFEL = (84±4)µJ. The fluence was about F ≈ 0.05Jcm−2. TheFEL was incident with an angle δ = 45, with respect to the sample surface. A single-shotmeasurement is presented in Fig. 3.6a (white rectangles). The fitted cross-correlation (blueline) is obtained by optimizing the pulse duration of a GAUSSIAN pulse in the start-to-endsimulation (see Section 3.3.4). In this case, the pulse duration is τFEL = (184±14) fs FWHM.The data scattering originated from FEL pulse energy and beam profile fluctuations between thereference image acquisition and the actual measurement.
At the FEL wavelength of λFEL = 5.5nm, the electron bunch charge was Q = 0.25nC andthe average pulse energy was EFEL >= (29± 10)µJ. The fluence was about F ≈ 0.05Jcm−2.Because of a smaller beam diameter, the FEL was incident with an angle δ = 14.2, with re-spect to the sample surface. A single-shot cross-correlation measurement is displayed in in Fig.3.6b (white rectangles). The fitted cross-correlation (blue line) corresponds to a GAUSSIAN
pulse with τFEL = (21±19) fs. Here, the uncertainty was mainly determined by the long pulseduration of the optical probe laser (see error analysis in Sec. 3.5). Due to the strong absorption
0.8
0.9
1.0 measured
fit
cro
ss-c
orr
ela
tion
()
St
Δ
delay (fs)Δt
a b
data scattering
0-50 50 100 150-100 0-50 50 100-100
0.8
0.9
1.0
0.7
cro
ss-c
orr
ela
tion
()
St
Δ
measured
fit
data scattering
delay (fs)Δt
Figure 3.6 Single-shot cross-correlations using fused silica samples. Measured (white rectangles)and fitted (blue line) curves are shown. (a) FEL wavelength of 41.5 nm, bunch charge of 0.5 nC.The resulting pulse duration is τFEL = (184± 14) fs. (b) FEL wavelength of 5.5 nm, bunch chargeof 0.25 nC. The resulting pulse duration is τFEL = (21± 19) fs. The grey data scattering originatesfrom the FEL beam profile correction (see text). Published in [2].
of the XUV photons within the target (see Fig. 2.8, p. 32) the total FEL pulse energy wasdeposited. Consequently, changes in the surface morphology were observed after a few tensof pulses. For online pulse duration measurements, fused silica samples should be placed be-hind an experiment to simultaneously measure the pulse duration. Furthermore, they should bemoved to a new position after a few shots.

CHAPTER 3. SINGLE-SHOT PULSE DURATION MEASUREMENTS AT XUV ANDX-RAY FREE-ELECTRON LASERS 53
3.4.3 Target material: silicon nitride membraneTo overcome the limitations of the fused silica samples, ultra-thin silicon nitride (Si3N4) mem-branes were tested4. The FEL was tuned to similar parameters, λFEL = 5.5nm, Q = 0.25nCand EFEL = 2.5µJ. The fluence was about F < 0.01Jcm−2. The pulse energy was adjustedusing the gas attenuator, which is installed at the photon beamline at FLASH. In Fig. 3.7, ameasured single-shot cross-correlation is shown (white rectangles). The fitted curve (blue line)corresponds to a GAUSSIAN pulse with τFEL = (34±19) fs, which is well within the error barscompared to the measurement on fused silica. As the energy deposition was lower within the
measuredfit
delay (fs)Δt
data scattering
cro
ss-c
orr
ela
tion
()
St
Δ
0.8
0.9
1.0
-50 0 50 100
Figure 3.7 Single-shot cross-correlation using the Si3N4 membrane. The measured (white rectan-gles) and fitted (blue line) curves are shown at an FEL wavelength of 5.5 nm, and a bunch charge of0.25 nC. The resulting pulse duration is τFEL = (34±19) fs (see Section 3.5 for error analysis). Thegrey data scattering originates from fluctuations of the FEL beam profile. Published in [2].
Si3N4 sample, as compared to the fused silica sample, the measurements were non-destructive.No change of the membrane morphology was observed, even after a few thousand absorbedpulses. At the sample thickness of 20 nm and the angle δ = 14.2, the optical path of the FELthrough the membrane is only 98 nm. Hence, the absorption interaction length is considerablyreduced. For short wavelengths the calculated XUV transmission through the membrane isabout 15% at 20 nm, 45% at 13 nm 8% at 10 nm and 29% at 5.5 nm. The residually transmittedFEL pulse can be reused for a simultaneous XUV/optical pump-probe experiment.
3.4.4 Discussion on the measured pulse durationThe measured FEL pulse durations are in agreement with theoretical estimations [141]. Withthe electron bunch charges used in the experiment, typical pulse durations are 140–200 fs forSASE pulses lasing at λFEL = 41.5nm. Pulse durations at λFEL = 5.5nm are considerablyshorter than 100 fs, but corresponding measurements are not published so far. The correlationbetween bunch charge and FEL pulse duration is derived from techniques developed earlier,for example, XUV autocorrelation [42, 43], XUV/optical cross-correlation [44, 52], spectralmeasurements and statistical methods [47–51, 141], light field streaking [40, 41, 45, 53]. Thesecomplex techniques were not available on demand for a direct comparison.
4sample dimensions 200×200×0.02µm3.
54CHAPTER 3. SINGLE-SHOT PULSE DURATION MEASUREMENTS AT XUV AND
X-RAY FREE-ELECTRON LASERS
3.5 Error analysis
3.5.1 Resolution and sensitivity
The temporal resolution is ultimately limited by the spatial imaging resolution and the probelaser pulse duration. The imaging resolution is δ t = 7fs at 45 and δ t = 10fs at 14.2 us-ing a applied microscope objective with NA = 0.5 (see Section 3.2). The overall error of themeasurement was evaluated by error propagation,
δ t =√
∆t|2L +∆t|2data. (3.11)
The error of the laser pulse duration is δτL =±7fs. This error stems from the resolution of theautocorrelator device (8 fs per pixel) and from the autocorrelation ambiguities due to uncompen-sated 3rd- and 4th- order dispersion from the grating compressor. The error propagation, ∆t|L, isobtained by varying τL±δτL in the correlation integral (Eq. 3.3). This results in ∆t|L =±7fs atλFEL = 41.5nm and ∆t|L = ±16fs at λFEL = 5.5nm. For the presented measurements, furthererror contributions arise from spatial fluctuations of the data points (including imaging reso-lution) and the assumptions in the start-to-end simulation. The latter includes also the modelsensitivity on physical parameters, such as the electron-ion coupling factor, f , and variations ofthe real electron density distribution, ne(t,y). For example, the algorithm was also carried outfor a rectangular electron density distribution. The deviations are estimated to ∆t|data =±12fsat λFEL = 41.5nm and ∆t|data = ±10fs at λFEL = 5.5nm. In summary, the overall error wasδ t =±14fs at 41.5 nm and δ t =±19fs at 5.5 nm.
3.5.2 Pointing jitter
The influence of the FEL pointing jitter on the time axis can be neglected for two reasons: First,for pulse duration measurements the images are spatially aligned with respect to a referencemeasurement to achieve the FEL beam profile correction. Second, the angular deviation of thewavefront is very small. This point becomes clear when we estimate for example the change ofthe optical path along a l = 10m beamline for a pointing jitter of 100 µm (which is an overesti-mation). The angular deviation would be Θ = atan(100µm/10m) = 10µrad. This results in apath length deviation of
∆l = 100µm · sin(10µrad) = 100nm, (3.12)
corresponding to a temporal deviation of δ t|Θ = 0.33fs.
3.6 Perspectives: reaching the few-fs resolution
In this section, the experimental limits on the temporal resolution of the pulse duration measure-ment are investigated. The physical limitation is given by the response time of the electronicsubsystem during the femtosecond FEL irradiation. In Section 2.5.4, it was concluded that forphoton energies lower than 1 keV the response time is in the few-fs regime. Experimentally, theimaging resolution and the laser pulse duration are the main limiting factors.
CHAPTER 3. SINGLE-SHOT PULSE DURATION MEASUREMENTS AT XUV ANDX-RAY FREE-ELECTRON LASERS 55
3.6.1 Imaging resolutionBecause of the spatio-temporal encoding, the optical imaging resolution of the sample surface isa crucial factor. Microscopic setups can be used to achieve almost diffraction-limited imaging.For example, with a numerical aperture of NA = 0.8 and a laser wavelength of λL = 500nm, animaging resolution of
δx = 0.61λL
NA= 381nm (3.13)
can be attained. According to Eq. (3.1), and an angle of δ = 45, this corresponds to δ t < 1fs.
3.6.2 Dispersive effect on shortest probe pulsesAccording to Eq. (3.3), a probe pulse in form of a DIRAC-delta function would directly returnthe optical transmission function from the measurement. Hence, the probe pulse duration shouldbe as short as possible for a high resolution measurement. Experimentally, an optical pulse du-ration of 4 fs can be achieved, for example by spectral broadening of a 20 fs femtosecond laserpulse in a gas-filled hollow-core fiber (see Section 4.1). An important question is whether suchshort pulses are temporally stretched in a free-electron plasma. Assuming the experimental con-ditions, i.e. λFEL = 5.5nm, the pulse propagates through a 100 nm thin free-electron plasma.The pulse stretching was calculated by FOURIER transformation of an octave-spanning visiblespectrum and the accumulated spectral phase within the plasma. Owing to the marginal thick-ness of the free-electron layer, the pulse will be stretched to 4.1 fs. Thus, the temporal resolutionis not limited on the femtosecond-scale.
3.6.3 Spectral investigation of the gating processAt a given free-electron density, the optical properties strongly depend on the ratio betweenthe plasma frequency and the optical frequency, ω2
P/ω (see Eq. 2.70). Thus, the transmissionfunction must be frequency dependent, G = G(t,ω). This might influence the resolution ofthe measurement. The question is whether different frequency components are gated earlier orlater than others. This is investigated for broad optical spectrum, spanning almost two octaves.Assuming a FOURIER-limited probe pulse (no time-dependence of the optical frequency), themeasured cross-correlation signal can be written as
S(∆t) =∫
t
∫ω
IL(t)G(t −∆t,ω) dtdω
=∫
tIL(t)G′(t −∆t) dt
(3.14)
with the spectrally integrated transmission function,
G′(t −∆t) =∫
ωG(t −∆t,ω) dω, (3.15)
normalized to 1. In Fig. 3.8, optical transmission functions, G(t), are plotted for different opti-cal wavelengths ranging from λL = 400nm (blue line) to λL = 1100nm (grey line), simulatedassuming a 10 fs FEL pulse with λFEL = 5.5nm. The spectrally integrated function, G′(t), isalso plotted (dash-dotted line). While the absolute change of transmission strongly depends onthe ratio ω2
P/ω2, the actual duration of the different transmission curves mainly depend on the
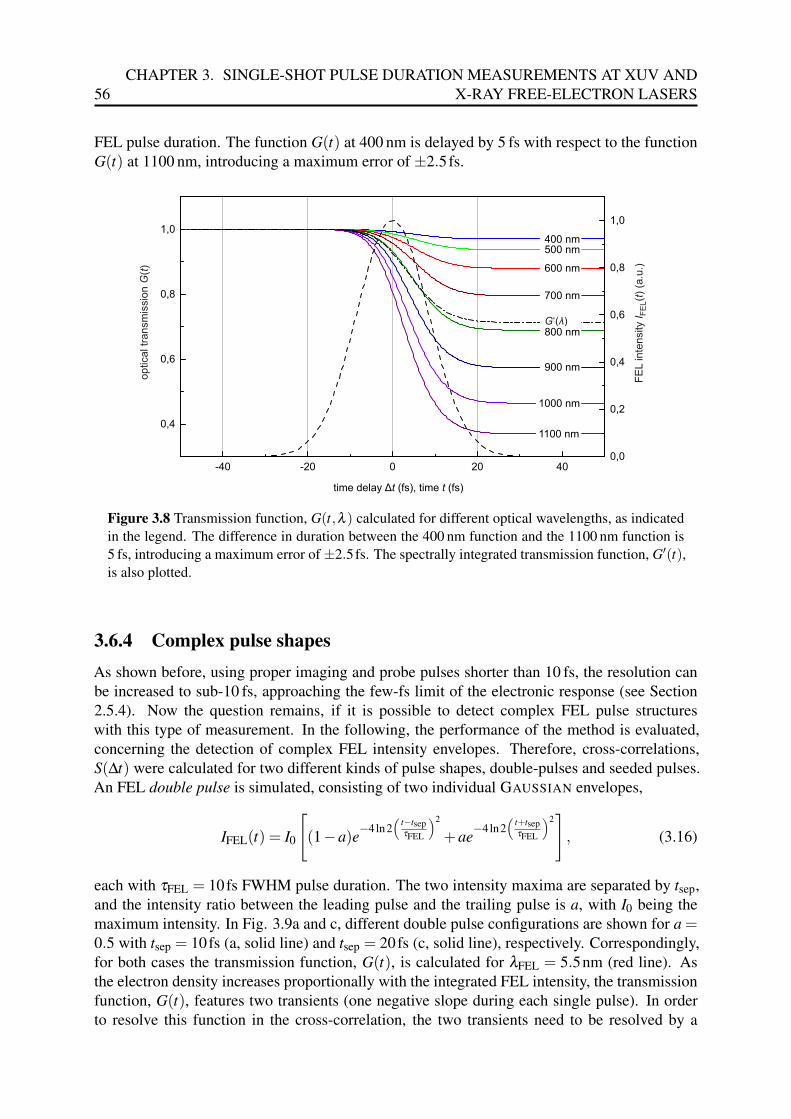
56CHAPTER 3. SINGLE-SHOT PULSE DURATION MEASUREMENTS AT XUV AND
X-RAY FREE-ELECTRON LASERS
FEL pulse duration. The function G(t) at 400 nm is delayed by 5 fs with respect to the functionG(t) at 1100 nm, introducing a maximum error of ±2.5fs.
-40 -20 0 20 40
0,4
0,6
0,8
1,0
time delay (fs), time (fs)Δt t
0,0
0,2
0,4
0,6
0,8
1,0
FE
Lin
tensity
( )
(a.u
.)I
tF
EL
optical tr
an
sm
issio
n(
)G
t
400 nm500 nm
600 nm
700 nm
G‘( )λ
800 nm
900 nm
1100 nm
1000 nm
Figure 3.8 Transmission function, G(t,λ ) calculated for different optical wavelengths, as indicatedin the legend. The difference in duration between the 400 nm function and the 1100 nm function is5 fs, introducing a maximum error of ±2.5fs. The spectrally integrated transmission function, G′(t),is also plotted.
3.6.4 Complex pulse shapesAs shown before, using proper imaging and probe pulses shorter than 10 fs, the resolution canbe increased to sub-10 fs, approaching the few-fs limit of the electronic response (see Section2.5.4). Now the question remains, if it is possible to detect complex FEL pulse structureswith this type of measurement. In the following, the performance of the method is evaluated,concerning the detection of complex FEL intensity envelopes. Therefore, cross-correlations,S(∆t) were calculated for two different kinds of pulse shapes, double-pulses and seeded pulses.An FEL double pulse is simulated, consisting of two individual GAUSSIAN envelopes,
IFEL(t) = I0
[(1−a)e−4ln2
(t−tsepτFEL
)2
+ae−4ln2(
t+tsepτFEL
)2], (3.16)
each with τFEL = 10fs FWHM pulse duration. The two intensity maxima are separated by tsep,and the intensity ratio between the leading pulse and the trailing pulse is a, with I0 being themaximum intensity. In Fig. 3.9a and c, different double pulse configurations are shown for a =0.5 with tsep = 10fs (a, solid line) and tsep = 20fs (c, solid line), respectively. Correspondingly,for both cases the transmission function, G(t), is calculated for λFEL = 5.5nm (red line). Asthe electron density increases proportionally with the integrated FEL intensity, the transmissionfunction, G(t), features two transients (one negative slope during each single pulse). In orderto resolve this function in the cross-correlation, the two transients need to be resolved by a
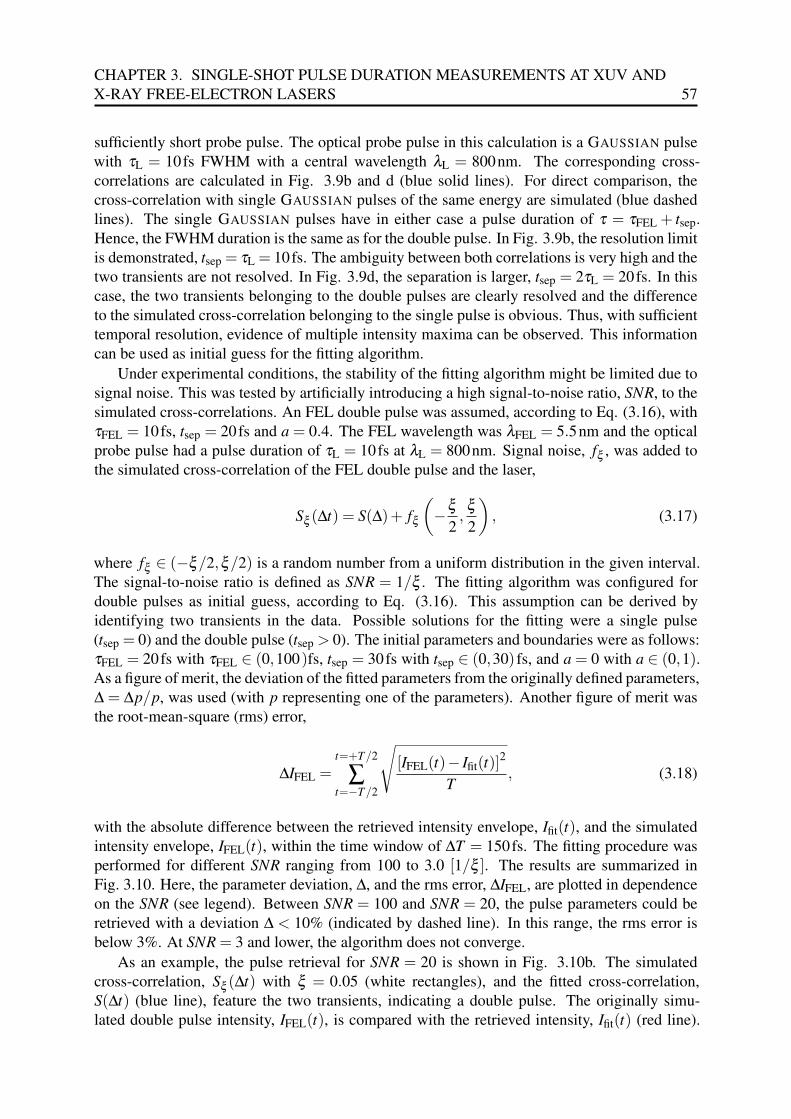
CHAPTER 3. SINGLE-SHOT PULSE DURATION MEASUREMENTS AT XUV ANDX-RAY FREE-ELECTRON LASERS 57
sufficiently short probe pulse. The optical probe pulse in this calculation is a GAUSSIAN pulsewith τL = 10fs FWHM with a central wavelength λL = 800nm. The corresponding cross-correlations are calculated in Fig. 3.9b and d (blue solid lines). For direct comparison, thecross-correlation with single GAUSSIAN pulses of the same energy are simulated (blue dashedlines). The single GAUSSIAN pulses have in either case a pulse duration of τ = τFEL + tsep.Hence, the FWHM duration is the same as for the double pulse. In Fig. 3.9b, the resolution limitis demonstrated, tsep = τL = 10fs. The ambiguity between both correlations is very high and thetwo transients are not resolved. In Fig. 3.9d, the separation is larger, tsep = 2τL = 20fs. In thiscase, the two transients belonging to the double pulses are clearly resolved and the differenceto the simulated cross-correlation belonging to the single pulse is obvious. Thus, with sufficienttemporal resolution, evidence of multiple intensity maxima can be observed. This informationcan be used as initial guess for the fitting algorithm.
Under experimental conditions, the stability of the fitting algorithm might be limited due tosignal noise. This was tested by artificially introducing a high signal-to-noise ratio, SNR, to thesimulated cross-correlations. An FEL double pulse was assumed, according to Eq. (3.16), withτFEL = 10fs, tsep = 20fs and a = 0.4. The FEL wavelength was λFEL = 5.5nm and the opticalprobe pulse had a pulse duration of τL = 10fs at λL = 800nm. Signal noise, fξ , was added tothe simulated cross-correlation of the FEL double pulse and the laser,
Sξ (∆t) = S(∆)+ fξ
(−ξ
2,ξ2
), (3.17)
where fξ ∈ (−ξ/2,ξ/2) is a random number from a uniform distribution in the given interval.The signal-to-noise ratio is defined as SNR = 1/ξ . The fitting algorithm was configured fordouble pulses as initial guess, according to Eq. (3.16). This assumption can be derived byidentifying two transients in the data. Possible solutions for the fitting were a single pulse(tsep = 0) and the double pulse (tsep > 0). The initial parameters and boundaries were as follows:τFEL = 20fs with τFEL ∈ (0,100)fs, tsep = 30fs with tsep ∈ (0,30) fs, and a = 0 with a ∈ (0,1).As a figure of merit, the deviation of the fitted parameters from the originally defined parameters,∆ = ∆p/p, was used (with p representing one of the parameters). Another figure of merit wasthe root-mean-square (rms) error,
∆IFEL =t=+T/2
∑t=−T/2
√[IFEL(t)− Ifit(t)]
2
T, (3.18)
with the absolute difference between the retrieved intensity envelope, Ifit(t), and the simulatedintensity envelope, IFEL(t), within the time window of ∆T = 150fs. The fitting procedure wasperformed for different SNR ranging from 100 to 3.0 [1/ξ ]. The results are summarized inFig. 3.10. Here, the parameter deviation, ∆, and the rms error, ∆IFEL, are plotted in dependenceon the SNR (see legend). Between SNR = 100 and SNR = 20, the pulse parameters could beretrieved with a deviation ∆ < 10% (indicated by dashed line). In this range, the rms error isbelow 3%. At SNR = 3 and lower, the algorithm does not converge.
As an example, the pulse retrieval for SNR = 20 is shown in Fig. 3.10b. The simulatedcross-correlation, Sξ (∆t) with ξ = 0.05 (white rectangles), and the fitted cross-correlation,S(∆t) (blue line), feature the two transients, indicating a double pulse. The originally simu-lated double pulse intensity, IFEL(t), is compared with the retrieved intensity, Ifit(t) (red line).
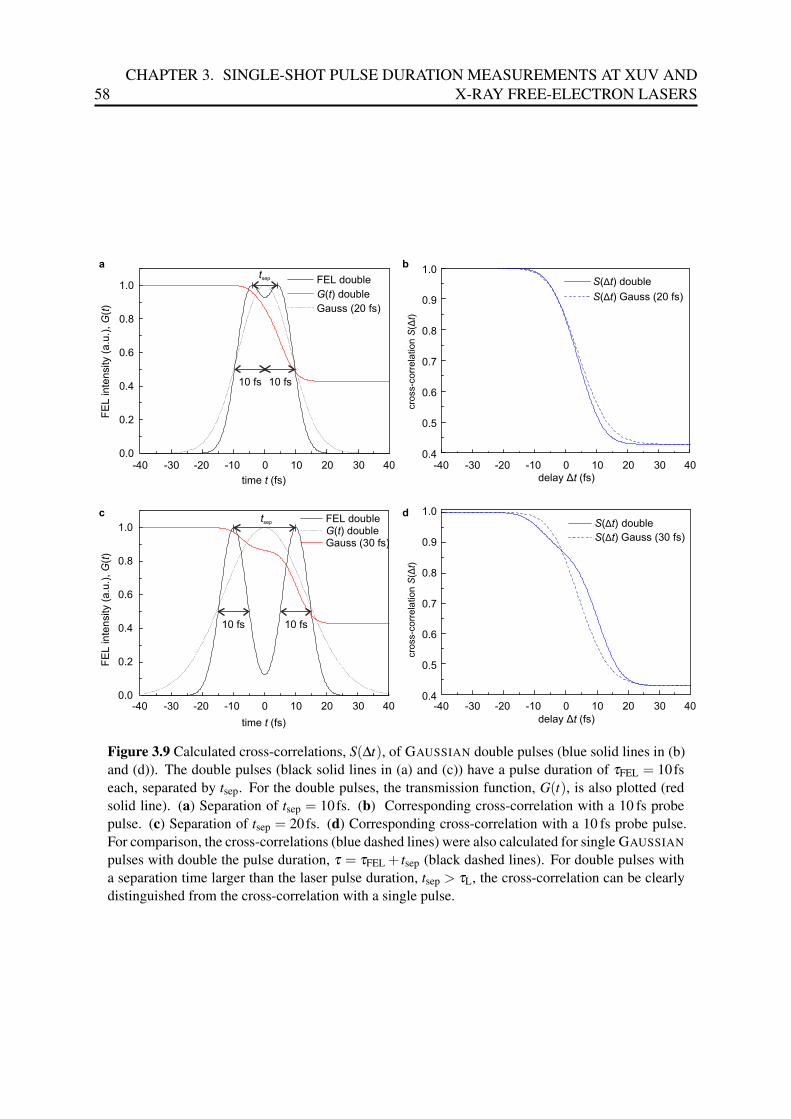
58CHAPTER 3. SINGLE-SHOT PULSE DURATION MEASUREMENTS AT XUV AND
X-RAY FREE-ELECTRON LASERS
FEL double( ) doubleG t
Gauss (30 fs)
10 fs
tsep
0.0
0.2
0.4
0.6
0.8
1.0FEL double
( ) doubleG t
Gauss (20 fs)
FE
Lin
tensity (
a.u
.),
( )
Gt
time (fs)t
( ) doubleS tΔ
( ) Gauss (30 fs)S tΔ
0.4
0.5
0.6
0.7
0.8
0.9
1.0( ) doubleS tΔ
( ) Gauss (20 fs)S tΔ
cro
ss-c
orr
ela
tion
()
St
Δ
delay (fs)Δt
0.0
0.2
0.4
0.6
0.8
1.0
FE
Lin
tensity (
a.u
.),
( )
Gt
0 10 20 30 40-10-20-30-40 0 10 20 30 40-10-20-30-40
0.4
0.5
0.6
0.7
0.8
0.9
1.0
0 10 20 30 40-10-20-30-40
cro
ss-c
orr
ela
tion
()
St
Δ
0 10 20 30 40-10-20-30-40
10 fs
10 fs 10 fs
a
c
b
d
tsep
time (fs)t delay (fs)Δt
Figure 3.9 Calculated cross-correlations, S(∆t), of GAUSSIAN double pulses (blue solid lines in (b)and (d)). The double pulses (black solid lines in (a) and (c)) have a pulse duration of τFEL = 10fseach, separated by tsep. For the double pulses, the transmission function, G(t), is also plotted (redsolid line). (a) Separation of tsep = 10fs. (b) Corresponding cross-correlation with a 10 fs probepulse. (c) Separation of tsep = 20fs. (d) Corresponding cross-correlation with a 10 fs probe pulse.For comparison, the cross-correlations (blue dashed lines) were also calculated for single GAUSSIAN
pulses with double the pulse duration, τ = τFEL + tsep (black dashed lines). For double pulses witha separation time larger than the laser pulse duration, tsep > τL, the cross-correlation can be clearlydistinguished from the cross-correlation with a single pulse.

CHAPTER 3. SINGLE-SHOT PULSE DURATION MEASUREMENTS AT XUV ANDX-RAY FREE-ELECTRON LASERS 59
It can be concluded that the developed data processing and fitting routine ensures a very ro-bust retrieval of assumed pulse durations, even for a low signal-to-noise ratio in the normalizedcross-correlations. For comparison, the experimental signal-to-noise ratio in the presented mea-surements was SNR > 100 for the fused silica target (Fig. 3.6) and SNR > 20 for the Si3N4target (Fig. 3.7).
rms ΔI tFEL( )
pa
ram
ete
r d
evia
tio
n(%
)Δ
60
50
40
30
20
10
0
103 4 5 7 20
signal-to-noise ratio SNR
rms e
rro
r(
) (%
)Δ
It
FE
L
0
5
10
15
20
25
30
ΔτFEL
tΔ sep
(Δ a/b)
0.4
0.6
0.8
1.0
cro
ss-c
orr
ela
tio
n(
)S
tΔ
FE
Lin
ten
sity
( )
(a.u
.)I
tF
EL
0.0
0.2
0.4
0.6
0.8
1.0
-20
delay (fs), time (fs)Δt t
0-40 20 40
S t( )Δ
S t( ) fitΔ
I tFEL( )
I tFEL( ) fit
SNR 20=a b
4030 50 70 100
Figure 3.10 Performance simulation of the FEL pulse retrieval under the presence of noise on asimulated cross-correlation. (a) Deviation of the fitting parameters from the input parameters, ∆ =∆p/p, for different signal-to-noise ratios, SNR. Here, p corresponds to the pulse duration, τFEL(black rectangles), the pulse separation, tsep (red dots), and the intensity ratio, a (blue triangles).Additionally, the rms deviation of the fitted FEL intensity from the input FEL intensity, ∆IFEL(t)(cross-circles), was calculated. (b) Example for SNR = 20: Simulated cross-correlation, Sξ (∆t),with ξ = 0.05 (white rectangles), fitted cross-correlation, ∆S(t) (blue line), input FEL intensity,IFEL(t), and retrieved intensity envelope, Ifit(t).
A very promising application for the presented pulse diagnostics method is the characteriza-tion of seeded FEL pulses. For example at FERMI@Elettra (Trieste, Italy), double pulses canbe generated via seeding with high gain harmonic generation (HGHG) [7]. At FLASH, directseeding at λFEL = 38.5nm via higher order harmonic generation (HHG) was recently demon-strated [72]. For the seeded pulses, single pulses are expected with a pulse duration of < 10fs,according to the spectral bandwidth of the HHG of about ∆λ = 0.2nm FWHM. A simulationof cross correlations was performed for comparable parameters. For the probe pulse, the pulseduration of 35 fs was chosen, according to the seeding laser system at FLASH (Ti:sapphire am-plifier, Coherent Hidra). For the unseeded (SASE) FEL pulse, a GAUSSIAN intensity envelopewith a pulse duration of 200 fs FWHM was assumed. For the seeded FEL pulse, a complexpulse structure is assumed. It is a superposition of two GAUSSIAN pulses, one with 200 fs pulseduration (SASE background) and one with 20 fs pulse duration (seeded part). A seeded-to-SASE intensity ratio of Iseeded/ISASE = 20 is assumed. In Fig. 3.11, the input intensity profiles,IFEL(t) for the SASE pulse (blue dashed) and the seeded pulse (red dashed) are plotted. Thecorresponding cross-correlations, S(∆t), are plotted as solid lines. The signal from the seededpulse (red) consists of three parts. First, for negative delays it follows the signal from the lead-ing SASE background (blue). Then, between ∆t = −50fs...50fs it is characterized by a steeptransient through the short intensity envelope of the seeded fraction of the pulse. At the end,for large delays, it turns into a flat transient, corresponding to the trailing SASE background.Owing to the energy difference between the SASE and the seeded pulse, the difference in the

60CHAPTER 3. SINGLE-SHOT PULSE DURATION MEASUREMENTS AT XUV AND
X-RAY FREE-ELECTRON LASERS
absolute transmission change is larger for the seeded pulse. With the probe pulse duration of35 fs, the pulse duration of the seeded part of the pulse can be determined only with a large error.However, the seeded case and the SASE case can be clearly distinguished by the slope of thetransient and the total transmission change. With a short probe laser (< 20fs) and sufficient tem-poral resolution, the intensity envelope of the seeded part as well as of the SASE backgroundcan be retrieved.
time (fs), delayt (fs)Δt
FE
Lin
ten
sity
( )
(a.u
.)I
tF
EL
cro
ss-c
orr
ela
tio
n(
)S
tΔ
SASE 200 fs FWHMI tFEL( )
20 fs FWHMI tFEL( ) seeded
S t( ) SASEΔ
S t( ) seededΔ
-200 -100 100 20000.0
0.2
0.4
0.6
0.8
1.0
0.0
0.2
0.4
0.6
0.8
1.0
Figure 3.11 Simulated cross-correlation, S(∆t), of a seeded FEL pulse (red solid line) comparedwith an unseeded SASE pulse (blue solid line). For the simulation, the probe laser pulse durationwas τL = 35fs. The intensity envelope, IFEL(t), of the seeded pulse consists of a superposition ofa SASE background part (200 fs FWHM) and a seeded part (20 fs FWHM). The intensity of theseeded pulse (red dashed) exceeds the intensity of the unseeded SASE pulse (blue dashed) by afactor of twenty.
3.7 Compact laser amplifier for increased temporal resolu-tion at existing pump-probe beamlines
A compact broadband non-collinear OPA was set up to achieve shorter optical probe pulses forhigh resolution cross-correlation measurements. Most pump-probe laser systems available attoday’s XUV and X-ray FELs are mJ-class Ti:sapphire amplifiers. The available pulse durationsare between 30 fs and 100 fs, limiting the resolution of the cross-correlation. The compact OPApresented here was pumped at the second-harmonic wavelength (400 nm) of the 60 fs pump-probe laser available at FLASH. The requirements for the cross-correlation measurement arethe shortest possible pulse duration, a radially symmetric near-field profile that can be expandedfor homogeneous illumination of the sample, and a pulse energy of > 1µJ, which is sufficientto expose the CCD within a single shot. Furthermore, complexity and long additional beampath should be avoided. Because of the latter fact, the pulse duration requirement was fixedto about 20 fs, which can be achieved using a prism compressor without higher-order phasecompensation. The compact setup has a footprint of 30×60cm2.
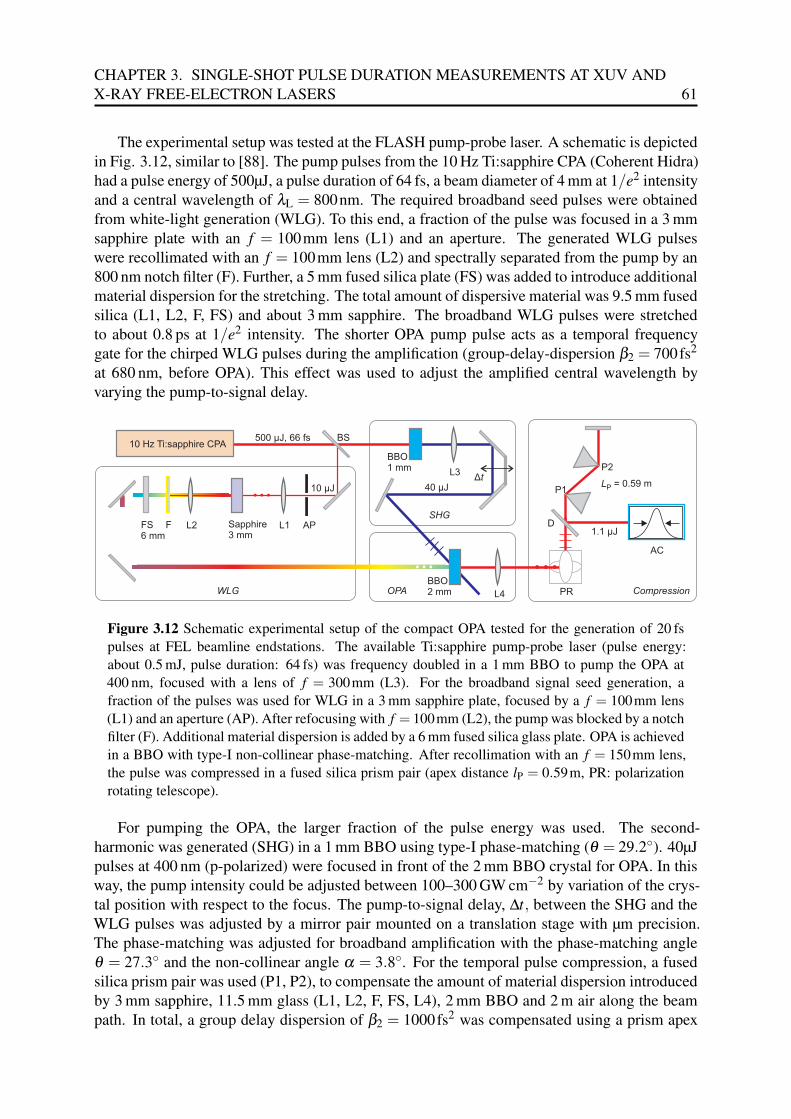
CHAPTER 3. SINGLE-SHOT PULSE DURATION MEASUREMENTS AT XUV ANDX-RAY FREE-ELECTRON LASERS 61
The experimental setup was tested at the FLASH pump-probe laser. A schematic is depictedin Fig. 3.12, similar to [88]. The pump pulses from the 10 Hz Ti:sapphire CPA (Coherent Hidra)had a pulse energy of 500µJ, a pulse duration of 64 fs, a beam diameter of 4 mm at 1/e2 intensityand a central wavelength of λL = 800nm. The required broadband seed pulses were obtainedfrom white-light generation (WLG). To this end, a fraction of the pulse was focused in a 3 mmsapphire plate with an f = 100mm lens (L1) and an aperture. The generated WLG pulseswere recollimated with an f = 100mm lens (L2) and spectrally separated from the pump by an800 nm notch filter (F). Further, a 5 mm fused silica plate (FS) was added to introduce additionalmaterial dispersion for the stretching. The total amount of dispersive material was 9.5 mm fusedsilica (L1, L2, F, FS) and about 3 mm sapphire. The broadband WLG pulses were stretchedto about 0.8 ps at 1/e2 intensity. The shorter OPA pump pulse acts as a temporal frequencygate for the chirped WLG pulses during the amplification (group-delay-dispersion β2 = 700fs2
at 680 nm, before OPA). This effect was used to adjust the amplified central wavelength byvarying the pump-to-signal delay.
10 Hz Ti:sapphire CPA
BBO1 mm
Sapphire3 mm
L2
BS
F
BBO2 mm
P110 µJ
500 µJ, 66 fs
WLG
L1 APFS6 mm
D
L3
OPA
40 µJ
1.1 µJ
Δt
L4 Compression
SHG
PR
P2
AC
LP = 0.59 m
Figure 3.12 Schematic experimental setup of the compact OPA tested for the generation of 20 fspulses at FEL beamline endstations. The available Ti:sapphire pump-probe laser (pulse energy:about 0.5 mJ, pulse duration: 64 fs) was frequency doubled in a 1 mm BBO to pump the OPA at400 nm, focused with a lens of f = 300mm (L3). For the broadband signal seed generation, afraction of the pulses was used for WLG in a 3 mm sapphire plate, focused by a f = 100mm lens(L1) and an aperture (AP). After refocusing with f = 100mm (L2), the pump was blocked by a notchfilter (F). Additional material dispersion is added by a 6 mm fused silica glass plate. OPA is achievedin a BBO with type-I non-collinear phase-matching. After recollimation with an f = 150mm lens,the pulse was compressed in a fused silica prism pair (apex distance lP = 0.59m, PR: polarizationrotating telescope).
For pumping the OPA, the larger fraction of the pulse energy was used. The second-harmonic was generated (SHG) in a 1 mm BBO using type-I phase-matching (θ = 29.2). 40µJpulses at 400 nm (p-polarized) were focused in front of the 2 mm BBO crystal for OPA. In thisway, the pump intensity could be adjusted between 100–300 GW cm−2 by variation of the crys-tal position with respect to the focus. The pump-to-signal delay, ∆t, between the SHG and theWLG pulses was adjusted by a mirror pair mounted on a translation stage with µm precision.The phase-matching was adjusted for broadband amplification with the phase-matching angleθ = 27.3 and the non-collinear angle α = 3.8. For the temporal pulse compression, a fusedsilica prism pair was used (P1, P2), to compensate the amount of material dispersion introducedby 3 mm sapphire, 11.5 mm glass (L1, L2, F, FS, L4), 2 mm BBO and 2 m air along the beampath. In total, a group delay dispersion of β2 = 1000fs2 was compensated using a prism apex
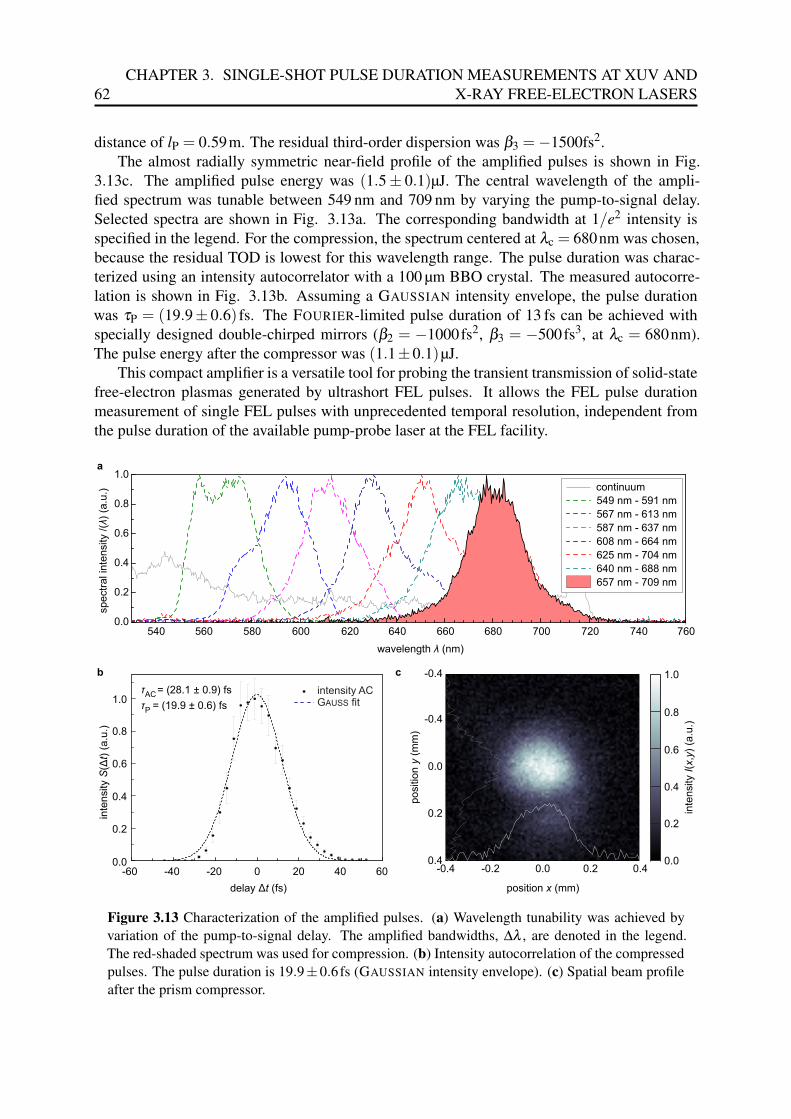
62CHAPTER 3. SINGLE-SHOT PULSE DURATION MEASUREMENTS AT XUV AND
X-RAY FREE-ELECTRON LASERS
distance of lP = 0.59m. The residual third-order dispersion was β3 =−1500fs2.The almost radially symmetric near-field profile of the amplified pulses is shown in Fig.
3.13c. The amplified pulse energy was (1.5± 0.1)µJ. The central wavelength of the ampli-fied spectrum was tunable between 549 nm and 709 nm by varying the pump-to-signal delay.Selected spectra are shown in Fig. 3.13a. The corresponding bandwidth at 1/e2 intensity isspecified in the legend. For the compression, the spectrum centered at λc = 680nm was chosen,because the residual TOD is lowest for this wavelength range. The pulse duration was charac-terized using an intensity autocorrelator with a 100 µm BBO crystal. The measured autocorre-lation is shown in Fig. 3.13b. Assuming a GAUSSIAN intensity envelope, the pulse durationwas τP = (19.9± 0.6) fs. The FOURIER-limited pulse duration of 13 fs can be achieved withspecially designed double-chirped mirrors (β2 = −1000fs2, β3 = −500fs3, at λc = 680nm).The pulse energy after the compressor was (1.1±0.1)µJ.
This compact amplifier is a versatile tool for probing the transient transmission of solid-statefree-electron plasmas generated by ultrashort FEL pulses. It allows the FEL pulse durationmeasurement of single FEL pulses with unprecedented temporal resolution, independent fromthe pulse duration of the available pump-probe laser at the FEL facility.
0.0
0.2
0.4
0.6
0.8
1.0
continuum
549 nm - 591 nm
567 nm - 613 nm
587 nm - 637 nm
608 nm - 664 nm
625 nm - 704 nm
640 nm - 688 nm
657 nm - 709 nm
spectr
al in
tensity /(
)(a
.u.)
λ
wavelength (nm)λ
540 560 580 600 620 640 660 680 700 720 740 760
0.0
0.2
0.4
0.6
0.8
1.0
delay (fs)Δt
τAC= (28.1 0.9) fs±
τP
= (19.9 0.6) fs±
inte
nsity
()
(a.u
.)S
tΔ
-60 -40 -20 0 20 40 60
intensity ACfitGAUSS
a
b c
inte
nsity (
,)
(a.u
.)I
x y
position (mm)x
-0.4
-0.4
0.0
0.2
0.4-0.4 -0.2 0.0 0.2 0.4
0.0
0.2
0.4
0.6
0.8
1.0
positio
n(m
m)
y
Figure 3.13 Characterization of the amplified pulses. (a) Wavelength tunability was achieved byvariation of the pump-to-signal delay. The amplified bandwidths, ∆λ , are denoted in the legend.The red-shaded spectrum was used for compression. (b) Intensity autocorrelation of the compressedpulses. The pulse duration is 19.9±0.6fs (GAUSSIAN intensity envelope). (c) Spatial beam profileafter the prism compressor.
Chapter 4
High repetition rate optical parametricchirped-pulse amplifier
For increasing the performance of the free-electron laser facility FLASH, a high repetition rateoptical parametric chirped-pulse amplifier (OPCPA) is being developed for the application aspump-probe laser and as FEL seeding laser. The final laser pulse repetition rate of 100 kHz to1 MHz is fixed by the electron bunch repetition rate of the accelerator to provide one opticallaser pulse for each FEL pulse. This benefits not only the statistical significance of experimentsat FLASH, but also the seeding of the FEL at high repetition rate, enabling the full controlover each XUV pulse generated by the FEL. The FEL delivers XUV pulses with durationsdown to τFEL = 10fs to 30 fs in SASE mode with low electron bunch charge. Highest temporalresolution in XUV/optical pump-probe experiments is attained using shorter optical laser pulseswith pulse durations τL < τFEL. To achieve such high resolution, the arrival time jitter betweenthe optical pulse and the FEL pulse must be even smaller, τjitter < τL < τFEL. In combinationwith the XUV/optical cross-correlation method developed in this work (Chapter 3), the jitter canbe accurately determined and tagged to the experimental data for each FEL pulse. With suchan outstanding laser system, FLASH would provide worldwide unique experimental conditionsfor time-resolved FEL experiments.
FLASH operates in a pulsed burst mode. Each burst generates up to 800 brilliant ultrashortXUV pulses, corresponding to an intra-burst repetition rate of up to 1 MHz. This burst patternshould be also delivered by the optical pump-probe laser and the seeding laser. The require-ments for the pulse duration and the pulse energy are defined according to the requirements forseeding and for high resolution pump-probe experiments [36, 142]. The developed system hasto fulfill the following demands on the laser technology:
• Burst-mode operation: Pulsed operation with 10 Hz burst repetition rate and a final intra-burst repetition rate of 100 kHz to 1 MHz. The burst duration is 800 µs. It is particularlychallenging to operate a conventional laser amplifier in such a burst-mode, because it isalways in a non-equilibrium state of population inversion.
• Pulse energy: For the application as pump-probe laser, the pulse energy should be 25 µJin the first version and 1 mJ in the final version. For the application as seeding laser, thepulse energy should be as high as possible, at least 1 mJ.
• Pulse duration: For the pump-probe laser, the pulse duration should be sub-20 fs inthe first version and sub-10 fs in the final version. For the high gain harmonic gener-
63
64CHAPTER 4. HIGH REPETITION RATE OPTICAL PARAMETRIC CHIRPED-PULSE
AMPLIFIER
ation (HGHG) seeding, a pulse duration of about 30 fs is required with tunable centerwavelength. For the direct seeding via higher order harmonic generation (HHG), a pulseduration between 15 fs and 20 fs is required to match the FEL gain bandwidth.
• Energy and spectral stability: The system should be as stable as possible. A maximumof 1% rms deviation from the average pulse energy and the central wavelength should beachieved.
• Operation time: A laser system that operates in an FEL environment has to be long-termoperational with the aforementioned parameters for at least 12 h. This is indispensable foran uninterrupted operation during FEL experiments.
In this chapter, first, the state-of-the-art of ultrashort laser systems will be reviewed. In the fol-lowing, the concept of optical parametric chirped-pulse amplification is explained in detail andthe choice of the optimal nonlinear optical crystal is evaluated. Furthermore, the experimentalsetup and the results attained with a 27.5 kHz (intra-burst) prototype are presented. A techniqueto ensure long-term stability of high-power OPCPAs is investigated, which is an important focusof this work. Finally, thermal limitations in OPCPA at kW average power are discussed.
4.1 State-of-the-art Ti:sapphire amplifiersCommon technology for ultrashort pulse generation with few-femtosecond pulse duration is theTi:sapphire1 solid-state laser with KERR-lens mode-locking [79, 143]. Nowadays, Ti:sapphireoscillators generate pulses shorter than two optical cycles by accurate intra-cavity dispersioncontrol with specially designed double-chirped mirrors [144]. These oscillators are also com-mercially available (e.g. VENTEON pulse:one, Femtolasers Rainbow). The amplification ofsuch short pulses is generally achieved by the implementation of chirped-pulse amplification(CPA) [145], shown schematically in Fig. 4.1a. This technique needs temporal stretching ofthe ultrashort pulses from the oscillator by several orders of magnitude, such to prevent non-linear optical effects or even damage of the amplifier material. The stretching is achieved byadding a defined amount of dispersion (stretcher), for example by a grating or prism setup. Af-ter the amplification, the pulses are compressed by a dispersive element (compressor), takinginto account dispersion with opposite sign of the stretcher and of the amplifier material. How-ever, in Ti:sapphire amplifier systems the spectral bandwidth is considerably reduced, due tospectral gain-narrowing [146]. This limits the shortest amplified pulse duration to about 20 fs.Spectral broadening techniques, such as self-phase-modulation in gas-filled hollow-core fibers[147] (SPM), were implemented to re-enhance the bandwidth of amplified pulses. In combina-tion with active and passive control of the spectral phase and proper pre-compensation of thespectral amplitude, the amplification of 5 fs pulses to mJ pulse energies was attained [148, 149].Such spectral broadening methods suffer from additional losses of about 50% and are limitedin pulse energy.
The main disadvantage of Ti:sapphire laser amplifier systems is its ultimate limitation inaverage power due to the large quantum defect, q = h(ωpump −ωlaser), of Ti:sapphire [150].Typically, the pump wavelength is between 527–532 nm and the average laser wavelength iscentered around 800 nm. The resulting quantum defect, q = 1/3hωpump, indicates that about
1Ti3+-doped Al2O3
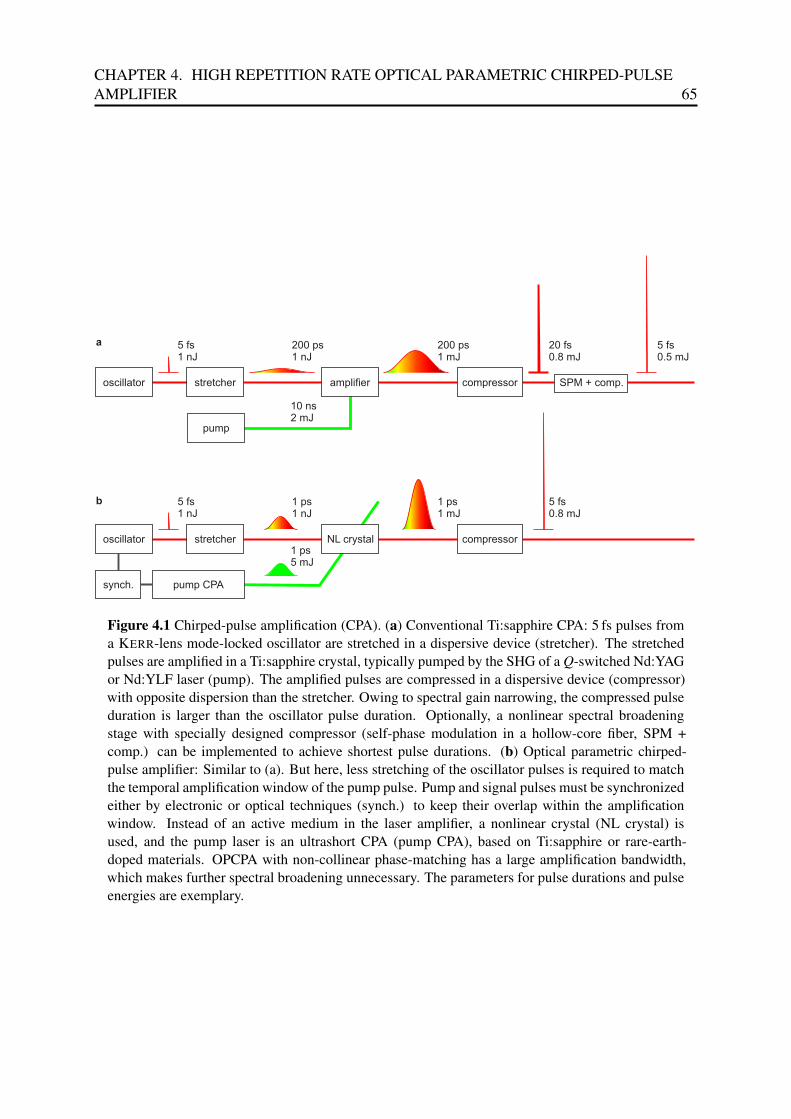
CHAPTER 4. HIGH REPETITION RATE OPTICAL PARAMETRIC CHIRPED-PULSEAMPLIFIER 65
oscillator
5 fs1 nJ
stretcher
200 ps1 nJ
amplifier
200 ps1 mJ
compressor
20 fs0.8 mJ
SPM + comp.
5 fs0.5 mJ
pump
oscillator
5 fs1 nJ
stretcher
1 ps1 nJ
NL crystal
1 ps1 mJ
compressor
5 fs0.8 mJ
1 ps5 mJ
10 ns2 mJ
a
b
synch. pump CPA
Figure 4.1 Chirped-pulse amplification (CPA). (a) Conventional Ti:sapphire CPA: 5 fs pulses froma KERR-lens mode-locked oscillator are stretched in a dispersive device (stretcher). The stretchedpulses are amplified in a Ti:sapphire crystal, typically pumped by the SHG of a Q-switched Nd:YAGor Nd:YLF laser (pump). The amplified pulses are compressed in a dispersive device (compressor)with opposite dispersion than the stretcher. Owing to spectral gain narrowing, the compressed pulseduration is larger than the oscillator pulse duration. Optionally, a nonlinear spectral broadeningstage with specially designed compressor (self-phase modulation in a hollow-core fiber, SPM +comp.) can be implemented to achieve shortest pulse durations. (b) Optical parametric chirped-pulse amplifier: Similar to (a). But here, less stretching of the oscillator pulses is required to matchthe temporal amplification window of the pump pulse. Pump and signal pulses must be synchronizedeither by electronic or optical techniques (synch.) to keep their overlap within the amplificationwindow. Instead of an active medium in the laser amplifier, a nonlinear crystal (NL crystal) isused, and the pump laser is an ultrashort CPA (pump CPA), based on Ti:sapphire or rare-earth-doped materials. OPCPA with non-collinear phase-matching has a large amplification bandwidth,which makes further spectral broadening unnecessary. The parameters for pulse durations and pulseenergies are exemplary.

66CHAPTER 4. HIGH REPETITION RATE OPTICAL PARAMETRIC CHIRPED-PULSE
AMPLIFIER
1/3 of the absorbed pump energy is dissipated as heat. The resulting thermo-optic effects,such as thermal lensing, can be reduced by complex cavity design and sophisticated cryogeniccooling technology. The physical limit of the output power of Ti:sapphire amplifiers is givenby the cryogenic cooling capacity. Output powers of tens of Watts have been achieved so far[151, 152], allowing repetition rates of tens of kilohertz at 1 mJ pulse energy. Burst repetitionrates of up to 1 MHz with pulse energies in the mJ range are not achievable due to massiveheating of the amplifier medium during the burst. Hence, a novel laser amplifier system has tobe designed to fulfill the specifications.
4.2 Optical parametric chirped-pulse amplificationOptical parametric amplification (OPA) is a second-order nonlinear process. The energy ofan intense pump pulse is transferred to a signal and an idler pulse, which are overlapped ina nonlinear optical crystal. For the amplification, no population inversion and thus no energystorage is required within the medium. As the photon energy difference is carried away by theidler radiation, no quantum defect exists. Furthermore, non-collinear phase-matching in OPAoffers a large amplification bandwidth, as compared to Ti:sapphire amplifiers. The concept ofoptical parametric chirped-pulse amplification (OPCPA) combines the laser CPA scheme withOPA (Fig. 4.1b). With this powerful combination, the advantages of both methods are merged[153–155]. Pulses with only a few optical cycles can be amplified to very high pulse energieswith terawatts of optical power [156–158]. Furthermore, unprecedented high average powerscan be attained, owing to the instantaneous nature of the nonlinear parametric response. Forexample, a pulse duration of 5 fs was achieved at an average power of 22 W [159]. However,at very high average power the residual absorption of signal, idler and pump pulses needs tobe taken into account as sources of heat. In order to develop an OPCPA system that meets therequirements for the FLASH seeding and pump-probe laser, new challenges have to be faced.In the following, the advantages and challenges of OPCPA are summarized.Major advantages:
• Gain bandwidth: The amplification of a full optical octave is possible in a single am-plification stage [159], using non-collinear phase-matching in a sufficiently short crystal,pumped at sufficiently high intensity. The amplification bandwidth is limited by phase-matching. With pumping at multiple wavelengths, even more than one optical octave ispossible [160].
• Single-pass gain: A high single-pass gain of G > 106 can be achieved with only a fewmm of nonlinear crystal. This relaxes the design complexity of the amplifier stages,whereas conventional laser amplifiers require multi-pass or regenerative amplifiers.
• Power scaling: Owing to the instantaneous nature of the nonlinear parametric response,no energy storage within the medium is required for amplification. Consequently, theabsorption of photons is reduced by several orders of magnitude. This enables unprece-dented average powers and repetition rates, limited only by the residual absorption ofsignal, idler and pump pulses.
• Spectral tunability: The amplified bandwidth and central frequency can be adjustedby several degrees of freedom, for example by varying the phase-matching angle or thetemperature [88, 161].

CHAPTER 4. HIGH REPETITION RATE OPTICAL PARAMETRIC CHIRPED-PULSEAMPLIFIER 67
• Burst-mode: The repetition rate is fixed by the repetition rate of the pump laser. Aburst pattern of the pump laser will be directly transferred to the OPCPA. Unlike theconventional laser, the OPA process does not rely on population inversion. Thus, thechallenges concerning the non-equilibrium laser operation in the burst-mode are shiftedto the OPA pump laser.
Major challenges:
• Pump laser requirements: An additional CPA for the ultrashort pump pulses is required.The pump-to-signal conversion efficiency is around 20% in the presented configurationand highest possible pump pulse energies should be attained. The high intensities neededfor driving the broadband nonlinear amplification require picosecond pulse durations, pro-vided by rare-earth doped solid state lasers. The system has to operate in a stable burstmode with high intra-burst repetition rate.
• Pump-to-signal synchronization: The amplified energy and bandwidth is highly sensi-tive to variations of the temporal delay between the short pump and signal pulses. Thebest conversion efficiency is achieved at optimum temporal overlap. However, opticalpath length drifts occur due to temperature changes in the pump amplifier or changes ofthe laboratory environment (e.g. temperature, humidity, pressure). For the drift compen-sation, high-precision pump-to-signal synchronization techniques are required.
• Dispersion management: The temporal stretching and compression scheme of the broad-band pulses needs to be carefully designed, because of the strong dispersive influence ofthe optical elements in the beam path.
• Amplified noise: Amplified optical parametric fluorescence (AOPF) can reach signifi-cant intensities, if not appropriately suppressed. AOPF can be decreased with cascadingamplifier stages using moderate gain.
In conclusion, OPCPA is the best technology available for the development of the high repeti-tion rate laser amplifier at FLASH. However, at a pump-to-signal conversion efficiency of 20%,a pump pulse energy of at least 5 mJ is required at a wavelength of 515 nm to achieve a sig-nal energy of 1 mJ around the central wavelength of 800 nm. At 100 kHz to 1 MHz repetitionrates, the development of new kW-level pump amplifiers at sub-picosecond pulse durations isrequired to fulfill the high OPCPA criteria. Different Yb-based pump CPA concepts are beingdeveloped. High average power can be attained owing to the low quantum defect of Yb-dopedlaser materials, q = 8.7%, e.g. with Yb-doped yttrium-aluminum-garnet (Yb:YAG). The ampli-fied bandwidth of this material supports sub-ps pulse durations. For an efficient heat removal,special active material geometries have been developed, such as Innoslab [162, 163], thin-disktechnology [164, 165], and optical fibers with large mode diameter [166] and coherent com-bining of single amplifiers [167]. The frequency-doubled output of such amplifiers at 515 nmcan be used for OPCPA pumping. Taking into account an efficiency of 50% for the frequency-doubling, at least 10 mJ pulse energy have to be delivered by the pump CPA, resulting in 1 kWat 100 kHz and 10 kW at 1 MHz average power during the burst. The development progressof a multi-kW Innoslab burst amplifier (Amphos GmbH, Aachen, Germany) and a multi-kWthin-disk burst amplifier (DESY, Hamburg, Germany) is in progress [165, 168, 169].
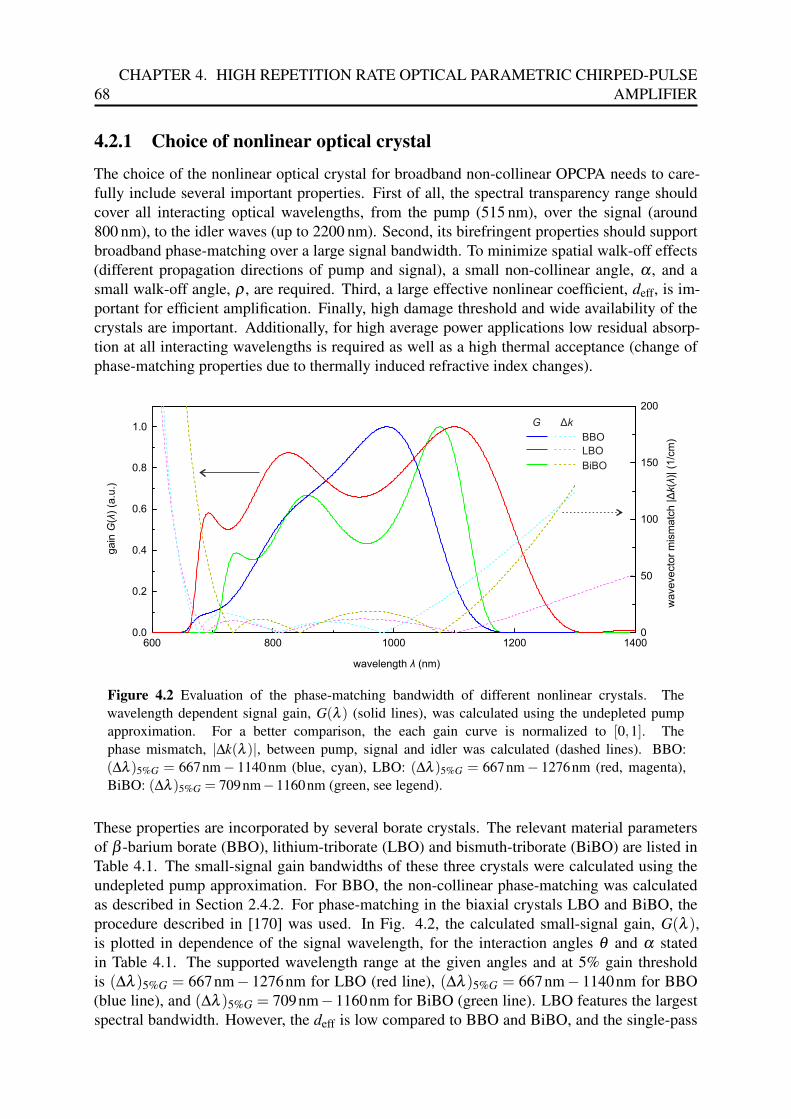
68CHAPTER 4. HIGH REPETITION RATE OPTICAL PARAMETRIC CHIRPED-PULSE
AMPLIFIER
4.2.1 Choice of nonlinear optical crystal
The choice of the nonlinear optical crystal for broadband non-collinear OPCPA needs to care-fully include several important properties. First of all, the spectral transparency range shouldcover all interacting optical wavelengths, from the pump (515 nm), over the signal (around800 nm), to the idler waves (up to 2200 nm). Second, its birefringent properties should supportbroadband phase-matching over a large signal bandwidth. To minimize spatial walk-off effects(different propagation directions of pump and signal), a small non-collinear angle, α , and asmall walk-off angle, ρ , are required. Third, a large effective nonlinear coefficient, deff, is im-portant for efficient amplification. Finally, high damage threshold and wide availability of thecrystals are important. Additionally, for high average power applications low residual absorp-tion at all interacting wavelengths is required as well as a high thermal acceptance (change ofphase-matching properties due to thermally induced refractive index changes).
600 800 1000 1200 14000.0
0.2
0.4
0.6
0.8
1.0
ga
in(
) (a
.u.)
Gλ
wavelength (nm)λ
0
50
100
150
200
wa
ve
ve
cto
r m
ism
atc
h |
()|
(1
/cm
)Δ
kλ
BBO
LBO
BiBO
G Δk
Figure 4.2 Evaluation of the phase-matching bandwidth of different nonlinear crystals. Thewavelength dependent signal gain, G(λ ) (solid lines), was calculated using the undepleted pumpapproximation. For a better comparison, the each gain curve is normalized to [0,1]. Thephase mismatch, |∆k(λ )|, between pump, signal and idler was calculated (dashed lines). BBO:(∆λ )5%G = 667nm− 1140nm (blue, cyan), LBO: (∆λ )5%G = 667nm− 1276nm (red, magenta),BiBO: (∆λ )5%G = 709nm−1160nm (green, see legend).
These properties are incorporated by several borate crystals. The relevant material parametersof β -barium borate (BBO), lithium-triborate (LBO) and bismuth-triborate (BiBO) are listed inTable 4.1. The small-signal gain bandwidths of these three crystals were calculated using theundepleted pump approximation. For BBO, the non-collinear phase-matching was calculatedas described in Section 2.4.2. For phase-matching in the biaxial crystals LBO and BiBO, theprocedure described in [170] was used. In Fig. 4.2, the calculated small-signal gain, G(λ ),is plotted in dependence of the signal wavelength, for the interaction angles θ and α statedin Table 4.1. The supported wavelength range at the given angles and at 5% gain thresholdis (∆λ )5%G = 667nm− 1276nm for LBO (red line), (∆λ )5%G = 667nm− 1140nm for BBO(blue line), and (∆λ )5%G = 709nm−1160nm for BiBO (green line). LBO features the largestspectral bandwidth. However, the deff is low compared to BBO and BiBO, and the single-pass

CHAPTER 4. HIGH REPETITION RATE OPTICAL PARAMETRIC CHIRPED-PULSEAMPLIFIER 69
gain is only G(λ ) < 102 at the same pump intensity. BBO is the most favorable nonlinearcrystal to achieve a high single pass gain, G(λ ) > 106, over a large spectral bandwidth, andwith a smaller non-collinear angle than BiBO. Nevertheless, LBO has the lowest absorptionat 515 nm and the highest damage threshold, which makes it highly attractive for high-poweramplifier stages with low single-pass gain. The hygroscopicity of BBO and LBO is sufficientlylow for practical application. BiBO is not hygroscopic.
BBO LBO BiBO
chemical formula β -BaB2O4 LiB3O5 BiB3O6birefringence (point group) neg. uniaxial (3m) neg. biaxial (mm2) neg. biaxial (mm2)phase-matching planea xz xy yznonlinear coeff. deff (a) 2.08 pm V−1 0.82 pm V−1 1.97 pm V−1
transparency range (nm)a 190–3500 160–3200 286–2500damage threshold intensityb >5 GWcm−2 >26 GWcm−2 >3.5 GWcm−2
absorption coeff. (532 nm)c 1%cm−1 0.3%cm−1 not reportedthermo-optic coeff. (−9.3)o −(3.76λ −2.3)xdn/dT (10−6 K−1) (−16.6)e
a −(6.0λ −19.4)y not reported−(10λ −3.5)z
(λ in µm)d
thermal acceptancea∆T ∆k 39.69 K·cm 6.8 K·cm 2.74 K·cmangular acceptancea∆Θ∆k 0.56 mrad·cm 6.86 mrad·cm 1.15 mrad·cmphase.matching angle θ 24.17 17.6 43.39
non-coll. angle α 2.2 1.2 3.85
walk-off. angleaρ 3.2 0.4 1.4a values from the freely available software SNLO [171]b damage threshold at a pulse duration of35 ps (BBO and LBO) [172], or 40 ps (BiBO) [173]c reported by the crystal manufacturer CASTECH (China)d from [174]
Table 4.1 Nonlinear optical crystal parameters.
4.3 OPCPA setup and resultsThe experimental setup of the developed non-collinear OPCPA is schematically displayed in Fig.4.3. It consists of a broadband front-end, a high-power pump CPA and three BBO crystals oflength 3.3 mm, 3.2 mm and 2.0 mm, serving as subsequent broadband amplification stages. Asexplained in Section 4.2.1, BBO was chosen because it supports a broad spectral gain bandwidthand a reduced spatial walk-off owing to the small non-collinear angle. The high nonlinearcoefficient allows for high single-pass gain in shorter crystals, which reduces the dispersion inthe signal beam path. The three-stage setup was chosen for two reasons: firstly, the amplifiedoptical parametric fluorescence is reduced by implementing a preamplifier stage (first OPAstage), as explained below; secondly, the total conversion efficiency could be increased by afactor of two by using the residual pump energy in a third OPA stage. The crystal lengths of theindividual stages were determined by optimization.
As the frontend, a Ti:sapphire oscillator was used (Venteon Pulse:One OPCPA seed), de-livering 2.5 nJ pulses at a repetition rate of 108 MHz. Owing to its broad spectral range from650 nm to 1150 nm, all-optically synchronized seeding was realized, i.e. the oscillator served as
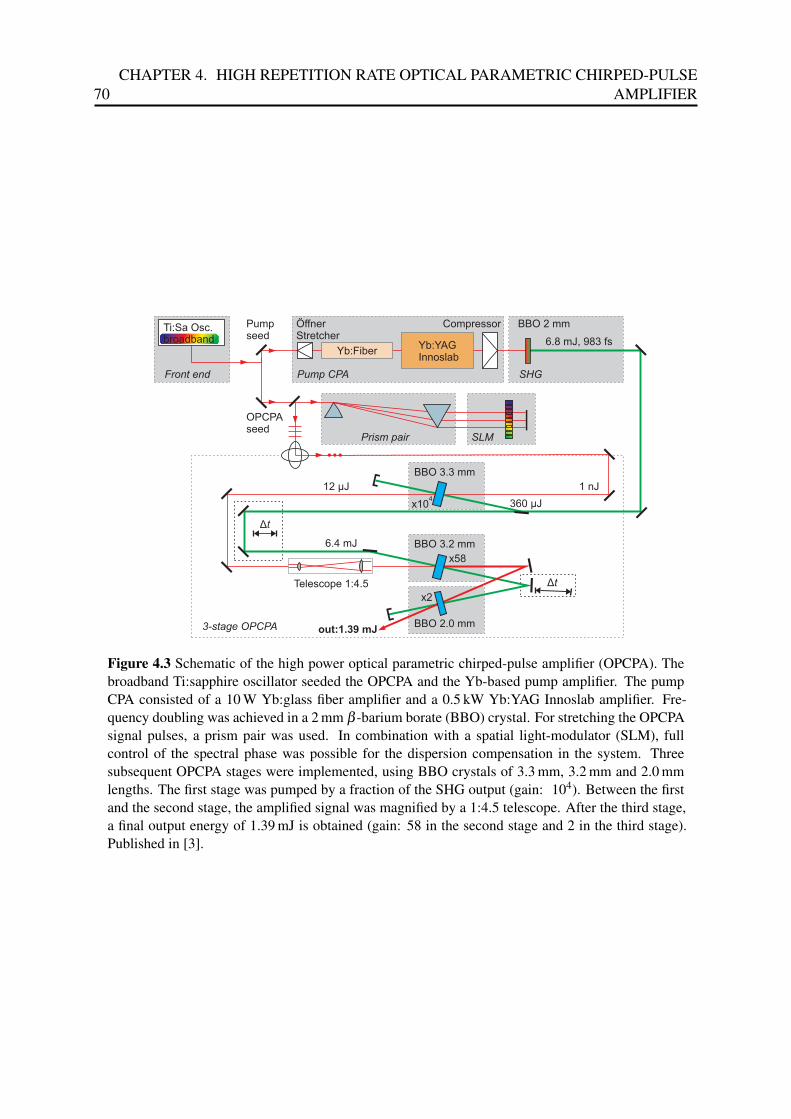
70CHAPTER 4. HIGH REPETITION RATE OPTICAL PARAMETRIC CHIRPED-PULSE
AMPLIFIER
BBO 3.3 mm
Δt
Δt
SLM
broadband
out:1.39 mJ
Telescope 1:4.5
360 µJ
1 nJ
6.4 mJ
x104
Yb:Fiber
ÖffnerStretcher
Compressor
Yb:YAGInnoslab
Ti:Sa Osc.
Prism pair
BBO 3.2 mm
12 µJ
BBO 2.0 mm
SHG
6.8 mJ, 983 fs
x58
x2
Pump CPA
BBO 2 mm
3-stage OPCPA
Pumpseed
OPCPAseed
Front end
Figure 4.3 Schematic of the high power optical parametric chirped-pulse amplifier (OPCPA). Thebroadband Ti:sapphire oscillator seeded the OPCPA and the Yb-based pump amplifier. The pumpCPA consisted of a 10 W Yb:glass fiber amplifier and a 0.5 kW Yb:YAG Innoslab amplifier. Fre-quency doubling was achieved in a 2 mm β -barium borate (BBO) crystal. For stretching the OPCPAsignal pulses, a prism pair was used. In combination with a spatial light-modulator (SLM), fullcontrol of the spectral phase was possible for the dispersion compensation in the system. Threesubsequent OPCPA stages were implemented, using BBO crystals of 3.3 mm, 3.2 mm and 2.0 mmlengths. The first stage was pumped by a fraction of the SHG output (gain: 104). Between the firstand the second stage, the amplified signal was magnified by a 1:4.5 telescope. After the third stage,a final output energy of 1.39 mJ is obtained (gain: 58 in the second stage and 2 in the third stage).Published in [3].

CHAPTER 4. HIGH REPETITION RATE OPTICAL PARAMETRIC CHIRPED-PULSEAMPLIFIER 71
seeder for the OPCPA around 800 nm and for the Yb-based pump amplifier at 1030 nm centralwavelength. Stretching of the signal pulses was achieved by a fused silica prism pair, introduc-ing negative group velocity dispersion, β2. This negative chirp pre-compensated the positiveβ2 within the OPCPA signal path. The total amount of dispersion introduced by the 8.5 mm ofBBO, 10 m of air and 23.6 mm of glass was calculated by expanding the spectral phase aroundthe carrier frequency, ωc = 2.36PHz (λc = 800nm), up to the sixth order:
φ(ω)|ωc = φ(ωc)+N=6
∑n=1
βn
n!(ω −ωc)
n , (4.1)
with the dispersion coefficients, βn = d(n)φ(ω)/dφ(ω)(n)|ωc . The higher-order phase contri-bution of each optical element within the signal path is listed in Table 4.2. While the prismpair compensated β2, it added higher-order dispersion. For an accurate phase compensation,a liquid-crystal spatial-light modulator (SLM, Jenoptik SLM-S640) was placed in the focusedFourier-plane of the prism pair. During the propagation along the signal path, the pulses weregradually compressed. After stretching to about 950 fs (at 1/e2 intensity), the calculated pulseduration after the first, second and third OPCPA stage was about 730 fs, 520 fs and 360 fs, re-spectively. After the third stage, the dispersion of an additional 6 mm fused silica bulk compres-sor leads to a pre-compression of about 170 fs. The final compression can be achieved by a pairof positively chirped mirrors (β2 =+200 fs2) in vacuum [3].
β2 β3 β4 β5 β6optical element (fs2) (fs3) (fs4) (fs5) (fs6)prism pair (lP = 2 m) -2172 -3297 -11297 10088 -51562glass (23.6 mm) 862 652 -264 751 -2183air (10 m) 215 108 -1 -202 592BBO (8.5 mm) 653 461 -93 437 -1020glass comp. (6 mm) 219 165 -68 211 558chirped mirrors 200 0 0 0 0residual 22 -1911 -11723 11285 -53615
Table 4.2 Dispersion Management of the signal path. The higher-order spectral phase contribution,βi, i = 2..6, of different optical elements is listed. The residual phase is compensated by the spatiallight modulator in the prism stretcher setup.
The dispersion management of the setup was tested experimentally using a different oscillator(Femtolasers Rainbow). Its spectrum is shown in Fig. 4.4a (orange), spanning a range of 689–968 nm. The pulse duration after the glass compressor was measured with SPIDER (device:Venteon Pulse:Four SPIDER). The reconstructed spectrum (grey dashed) from the SPIDER sig-nal coincides with the measured spectrum, indicating that all spectral components were withinthe compressed part of the pulse. The retrieved phase (blue) is expressed in terms of the groupdelay, GD = dφ/dω , and indicates a small amount of residual higher-order phase, comparedto the FOURIER-limited (FL) group delay (black dashed), with GD(λ ) = 0. The correspond-ing retrieved intensity envelope (orange) is calculated by FOURIER-transformation (Fig. 4.4b)and features a pulse duration of 8.4 fs FWHM. For comparison, the FOURIER-limited intensityenvelope (grey dashed) features a pulse duration of 8.0 fs FWHM.
For seeding the pump amplifier chain of subsequent Yb-based amplifiers, the 1030 nmpulses were stretched to 2.26 ns in an Öffner-type stretcher [175]. The first was an Yb:glass

72CHAPTER 4. HIGH REPETITION RATE OPTICAL PARAMETRIC CHIRPED-PULSE
AMPLIFIER
reconstr. intensity
inte
nsity (
)(a
.u.)
It tFWHM = 8.4 fs
FL = 8.0 fs
0.0
0.2
0.4
0.6
0.8
1.0reconstr. spectrum
spectr
al in
tensity (
) (a
.u.)
Iλ
wavelength (nm)λ
-200
-150
-100
-50
0
50
100
150
200reconstr. GD
700 750 800 850 900 950 10006500.0
0.2
0.4
0.6
0.8
1.0
gro
up d
ela
y(
) (f
s)
GD
λ
-30 -20 -10 0 10 20 30
time (fs)t
fundamental FL GD FOURIER-limited
a b
Figure 4.4 SPIDER pulse duration measurement used to test the dispersion compensation schemewith a broadband oscillator (Femtolasers Rainbow). (a) Fundamental oscillator spectrum (orange),reconstructed spectrum from the SPIDER signal (grey dashed), reconstructed phase in terms ofgroup delay, GD(λ ) (blue), FOURIER-limited phase, φ = 0 (black dashed). (b) Retrieved inten-sity envelope (orange) after FOURIER-transformation (orange), FOURIER-limited intensity envelope(grey dashed).
fiber amplifier2, delivering 0.36 mJ at 1030 nm. The second was an Yb:YAG Innoslab ampli-fier3 [162, 163, 176]. The pump amplifiers used in this prototype system were operated in a10 Hz burst-mode with 27.5 kHz intra-burst repetition rate. During a 0.8 ms lasting burst, theCPA system delivered 22 pulses in one burst, each with a pulse energy of 13.2 mJ and a pulseduration of 1.39 ps FWHM [3]. For the frequency doubling, a 2 mm BBO was used (type Iphase-matching, θ = 23.4). OPCPA pump pulses with 6.8 mJ pulse energy were generated at515 nm. In Fig. 4.5a, the achieved conversion efficiency, ηSHG, is plotted in dependence on thefundamental pump pulse energy, with a maximum of ηSHG = 51.1%. In Fig. 4.5b the intensityautocorrelations of the fundamental and the second-harmonic pulses are shown. The fundamen-tal autocorrelation width is τAC(1030) = 1.96ps FWHM, corresponding to a fundamental pulseduration of 1.39 ps FWHM. The SHG autocorrelation width is τAC(515) = 1.39ps FWHM, cor-responding to an SHG pulse duration of 0.98 fs FWHM (autocorrelator: APE Pulse Check 50).The first OPCPA stage was pumped with a fraction of the pump beam (360 µJ). The pump beamdiameter was 1 mm (at 1/e2 intensity) to reach the pump intensity of 81 GW cm−2 within the3.3 mm BBO. The signal beam diameter was 1.3 mm. The signal pulses were amplified fromabout 1 nJ to 12 µJ, corresponding to a gain of g = 1.2× 10⁴. The signal beam diameter, afteramplification, was 1.1 mm due to spatial gain narrowing [3].
A high level of amplified optical parametric fluorescence (AOPF) is expected from the firststage, because of the high gain of g≈ 104 and the comparably low seed energy of ES ≈ 1 nJ. TheAOPF can reach a significant intensity, which may be further amplified in the second OPCPAstage [177]. The power contrast between AOPF and OPCPA in the first stage was investigatedto evaluate an upper limit for the AOPF that seeds the second OPCPA stage. The experimentwas performed using a fiber-pumped OPCPA, pumped in continuous-mode at 20 kHz pulse
2provided by the Institute of Applied Physics in Jena, Germany3commercial product from Amphos GmbH in Aachen, Germany. The used amplifier was capable of delivering
about 500 W of output power in continuous operation as well as in burst-operation with about 500 W intra-burstpower

CHAPTER 4. HIGH REPETITION RATE OPTICAL PARAMETRIC CHIRPED-PULSEAMPLIFIER 73
00.0
0.1
0.2
0.3
0.4
0.5
0.6
convers
ion e
ffic
iency
ηS
HG
fundamental pulse energy (mJ)
0.0
0.2
0.4
0.6
0.8
1.01030 nm
515 nm
515 nm (fit)
1030 nm (fit)
AC
inte
nsity (
a.u
.)
2 4 6 8 10 12 14 0-1-2-3-4 1 2 3 4
delay (ps)Δt
τAC(1030) = 1.96 ps
τAC(515) = 1.39 ps
a b
Figure 4.5 Second harmonic generation of the compressed Yb:YAG Innoslab pulses. (a) Conver-sion efficiency, ηSHG, from 1030 nm fundamental to 515 nm SHG. A maximum of 51.1% is achieved.(b) Intensity autocorrelation of the fundamental (violet dots) and the SHG (green dots) with the cor-responding Gaussian fits (solid lines). The fundamental autocorrelation width is τAC(1030) = 1.96psFWHM, corresponding to a fundamental pulse duration of 1.39 ps FWHM. The SHG autocorrelationwidth is τAC(515) = 1.39ps FWHM, corresponding to an SHG pulse duration of 0.98 fs FWHM.
wa
ve
len
gth
(nm
)λ
non-collinear angle (deg)α
600
650
700
750
800
850
900
950
10001.6 1.8 2.0 2.2 2.4 2.6
a b
Δα
1.6 1.8 2.0 2.2 2.4 2.6
non-collinear angle (deg)α
Figure 4.6 Spectral distribution of amplified optic parametric fluorescence along different internalnon-collinear angles, α . (a) Calculated spectral gain for type I tangential phase-matching in BBO,pumped at 515 nm. The phase-matching angle is θ = 24.05. (b) Measured spectral intensity of theamplified optical parametric fluorescence (AOPF) at different internal non-collinear angles α . Theinternal opening angle of the cone was ∆α = 0.6.

74CHAPTER 4. HIGH REPETITION RATE OPTICAL PARAMETRIC CHIRPED-PULSE
AMPLIFIER
repetition rate (1.6 W at 515 nm) at a pump intensity of 100 GWcm−2. The achieved OPCPAoutput power was 46 mW (corresponding to Esig = 2.3µJ pulse energy). After measuring theOPCPA output power, the signal beam was blocked, and the AOPF half-cone along the tangen-tial phase-matching direction was measured. The cone was focused onto a calibrated photo-diode (Thorlabs DET10A). The measured AOPF energy within the amplified signal area was2.6nJ. The corresponding AOPF-to-OPCPA energy contrast of EAOPF/Esig ≈ 10−3 representsan upper limit. The AOPF divergence angle was θ = 0.5. Thus, after a propagation distance ofz = 1.5m to the second stage, an upper limit for the AOPF-to-OPCPA intensity contrast couldbe estimated according to
IAOPF
IOPCPA=
EAOPF
Esig·
w2sig
(z tanΘ)2 ·τsig
τAOPF≈ 10−5. (4.2)
where, τsig = 730fs is the pulse duration of the signal after the first stage (at 1/e2 intensity,calculated), and τAOPF ≈ 1.7ps is the pulse duration of the AOPF (at 1/e2 intensity, assumedequal to the measured pump pulse duration). The AOPF divergence angle was determined bymeasuring the fluorescence spectrum in dependence on the internal non-collinear angle, α (seeFig. 4.6b). For comparison, the expected spectral gain is calculated analytically (Fig. 4.6a). Forthe measurement, an aperture with 200 µm diameter was moved along the α direction withinthe phase-matching plane. It was mounted onto a multi-mode fiber-bundle coupled to a gratingspectrometer (Shamrock SR-303i-B with Andor iDus DV420A-OE detector). The measurementshows a qualitative agreement with the calculation for a phase-matching angle of θ = 24.05.From Fig. 4.6b, the internal opening angle of the cone, ∆α ≈ 0.6, was measured, yielding theexternal divergence angle of Θ= 0.5 (half angle4). With a contrast of < 10−5, negligible AOPFis expected from the final amplifier stages, because the AOPF is quenched by the presence ofthe seed signal [3].
The second OPCPA stage (a 3.2 mm long BBO crystal) was pumped at 6.4 mJ with a beamdiameter of 3.7 mm (at 1/e2 intensity), yielding an intensity of 105 GW cm−2. Between the firstand the second stage the signal beam was expanded by a 1:4.5 telescope to a diameter of 5.0 mm.The signal was amplified with a gain of g = 58 to a pulse energy of 0.7 mJ, corresponding to atotal pump-to-signal conversion efficiency of 10% [3]. An additional gain of g= 2 was achievedby exploiting the residual pump energy using a third OPCPA stage (a 2 mm BBO). Efficientenergy extraction was achieved by fine-tuning the delay between pump and signal pulses withinthe second and the third OPCPA stage. The stable operation of the three-stage non-collinearOPCPA could only be achieved when the laboratory conditions remained stable. Under stabletemperature and humidity conditions, we measured an energy deviation of ∆E/E < 0.7% rmsover a period of 30 minutes [3]. A total pulse energy of 1.39 mJ was achieved, correspondingto a final pump-to-signal conversion efficiency of 20%. Thus, from the compressed 1030 nmpulses to the amplified broadband OPCPA pulses a total conversion efficiency of 10% could bedemonstrated. The overall efficiency was 7.7%, derived from the uncompressed output,
17.6mJcomp. 75%−−−−−−→ 13.2mJ SHG 51.1%−−−−−−→ 6.8mJ OPCPA 20%−−−−−−−→ 1.4mJ. (4.3)
In Fig. 4.7 the broadband signal spectra of the oscillator (grey shaded), after the second(blue line) and third (orange line) OPCPA stage are plotted. The amplified bandwidth is ∆ν =
4Here, ∆α is the full angle inside the BBO, whereas Θ is the divergence (half) angle after refraction.

CHAPTER 4. HIGH REPETITION RATE OPTICAL PARAMETRIC CHIRPED-PULSEAMPLIFIER 75
spectr
al in
tensity (
) (a
.u.)
Iλ
600
0.2
0.4
0.6
0.8
1.0
2nd
OPCPA
3rd
OPCPA
wavelength (nm)λ
0.0
700 800 900 1000
a
oscillator
time (µs)t
8000 400
inte
nsity (
a.u
.)
0.0
1.0
0.5
b
Figure 4.7 Amplified spectral bandwidth of the three-stage OPCPA. Spectral intensity of theTi:sapphire oscillator (grey shaded), amplified spectra after the second (blue line) and the thirdOPCPA stage (orange line). The amplified spectral bandwidth is ∆ν = 168 THz at 1/e2 (∆λ =360 nm at λc = 800 nm), featuring a Fourier-limited pulse duration of 6.4 fs. Inset: Typical pulsetrain during the burst-mode operation. Published in [3]
1e-3
1e-2
1e-1
1
spectr
al in
tensity (
) (
a.u
.)I
ν
frequency (THz)ν
-40
-20
0
20
40FL FL
2 2nd nd
3 3rd rd
4 4th th
5th th
spectr
al phase
()
(rad)
φν
0.0
0.2
0.4
0.6
0.8
1.0
time (fs)t
inte
nsity (
) (a
.u.)
It
300
5
a b
350 400 450 500 -20 -10 0 10 20
Figure 4.8 Evaluation of the compressible pulse duration. (a) Amplified spectrum and spectral phasefor different compensated higher-order dispersion terms: β2 = 0, β3,4,5,6 = 0 (red dashed); β2,3 = 0,β4,5,6 = 0 (green dashed), β2,3,4 = 0, β5,6 = 0 (blue); β2,3,4,5 = 0, β6 = 0 (red) and the Fourier-limit(FL, grey). (b) Corresponding calculated pulse shapes. Pulse durations FWHM: 6.4 fs (FL=Fourierlimited), 19.2 fs (2nd order), 8.7 fs (3rd order), 6.7 fs (4th order), 6.5 fs (5th order).
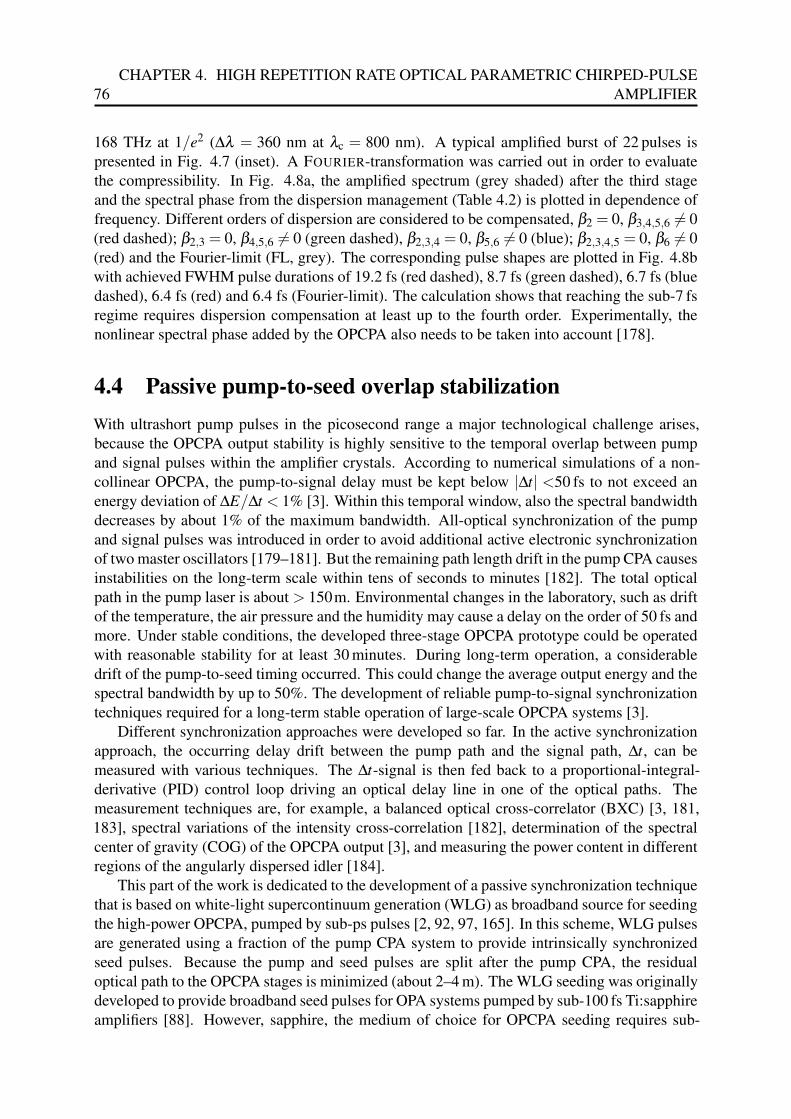
76CHAPTER 4. HIGH REPETITION RATE OPTICAL PARAMETRIC CHIRPED-PULSE
AMPLIFIER
168 THz at 1/e2 (∆λ = 360 nm at λc = 800 nm). A typical amplified burst of 22 pulses ispresented in Fig. 4.7 (inset). A FOURIER-transformation was carried out in order to evaluatethe compressibility. In Fig. 4.8a, the amplified spectrum (grey shaded) after the third stageand the spectral phase from the dispersion management (Table 4.2) is plotted in dependence offrequency. Different orders of dispersion are considered to be compensated, β2 = 0, β3,4,5,6 = 0(red dashed); β2,3 = 0, β4,5,6 = 0 (green dashed), β2,3,4 = 0, β5,6 = 0 (blue); β2,3,4,5 = 0, β6 = 0(red) and the Fourier-limit (FL, grey). The corresponding pulse shapes are plotted in Fig. 4.8bwith achieved FWHM pulse durations of 19.2 fs (red dashed), 8.7 fs (green dashed), 6.7 fs (bluedashed), 6.4 fs (red) and 6.4 fs (Fourier-limit). The calculation shows that reaching the sub-7 fsregime requires dispersion compensation at least up to the fourth order. Experimentally, thenonlinear spectral phase added by the OPCPA also needs to be taken into account [178].
4.4 Passive pump-to-seed overlap stabilizationWith ultrashort pump pulses in the picosecond range a major technological challenge arises,because the OPCPA output stability is highly sensitive to the temporal overlap between pumpand signal pulses within the amplifier crystals. According to numerical simulations of a non-collinear OPCPA, the pump-to-signal delay must be kept below |∆t| <50 fs to not exceed anenergy deviation of ∆E/∆t < 1% [3]. Within this temporal window, also the spectral bandwidthdecreases by about 1% of the maximum bandwidth. All-optical synchronization of the pumpand signal pulses was introduced in order to avoid additional active electronic synchronizationof two master oscillators [179–181]. But the remaining path length drift in the pump CPA causesinstabilities on the long-term scale within tens of seconds to minutes [182]. The total opticalpath in the pump laser is about > 150m. Environmental changes in the laboratory, such as driftof the temperature, the air pressure and the humidity may cause a delay on the order of 50 fs andmore. Under stable conditions, the developed three-stage OPCPA prototype could be operatedwith reasonable stability for at least 30 minutes. During long-term operation, a considerabledrift of the pump-to-seed timing occurred. This could change the average output energy and thespectral bandwidth by up to 50%. The development of reliable pump-to-signal synchronizationtechniques required for a long-term stable operation of large-scale OPCPA systems [3].
Different synchronization approaches were developed so far. In the active synchronizationapproach, the occurring delay drift between the pump path and the signal path, ∆t, can bemeasured with various techniques. The ∆t-signal is then fed back to a proportional-integral-derivative (PID) control loop driving an optical delay line in one of the optical paths. Themeasurement techniques are, for example, a balanced optical cross-correlator (BXC) [3, 181,183], spectral variations of the intensity cross-correlation [182], determination of the spectralcenter of gravity (COG) of the OPCPA output [3], and measuring the power content in differentregions of the angularly dispersed idler [184].
This part of the work is dedicated to the development of a passive synchronization techniquethat is based on white-light supercontinuum generation (WLG) as broadband source for seedingthe high-power OPCPA, pumped by sub-ps pulses [2, 92, 97, 165]. In this scheme, WLG pulsesare generated using a fraction of the pump CPA system to provide intrinsically synchronizedseed pulses. Because the pump and seed pulses are split after the pump CPA, the residualoptical path to the OPCPA stages is minimized (about 2–4 m). The WLG seeding was originallydeveloped to provide broadband seed pulses for OPA systems pumped by sub-100 fs Ti:sapphireamplifiers [88]. However, sapphire, the medium of choice for OPCPA seeding requires sub-

CHAPTER 4. HIGH REPETITION RATE OPTICAL PARAMETRIC CHIRPED-PULSEAMPLIFIER 77
100 fs pulses to achieve a stable WLG. As discussed already in Section 2.4.4, pulse durations inthe sub-ps range are not sufficient for an efficient multi-photon ionization (MPI), which must bethe dominant process for the free-electron generation during the filamentation. It has been foundthat laser host materials, such as yttrium-aluminum-garnet (YAG), are suitable crystals for WLGpumped with sub-ps pulses [92]. They have a large nonlinear refractive index, enabling a lowerrequired critical power, Pcrit (Eq. 2.50), for self-focusing. Owing to their smaller band-gapcompared to sapphire, a lower-order multiphoton absorption is required, resulting in a highermultiphoton ionization (MPI) rate.
4.4.1 Supercontinuum-generation in laser host materials
Different laser host materials were used to investigate the spectral broadening from white-light continuum generation: yttrium-aluminum-garnet (YAG5), Yb-doped potassium-gadolin-ium tungstate (Yb:KGW6), Yb-doped potassium-yttrium-tungstate (Yb:KYW7), and Yb-dopedyttriumorthovanadate (Yb:YVO4
8). The pump pulses were provided by an Yb:glass fiber am-plifier at a central wavelength of λc = 1030nm and a pulse duration of 850 fs and focusedinto the crystal with an f = 100mm lens. The pulse energy and the numerical aperture, NA,were optimized for a stable continuum generation in the different crystals (10 mm YAG: 7.8 µJ,NA = 0.02; 8 mm Yb:KGW: 6.6 µJ, NA = 0.02; 8 mm Yb:KYW: 2.5 µJ, NA = 0.02; 8 mmYb:YVO4: 5.2 µJ, NA = 0.006). After the crystal, the WLG beam was recollimated with afocusing mirror of f = 100mm and spectrally filtered by a high-pass mirror (reflective forλ < 900nm). In Fig. 4.9, the measured spectra of the blue-shifted part, ∆ω+, are presented.The broadest spectral width is achieved in the YAG crystal, with a spectral cut-off at 470 nm. Incomparison, the spectrum generated in Yb:YVO4 has the cut-off already at 570 nm. The spectraof YAG and Yb:YVO4 feature a plateau-like region between 750 nm and 900 nm and a maxi-mum at 620 nm (YAG) and 700 nm (Yb:YVO4), respectively. The same plateau is observedfor Yb:KGW, but the maxima obtained from the tungstates (Yb:KGW, Yb:KYW) are accom-panied by almost symmetric side-maxima, that are expected to originate from further involvednon-linear processes, such as RAMAN-scattering and four-wave-mixing [98]. In Table 4.3, thenonlinear refractive index, n2, the optical band-gap, Egap, and the measured cut-off wavelengthare listed. An increasing Egap comes along with a smaller n2, but the cut-off increases to higherfrequencies, corresponding to a larger continuum bandwidth. For the development of the intrin-sic pump-to-signal synchronization for a high-power OPCPA, YAG was chosen as the WLGmaterial, because it features the largest bandwidth. The other materials are also interesting, butin this work they were not investigated regarding the long-term stability.
4.4.2 Optical parametric amplification of supercontinuum pulses
An OPCPA was realized in order to investigate the feasibility for amplification and temporalcompression of sub-ps pumped WLG pulses generated in YAG. In Fig. 4.10, a schematic of theexperimental setup is shown. The compressed output pulses from the Yb:glass fiber CPA (op-erated at a repetition rate of 20 kHz) were separated in a beam-splitter (BS). The larger fraction
5Y3Al5O12,6Yb3+:KGd(WO4)27Yb3+:KY(WO4)28Yb3+:YVO4

78CHAPTER 4. HIGH REPETITION RATE OPTICAL PARAMETRIC CHIRPED-PULSE
AMPLIFIER
0.0
0.2
0.4
0.6
0.8
1.0
spectr
al in
tensity (
) (a
.u.)
Iλ
wavelength (nm)λ
YAG
Yb:KGW
Yb:YVO4
Yb:KYW
650 700 750 800 850 900600550500450
Figure 4.9 White-light continuum generation in laser host materials, pumped by a fiber laser withλc = 1030nm and 850 fs pulse duration. The blue-shifted part is spectrally filtered by a high-passmirror (cut-off wavelength 900 nm). The plot shows the spectra generated in YAG (red), Yb:KGW(black), Yb:KYW (orange) and Yb:YVO4 (dark green).
Sapphire YAG Yb:KGW Yb:KYW Yb:YVO4n2 (10−16 cm2W−1) 3.1d 6.9d 10d 8.6b 15b
Egap (eV) 8.2a 5.9d 4.0c 4.3b 3.7b
cut-off (nm) (190)d 470 560 (500)d 540 580a deduced from the manufacturer’s transmission cut-off at 8.2 eV (Thorlabs).b from [185].c from [186].d value reported in [92].
Table 4.3 The nonlinear refractive index, n2, the optical band-gap, Egap, and the cut-off wavelengthof the blue-shifted part of the measured WLG spectrum in different materials. Sapphire is listed forcomparison.
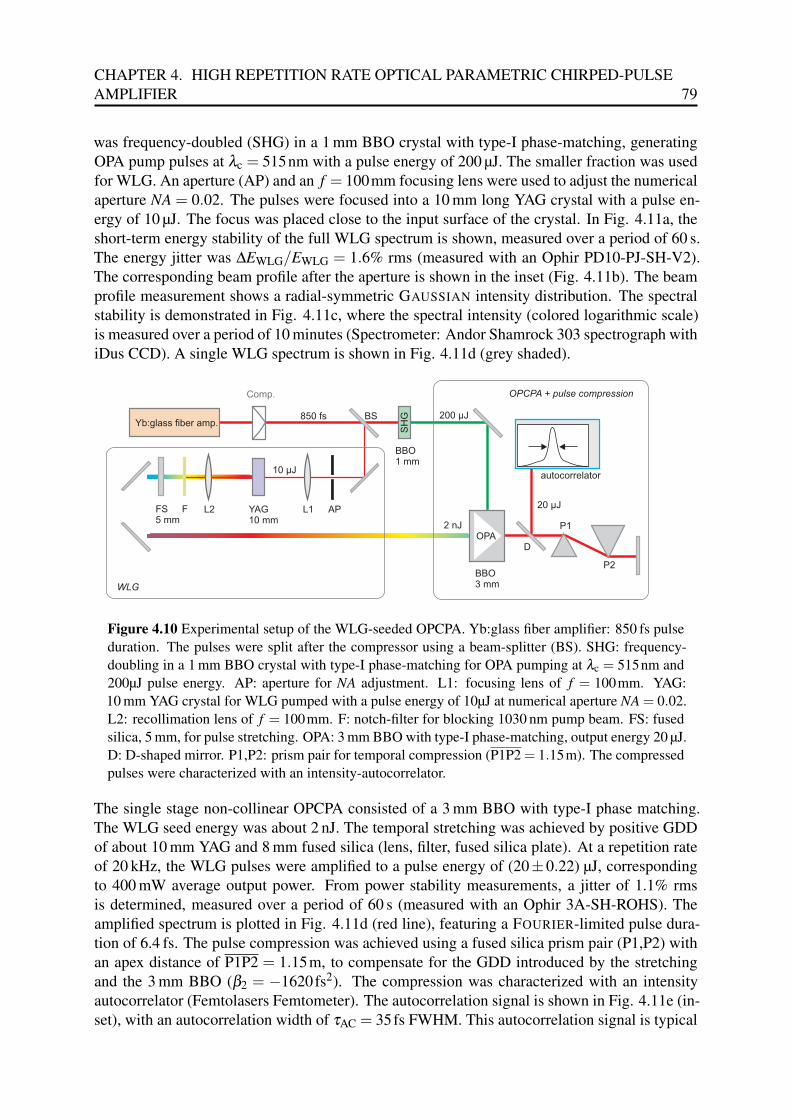
CHAPTER 4. HIGH REPETITION RATE OPTICAL PARAMETRIC CHIRPED-PULSEAMPLIFIER 79
was frequency-doubled (SHG) in a 1 mm BBO crystal with type-I phase-matching, generatingOPA pump pulses at λc = 515nm with a pulse energy of 200 µJ. The smaller fraction was usedfor WLG. An aperture (AP) and an f = 100mm focusing lens were used to adjust the numericalaperture NA = 0.02. The pulses were focused into a 10 mm long YAG crystal with a pulse en-ergy of 10 µJ. The focus was placed close to the input surface of the crystal. In Fig. 4.11a, theshort-term energy stability of the full WLG spectrum is shown, measured over a period of 60 s.The energy jitter was ∆EWLG/EWLG = 1.6% rms (measured with an Ophir PD10-PJ-SH-V2).The corresponding beam profile after the aperture is shown in the inset (Fig. 4.11b). The beamprofile measurement shows a radial-symmetric GAUSSIAN intensity distribution. The spectralstability is demonstrated in Fig. 4.11c, where the spectral intensity (colored logarithmic scale)is measured over a period of 10 minutes (Spectrometer: Andor Shamrock 303 spectrograph withiDus CCD). A single WLG spectrum is shown in Fig. 4.11d (grey shaded).
Yb:glass fiber amp.
BBO1 mm
YAG10 mm
Comp.
L2
BS
F
BBO3 mm
10 µJautocorrelator
20 µJ
200 µJ
2 nJOPA
850 fs
SH
GOPCPA + pulse compression
WLG
L1 APFS5 mm
D
P1
P2
Figure 4.10 Experimental setup of the WLG-seeded OPCPA. Yb:glass fiber amplifier: 850 fs pulseduration. The pulses were split after the compressor using a beam-splitter (BS). SHG: frequency-doubling in a 1 mm BBO crystal with type-I phase-matching for OPA pumping at λc = 515nm and200µJ pulse energy. AP: aperture for NA adjustment. L1: focusing lens of f = 100mm. YAG:10 mm YAG crystal for WLG pumped with a pulse energy of 10µJ at numerical aperture NA = 0.02.L2: recollimation lens of f = 100mm. F: notch-filter for blocking 1030 nm pump beam. FS: fusedsilica, 5 mm, for pulse stretching. OPA: 3 mm BBO with type-I phase-matching, output energy 20 µJ.D: D-shaped mirror. P1,P2: prism pair for temporal compression (P1P2 = 1.15m). The compressedpulses were characterized with an intensity-autocorrelator.
The single stage non-collinear OPCPA consisted of a 3 mm BBO with type-I phase matching.The WLG seed energy was about 2 nJ. The temporal stretching was achieved by positive GDDof about 10 mm YAG and 8 mm fused silica (lens, filter, fused silica plate). At a repetition rateof 20 kHz, the WLG pulses were amplified to a pulse energy of (20±0.22) µJ, correspondingto 400 mW average output power. From power stability measurements, a jitter of 1.1% rmsis determined, measured over a period of 60 s (measured with an Ophir 3A-SH-ROHS). Theamplified spectrum is plotted in Fig. 4.11d (red line), featuring a FOURIER-limited pulse dura-tion of 6.4 fs. The pulse compression was achieved using a fused silica prism pair (P1,P2) withan apex distance of P1P2 = 1.15m, to compensate for the GDD introduced by the stretchingand the 3 mm BBO (β2 = −1620fs2). The compression was characterized with an intensityautocorrelator (Femtolasers Femtometer). The autocorrelation signal is shown in Fig. 4.11e (in-set), with an autocorrelation width of τAC = 35fs FWHM. This autocorrelation signal is typical

80CHAPTER 4. HIGH REPETITION RATE OPTICAL PARAMETRIC CHIRPED-PULSE
AMPLIFIER
En
erg
y (
nJ)
0
wa
ve
len
gth
λ(n
m)
WLG seed
amplified
1
2
3
10
0
20 30 40 50 60
time (s)t
500
700
900
0 2 4 6 8 10
time (min)t
a
c
b
d
e
sp
ectr
al in
ten
sity
()
(a.u
.)I
λ
0.0
0.5
1.0
AC
sig
na
l(
) (a
.u.)
St
τAC = 35 fs
0-50-100 50 100
0
0.2
0.4
0.6
0.8
1.0
700600500 800 900750650550 850
wavelength λ (nm)
Figure 4.11 Experimental results of the WLG-seeded OPCPA. (a) WLG pulse energy after the filter,measured over 60 s with 1.6% rms energy jitter. (b) Inset: WLG beam profile. (c) Spectral stability:spectrum (colored logarithmic scale), measured over 10 min. (d) WLG seed spectrum (grey shaded)and amplified spectrum (red line). The modulations in the seed spectrum arise from the 1030 nmnotch filter (e) Inset: autocorrelation (AC) signal with autocorrelation width tAC = 35fs. Publishedin [163].
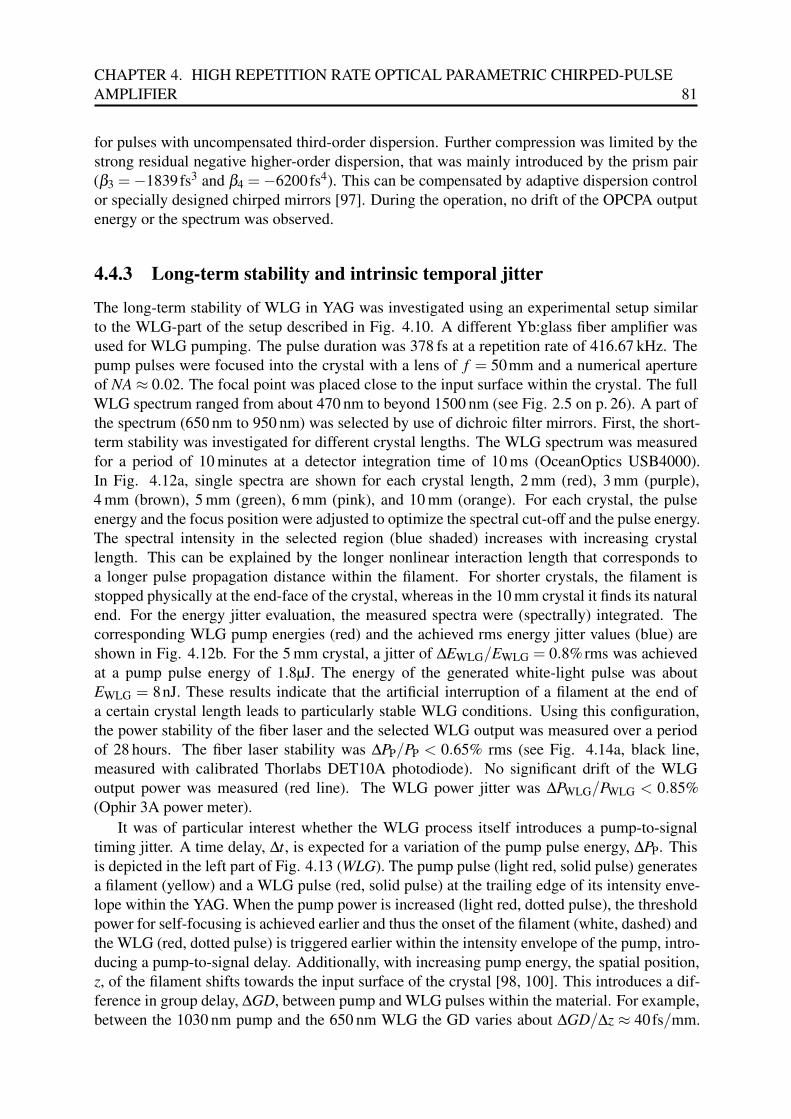
CHAPTER 4. HIGH REPETITION RATE OPTICAL PARAMETRIC CHIRPED-PULSEAMPLIFIER 81
for pulses with uncompensated third-order dispersion. Further compression was limited by thestrong residual negative higher-order dispersion, that was mainly introduced by the prism pair(β3 =−1839fs3 and β4 =−6200fs4). This can be compensated by adaptive dispersion controlor specially designed chirped mirrors [97]. During the operation, no drift of the OPCPA outputenergy or the spectrum was observed.
4.4.3 Long-term stability and intrinsic temporal jitter
The long-term stability of WLG in YAG was investigated using an experimental setup similarto the WLG-part of the setup described in Fig. 4.10. A different Yb:glass fiber amplifier wasused for WLG pumping. The pulse duration was 378 fs at a repetition rate of 416.67 kHz. Thepump pulses were focused into the crystal with a lens of f = 50mm and a numerical apertureof NA ≈ 0.02. The focal point was placed close to the input surface within the crystal. The fullWLG spectrum ranged from about 470 nm to beyond 1500 nm (see Fig. 2.5 on p. 26). A part ofthe spectrum (650 nm to 950 nm) was selected by use of dichroic filter mirrors. First, the short-term stability was investigated for different crystal lengths. The WLG spectrum was measuredfor a period of 10 minutes at a detector integration time of 10 ms (OceanOptics USB4000).In Fig. 4.12a, single spectra are shown for each crystal length, 2 mm (red), 3 mm (purple),4 mm (brown), 5 mm (green), 6 mm (pink), and 10 mm (orange). For each crystal, the pulseenergy and the focus position were adjusted to optimize the spectral cut-off and the pulse energy.The spectral intensity in the selected region (blue shaded) increases with increasing crystallength. This can be explained by the longer nonlinear interaction length that corresponds toa longer pulse propagation distance within the filament. For shorter crystals, the filament isstopped physically at the end-face of the crystal, whereas in the 10 mm crystal it finds its naturalend. For the energy jitter evaluation, the measured spectra were (spectrally) integrated. Thecorresponding WLG pump energies (red) and the achieved rms energy jitter values (blue) areshown in Fig. 4.12b. For the 5 mm crystal, a jitter of ∆EWLG/EWLG = 0.8%rms was achievedat a pump pulse energy of 1.8µJ. The energy of the generated white-light pulse was aboutEWLG = 8nJ. These results indicate that the artificial interruption of a filament at the end ofa certain crystal length leads to particularly stable WLG conditions. Using this configuration,the power stability of the fiber laser and the selected WLG output was measured over a periodof 28 hours. The fiber laser stability was ∆PP/PP < 0.65% rms (see Fig. 4.14a, black line,measured with calibrated Thorlabs DET10A photodiode). No significant drift of the WLGoutput power was measured (red line). The WLG power jitter was ∆PWLG/PWLG < 0.85%(Ophir 3A power meter).
It was of particular interest whether the WLG process itself introduces a pump-to-signaltiming jitter. A time delay, ∆t, is expected for a variation of the pump pulse energy, ∆PP. Thisis depicted in the left part of Fig. 4.13 (WLG). The pump pulse (light red, solid pulse) generatesa filament (yellow) and a WLG pulse (red, solid pulse) at the trailing edge of its intensity enve-lope within the YAG. When the pump power is increased (light red, dotted pulse), the thresholdpower for self-focusing is achieved earlier and thus the onset of the filament (white, dashed) andthe WLG (red, dotted pulse) is triggered earlier within the intensity envelope of the pump, intro-ducing a pump-to-signal delay. Additionally, with increasing pump energy, the spatial position,z, of the filament shifts towards the input surface of the crystal [98, 100]. This introduces a dif-ference in group delay, ∆GD, between pump and WLG pulses within the material. For example,between the 1030 nm pump and the 650 nm WLG the GD varies about ∆GD/∆z ≈ 40fs/mm.

82CHAPTER 4. HIGH REPETITION RATE OPTICAL PARAMETRIC CHIRPED-PULSE
AMPLIFIERspectr
al in
tensity (
) (a
.u.)
Iλ
wavelength (nm)λ
0.0
0.2
0.4
0.6
0.8
1.0
2 mm
3 mm
4 mm
5 mm
6 mm
10 mm
3 mm4 mm
5 mm
6 mm
10 mm
550 600 650 700 750 800 850 900
2 mm
0
5
10
15
rms
rms (
%)
0
1
2
3
pump energy
pum
p e
nerg
y(
J)
PP
μ
2 4 6 8 10
crystal length (mm)
a b
Figure 4.12 Evaluation of different YAG crystal lengths for an optimized WLG stability. (a) WLGspectrum achieved in YAG crystals of 2 mm (red), 3 mm (purple), 4 mm (brown), 5 mm (green),6 mm (pink), and 10 mm (orange) length. The blue shaded area indicates the investigated spectralregion. (b) Achieved WLG energy jitter in % rms (blue) and WLG pump energy (red) in dependenceon the crystal length.
According to both mechanisms for a given pump energy jitter also a jitter of the pump-to-signaltiming is expected.
To measure this delay, a two-crystal balanced optical cross-correlator (BXC) was used [183].As depicted in the right part of Fig. 4.13 (BXC) a fraction of the 1030 nm pump pulse, Ip(t),was correlated with the WLG pulse, IWLG(t). For the measurement, a spectral filter (F) wasused to select the (650±10)nm part of the WLG spectrum for the correlation. The two-crystalBXC consists of two correlator arms and two balanced photomultipliers (DET1, DET2, devices:Hamamatsu H6780). In the first arm, the intensity cross-correlation,
∫+∞−∞ Ip(t)IWLG(t −∆t), is
measured by SFG in a type-I BBO (θ = 27.7). The sum-frequency signal at 399 nm was band-pass filtered (FB) for the detection. A group delay, GD, between pump and WLG pulses was in-troduced in the second correlator arm by using a 6 mm fused silica plate (FS), yielding the cross-correlation
∫+∞−∞ Ip(t)IWLG(t−∆t+GD). Measuring the difference voltage, U =UDET2−UDET1,
between both detector signals yielded a background-free signal, which was insensitive to inten-sity fluctuations within the single correlator arms (green curve). The signal was proportional tothe temporal delay in direction (sign) and amplitude, with a slope of ∆t/∆U = 6.67fs/mV [3].
The pump-to-WLG delay was measured in dependence of increasing pump energy. Themeasurement is presented in Fig. 4.14b. The onset of WLG was observed at pump energies ofEP ≥ 1 µJ. In this case, the position of the filament was at the end of the crystal. By increasingthe pump energy to 1.47 µJ, an increase of the delay between pump and WLG of about 200 fswas measured. Further increase of the pump energy led to an oscillation of the delay. This isattributed to a sequence of plasma-defocusing and self-focusing within the crystal. Above apump pulse energy of 1.9 µJ, the excessive energy was sufficient to form a second filament andthus a second WLG pulse. This pulse is delayed by about 160 fs with respect to the first WLGpulse, leading to stable interference modulations in the WLG spectrum [3].
The operation point for the stable generation of single WLG pulses was chosen slightly
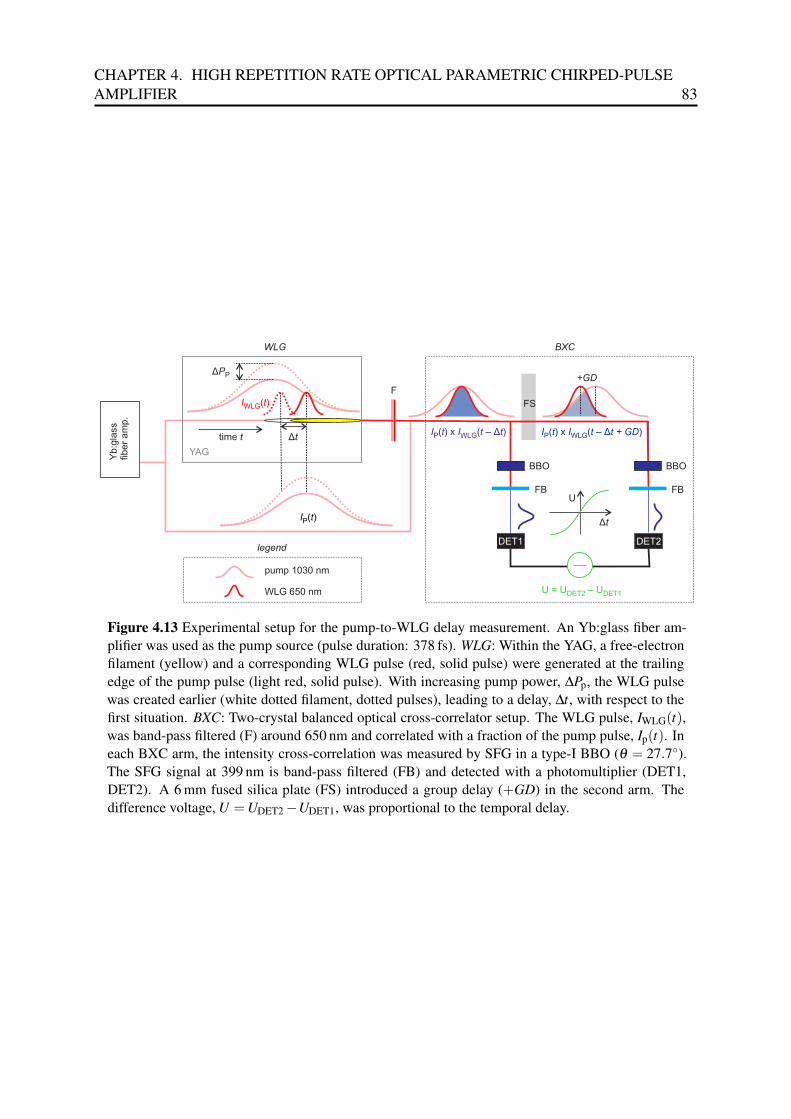
CHAPTER 4. HIGH REPETITION RATE OPTICAL PARAMETRIC CHIRPED-PULSEAMPLIFIER 83
ΔPP
YAG
FS
Yb
:gla
ss
fib
er
am
p.
U = U UDET2 DET1–
BBO
FB
WLG
Δt
DET1 DET2
+GD
BXC
F
BBO
FB
I tP( )
I tWLG( )
legend
pump 1030 nm
WLG 650 nm
I t I t tP WLG( ) x ( )– Δ I t I t t GDP WLG( ) x ( )Δ– +
Δt
U
time t
Figure 4.13 Experimental setup for the pump-to-WLG delay measurement. An Yb:glass fiber am-plifier was used as the pump source (pulse duration: 378 fs). WLG: Within the YAG, a free-electronfilament (yellow) and a corresponding WLG pulse (red, solid pulse) were generated at the trailingedge of the pump pulse (light red, solid pulse). With increasing pump power, ∆Pp, the WLG pulsewas created earlier (white dotted filament, dotted pulses), leading to a delay, ∆t, with respect to thefirst situation. BXC: Two-crystal balanced optical cross-correlator setup. The WLG pulse, IWLG(t),was band-pass filtered (F) around 650 nm and correlated with a fraction of the pump pulse, Ip(t). Ineach BXC arm, the intensity cross-correlation was measured by SFG in a type-I BBO (θ = 27.7).The SFG signal at 399 nm is band-pass filtered (FB) and detected with a photomultiplier (DET1,DET2). A 6 mm fused silica plate (FS) introduced a group delay (+GD) in the second arm. Thedifference voltage, U =UDET2 −UDET1, was proportional to the temporal delay.

84CHAPTER 4. HIGH REPETITION RATE OPTICAL PARAMETRIC CHIRPED-PULSE
AMPLIFIER
below the onset of the second filament at EP ≈ 1.8 µJ, as indicated by the blue region in Fig.4.14b. The delay within this region varied by ∆T/∆EP = (0.66± 0.4) fs/nJ. Multiplicationwith the energy deviation of the pump (Fig. 4.14a) yields a good estimate of the intrinsic timingjitter of the continuum seeder (Fig. 4.14c), yielding δ t = (7.0±0.5) fs rms (16 fs FWHM) [3].
0.0
0.2
0.4
0.6
0.8
1.0
fre
qu
en
cy (
a.u
.)
0
200
400
600
800
1000
ΔP PP P/ < 0.65% rms
WL
G p
um
p p
ow
er
(mW
)P
P
time (h)t
0
1
2
3
4
5
6
7
WLG power
ΔP PWLG WLG/ < 0.85% rms
WL
G p
ow
er
(mW
)P
WL
G
-250
-200
-150
-100
-50
0
50
scan2
scan1
de
lay
(fs)
tΔ
WLG pump energy (µJ)EP
1.0 1.2 1.4 1.6 1.8 2.0 -20 -10 0 10 20 30
delay (fs)tΔ
0 5 10 15 20 25
second fila
ment
opera
tion
a
b c
δt = (7.0 0.5) fs rms±
WLG pump power
Figure 4.14 Long-term stability and intrinsic temporal jitter from WLG. (a) Pump power (black)and WLG power (red), measured over 28 hours. The power deviation is smaller than 0.65% rmsfor the pump and 0.85% rms for the WLG power. The investigated WLG spectral region rangedfrom 650 nm to 950 nm. (b) Delay between pump and WLG pulses at different pump pulse energies,measured with a balanced cross-correlator. The blue region indicates the operation regime (about1.8 µJ). Above 1.9 µJ a second WLG pulse is generated (dashed line). Within the operation regime,the delay varied with a slope of ∆T/∆EP = (0.66 ± 0.04) fs/nJ. (c) Pump-to-WLG delay jitter,derived from the pump jitter in (a) and the slope from the operation regime in (b), ∆t = EP(t) ·∆T/∆EP. The rms width is δ t = (7.0±0.5) fs. Published in [3].

CHAPTER 4. HIGH REPETITION RATE OPTICAL PARAMETRIC CHIRPED-PULSEAMPLIFIER 85
4.5 OPCPA at high average powersOptical parametric chirped-pulse amplifiers can reach high average powers without sophisti-cated cooling. With average powers in the kilowatt range, thermal effects play an importantrole in OPCPA, even though the absorption of the nonlinear crystals is very low compared to aconventional active laser material. In this section, the thermal effects are evaluated to estimatethe scalability for future high power OPCPA systems.
4.5.1 Absorption of signal, idler and pump
0.0
0.2
0.4
0.6
0.8
1.0
1802 nm
500 1000 1500 2000 2500 30000.0
0.2
0.4
0.6
0.8
1.0
500 1000 1500 2000 2500 3000
wavelength (nm)λ wavelength (nm)λ
ga
in(
) (a
.u.)
an
d t
ran
sm
issio
n(
)G
Tλ
λ
721 nm692 nm 2012 nm
signal idler pump transmission reduced idler abs. high idler absorptionlegend:
a b
BBO LBO
Figure 4.15 Evaluation of the idler-absorption in OPCPA. The signal (red line) and idler gain (greyline) is calculated in dependence on the wavelength and compared with the wavelength-dependenttransmission (blue dashed line). In order to avoid strong idler absorption during the amplification,the signal must be spectrally filtered, as indicated by the green box. The blue-shaded areas indicatethe signal-idler frequency pairs that are clipped. (a) BBO: idler components with λid > 2012nmare avoided by cutting signal components with λs < 692nm. (b) LBO: idler components with λid >1802nm are avoided by cutting signal components with λs < 721nm. The pump spectrum at 515 nmis also plotted (green line).
A realistic estimate of heat development in a high average power pumped OPCPA system isdifficult. First of all, the linear absorption of the pump wavelength (515 nm) strongly dependson the crystal quality. This leads to large differences not only between different manufacturers,but also between different batches from the same manufacturer. Second, also the absorption ofthe signal and the idler during the amplification process needs to be evaluated. In Fig. 4.15,the spectral regions of the pump (green line), the signal (red line) and the idler (grey line) arecompared with the spectral transmission, T (λ ) (blue dashed line) for BBO (a) and LBO (b).The signal and idler spectra are represented by the gain curve, G(λ ) calculated according toEqs. (2.30). The pump absorption is addressed by taking the commonly available literaturevalues of the absorption coefficient, αBBO = 1%cm−1 and αLBO = 0.3%cm−1, as listed in Table4.1. Because these may differ by at least one order of magnitude, the following evaluationonly gives an estimate for the thermal effects in OPCPA. The second problem is addressed by

86CHAPTER 4. HIGH REPETITION RATE OPTICAL PARAMETRIC CHIRPED-PULSE
AMPLIFIER
neglecting the absorption of the signal, because it is well within the high transparency windowin both crystals and its power is also a factor of 5–10 lower than the pump power. The idler,however, approaches the mid-infrared region, where the absorption reaches considerable valuesdue to molecular resonances. Strong absorption can be prevented, if the idler spectrum is limitedto λs < 2012nm in BBO and λs < 1802nm in LBO. At these wavelengths, the idler absorptionequals the pump absorption in the transmission curve. The idler spectrum is limited by blockingthe corresponding short-wavelength part of the signal spectrum, λid < 692nm in BBO and λid <721nm in LBO. These signal-idler pairs are indicated by the blue-shaded regions in the figure.The regions of reduced absorption are indicated by the green shaded box. With this bandwidthclipping, the idler absorption can also be neglected, and the powerful pump beam is consideredas the major source of crystal heating.
4.5.2 Temperature dependence of gain bandwidth
position ‘ (mm)x
x (mm)
0
90
180
270
2 6 10 14
20
40
60
80
100
0
20
40
60
80
100
2 6 10 142 6 10 14
2
6
10
14
2
6
10
14
50
100
150
200
250
300
2 6 10 14
tem
pe
ratu
re(°
C)
Tte
mp
era
ture
(°C
)T
tem
pe
ratu
re(°
C)
Tte
mp
era
ture
(°C
)T
BBO1 kW
LBO1 kW
a
c
b
d
position (mm)‘x
position (mm)‘x
position (mm)‘x
po
sitio
n(m
m)
‘y
po
sitio
n(m
m)
y‘
Figure 4.16 Simulated temperature profiles due to the absorption of a 1 kW pump beam with4 mm diameter within BBO and LBO. The crystal dimensions are 15× 15× 2mm. (a) BBO, two-dimensional distribution. The pump propagation is perpendicular to the plotted x′y′-plane. (b) Li-neout profile within the phase-matching plane (crystal’s xz-plane), indicated by the white-dashedline in (a). The maximum temperature in BBO is 260C. (c) LBO, two-dimensional distribution.The plotted crystal plane is perpendicular to the pump propagation. (d) Lineout profile within thephase-matching plane (crystal’s xy-plane), indicated by the white-dashed line in (c). The maximumtemperature in LBO is 58C. Simulations performed by M. LEMKE (DESY).
Due to the heat accumulation and thermal conduction, a temperature profile will developwithin the crystal. With neglected signal and idler absorption, and assuming a radial symmetric
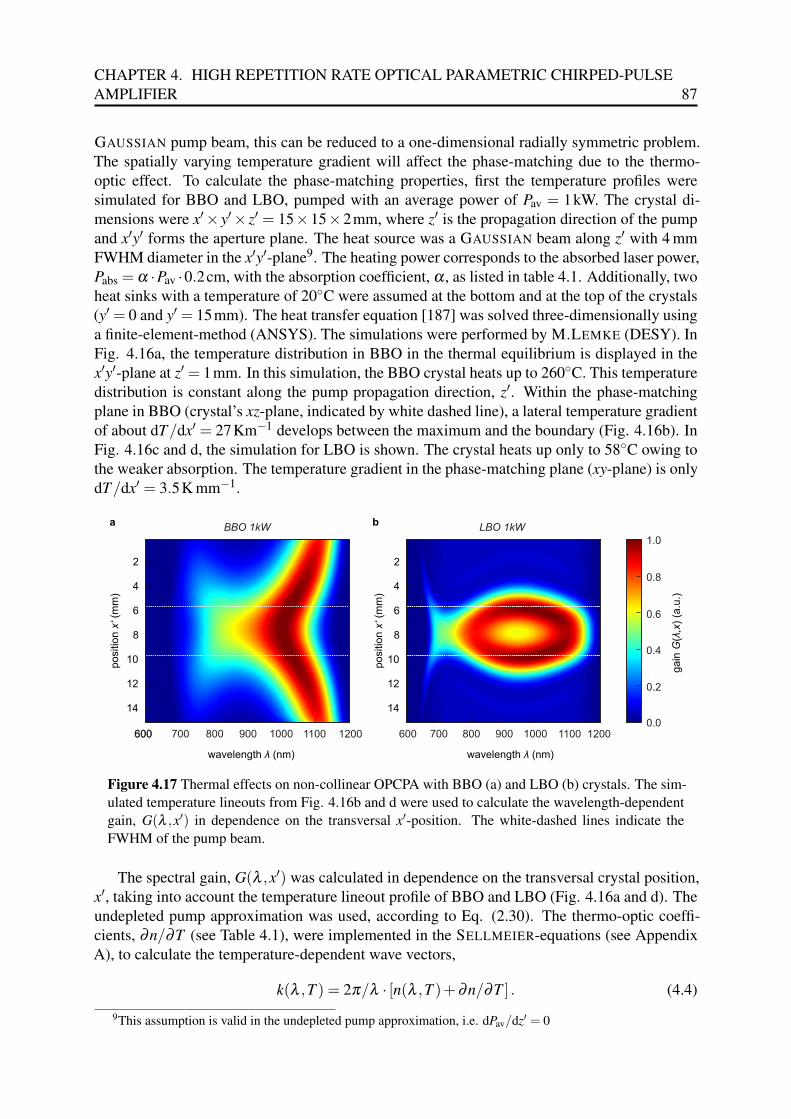
CHAPTER 4. HIGH REPETITION RATE OPTICAL PARAMETRIC CHIRPED-PULSEAMPLIFIER 87
GAUSSIAN pump beam, this can be reduced to a one-dimensional radially symmetric problem.The spatially varying temperature gradient will affect the phase-matching due to the thermo-optic effect. To calculate the phase-matching properties, first the temperature profiles weresimulated for BBO and LBO, pumped with an average power of Pav = 1kW. The crystal di-mensions were x′× y′× z′ = 15×15×2mm, where z′ is the propagation direction of the pumpand x′y′ forms the aperture plane. The heat source was a GAUSSIAN beam along z′ with 4 mmFWHM diameter in the x′y′-plane9. The heating power corresponds to the absorbed laser power,Pabs = α ·Pav ·0.2cm, with the absorption coefficient, α , as listed in table 4.1. Additionally, twoheat sinks with a temperature of 20C were assumed at the bottom and at the top of the crystals(y′ = 0 and y′ = 15mm). The heat transfer equation [187] was solved three-dimensionally usinga finite-element-method (ANSYS). The simulations were performed by M.LEMKE (DESY). InFig. 4.16a, the temperature distribution in BBO in the thermal equilibrium is displayed in thex′y′-plane at z′ = 1mm. In this simulation, the BBO crystal heats up to 260C. This temperaturedistribution is constant along the pump propagation direction, z′. Within the phase-matchingplane in BBO (crystal’s xz-plane, indicated by white dashed line), a lateral temperature gradientof about dT/dx′ = 27Km−1 develops between the maximum and the boundary (Fig. 4.16b). InFig. 4.16c and d, the simulation for LBO is shown. The crystal heats up only to 58C owing tothe weaker absorption. The temperature gradient in the phase-matching plane (xy-plane) is onlydT/dx′ = 3.5K mm−1.
positio
n(m
m)
x‘
2
4
6
8
10
12
14
600 700 800 900 1000 1100 600 700 800 900 1000 1100 1200
wavelength (nm)λ
2
4
6
8
10
12
14
wavelength (nm)λ
positio
n(m
m)
x‘
a b
12006000.0
0.2
0.4
0.6
0.8
1.0
gain
()
(a.u
.)G
,xλ
BBO 1kW LBO 1kW
Figure 4.17 Thermal effects on non-collinear OPCPA with BBO (a) and LBO (b) crystals. The sim-ulated temperature lineouts from Fig. 4.16b and d were used to calculate the wavelength-dependentgain, G(λ ,x′) in dependence on the transversal x′-position. The white-dashed lines indicate theFWHM of the pump beam.
The spectral gain, G(λ ,x′) was calculated in dependence on the transversal crystal position,x′, taking into account the temperature lineout profile of BBO and LBO (Fig. 4.16a and d). Theundepleted pump approximation was used, according to Eq. (2.30). The thermo-optic coeffi-cients, ∂n/∂T (see Table 4.1), were implemented in the SELLMEIER-equations (see AppendixA), to calculate the temperature-dependent wave vectors,
k(λ ,T ) = 2π/λ · [n(λ ,T )+∂n/∂T ] . (4.4)
9This assumption is valid in the undepleted pump approximation, i.e. dPav/dz′ = 0
88CHAPTER 4. HIGH REPETITION RATE OPTICAL PARAMETRIC CHIRPED-PULSE
AMPLIFIER
A super-GAUSSIAN signal spectrum,
I(λ ) ∝ exp(−λ 10/λ 10c ), (4.5)
was used as input spectrum for both crystals. The spectrum ranged from 641 nm–1200 nm at5% intensity. The results are shown in Fig. 4.17. For BBO (a), the phase-matching anglewas optimized for the peak temperature of 260C, θ = 23.95 (the non-collinear angle wasnot varied). As expected, because of the varying phase-matching conditions, the spectral gainbandwidth decreases along the temperature gradient. Owing to the large thermal acceptance ofBBO, ∆T ∆k, a large bandwidth is achieved at least within the 4 mm FWHM of the pump beam(indicated by white-dashed lines). Although LBO has a five-times lower maximum temperature,a similar result is obtained (b). The phase-matching angle was optimized for 58C, θ = 20.1.
In conclusion, broadband OPCPA is possible at high average power, pumped at 1 kW. BBOand LBO crystals keep the broadband phase-matching at least within the FWHM of the pump.Whereas the larger thermal acceptance bandwidth of BBO balances its drastic temperature in-crease, LBO heats up only to a fifth of the temperature, but has a similar bandwidth behavior.The behavior of BBO at such high temperature needs to be investigated experimentally. In orderto limit the total accumulated temperature, BBO could be used in the pre-amplification stage,where its large nonlinear coefficient benefits large single-pass gain. For amplifier stages withhighest average pump powers, LBO affords a better durability. It is worth noting that recent ab-sorption measurements of LBO crystals revealed a one-order of magnitude smaller absorptioncoefficient as compared to the literature values used for the presented simulations. Thus, LBOcrystals produced today are expected to be applicable even for 10 kW of pump power.

Chapter 5
Conclusion and Outlook
With the realization of a single-shot temporal diagnostic method for XUV and X-ray free-electron lasers and a high repetition rate burst-mode laser amplifier, this work contributes signif-icantly to the improvement of the experimental conditions at FEL facilities. The performanceof two-color pump-probe experiments at SASE FELs is hindered by pulse-to-pulse fluctuations.In particular, the arrival time delay and the pulse shape vary from pulse to pulse. Exact knowl-edge of the pulse characteristics on a permanent regular basis promises a new quality of FELscience. The temporal diagnostic method developed in this work allows to measure both param-eters simultaneously using a solid-state cross-correlation. An initially transparent solid-statetarget (fused silica or silicon nitride) was pumped with an XUV pulse. The ultrafast opticaltransmission change due to photoionization was probed with a known optical laser pulse. Forthe evaluation, a comprehensive theoretical model was developed, including the ionization dy-namics within the target and the related change of the optical properties. It was shown thatthe measured signal is related to the cross-correlation between both pulses, allowing temporaljitter measurements and the retrieval of the pulse duration of single FEL pulses. As the methoddoes not rely on discrete atomic transitions, it is applicable from the XUV to the X-ray regime.The presented measurements were performed at FLASH, using two distinct wavelengths. Themeasured pulse durations were (184±14) fs at 41.5 nm and (21±19) fs at 5.5 nm wavelength,using a 1 mm fused silica target. The possibility for online measurements, i.e. simultaneoustemporal characterization during an experiment, was investigated using ultra-thin silicon nitridemembranes of 20 nm thickness. In the soft X-ray range, a residual soft-X-ray transmission of10–45% is expected. The single-shot measurement yielded (34± 19) fs at 5.5 nm. The mea-sured pulse durations are in agreement with theoretical expectations for the used FEL operationparameters. With adequate resolution, the detection of complex FEL pulse shapes is possible,even with a realistic signal-to-noise ratio. It was shown that a temporal resolution of sub-10 fsis possible, if a short optical pulse is available at the experimental end station. Therefore, acompact OPCPA was developed, delivering wavelength-tunable pulses as short as 20 fs at apulse energy of 1 µJ. It can be upgraded to sub-10 fs pulse duration by the implementation ofspecially designed chirped mirrors. The device is pumped by the available 60 fs pump-probelaser and seeded by a white-light continuum. Beyond the application as a temporal diagnosticmethod, the presented setup is highly suited for jitter-free high-resolution pump-probe experi-ments in solid-state materials. Not only open questions about the carrier dynamics in dielectricsand semiconductors can be clarified in order to improve the X-ray pulse duration measurement.Also, the investigation of other ultrafast processes is possible, such as exciton formation and
89

90 CHAPTER 5. CONCLUSION AND OUTLOOK
spin transfer.
Worldwide, FLASH is the only operational high repetition rate FEL, delivering pulse trainsof 800 pulses with a repetition rate of 10 Hz. Future high repetition rate FELs are under con-struction, such as FLASH II and the European XFEL. The increased number of pulses of thesefacilities allow for a better data quality in terms of higher statistical significance and bettersignal-to-noise ratio. However, the bottleneck are outdated optical lasers. Low repetition rateTi:sapphire systems are limited to pulse durations of about 20 fs. At FLASH, the burst-modeamplifier is limited to 70 fs pulse duration and 10 µJ pulse energy, which is not sufficient for ex-ternal FEL seeding. In this work, this bottleneck has been overcome by means of a high-poweroptical parametric chirped-pulse amplifier for the application as seeding and pump-probe laser.The realized prototype deliveres pulse trains of 22 pulses, supporting sub-7 fs pulse duration at1.4 mJ pulse energy. A total energy conversion efficiency of 20% from the SHG pump pulses tothe OPCPA output pulses is achieved. The system is capable to approach optical peak powers inthe terawatt regime. With the short pulse duration, the pump-probe resolution is potentially in-creased by one order of magnitude. Currently, a 100 kHz version is being developed as seedinglaser for FLASH-2. Recently, the target parameters, 1 mJ pulse energy and sub-30 fs pulse dura-tion, have been achieved. To reach the final repetition rate of 1 MHz, further high-power pumpamplifiers are under development. The OPCPA output energy and the spectral bandwidth arehighly sensitive to pump-to-signal drifts. A synchronization technology for OPCPA long-termstability improvement has been investigated. The generation of a white-light supercontinuum inYAG was utilized for broadband OPCPA seeding with an intrinsic synchronization to the OPApump. A stable operation of a white-light source over a period of 28 hours was demonstratedwith a signal-to-pump jitter of 7 fs rms, which is an outstanding performance compared to activemethods. However, this introduces small additional jitter in the FEL-to-signal synchronization.Furthermore, a stable white-light amplification and temporal compression was demonstrated.The scaling possibilities towards continuously operating kilowatt-pumped high-power OPCPAswas theoretically evaluated. It was shown that with adequate spectral clipping of the signal seed,the major contribution to the heat load is introduced by the pump absorption, rather than signalor idler absorption. The simulations confirmed the preservation of the broad gain bandwidth in1 kW pumped BBO and LBO crystals. Assuming a pump-to-signal conversion efficiency of upto 20%, possible output powers of up to 200 W are expected. Recent absorption measurementsof LBO revealed that these crystals might even be applicable for OPCPAs with kW of outputpower, provided that tens of kW pump amplifiers are available.
In outlook, the developments potentially contribute to a major advancement in FEL sciencein general. With the potential for online measurements and high temporal resolution, the single-shot cross-correlator is a user friendly tool for FLASH and other FELs. The recently foundedFEL pulse duration measurements group in the EuroFEL project discussed about future im-plementation schemes of the cross-correlation technique at FLASH, FLASH II, the EuropeanXFEL, FERMI@Elettra and the SwissFEL. Especially at the high repetition rate FELs, FLASHand European XFEL, the characterization of each single pulse within the pulse train is of par-ticular importance. The synergy with the developed high repetition rate OPCPA will facilitatetime-resolved experiments at FELs with unprecedented precision and data quality. Indeed, theirradiation of the solid-state targets at high repetition rates has still to be investigated in terms ofheat accumulation and thermal damage, but possible solutions are already in development, suchas a moving target or a scanning mirror. The achievements in the field of high power OPCPAtechnology gained in this work are also of high importance in laser science. The future kilowatt-

CHAPTER 5. CONCLUSION AND OUTLOOK 91
pumped OPCPAs are traded as a pillar for the construction of new laser-based brilliant coherentlight sources, outperforming existing Ti:sapphire amplifiers by at least one order of magnitude.The first large-scale facility, the Extreme Light Infrastructure Attosecond Light Pulse Source(ELI ALPS), is planned to be commissioned in the year 2017 in Szeged, Hungary [188, 189].

Appendices
I


Appendix A
Refractive indices of nonlinear crystals
The refractive indices used for the calculation of the phase-matching were obtained from thededicated SELLMEIER-equation:
n2(λ ) = A+B
λ 2 −C+Dλ 2 +Eλ−4. (A.1)
The SELLMEIER-coefficients are listed in table A.1
A B C D EBBO (o) [190] 2.7405 0.0184·10−12 0.0179·10−12 -0.0155·1012 0BBO (e) 2.373 0.0128·10−12 0.0156·10−12 -0.0044·1012 0LBO (x) [191] 2.45414 0.011249 0.01135 -0.014591 -6.6·10−4
LBO (y) 2.53907 0.012711 0.012523 -0.018540 2·10−4
LBO (z) 2.586179 0.013099 0.011893 -0.017968 -2.26·10−4
BiBO (x) [192] 3.07317 0.03292 0.03011 -0.01257 0BiBO (y) 3.16383 0.04007 0.02545 -0.01535 0BiBO (z) 3.64825 0.05458 0.02952 -0.02019 0
Table A.1 SELLMEIER-coefficients of different nonlinear crystals. Wavelength, λ , in µm. Refer-ences: BBO [190], LBO [191], BiBO [192].
III

IV APPENDIX A. REFRACTIVE INDICES OF NONLINEAR CRYSTALS
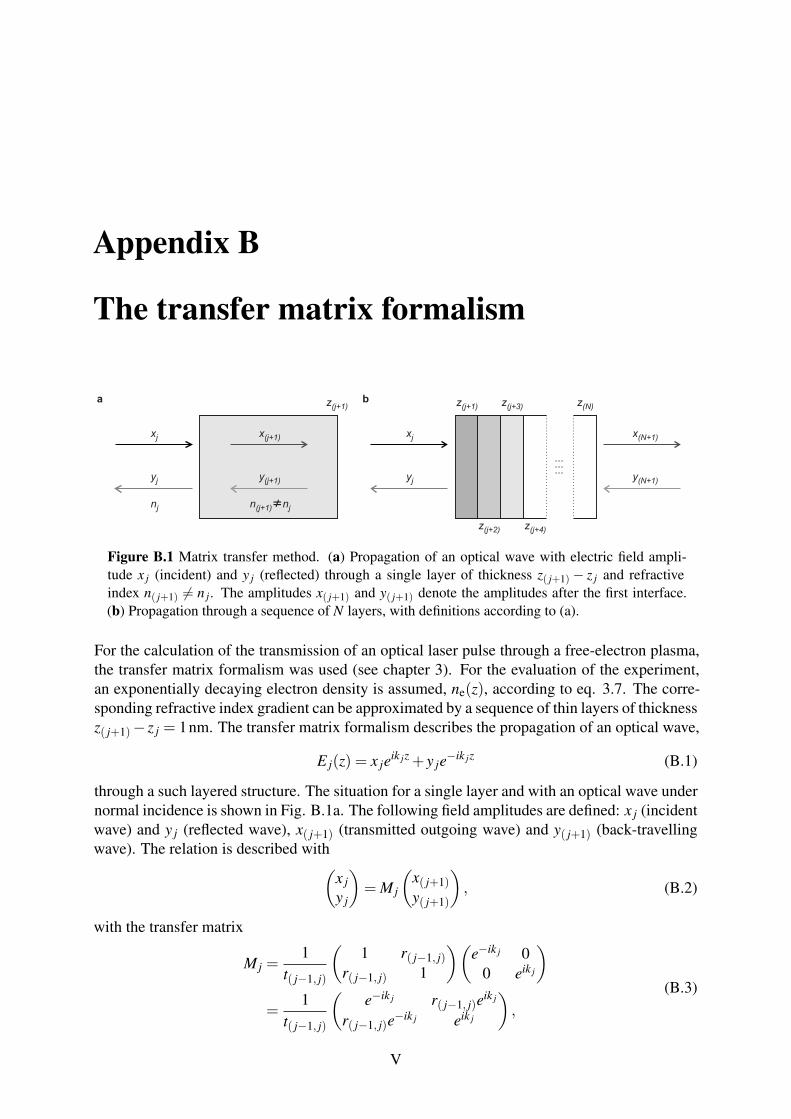
Appendix B
The transfer matrix formalism
xj
x(j+1)
yj
y(j+1)
xj
yj
x(N+1)
y(N+1)
...
...
...
z(j+1)
z(N)
z(j+2)
z(j+3)
z(j+4)
z(j+1)
a b
nj
n(j+1)
≠nj
Figure B.1 Matrix transfer method. (a) Propagation of an optical wave with electric field ampli-tude x j (incident) and y j (reflected) through a single layer of thickness z( j+1) − z j and refractiveindex n( j+1) = n j. The amplitudes x( j+1) and y( j+1) denote the amplitudes after the first interface.(b) Propagation through a sequence of N layers, with definitions according to (a).
For the calculation of the transmission of an optical laser pulse through a free-electron plasma,the transfer matrix formalism was used (see chapter 3). For the evaluation of the experiment,an exponentially decaying electron density is assumed, ne(z), according to eq. 3.7. The corre-sponding refractive index gradient can be approximated by a sequence of thin layers of thicknessz( j+1)− z j = 1nm. The transfer matrix formalism describes the propagation of an optical wave,
E j(z) = x jeik jz + y je−ik jz (B.1)
through a such layered structure. The situation for a single layer and with an optical wave undernormal incidence is shown in Fig. B.1a. The following field amplitudes are defined: x j (incidentwave) and y j (reflected wave), x( j+1) (transmitted outgoing wave) and y( j+1) (back-travellingwave). The relation is described with(
x jy j
)= M j
(x( j+1)y( j+1)
), (B.2)
with the transfer matrix
M j =1
t( j−1, j)
(1 r( j−1, j)
r( j−1, j) 1
)(e−ik j 0
0 eik j
)=
1t( j−1, j)
(e−ik j r( j−1, j)eik j
r( j−1, j)e−ik j eik j
),
(B.3)
V

VI APPENDIX B. THE TRANSFER MATRIX FORMALISM
and wherek j =
2πλL
n[ne(z j)
](B.4)
is the propagation constant in the j-th layer and t( j−1, j) and r( j−1, j) are the FRESNEL-coefficientsfor transmission and reflection normal incidence with respect to the interface,
t( j−1, j) =2n( j−1)
n( j−1)+n j, (B.5)
andr( j−1, j) =
n( j−1)−n j
n( j−1)+n j. (B.6)
For a structure consisting of N layers and N + 1 interfaces, correspondingly (Fig. B.1b) therelation is expressed as(
x1x2
)=(∏N
j=1 Mn) 1
t(N,N+1)
(1 r(N,N+1)
r(N,N+1) 1
)·(
x(N+1)y(N+1)
), (B.7)
and can be simplified to (x1y1
)= M
(x(N+1)y(N+1)
), (B.8)
yieldingx1 = M11xN+1 +M12yN+1 = M11x(N+1), (B.9)
y1 = M21xN+1 +M22yN+1 = M21x(N+1), (B.10)
with y(N+1) = 0. The ratio of the amplitudes yields the transmission,
t =x(N+1)
x1=
1M11
, (B.11)
and the reflection,
r =y1
x1=
M21
M11, (B.12)
of the layered system. The transmission of the optical power is given by
T = |t|2 and R = |r|2 . (B.13)
Bibliography
[1] W. Ackermann et al. Operation of a free-electron laser from the extreme ultraviolet tothe water window. Nature Photonics, 1:336–342, 2007.
[2] R. Riedel et al. Single-shot pulse duration monitor for extreme ultraviolet and X-rayfree-electron lasers. Nature Comm., 4:1731, 2013.
[3] R. Riedel et al. Long-term stabilization of high power optical parametric chirped-pulseamplifiers. Opt. Express, XX:XXX–XXX, 2013.
[4] P. Emma et al. First lasing and operation of an ångstrom wavelength free-electron laser.Nature Photonics, 4:641–647, 2010.
[5] E. Allaria et al. The FERMI@Elettra free-electron-laser source for coherent x-rayphysics: photon properties, beam transport system and applications. New J. Phys.,12:075002, 2010.
[6] T. Ishikawa et al. A compact X-ray free-electron laser emitting in the sub-ångströmregion. Nature Photonics, 6:540–544, 2012.
[7] E. Allaria et al. Highly coherent and stable pulses from the FERMI seeded free-electronlaser in the extreme ultraviolet. Nature Photonics, 6:699–704, 2012.
[8] H. N. Chapman et al. Femtosecond X-ray protein nanocrystallography. Nature, 470:73–77, 2011.
[9] K. J. Gaffney and H. N. Chapman. Imaging atomic structure and dynamics with ultrafastX-ray scattering. Science, 316:1444–1448, 2007.
[10] M. J. Bogan et al. Single particle x-ray diffractive imaging. Nano Lett., 8:310–316, 2008.
[11] A. Barty et al. Ultrafast single-shot diffraction imaging of nanoscale dynamics. NaturePhotonics, 2:415–419, 2008.
[12] M. M. Seibert et al. Single mimivirus particles intercepted and imaged with an X-raylaser. Nature, 470:78–81, 2011.
[13] B. Nagler et al. Turning solid aluminium transparent by intense soft X-ray photoioniza-tion. Nature Physics, 5:693–696, 2009.
[14] L. Fang et al. Double Core-Hole Production in N2. Phys. Rev. Lett., 105:083005, 2010.
VII
VIII BIBLIOGRAPHY
[15] J. P. Cryan et al. Auger Electron Angular Distribution of Double Core-Hole States in theMolecular Reference Frame. Phys. Rev. Lett., 105:083004, 2010.
[16] L. Young et al. Femtosecond electronic response of atoms to ultra-intense X-rays. Nature,466:56–61, 2010.
[17] H. Wabnitz et al. Multiple ionization of atom clusters by intense soft X-rays from afree-electron laser. Nature, 420:482–485, 2002.
[18] M. Meyer et al. Two-color photoionization in XUV free-electron and visible laser fields.Phys. Rev. A, 74:011401, 2006.
[19] C. Bostedt et al. Multistep Ionization of Argon Clusters in Intense Femtosecond ExtremeUltraviolet Pulses. Phys. Rev. Lett., 100:133401, 2008.
[20] S. Hellmann et al. Ultrafast Melting of a Charge-Density Wave in the Mott Insulator1T-TaS2. Phys. Rev. Lett., 105:187401, 2010.
[21] M. Först et al. Driving magnetic order in a manganite by ultrafast lattice excitation. Phys.Rev. B, 84:241104, 2011.
[22] C. Gutt et al. Resonant magnetic scattering with femtosecond soft X-ray pulses from afree electron laser operating at 1.59 nm. Phys. Rev. B, 79:212406, 2009.
[23] B. Pfau et al. Ultrafast optical demagnetization manipulates nanoscale spin structure indomain walls. Nature Comm., 3:1100, 2012.
[24] A. Höll et al. Thomson scattering from near-solid density plasmas using soft X-ray freeelectron lasers. High Energ. Dens.Phys., 3:120–130, 2007.
[25] U. Zastrau et al. Bremsstrahlung and line spectroscopy of warm dense aluminum plasmaheated by XUV free-electron-laser radiation. Phys. Rev. E, 78:066406, 2008.
[26] C. Fortmann et al. Bremsstrahlung vs. Thomson scattering in VUV-FEL plasma experi-ments. High Energ. Dens. Phys., 2:57–69, 2006.
[27] R. R. Fäustlin et al. Observation of Ultrafast Nonequilibrium Collective Dynamics inWarm Dense Hydrogen. Phys. Rev. Lett., 104:125002, 2010.
[28] R. Kodama et al. Nuclear fusion: Fast heating scalable to laser fusion ignition. Nature,418:933–934, 2002.
[29] J. M. Glownia et al. Time-resolved pump-probe experiments at the LCLS. Opt. Express,18:17620–17630, 2010.
[30] M. R. Bionta et al. Spectral encoding of X-ray/optical relative delay. Opt. Express,19:21855–21865, 2011.
[31] T. Maltezopoulus et al. Single-shot timing measurement of extreme ultraviolet free-electron laser pulses. New J. Phys., 10:033026, 2008.
BIBLIOGRAPHY IX
[32] S. Schulz et al. Femtosecond-precision synchronization of the pump-probe optical laserfor user experiments at FLASH. In SPIE Proceedings, volume 8778, April 2013.
[33] P. Sigalotti et al. Ultrafast laser synchronization at the FERMI@Elettra FEL. In SPIEProceedings, April 2013.
[34] M. Richter et al. Multiphoton ionization of atoms with soft x-ray pulses. J. Phys. B: At.Mol. Opt. Phys., 43:194005, 2010.
[35] B. Rudek et al. Ultra-efficient ionization of heavy atoms by intense X-ray free-electronlaser pulses. Nature Photonics, 6:858–865, 2012.
[36] G. Lambert et al. Injection of harmonics generated in gas in a free-electron laser provid-ing intense and coherent extreme-ultraviolet light. Nature Physics, 4:296–300, 2008.
[37] J. Amann et al. Demonstration of self-seeding in a hard-X-ray free-electron laser. NaturePhotonics, 6:693–698, 2012.
[38] Z. T. Zhao et al. First lasing of an echo-enabled harmonic generation free-electron laser.Nature Photonics, 6:360–363, 2012.
[39] D. Xiang et al. Evdience of high harmonics from echo-enabled harmonic generation forseeding x-ray free electron lasers. Phys. Rev. Lett., 108:024802, 2012.
[40] I. Grguras et al. Ultrafast X-ray pulse characterization at free-electron lasers. NaturePhotonics, 6:852–857, 2012.
[41] U. Frühling et al. Light-field streaking for FELs. J. Phys. B: At. Mol. Opt. Phys.,44:243001, 2011.
[42] R. Mitzner et al. Direct autocorrelation of soft-x-ray free-electron-laser pulses by time-resolved two-photon double ionization of He. Phys. Rev. A, 80:025402, 2009.
[43] Y. H. Jiang et al. Temporal coherence effects in multiple ionization of N2 via XUVpump-probe autocorrelation. Phys. Rev. A, 82:041403(R), 2010.
[44] S. Düsterer et al. Femtosecond X-ray pulse length characterization at the Linac CoherentLight Source free-electron laser. New J. Phys., 13:093024, 2011.
[45] M. Drescher et al. Time-diagnostics for improved dynamics experiments at XUV FELs.J. Phys. B: At., Mol. Opt. Phys., 43:194010, 2010.
[46] Y. Ding et al. Femtosecond X-Ray Pulse Characterization in Free-Electron Laser Usinga Cross-Correlation Technique. Phys. Rev. Lett., 109:254802, 2012.
[47] T. Pfeifer et al. Partial-coherence method to model experimental free-electron laser pulsestatistics. Opt. Lett., 35:3441–3443, 2010.
[48] A. Lutman et al. Femtosecond x-ray free electron laser pulse duration measurement fromspectral correlation function. Phys. Rev. ST, 15:030705, 2012.

X BIBLIOGRAPHY
[49] C. Gutt et al. Single Shot Spatial and Temporal Coherence Properties of the SLAC LinacCoherent Light Source in the Hard X-Ray Regime. Phys. Rev. Lett., 108:024801, 2012.
[50] Y. Inubushi et al. Determination of the Pulse Duration of an X-Ray Free Electron LaserUsing Highly Resolved Single-Shot Spectra. Phys. Rev. Lett., 109:144801, 2012.
[51] J. Wu et al. LCLS X-ray pulse duration measurement using the statistical fluctuationmethod. In Proceedings of FEL2010, 2010.
[52] N. Muller et al. Time-to-space mapping in a gas medium for the temporal characteriza-tion of vacuum-ultraviolet pulses. Appl. Phys. Lett., 90:121112–121112–3, 2007.
[53] U. Frühling et al. Single-shot terahertz-field-driven X-ray streak camera. Nature Photon-ics, 3:523–528, 2009.
[54] K. Tiedtke et al. The soft x-ray free-electron laser FLASH at DESY: beamlines, diagnos-tics and end-stations. New J. Phys., 11:023029, 2009.
[55] M. Gensch et al. New infrared undulator beamline at FLASH. Infrared Phys. Techn.,51:423–425, 2008.
[56] M. C. Hoffmann and J. A. Fulop. Intense ultrashort terahertz pulses: generation andapplications. J. Phys. D: Appl. Phys., 44:083001, 2011.
[57] H. Hiori et al. Single-cycle terahertz pulses with amplitudes exceeding 1 MV/cm gener-ated by optical rectification in LiNbO(3). Appl. Phys. Lett., 99:091106, 2011.
[58] A. Krikunova et al. Time-resolved ion spectrometry on xenon with the jitter-compensatedsoft x-ray pulses of a free-electron laser. New J. Phys., 11:123019, 2009.
[59] M. Krikunova et al. Ultrafast photofragmentation dynamics of molecular iodine drivewith time XUV and near-infrared pulses. J. Chem. Phys., 134:024313, 2011.
[60] C. Gahl et al. A femtosecond X-ray/optical cross-correlator: FLASH X-ray pulse in-duced transient changes of the optical reflectivity. Nature Photonics, 2:165–169, 2008.
[61] O. Krupin et al. Temporal cross-correlation of x-ray free electron and optical lasers usingsoft x-ray pulse induced transient reflectivity. Opt. Express, 20:11396–11406, 2012.
[62] A. Azima et al. Time-resolved pump-probe experiments beyond the jitter limitations atFLASH. Appl. Phys. Lett., 94:144102, 2009.
[63] S. Schorb et al. X-ray-optical-cross-correlator for gas-phase experiments at the LinacCoherent Light Source free-electron laser. Appl. Phys. Lett., 100:121107, 2012.
[64] M. Beye et al. X-ray pulse preserving single-shot optical cross-correlation method forimproved experimental temporal resolution. Appl. Phys. Lett., 100:121108, 2012.
[65] M. Harmand et al. Achieving few-femtosecond time-sorting at hard X-ray free-electronlasers. Nature Photonics, 7:215–218, 2013.
BIBLIOGRAPHY XI
[66] H. J. Zeiger et al. Theory for displacive excitation of coherent phonons. Phys. Rev. B.,45:768–778, 1992.
[67] K. Sokolowski-Tinten et al. Femtosecond X-ray measurement of coherent lattice vibra-tions near the Lindemann stability limit. Nature, 422:287–289, 2003.
[68] L. H. Yu et al. First Ultraviolet High-Gain Harmonic-Generation Free-Electron Laser.Phys. Rev. Lett., 91:074801, 2003.
[69] J. Rossbach P. Schmüser, M. Dohlus. Ultraviolet and soft X-Ray Free-Electron Lasers.Springer Verlag, 2008.
[70] M. V. Yurkov E. L. Saldin, A. Schneidmiller. The Physics of Free-Electron Lasers.Springer Verlag, 1999.
[71] I. Will et al. Photoinjector drive laser of the FLASH FEL. Opt. Express, 19:23770–23781,2011.
[72] S. Ackermann et al. Generation of coherent 19- and 38-nm Radiation at a Free-ElectronLaser Directly Seeded at 38 nm. Phys. Rev. Lett., 111:114801, 2013.
[73] L. DiMauro et al. First SASE and seeded FEL lasing of the NSLS DUV FEL at 266 and400 nm. Nucl. Instrum. Meth. A, 507:15–18, 2003.
[74] A. Willner et al. Coherent Control of High Harmonic Generation via Dual-Gas MultijetArrays. Phys. Rev. Lett., 107, 2011.
[75] A. Willner et al. Efficient control of quantum paths via dual-gas high harmonic genera-tion. New J. Phys., 13, 2011.
[76] A. Willner et al. Coherent spectral enhancement of carrier-envelope-phase stable con-tinua with dual-gas high harmonic generation. Opt. Lett., 37:3672–3674, 2012.
[77] G. Stupakov. Using the Beam-Echo Effect for Generation of Short-Wavelength Radiation.Phys. Rev. Lett., 102:074801, 2009.
[78] J. D. Jackson. Classical Electrodynamics. Wiley, New York, 1998.
[79] J.-C. Diels and W. Rudolph. Ultrashort Laser Pulse Phenomena. Elsevier, 2006.
[80] R.W. Boyd. Nonlinear Optics. Elsevier, 2008.
[81] G. Cerullo and S. De Silvestri. Ultrafast optical parametric amplifiers. Rev. Sci. Instrum.,74, 2003.
[82] Robert W. Boyd. Nonlinear Optics. Elsevier, 2008.
[83] J. A. Armstrong et al. Interaction between light waves in a nonlinear dielectric. Phys.Rev., 127:1918–1939, 1962.
[84] I. N. Ross et al. Analysis and optimization of optical parametric chirped pulse amplifica-tion. J. Opt. Soc. Am. B, 19:2945–2956, 2002.

XII BIBLIOGRAPHY
[85] D. S. Hum and M. M. Fejer. Quasi-phasematching. C. R. Phys., 8:180–198, 2007.
[86] D. N. Nikogosyan V. G. Dmitriev, G. G. Gurzadyan. Handbook of Nonlinear OpticalCrystals. Springer Verlag, 1991.
[87] G. Arisholm et al. Ultra-broadband chirped-pulse optical parametric amplifier with an-gularly dispersed beams. Opt. Express, 12:518–530, 2004.
[88] T. Wilhelm et al. Sub-20-fs pulse tunable across the visible from a blue-pumped single-pass noncollinear parametric converter. Opt. Lett., 22:1494–1496, 1997.
[89] D. N. Schimpf et al. Theoretical analysis of the gain bandwidth for noncollinear para-metric amplification of ultrafast pulses. J. Opt. Soc. Am. B, 24:2837–2846, 2007.
[90] J. Bromage et al. Analysis and suppression of parasitic processes in noncollinear opticalparametric amplifiers. Opt. Express, 19:16797–16808, 2011.
[91] B. C. Stuart et al. Nanosecond-to-femtosecond laser-induced breakdown in dielectrics.Phys. Rev. B, 53:1749–1761, 1996.
[92] M. Bradler et al. Femtosecond continuum generation in bulk laser host materials withsub-muJ pump pulses. Appl. Phys. B: Lasers Opt., 97:561–574, 2009.
[93] S. Tzortzakis et al. Self-Guided Propagation of Ultrashort IR Laser Pulse in Fused Silica.Phys. Rev. Lett., 87:213902, 2001.
[94] Y. Liu et al. Different tendencies of breakdown threshold on pulse duration in the subpi-cosecond regime in fused silica. J. Opt. A: Pure Appl. Opt., 7:198–203, 2005.
[95] L. Bergé et al. Multifilamentation of powerful optical pulses in silica. Phys. Rev. A,81:013817, 2010.
[96] B. La Fontaine et al. Filamentation of ultrashort pulse laser beams resulting from theirpropagation over long distances in air. Phys. Plasmas, 6:1615–1621, 1999.
[97] M. Emons et al. Sub-10-fs pulses from a MHz-NOPA with pulse energies of 0.4 muJ.Opt. Express, 18:1191–1196, 2010.
[98] A. Brodeur and L. Chin. Ultrafast white-light continuum generation and self-focusing intransparent condensed media. J. Opt. Soc. Am. B, 16:637–650, 1999.
[99] C. B. Schaffer et al. Laser-induced breakdown and damage in bulk transparent materialsinduced by tightly focused femtosecond laser pulses. Meas. Sci. Technol., 20:1764–1794,2001.
[100] Z. Wu et al. Filamentation and temporal reshaping of a femtosecond pulse in fused silica.Phys. Rev. A, 68:063820, 2003.
[101] N. Medvedev and B. Rethfeld. Transient dynamics of the electronic subsystem of semi-conductors irradiated with an ultrashort vacuum ultraviolet laser pulse. New J. Phys.,12:073037, 2010.
BIBLIOGRAPHY XIII
[102] L. E. Ramos et al. Structural, electronic, and effective-mass properties of silicon andzinc-blende group-III nitride semiconductor compounds. Phys. Rev. B, 63:165210, 2001.
[103] E. O. Kane. Electron Scattering by Pair Production in Silicon. Phys. Rev., 159:624–631,1967.
[104] N. Medvedev B. Ziaja. Modelling ultrafast transitions within laser-irradiated solids. HighEnerg. Dens. Phys., 8:18–29, 2011.
[105] N. Metropolis and S. Ulam. The Monte Carlo Method. J. Am. Stat. Assoc., 44, No.247:335–341, 1949.
[106] B. J. Alder and T. E. Wainwright. Studies in Molecular Dynamics. I. General Method. J.Chem. Phys., 31:459–466, 1959.
[107] N. Medvedev et al. Short-Time Electron Dynamics in Aluminum Excited by Femtosec-ond Extreme Ultraviolet Radiation. Phys. Rev. Lett., 107:165003, 2011.
[108] N. A. Medvedev and B. Rethfeld. Electron kinetics in semiconductors and metals ir-radiated with VUV-XUV femtosecond laser pulses. Proc. SPIE Int. Soc. Opt. Eng.,8077:80770Q, 2011.
[109] N. Medvedev et al. Electron kinetics in femtosecond X-ray irradiated SiO2. Contrib.Plasma Phys., 2013.
[110] B. L. Henke et al. X-ray interactions: photoabsorption, scattering, transmission, andreflection at E = 50-30.000 eV, Z = 1-92. Atom. Data Nucl. Data, 54:181–342, 1993.
[111] C. Kingman and J. Frank. Poisson processes. Vol. 3. Clarendon Press, 1992.
[112] W. Y. Ching Y. Xu. Electronic and optical properties of all polymorphic forms of silicondioxide. Phys. Rev. B, 44:11048–11059, 1991.
[113] N. Medvedev and B. Rethfeld. Effective energy gap of semiconductors under irradiationwith an ultrashort VUV laser pulse. Europhys. Lett., 88:55001, 2009.
[114] A. V. Shaposhnikov et al. Electronic Band Structure and Effective Masses of Electronsand Holes in the α and β Phases of Silicon Nitride. Phys. Solid State, 49, No 9:1628–1632, 2007.
[115] P. B. Corkum and F. Krausz. Attosecond science. Nature Physics, 3:381–387, 2007.
[116] J. J. Quinn et al. Range of Excited Electrons in Metals. Phys. Rev., 126:1453–1457,1962.
[117] D. R. Penn et al. Electron mean-free-path calculations using a model dielectric function.Phys. Rev. B, 35:482–486, 1987.
[118] S. Samarin et al. Secondary-electron emission mechanism of LiF film by (e,2e) spec-troscopy. Surf. Sci., 548:187–199, 2004.

XIV BIBLIOGRAPHY
[119] V. V. Temnov et al. Multiphoton ionization in dielectrics: comparison of circular andlinear polarization. Phys. Rev. Lett., 97:237403, 2006.
[120] D. Grojo et al. Time-evolution of carriers after multiphoton ionization of bulk dielectrics.In Conference on Lasers and Electro-Optics/International Quantum Electronics Confer-ence, OSA Technical Digest., Baltimore, MD, USA, May 31 - June 05 2009.
[121] J. Frenkel. On the Transformation of Light into Heat in Solid. I. Phys. Rev., 37:17–44,1931.
[122] G. H. Wannier. The structure of Electronic Excitation Levels in Insulating Crystals. Phys.Rev., 52:191–197, 1937.
[123] W. Y. Liang. Excitons. Physics Education, 5:226–230, 1970.
[124] L. Spitzer. Physics of Fully Ionized Gases. Interscience, New York, 1962.
[125] M. P. Bachynski I. P. Sharkofsky, T. W. Johnston. The particle kinetics of plasmas.Addison-Wesley Educational Publishers Inc, Boston, 1966.
[126] U. Wagner U. Teubner and E. Förster. Sub-10 fs gating of optical pulses. J. Phys. B: At.Mol. Opt. Phys., 34:2993–3002, 2001.
[127] A. Monmayrant et al. A newcomer’s guide to ultrashort pulse shaping and characteriza-tion. J. Phys. B: At. Mol. Phys., 43:103001, 2010.
[128] C. Iaconis and I. A. Walmsey. Spectral phase interferometry for direct electric fieldreconstruction of ultrashort optical pulses. Opt. Lett., 23:792–794, 1998.
[129] R. Trebino and D. J. Kane. Using phase retrieval to measure the intensity and phase ofultrashort pulses: frequency-resolved optical gating. Journal Opt. Soc. Am. A, 10:1101–1111, 1993.
[130] D. J. Kane and R. Trebino. Single-shot measurement of the intensity and phase of an ar-bitrary ultrashort pulse using frequency-resolved gating. Optics Lett., 18:823–825, 1993.
[131] A. L. Cavalieri et al. Clocking femtosecond X-rays. Phys. Rev. Lett., 94:114801, 2005.
[132] F. Löhl et al. Electron bunch timing with femtosecond precision in a superconductingfree-electron laser. Phys. Rev. Lett., 104:144801, 2010.
[133] S. Simrock et al. Synchronization system for ERLs. Nucl. Instrum. Meth. A, 557:293–298, 2006.
[134] F. Tavella et al. Few-femtosecond timing at fourth-generation X-ray light sources. NaturePhotonics, 5:162–165, 2011.
[135] E. Wolf M. Born. Principles of Optics. Cambridge University Press, Cambridge, 2002,54–70, 2002.
[136] O. S. Heavens. Optical Properties of Thin Solid Films. Dover Punlications, Mineola,New York, 1991.

BIBLIOGRAPHY XV
[137] D. C. Sorensen J. J. Moré. Computing a Trust Region Step. SIAM J. Optimiz., 2:575–601,1992.
[138] P. Martin et al. Subpicosecond study of carrier trapping dynamics in wide-band-gapcrystals. Phys. Rev. B, 55:5799–5810, 1997.
[139] D. Grojo et al. Exciton-seeded multiphoton ionization in bulk SiO2. Phys. Rev. B,81:212301, 2010.
[140] A. A. Sorokin et al. Gas-monitor detector for intense and pulsed VUV/EUV free-electronlaser radiation. AIP Conf. Proc., 705:557–560, 2004.
[141] C. Behrens et al. Constraints on photon pulse duration from longitudinal electron beamdiagnostics at a soft x-ray free-electron laser. Phys. Rev. ST, 15:030707, 2012.
[142] B. Faatz et al. Flash II: Perspectives and challenges. Nucl. Instrum. Meth. A, 635:S2–S5,2011.
[143] D. E. Spence et al. 60-fsec pulse generation from a self-mode-locked Ti:sapphire laser.Opt. Lett., 16:42–44, 1991.
[144] R. Ell et al. Generation of 5-fs pulses and octave-spanning spectra directly from aTi:sapphire laser. Opt. Lett., 26:373–375, 2001.
[145] D. Strickland and G. Mourou. Compression of amplified chirped optical pulses. Opt.Commun., 56:219–221, 1985.
[146] C. Le Blanc et al. Gain-narrowing and gain-shifting of ultra-short pulses in Ti:sapphireamplifiers. Opt. Commun., 131:391–398, 1996.
[147] A. Suda et al. Generation of sub-10-fs, 5-mJ-optical pulses using a hollow fiber with apressure gradient. Appl. Phys. Lett., 86:111116, 2005.
[148] A.J. Verhoef et al. Compression of the pulses of a Ti:sapphire laser system to 5 femtosec-onds at 0.2 terawatt level. Appl. Phys. B: Lasers Opt., 82:513–517, 2006.
[149] J. Seres et al. Sub-10-fs, terawatt-scale ti:sapphire laser system. Opt. Lett., 28:1832–1834, 2003.
[150] T. Y. Fan. Heat generation in Nd:YAG and Yb:YAG. IEEE J. Quantum Elect., 29:1457–1459, 1993.
[151] X. Zhang et al. Multi-microjoule, MHz repetition rate Ti:sapphire ultrafast regenerativeamplifier system. Opt. Express, 20:7015–7021, 2012.
[152] I. Matsushima et al. 10 kHz 40 W Ti:sapphire regenerative ring amplifier. Opt. Lett.,31:2066–2068, 2006.
[153] A. Dubietis et al. Powerful femtosecond pulse generation by chirped and stretched pulseparametric amplification in BBO crystal. Opt. Commun., 88:437–440, 1992.

XVI BIBLIOGRAPHY
[154] I. N. Ross et al. The prospects for ultrashort pulse duration and ultrahigh intensity usingoptical parametric chirped pulse amplifiers. Opt. Commun., 144:125–133, 1997.
[155] S. Witte and K. S. E. Eikema. Ultrafast Optical Parametric Chirped-Pulse Amplification.IEEE J. Sel. Top. Quant., 18:296–307, 2012.
[156] I. N. Ross et al. Generation of terawatt pulses by use of optical parametric chirped pulseamplification. Appl. Opt., 39:2422–2427, 2000.
[157] S. Witte et al. Generation of few-cycle terawatt light pulses using optical parametricchirped pulse amplification. Opt. Express, 13:4903–4908, 2005.
[158] D. Herrmann. Generation of sub-three-cycle, 16 TW light pulses by using noncollinearoptical parametric chirped-pulse amplification. Opt. Lett., 34:2459–2461, 2009.
[159] J. Rothhardt et al. Octave-spanning OPCPA system delivering CEP-stable few-cyclepulses and 22 W of average power at 1 MHz repetition rate. Opt. Express, 20:10870–10878, 2012.
[160] A. Harth et al. Two-color pumped OPCPA system emitting spectra spanning 1.5 octavesfrom VIS to NIR. Opt. Express, 20:3076–3081, 2012.
[161] C. Homann et al. Octave wide tunable UV-pumped NOPA: pulses down to 20 fs at 0.5MHz repetition rate. Opt. Express, 16:5746–5756, 2008.
[162] P. Russbueldt et al. Compact diode-pumped 1.1 kW Yb:YAG Innoslab femtosecondamplifier. Opt. Lett., 35:4169–4171, 2010.
[163] M.Schulz et al. Yb:YAG Innoslab amplifier: efficient high repetition rate subpicosecondpumping system for optical parametric chirped pulse amplification. Opt. Lett., 36:2456–2458, 2011.
[164] A. Giesen and J. Speiser. Fifteen Years of Work on Thin-Disk Lasers: Results and ScalingLaws. IEEE J. Sel. Top. Quant., 13:598–609, 2007.
[165] M. Schulz et al. Pulsed operation of a high average power Yb:YAG thin-disk multipassamplifier. Opt. Lett., 20:5038–5043, 2012.
[166] T. Eidam et al. Femtosecond fiber CPA system emitting 830 W average output power.Opt. Lett., 35:94–96, 2010.
[167] A. Klenke et al. Coherently-combined two channel femtosecond fiber CPA system pro-ducing 3 mJ pulse energy. Opt. Express, 19:24280–24285, 2011.
[168] M. Schulz. High Energy High Repetition-Rate Thin-Disk Amplifier for OPCPA Pumping.DESY, 2013.
[169] M. Schulz et. al. 14 kilowatt burst average power from 2-stage cascaded Yb: YAG thin-disk multipass amplifier. Frontiers in Optics, 2013:FTu4A, 2013.
[170] N. Boef et al. Calculating characteristics of non-collinear phase-matching in uniaxialand biaxial crystals. Opt. Eng., 39:10161024, 2000.

BIBLIOGRAPHY XVII
[171] A. V. Smith. SNLO. http://www.as-photonics.com/snlo, accessed 2013/09/06.
[172] V. G. Dimitriev et al. Handbook of Nonlinear Optical Crystals. Springer (New York),1999.
[173] V. Petrov et al. Femtosecond nonlinear frequency conversion based on BiB3O6. Laserand Photon. Rev., 1:53–98, 2010.
[174] D. N. Nikogosyan. Lithium Triborate (LBO): A Review of Its Properties and Applica-tions. Appl. Phys. A, 58:181–190, 1994.
[175] J. Jiang et al. Evaluation of chirped-pulse-amplification systems with Offner triplet tele-scope stretchers. J. Opt. Soc. Am. B, 19:678–683, 2002.
[176] P. Russbueldt et al. 400W Yb:YAG Innoslab fs-Amplifier. Opt. Express, 17:12230–12245, 2009.
[177] F. Tavella et al. Investigation of the superfluorescence and signal amplification in anultrabroadband multiterawatt optical parametric chirped pulse amplifier system. NewJournal of Physics, 8, 2006.
[178] S. Demmler et al. Control of nonlinear spectral phase induced by ultrabroadband opticalparametric amplification. Opt. Lett., 37:3933–3935, 2012.
[179] C. Y. Teisset et al. Optical Synchronization for OPCPA Chains. Springer Series Optic.,132:535–545, 2007.
[180] I. Ahmad et al. Frontend light source for short-pulse pumped OPCPA system. Appl.Phys. B: Lasers Opt., 97:529–536, 2009.
[181] H. Fattahi et al. Pump-seed synchronization for MHz repetition rate, high-power opticalparametric chirped pulse amplification. Opt. Express, 20:9833–9840, 2012.
[182] A. Schwarz et al. Active stabilization for optically synchronized optical parametricchirped pulse amplification. Opt. Express, 20:5557–5565, 2012.
[183] T. R. Schibli et al. Attosecond active synchronization of passively mode-locked lasersby balanced cross correlation. Opt. Lett., 28:947–949, 2003.
[184] S. Hädrich et al. Improving carrier-envelope phase stability in optical parametric chirped-pulse amplifiers by control of timing jitter. Opt. Lett., 37:4910–4912, 2012.
[185] A. G. Selivanov et al. Nonlinear refractive properties of Yb3+-doped KY(WO4)2 andYVO4 laser crystals. Appl. Phys. B, 83:61–65, 2006.
[186] A. Major et al. Characterization of the nonlinear refractive index of the laser crystalYb:KGd(WO4)2. Appl. Phys. B, 77:433–436, 2003.
[187] D. A. Anderson R. H. Pletcher and J. C. Tannehill. Computational fluid mechanics andheat transfer. CRC Press (Florida, USA), 2012.
XVIII BIBLIOGRAPHY
[188] G. Mourou and T. Tajima. The extreme light infrastructure: Optics next horizon. Opt.Photonics News, 22:47–51, 2011.
[189] S. Banerjee et al. Conceptual design of the laser systems for the attosecond light pulsesource. In CLEO: Science and Innovations, San Jose, California United States, June2013. The Optical Society of America, The Optical Society of America.
[190] K. Kato. Second-harmonic generation to 2048 Å in β -BaB2O4. IEEE J. Quantum Elec-tron., 22:1013–1014, 1986.
[191] K. Kato. Tunable UV generation to 0.2325 µm in LiB3O5. IEEE J. Quantum Elect.,26:1173–1175, 1990.
[192] H. Lingxiong et al. The accurate refractive indices of BIBO crystal at different tempera-tures. J. Phys. D: Appl. Phys., 42:225109, 2009.

Danksagung (Acknowledgement) XIX
Danksagung (Acknowledgement)Mein Dank gilt allen Personen, die zum erfolgreichen Gelingen meiner Doktorarbeit beigetra-gen haben.
Mein großer Dank und Respekt gilt Prof. Dr. M. Drescher, der mir als Doktorvater dieMöglichkeit gegeben hat, dieses Projekt zu bearbeiten und stets Unterstützer meiner wissen-schaftlichen Arbeit und meiner Ideen war. Bei Prof. Dr. F. X. Kärtner bedanke ich mich fürseine Bereitschaft, Mitglied meines Prüfungskomitees zu sein, ebenso bei Dr. T. Laarmann.Darüber hinaus bedanke ich mich für die finanzielle Unterstützung von Prof. Dr. T. Stöhlker(Helmholtz-Institut Jena) und Herrn G. Jockenhöfer (Frankfurt Institute for Advanced Studiesan der J.W. Goethe-Universität).
Eine unschätzbare Danksagung geht an Dr. Franz Tavella, der mein Betreuer sowie der bril-liante Kopf einer tollen Arbeitsgruppe am Deutschen Elektronensynchrotron war. Sein Antriebund Teamgeist haben mich stets motiviert und so den Weg zu neuen Ideen und erfolgreicherForschung geebnet. Diese Arbeit wäre jedoch nicht möglich gewesen ohne ein tolles Team.Danke Michael, für die ewigen Stunden in Labor 28g, unserem zweiten Zuhause! Danke Arik,für die vielen fachlichen Diskussionen! Danke Mark, für Deine Weisheit und Erfahrung! DankeArvid und Hauke, für die fleißige Unterstützung bei unseren Experimenten! Großer Dank giltauch Otto Peters und Josef Gonschior für ihre Begeisterung und ihre Unterstützung bei derKonstruktion und Fertigung wichtiger Bauteile.
Many thanks to Dr. B. Dromey, Dr. M. Yeung, and Prof. Dr. M. Zepf for the awesomecollaboration, foremost at the TEI Crete. I also thank the greek colleagues from Crete forworking with us at this wonderful place (I know a place...). At FLASH, I would like to thankDr. N. Stojanovic and Dr. S. Toleikis and their teams for our successful experiments. At CFEL,I would like to thank Dr. N. Medvedev and Prof. Dr. B. Ziaja-Motyka for their theory work onionization dynamics. Of course, I am also grateful to all people who were involved in my workat and around DESY and the Helmholtz-Institut Jena.
Mein ganz besonderer Dank gilt meiner wundervollen Ehefrau Maria, für ihre liebevolleUnterstützung und Geduld. Du hast mir auch in schweren Momenten die Kraft gegeben alleHerausforderungen zu meistern. Großer Dank gilt auch unseren Familien und unseren vielenguten Freunden, die mich stets daran erinnert haben so zu bleiben wie ich bin.

XX Danksagung (Acknowledgement)
Eidesstattliche VersicherungHiermit erkläre ich an Eides statt, dass ich die vorliegende Dissertationsschrift selbst verfasstund keine anderen als die angegebenen Quellen und Hilfsmittel benutzt habe.
Hamburg, den 10. Dezember 2013 Unterschrift