
Pullout Behaviour of Suction Embedded Plate Anchors in Clay
280
Department of Civil Engineering Pullout Behaviour of Suction Embedded Plate Anchors in Clay Zhenhe Song This thesis is presented for the Degree of Doctor of Philosophy of Curtin University of Technology August 2008
Transcript of Pullout Behaviour of Suction Embedded Plate Anchors in Clay
Department of Civil Engineering
Pullout Behaviour of Suction Embedded Plate Anchors in Clay
Zhenhe Song
This thesis is presented for the Degree of Doctor of Philosophy
of Curtin University of Technology
August 2008

DECLARATION
To the best of my knowledge and belief this thesis contains no material previously published by any other person except where due acknowledgement has been made. This thesis contains no material which has been accepted for the award of any other degree or diploma in any university. Signature: …………………………………………. Date: ……August 2008…………………...

Dedicated to Mulin Jiang and my parents, for their love and support

i
ABSTRACT In recent years oil and gas mining has moved into increasingly deeper water in
search of undeveloped fields. As water depths approach and exceed 3000 m
conventional offshore foundation systems become inefficient and ineffective in
stabilising platforms and floating production storage units. The trend of supporting
structure design in deep water has been to install catenary and taut leg mooring
systems. Consequently, many types of anchoring systems are being developed and
used in order to withstand large mooring forces. The SEPLA (Suction Embedded
Plate Anchor) is ideal for use in this situation. This project has employed advanced
numerical techniques and centrifuge testing to study pullout behaviour of plate
anchor foundations in different soil profiles and suction caisson installation effect
with the aim of generating a robust framework for design.
The behaviour of strip and circular plate anchors during vertical pullout in uniform
and normally consolidated clays has been studied by means of small strain and large
deformation finite element analyses. Both fully bonded (attached), and ‘vented’ (no
suction on rear face), anchors have been considered. The current numerical results
were compared with existing laboratory test data, finite element results and analytical
solutions. This study showed that the ultimate pullout capacity factors (Nc) for deep
embedment were 11.6 and 11.7 for smooth and rough strip anchors and 13.1 and 13.7
for smooth and rough circular anchors respectively. When the anchor base was
vented, the soil stayed attached to the anchor base for deep embedment, and the
pullout capacity was therefore the same as for the attached anchor. The separation
depth ratio, Hs/B or Hs/D was found to increase linearly with the normalised strength
ratio, su/γ'B or su/γ'D.
Numerical simulation has been conducted to assess the bearing capacity for inclined
pullout plate anchors. This bearing capacity analysis was performed by embedding
the anchors in clay with different initial inclinations and different embedment ratios.

ii
Both the attached anchor base and vented base were evaluated. The results showed
that the bearing capacities of the inclined plate anchors were associated with the
inclination angles and base conditions. The separation depth of the plate anchors can
be assessed by a simple equation from vertically pulled out plate anchors.
Large deformation finite element analyses of plate anchor keying in clay has been
performed. The effects of anchor thickness, anchor padeye eccentricity, anchor-soil
interface roughness, soil shear strength, anchor submerged weight and soil
disturbance have been studied with anchors in uniform or normally consolidated
clays. The numerical results were compared with transparent soil test and existing
centrifuge test data. The study showed that the RITSS method works well in
simulating the anchor keying process. Anchor padeye eccentricity played an
important role in anchor keying. A normalised anchor geometry ratio was used to
estimate the loss in embedment during plate anchor’s keying.
Both finite element analysis and centrifuge tests have been conducted to study the
suction caisson installation effect. In finite element analysis, the soil disturbed zone
varied from 3 times the caisson wall thickness to a full area inside a caisson.
Centrifuge tests of suction embedded plate anchors were conducted in normally
consolidated kaolin clay and transparent uniform soil. It can be concluded that the
reduction in anchor capacity due to soil disturbance after suction caisson installation
depends on re-consolidation time and soil sensitivity. The soil disturbance also
reduced the loss of embedment during the anchor keying process

iii
ACKNOWLEDGEMENTS I am indebted to Dr. Yuxia Hu for her interest, guidance and provision of financial
assistance during this research. Dr. Hu’s commitment and assistance was limitless
and greatly appreciated. I would also like to express my gratitude and appreciation to
Prof. Mark Randolph for his stimulating supervision, wonderful insight and
constructive advice. Sincere thanks are extended to Dr. Hamid Nikraz for his friendly
inspiration, pastoral care and for serving as co-supervisor.
Experiments could not have been performed without the support of the Centre for
Offshore Foundation Systems (COFS), University of Western Australia (UWA),
especially the centrifuge technicians Mr. Don Hurley and Mr. Bart Thompson. They
helped me to arrange the instrument, ramp up the centrifuge and prepare sample etc.
I would also like to thank Dr. Christopher Gaudin, centrifuge manager at COFS, for
his generous suggestions on this centrifuge study based on his experience. The
Suction Embedded Plate Anchor (SEPLA) model caisson was also first made by Dr.
Christophe Gaudin and Conleth O’Loughlin. Their work was essential in achieving
accurate measurements and is greatly appreciated. Assistance from Mr. Binaya
Bhattarai and Mrs. Clare Bearman, during the preparation of transparent soil samples,
are acknowledged. I would like to thank Mr. Gary Davies and his colleagues in the
Civil Engineering Workshop for their high efficiency and accuracy in the fabrication
work.
Dr. Jun Liu, of Dalian University of Technology, and Mrs. Zarnaz Mehryer, of
Curtin University, both helped me in becoming familiar with AFENA FE code when
I arrived here 4 years ago; I am grateful to them all. And I would like to thank Dr.
Dong Wang for the open discussion of plate anchors behaviour.
The research presented here is supported by the Australian Research Council through
the Large ARC discovery scheme (DP0344019). In addition, I received financial

iv
support from Curtin International Research Tuition Scholarship (CIRTS). This
support is gratefully acknowledged.
Mrs. Diane Garth and Mrs. Sucy Leong, of Curtin University of Technology and Mrs.
Monica Mackman, of UWA cordially assisted me with patience. I am happy to see
that they are always smiling. Thank you. Thanks are also due to the IT support staff
in the Faculty of Engineering and Computing.
Finally, thank you to my wife Mulin Jiang and my family for their support and
encouragement throughout the period of my studies.
v
PUBLICATIONS Journal:
Song, Z., Hu, Y. and Randolph, M.F. (2007) “Numerical simulation of vertical
pullout of plate anchors in clay”, accepted by Journal of Geotechnical and
Geoenvironmental Engineering.
Song, Z., Hu, Y., O'Loughlin, C. and Randolph, M.F. (2007) “Loss in anchor
embedment during plate anchor keying in clay”, to be submitted
Song, Z., Hu, Y., and Randolph, M.F. (2007) “Bearing capacities of inclined pullout
plate anchors in Clay”, to be submitted
Wang, D., Hu, Y., Song, Z. (2007) “Analysis of uplift capacity of circular plate
anchors in uniform clay”, Rock and Soil Mechanics, 28(6), 179-183 (In Chinese)
Conference:
Song, Z. and Hu, Y., (2008) “Bearing capacity and keying of plate anchor in
normally consolidated clay”, Proceedings of the 18th (2008) Annual International
Offshore and Polar Engineering Conference - ISOPE-2008, Vancouver, BC, Canada,
July 6-11, 2008, In press.
Hu, Y. and Song, Z., (2008) “Large deformation FE analysis of plate anchor keying
in clay”, Proceedings of the 12th International Conference of International
Association for Computer Methods and Advances in Geomechanics (IACMAG), Goa,
India, 1-6 October, 2008, In press.

vi
Song, Z. and Hu, Y., (2007) “Suction embedded plate anchor test in centrifuge”,
Proceedings of 10th Australia New Zealand Conference on Geomechanics, Brisbane
Australia, October 21 - 24, 2007, pp. 562-567.
Wang, D. Hu, Y., Song, Z. (2007) “Large deformation analysis of rectangular plate
anchors in normally consolidated clay”, Proceedings of 10th Australia New Zealand
Conference on Geomechanics, Brisbane Australia, October 21 - 24, 2007, pp. 268-
273.
Song, Z., Hu, Y., and Gaudin, C. (2007) “The influence of disturbed zone on
capacity of suction embedded plate anchors”, Proceedings of the 17th (2007) Annual
International Offshore and Polar Engineering Conference - ISOPE-2007, Lisbon,
Portugal, July 1-6, 2007, pp. 1340 -1346.
Song, Z., Hu, Y., Wang, D. and O'Loughlin, C. (2006). “Pullout capacity and
rotational behaviour of square anchors in kaolin clay and transparent soil”.
International Conference on Physical Modelling in Geotechnics, Hong Kong, P.R.
China, August 4-6, pp. 1325-1331.
Song, Z. and Hu, Y. and O'Loughlin, C. (2006). “Anchor and chain reaction during
inclined pullout in clay”. 25th International Conference on Offshore Mechanics and
Arctic Engineering, June 4-9, 2006, Hamburg, Germany, OMAE2006-92411
Song, Z. (2006) “Design issues for SEPLAs in uniform clay”, Proceeding of 7th
young geotechnical professionals conference, October18-21, 2006, Adelaide, pp.
199-204.
Song, Z., Hu, Y. and Randolph, M.F. (2005). “Pullout behaviour of inclined plate
anchors in clay”, Proceeding of the 11th Conference of the International Association
of Computer Methods and Advances in Geomechanics (IACMAG), June 19-24, 2005,
Turin, Italy, pp. 715-722.

vii
Song, Z. and Hu, Y. (2005), “Vertical pullout behaviour of plate anchors in uniform
clay”, Frontiers in Offshore Geotechnics: ISFOG 2005, Perth, Western Australia,
Australia, September 19-21, 2005, pp. 205-211.

viii
CONTENTS ABSTRACT i
ACKNOWLEDGEMENTS iii
PUBLICATIONS v
CONTENTS viii
LIST OF FIGURES xii
LIST OF TABLES xxi
NOTATIONS, ABBREVIATIONS xxii
CHAPTER 1. INTRODUCTION 1-1
1.1. Trends of the Offshore Oil and Gas Industry 1-1 1.2. Deep Water Production Units and Mooring Systems 1-1 1.3. Floating Platform Anchoring Concepts 1-2
1.3.1. SEPLA Concept 1-3 1.3.2. SEPLA Development History 1-3
1.4. Research Needs 1-5 1.5. Aims of Current Research 1-7 1.6. Thesis Structure 1-7
CHAPTER 2 LITERATURE REVIEW 2-1
2.1. Introduction 2-1 2.2. Plate Anchor Capacities 2-1
2.2.1. Numerical Study 2-1 2.2.2. Experimental Study 2-4 2.2.3. Industry Design Code 2-8
2.3. Other Issues of Plate Anchor Behaviour 2-8 2.3.1. Rotation of Anchors 2-8 2.3.2. SEPLAs Installation Effect 2-9 2.3.3. Anchor Chain Behaviour 2-10
2.4. Large Deformation Formulations 2-11 2.4.1. Updated Lagrangian and Eulerian Description 2-12

ix
2.4.2. Arbitrary Lagrangian-Eulerian (ALE) 2-14 2.4.3. Large Deformation FE in Geotechnical Engineering 2-16
2.5. Summary and Conclusions 2-18 CHAPTER 3. RESEARCH METHODS 3-1
3.1. Introduction 3-1 3.2. Numerical Modelling Concept 3-1
3.2.1. Finite Element Analysis 3-1 3.2.2. Two-Dimensional or Three-Dimensional Analysis? 3-2 3.2.3. Plate Anchor Modelling 3-2
3.3. H-Adaptive RITSS Method 3-3 3.3.1. Mesh Generation 3-3 3.3.2. Mesh Smoothing 3-4 3.3.3. Mesh Refinement 3-5 3.3.4. H-Adaptive RITSS Method 3-6
3.4. Experimental Concept 3-7 3.4.1. Centrifuge or 1 g? 3-7 3.4.2. Centrifuge Modelling 3-8 3.4.3. Image Analysis 3-9
3.5. Test Equipment and Apparatus 3-9 3.5.1. Plate Anchor Model 3-9 3.5.2. Fixed Beam Centrifuge Test and 1g Test 3-12 3.5.3. Drum Centrifuge 3-14
3.6. Soil Samples 3-16 3.6.1. Preparation of Transparent “Soil” 3-16 3.6.2. Preparation of Kaolin Clay Sample 3-17
CHAPTER 4. VERTICAL PULLOUT OF PLATE ANCHORS IN CLAY 4-1
4.1. Introduction 4-1 4.2. Pre-embedded Plate Anchor Analyses 4-2
4.2.1. Strip Plate Anchor 4-3 4.2.2. Circular Plate Anchor 4-6 4.2.3. Circular Anchors in Normally Consolidated Clay 4-8
4.3. Continuous Plate Anchor Pullout Analysis 4-9 4.3.1. Anchor in Uniform Clay 4-10 4.3.2. Anchor in Normally Consolidated Clay 4-14
4.4. 3D Plate Anchor Analysis 4-16 4.5. Conclusions 4-18
CHAPTER 5. INCLINED PULLOUT OF PLATE ANCHORS IN CLAY 5-1
5.1. Introduction 5-1 5.2. Numerical Setup 5-2 5.3. 1g Experimental Setup in Uniform Clay 5-3 5.4. Inclined Pullout of Strip Plate Anchors in Uniform Clay 5-4
5.4.1. Numerical Results 5-4 5.4.2. Experimental results 5-7
x
5.5. Inclined Pullout of Strip Plate Anchors in NC Clay 5-9 5.5.1. Effects of Anchor Inclination in Weightless Soil 5-9 5.5.2. Effects of Soil Weight 5-11
5.6. Conclusions 5-12 CHAPTER 6. KEYING OF VERTICALLY INSTALLED PLATE
ANCHORS IN CLAY 6-1
6.1. Introduction 6-1 6.2. Numerical Setup 6-3
6.2.1. Anchor Loading System 6-3 6.2.2. Anchor Chain Analysis 6-5 6.2.3. Interaction between Chain Analysis and Anchor Analysis 6-6
6.3. Experimental Setup 6-7 6.4. Pre-embedded Strip Plate Anchor Analysis 6-8 6.5. Continuous Pullout Plate Anchors 6-9
6.5.1. Anchor Keying Phases in Centrifuge Test 6-9 6.5.2. Chain Profile in Centrifuge Test 6-11 6.5.3. Numerical Analysis 6-12
6.6. Factors Affect Anchor Keying 6-13 6.6.1. Effect of Soil Non-Homogeneity 6-13 6.6.2. Effect of Anchor Padeye Eccentricity 6-15 6.6.3. Effect of Anchor Roughness and Shear Strength 6-17 6.6.4. Effect of Anchor Thickness and Weight Effect 6-18 6.6.5. Effect of Inclined Pullout 6-20
6.7. Conclusions 6-21 CHAPTER 7. EFFECT OF SEPLAS INSTALLATION 7-1
7.1. Introduction 7-1 7.2. Experimental Set Up 7-2
7.2.1. Transparent Soil Test Setup 7-2 7.2.2. Kaolin Test Setup 7-3
7.3. Numerical Method 7-4 7.4. Results and Discussion 7-5
7.4.1. Centrifuge Tests 7-5 7.4.2. Numerical Analysis: Suction Installation Effect on Anchor Capacity – Small Strain FE Analysis 7-9 7.4.3. Numerical Analysis: Suction Installation Effect on Anchor Rotation – Large Deformation FE Analysis 7-11
7.5. Conclusions 7-12 CHAPTER 8. CONCLUDING REMARKS 8-1
8.1. General 8-1 8.2. Vertical Pullout of Plate Anchors in Uniform and NC Clay 8-2 8.3. Inclined Pullout Plate Anchor 8-3 8.4. Keying of Vertical and Inclined Pullout Plate Anchors in Clay 8-4

xi
8.5. Effect of SEPLAs Installation 8-5 8.6. Future Work 8-6
CHAPTER 9. REFERENCES 9-1

xii
LIST OF FIGURES Figure 1-1 Deepwater Development Systems in the Gulf of Mexico Basic Options
(Gulf of Mexico Region Minerals Management Service, 2001) ....................1-11
Figure 1-2 The catenary and taut-leg mooring systems (Shimamura, 2002)..........1-12
Figure 1-3 Common types of anchor systems used in deep water..........................1-14
Figure 1-4 Installation of a SEPLA (Ehlers et al. 2004) .........................................1-15
Figure 1-5 AMC SEPLAs during transportation (Bowles 2000)............................1-16
Figure 2-1 Definition of failure (Rowe and Davis 1982)........................................2-20
Figure 2-2 Conditions of cavity expansion (Yu 2000)............................................2-20
Figure 2-3 Cracking pattern (Davie and Sutherland 1977).....................................2-21
Figure 2-4 Installation sequence of propellant embedment anchor (Rocker 1985) 2-21
Figure 2-5 Plate anchor during rotation (O’Loughlin et al. 2006)..........................2-22
Figure 2-6 Chain element force system (Neubecker and Randolph 1995) .............2-22
Figure 3-1 Mesh generation method .......................................................................3-25
Figure 3-2 Single section after collision .................................................................3-25
Figure 3-3 A local submesh where Laplacian smoothing fails: the original local
submesh...........................................................................................................3-26
Figure 3-4 A local submesh where Laplacian smoothing fails: the results of
Laplacian smoothing, which is a tangled mesh...............................................3-26
Figure 3-5 Mesh generated by triangulation ...........................................................3-27
Figure 3-6 Smoothed mesh .....................................................................................3-27
Figure 3-7 Principle of PIV analysis (after White et al. 2003) ...............................3-28
Figure 3-8 VDPA anchor ........................................................................................3-28
Figure 3-9 Model VDPA anchors ...........................................................................3-29
Figure 3-10 Dimensions of the square VDPA anchor ............................................3-29
Figure 3-11 VDPA anchor dimensions ...................................................................3-30
Figure 3-12 Installation methods ............................................................................3-30
Figure 3-13 Model SEPLA .....................................................................................3-31
Figure 3-14 Model SEPLA anchor .........................................................................3-31
xiii
Figure 3-15 Suction caisson plate anchor installation tool .....................................3-32
Figure 3-16 Jacked in anchor installation tool ........................................................3-32
Figure 3-17 UWA beam centrifuge ........................................................................3-33
Figure 3-18 Actuator on beam centrifuge box ........................................................3-33
Figure 3-19 Schematic diagram of T-bar penetrometer (after Stewart, 1992)........3-34
Figure 3-20 Syringe pump on drum beam centrifuge .............................................3-34
Figure 3-21 UWA drum centrifuge.........................................................................3-35
Figure 3-22 Drum centrifuge box in centrifuge channel.........................................3-35
Figure 3-23 Transparent soil in drum centrifuge box .............................................3-36
Figure 3-24 Consolidation of transparent soil sample with a dead load on top......3-36
Figure 3-25 The transparent mixture under consolidation by air pressure .............3-37
Figure 3-26 Kaolin clay mixer ................................................................................3-37
Figure 3-27 Over-consolidation Kaolin clay chamber............................................3-38
Figure 4-1 Plate anchor embedded in NC and uniform clay...................................4-20
Figure 4-2 Plate anchors in FE analysis..................................................................4-20
Figure 4-3 Mesh configuration (Hmin = 0.1)............................................................4-21
Figure 4-4 Mesh configuration (Hmin = 0.02, course mesh)....................................4-21
Figure 4-5 Mesh configuration (Hmin = 0.02, fine mesh)........................................4-22
Figure 4-6 Breakout factors calculated by the original width of circular plate anchors
.........................................................................................................................4-22
Figure 4-7 Breakout factors calculated by the effective width of circular plate
anchors ............................................................................................................4-23
Figure 4-8 Pullout capacity of rough strip anchor with pre-embedment in weightless
soil (A, small strain)........................................................................................4-23
Figure 4-9 Thickness effect for strip anchors (small strain) ...................................4-24
Figure 4-10 Pullout capacity of rough strip anchor with pre-embedment in weightless
soil (V, small strain)........................................................................................4-24
Figure 4-11 Pullout capacity of rough strip anchor with pre-embedment soil weight
effect (small strain) .........................................................................................4-25
Figure 4-12 Soil flow mechanisms of rough strip plate anchor with pre-embedment
of H/B = 1 (Attached or V with su/γ'B = 0.066) ..............................................4-25
Figure 4-13 Plastic zone of rough strip plate anchor with pre-embedment of H/B = 1
(Attached or V with su/γ'B = 0.066) ................................................................4-26
xiv
Figure 4-14 Soil flow mechanisms of rough strip plate anchor with pre-embedment
of H/B = 1 (Vented with su/γ'B > 0.15) ...........................................................4-26
Figure 4-15 Plastic zone of rough strip plate anchor with pre-embedment of H/B = 1
(Vented with su/γ'B > 0.15) .............................................................................4-27
Figure 4-16 Enlarged plastic zone of rough strip plate anchor with pre-embedment of
H/B = 1 (Vented with su/γ'B > 0.15) ...............................................................4-27
Figure 4-17 Soil flow mechanisms of rough strip plate anchor with pre-embedment
of H/B = 7 (Attached or vented with su/γ'B < 1) .............................................4-28
Figure 4-18 Plastic zone of rough strip plate anchor with pre-embedment of H/B = 7
(Attached or vented with su/γ'B < 1) ...............................................................4-28
Figure 4-19 Soil flow mechanisms of rough strip plate anchor with pre-embedment
of H/B = 7 (Vented with su/γ'B > 1) ................................................................4-29
Figure 4-20 Plastic zone of rough strip plate anchor with pre-embedment of H/B = 7
(Vented with su/γ'B > 1) ..................................................................................4-29
Figure 4-21 Breakout factors of circular rough plate with pre-embedment in
weightless soil (Attached, small strain) ..........................................................4-30
Figure 4-22 Thickness effect for circular plate anchors (small strain) ...................4-30
Figure 4-23 Soil flow mechanism for deep embedded rough circular anchors ......4-31
Figure 4-24 Soil flow mechanism for deep embedded smooth circular anchors....4-31
Figure 4-25 Breakout factors of circular rough plate with pre-embedment in
weightless soil (Vented, small strain) .............................................................4-32
Figure 4-26 Pullout response of circular rough plate with pre-embedment (soil
stiffness effects (V, H/D = 4)).........................................................................4-32
Figure 4-27 Non-homogeneity effect in small strain analysis for circular anchors
(Attached)........................................................................................................4-33
Figure 4-28 Non-homogeneity effect in small strain analysis for circular anchors
(Vented) ..........................................................................................................4-33
Figure 4-29 Soil flow in NC soil for circular plate anchors....................................4-34
Figure 4-30 Plastic zone in NC soil for circular plate anchors ...............................4-34
Figure 4-31 Vented circular plate anchor in weightless soil (H/D=4) ....................4-35
Figure 4-32 Large deformation effect on Nc0 of vented circular anchors ...............4-35
Figure 4-33 Breakout factors for continuous pullout of rough circular plate anchors
Hi/D = 0.5 and 1, su/γ’D = 0.039.....................................................................4-36

xv
Figure 4-34 Breakout factors for continuous pullout of rough circular plate anchors 4-
36
Figure 4-35 Development of “A” curve of strips anchors ......................................4-37
Figure 4-36 Detail of the separation depth..............................................................4-37
Figure 4-37 Separation embedment ratios for vented plate anchor in uniform clay......
.........................................................................................................................4-38
Figure 4-38 Soil flow mechanisms of a deeply embedded circular anchor during
continuous pullout at H/D = 0.3 (Hi/D = 2, su/γ'D = 0.065, Hs/D = 0.55,
Attached anchor) .............................................................................................4-38
Figure 4-39 Soil flow mechanisms of a deeply embedded circular anchor during
continuous pullout at H/D = 0.3 (Hi/D = 2, su/γ'D = 0.065, Hs/D = 0.55, Vented
anchor) ............................................................................................................4-39
Figure 4-40 Soil flow mechanisms of a shallowly embedded circular anchor during
continuous pullout at H/D = 0.3 (Hi/D =0.5, su/γ'D = 0.065, Hs/D = 0.55,
Attached anchor) .............................................................................................4-39
Figure 4-41 Soil flow mechanisms of a shallowly embedded circular anchor during
continuous pullout at H/D = 0.3 (Hi/D =0.5, su/γ'D = 0.065, Hs/D = 0.55, Vented
anchor) ............................................................................................................4-40
Figure 4-42 Pullout response of a circular plate anchor in NC clay from Hi/D = 5
(k/γ' = 0.076) ...................................................................................................4-40
Figure 4-43 Separation depth of circular plate anchors in NC clay........................4-41
Figure 4-44 Contour or original depth of circular anchor in NC clay (Attached) ..4-41
Figure 4-45 Contour or original depth of circular anchor in NC clay (Vented) .....4-42
Figure 4-46 Rectangular anchors ............................................................................4-42
Figure 4-47 Circular plate anchor bearing capacity using ABAQUS and AFENA
(small strain) ...................................................................................................4-43
Figure 4-48 Effect of anchor shape (Attached, small strain) ..................................4-43
Figure 4-49 Effect of anchor shape (Vented, small strain) .....................................4-44
Figure 4-50 Square anchor (small strain)................................................................4-44
Figure 4-51 Rectangular L/B=2 (small strain) ........................................................4-45
Figure 5-1 Numerical analysis setup.......................................................................5-15
Figure 5-2 1g testing setup......................................................................................5-15
Figure 5-3 Pulley.....................................................................................................5-16
xvi
Figure 5-4 Testing arrangement for 65° pullout .....................................................5-16
Figure 5-5 Testing arrangement for 45° and 25° pullout .......................................5-17
Figure 5-6 Bearing capacities of inclined strip plate anchors - Attached plate anchors
(Weightless soil, small strain).........................................................................5-17
Figure 5-7 Bearing capacities of inclined strip plate anchors - Vented plate anchors
(Weightless soil, small strain).........................................................................5-18
Figure 5-8 Flow mechanisms for vertical strip plate anchor - Attached plate anchor
(H/B=1, small strain, β = 90°) .........................................................................5-18
Figure 5-9 Flow mechanisms for vertical strip plate anchor - Attached plate anchor
(H/B=5, small strain, β = 90°) .........................................................................5-19
Figure 5-10 Flow mechanisms for inclined strip plate anchor - Attached plate anchor
(H/B=5, small strain, β = 45°) .........................................................................5-19
Figure 5-11 Flow mechanisms for vertical strip plate anchor - Vented plate anchor
(H/B=5, small strain, β = 90°) .........................................................................5-20
Figure 5-12 Flow mechanisms for the inclined plate anchor - Vented plate anchor
(H/B=5, small strain, β = 45°) .........................................................................5-20
Figure 5-13 Flow mechanisms for the vertical plate anchor - Vented plate anchor
(H/B=1, small strain, β = 90°) .........................................................................5-21
Figure 5-14 Plastic zone for vertical strip plate anchor - Attached plate anchor
(H/B=5, β = 90°) .............................................................................................5-21
Figure 5-15 Plastic zone for vertical strip plate anchor - Attached plate anchor
(H/B=5, β = 45°) .............................................................................................5-22
Figure 5-16 Plastic zone for vertical strip plate anchor - Attached plate anchor
(H/B=5, β = 0°) ...............................................................................................5-22
Figure 5-17 Plastic zone for vertical strip plate anchor - Vented plate anchor (H/B=1,
β = 90°) ...........................................................................................................5-23
Figure 5-18 Plastic zone for vertical strip plate anchor - Vented plate anchor (H/B=5,
β = 90°) ...........................................................................................................5-23
Figure 5-19 Plastic zone for inclined strip plate anchor - Vented plate anchor (H/B=5,
β = 45°) ...........................................................................................................5-24
Figure 5-20 Plastic zone for inclined strip plate anchor - Vented plate anchor (H/B=5,
β = 0°) .............................................................................................................5-24
Figure 5-21 Pullout capacity comparison with the results from Merifield et al. (2005)
for vented strip plate anchors - β = 45°...........................................................5-25

xvii
Figure 5-22 Pullout capacity comparison with the results from Merifield et al. (2005)
for vented strip plate anchors - β = 22.5°........................................................5-25
Figure 5-23 Vented strip plate anchor soil weight effect - su/γ'B = 0.074 ..............5-26
Figure 5-24 Vented strip plate anchor soil weight effect - su/γ'B = 0.221 ..............5-26
Figure 5-25 Vented strip plate anchor soil weight effect - su/γ'B = 0.357 .............5-27
Figure 5-26 Vented strip plate anchor soil weight effect - su/γ'B = 0.536 .............5-27
Figure 5-27 Vented strip plate anchor soil weight effect - su/γ'B = 0.893 ..............5-28
Figure 5-28 Large deformation analyses for inclined strip anchors (su/γ'B=0.174)5-28
Figure 5-29 Large deformation analyses for inclined strip anchors (su/γ'B = 0.368).....
.........................................................................................................................5-29
Figure 5-30 T-bar test (T1) .....................................................................................5-29
Figure 5-31 T-bar test (T2) .....................................................................................5-30
Figure 5-32 T-bar test (T3) .....................................................................................5-30
Figure 5-33 T-bar test (T4) .....................................................................................5-31
Figure 5-34 Breakout factors for square anchor in uniform clay............................5-31
Figure 5-35 Test 2: Square anchor 45° cutaway .....................................................5-32
Figure 5-36 Test 3: Square anchor 65° cutaway .....................................................5-32
Figure 5-37 Test 4: Square anchor 45° cutaway .....................................................5-33
Figure 5-38 Test 4: Square anchor 25° cutaway .....................................................5-33
Figure 5-39 Breakout factors for square anchor in uniform clay............................5-34
Figure 5-40 Breakout factors for square anchors and rectangular anchors in uniform
clay ..................................................................................................................5-34
Figure 5-41 Breakout factors for strip plate anchors in NC clay (Attached anchors)....
.........................................................................................................................5-35
Figure 5-42 Breakout factors for strip plate anchors in NC clay (Vented anchors)5-35
Figure 5-43 Flow mechanisms for vertical strip plate anchor in NC clay - Attached
plate anchor (H/B=5).......................................................................................5-36
Figure 5-44 Flow mechanisms for inclined strip plate anchor in NC clay - Attached
plate anchor (H/B=5).......................................................................................5-36
Figure 5-45 Soil shear strength gradient effect – Attached strip anchors (su=1.0z
kPa/m and su=2.0z kPa/m) ..............................................................................5-37
Figure 5-46 Soil shear strength gradient effect –Vented strip anchors (su=1.0z kPa/m
and su=2.0z kPa/m) .........................................................................................5-37

xviii
Figure 5-47 Plastic zone for the inclined plate anchor - Vented plate anchor
(H/B=5, β = 45o su = 1.0z kPa)........................................................................5-38
Figure 5-48 Plastic zone for the inclined plate anchor - Vented plate anchor (H/B=5,
β = 45o, su = 2.0z kPa).....................................................................................5-38
Figure 5-49 Soil weight effect in NC clay (su=1.0z kPa/m, β=90°)........................5-39
Figure 5-50 Soil weight effect in NC clay (su=1.0z kPa/m, β=45°)........................5-39
Figure 5-51 Soil weight effect in NC clay (su=1.0z kPa/m, β=0°)..........................5-40
Figure 5-52 NC soil effect for soil with weight (γ'=7kN/m3) .................................5-40
Figure 6-1 Keying processes for the Suction Embedded Plate Anchor (SEPLA) ..6-23
Figure 6-2 Loading conditions of anchor in the Finite Element analyses- Anchor after
installation.......................................................................................................6-23
Figure 6-3 Loading conditions of anchor in the Finite Element analyses- Anchor
during rotation (keying) ..................................................................................6-24
Figure 6-4 Loading conditions of anchor in the Finite Element analyses- Anchor with
ultimate bearing capacity ................................................................................6-24
Figure 6-5 Transparent soil sample within the plane strain testing chamber..........6-25
Figure 6-6 Shear strength of transparent soil ..........................................................6-25
Figure 6-7 Transparent soil test setup .....................................................................6-26
Figure 6-8 Soil flow mechanisms around a strip plate anchor (Horizontal pullout,
H/B=1).............................................................................................................6-26
Figure 6-9 Soil flow mechanisms around a strip plate anchor (45° inclined pullout
without moment (e=0), H/B=1).......................................................................6-27
Figure 6-10 Soil flow mechanisms around a strip plate anchor (45° inclined pullout
with moment (e>0), H/B=1)............................................................................6-27
Figure 6-11 Soil flow mechanisms around a strip plate anchor (45° inclined pullout
with moment (e>0, H/B=5).............................................................................6-28
Figure 6-12 Transparent soil pullout response........................................................6-28
Figure 6-13 Anchor keying in transparent soil test (e/B = 0.625, θ = 90o) .............6-30
Figure 6-14 Anchor keying in transparent soil test (e/B = 0.625, θ = 60o) .............6-31
Figure 6-15 Chain profile during inclined pullout θ = 60° .....................................6-32
Figure 6-16 Numerical simulation of transparent soil test in FE analysis (e/B=0.625,
θ = 90o)............................................................................................................6-32

xix
Figure 6-17 Numerical simulation of transparent soil test in FE analysis (e/B=0.625,
θ = 60o)............................................................................................................6-33
Figure 6-18 Pullout response in numerical simulation ...........................................6-33
Figure 6-19 Chain displacement ~ Loss of embedment in FE analysis (θ=60°) ....6-34
Figure 6-20 Anchor and chain position during pullout in FE analysis ...................6-34
Figure 6-21 Flow mechanism during final pullout (FE) .........................................6-35
Figure 6-22 Effect of soil strength profile on anchor keying (Hi/B = 3, θ = 90°)...6-35
Figure 6-23 Plate anchor rotational behaviour in NC clay (su = 0.7kPa)................6-36
Figure 6-24 Combined loading paths for high and low eccentricity plate anchors
(O’Loughlin et al. 2006) .................................................................................6-36
Figure 6-25 Interface roughness effect on anchor keying (su/γ'B=0.294, θ = 90o) .6-37
Figure 6-26 Soil shear strength effect on anchor keying (e/B=0.625, θ = 90o) ......6-37
Figure 6-27 Anchor thickness effect on anchor keying (e/B=0.625, θ = 90o) ........6-38
Figure 6-28 Effect of relative anchor unit weight on anchor keying (e/B=0.625, �θ =
90°)..................................................................................................................6-38
Figure 6-29 Loss of embedment for weightless anchors during vertical pullout....6-39
Figure 6-30 Combined loading paths for high and low plate anchor’s weight.......6-39
Figure 6-31 Loss in anchor embedment during keying effect factors (θ = 90o) .....6-40
Figure 6-32 Anchor pullout under inclined pullout load (e/B = 0.625, γa′=60kN/m3)...
.........................................................................................................................6-40
Figure 6-33 Comparison with existing laboratory data ..........................................6-41
Figure 7-1 Installation of SEPLA (Aubeny et al. 2001) .........................................7-14
Figure 7-2 Transparent soil before cut into halves .................................................7-14
Figure 7-3 Half transparent soil sample ..................................................................7-15
Figure 7-4 transparent soil sample with Colored flock powder in the central plane .....
.........................................................................................................................7-15
Figure 7-5 Transparent soil test setup .....................................................................7-16
Figure 7-6 Kaolin clay test setup (Gaudin et al., 2006) ..........................................7-16
Figure 7-7 Kaolin clay test setup ............................................................................7-17
Figure 7-8 Plate anchor installation method ...........................................................7-17
Figure 7-9 Equipment for installation.....................................................................7-18
Figure 7-10 Setup of numerical analysis.................................................................7-18
Figure 7-11 Mesh generated using h-adaptivity......................................................7-19

xx
Figure 7-12 Shear strength profile of transparent soil ............................................7-19
Figure 7-13 Shear strength profile of kaolin clay ...................................................7-20
Figure 7-14 Anchor pullout response in transparent soil (θ=60°) ..........................7-20
Figure 7-15 Plate anchor during pullout in transparent soil sample after suction
caisson installation (θ=60°).............................................................................7-22
Figure 7-16 Plate anchor during pullout in transparent soil sample after jacked in
installation (θ=60°) .........................................................................................7-23
Figure 7-17 PIV analysis.........................................................................................7-24
Figure 7-18 Anchor rotation for anchors installed by different methods in transparent
soil (θ=60°) .....................................................................................................7-24
Figure 7-19 Chain displacement ~ Loss of embedment in transparent soil (θ=60°) .....
.........................................................................................................................7-25
Figure 7-20 Breakout factor for the plate anchors in transparent soil (by selecting
shear strength from image analysis) (θ=60°) ..................................................7-25
Figure 7-21 Breakout factor for the plate anchors in transparent soil (by estimating
shear strength) .................................................................................................7-26
Figure 7-22 Anchor pullout response in kaolin clay (θ=60°) .................................7-26
Figure 7-23 Breakout factor for the plate anchors in kaolin clay (θ=60°) ..............7-27
Figure 7-24 Breakout factors for soil with various disturbance zone .....................7-27
Figure 7-25 Soil flow mechanism for a plate anchor in fully disturbed soil in a
caisson.............................................................................................................7-28
Figure 7-26 Plastic zone for a plate anchor in fully disturbed soil in a caisson......7-28
Figure 7-27 Soil flow mechanism for a plate anchor in soil with 3 times the caisson
wall disturbance ..............................................................................................7-29
Figure 7-28 Plastic zone for a plate anchor in soil with 3 times the caisson wall
disturbance ......................................................................................................7-29
Figure 7-29 Effect of soil disturbance on Nc0 factor ...............................................7-30
Figure 7-30 Effect of soil sensitivity.......................................................................7-30
Figure 7-31 Plastic zone for plate anchor in soil with sensitivity St=5...................7-31
Figure 7-32 Numerical setup for disturbance effect ...............................................7-31
Figure 7-33 Disturbance effect of suction installation (θ=90°) ..............................7-32

xxi
LIST OF TABLES Table 1-1 Development of SEPLAs and current use (InterMoor 2007) .................1-10
Table 2-1 Strength reduction factor (Rocker 1985) ................................................2-19
Table 3-1 Summary of common analysis methods (Carter et al. 2000)..................3-20
Table 3-2 Centrifuge scaling laws...........................................................................3-21
Table 3-3 Transparent soil test in the literature review...........................................3-22
Table 3-4 Transparent soil properties after consolidation to σ'v = 220 kPa............3-23
Table 3-5 Kaolin clay properties.............................................................................3-24
Table 5-1 Summary of testing details in 1g tests (Hi/B=5) .....................................5-14

xxii
NOTATIONS, ABBREVIATIONS A = Fully attached plate anchor
ABS = American Bureau of Shipping
ALE = Arbitrary Lagrangian-Eulerian
AMC = CSO Aker Maritime
Aa = Plate anchor area
B = Width of strip anchor
BEM = Boundary element method
CE = Cavity expansion
COFS = Centre for Offshore Foundation Systems
cv = Consolidation coefficient
D = Diameter of circular anchor
DEM = Discrete element method
DPA = Torpedo and Deep Penetration Anchors
E = Young’s modulus
e = Eccentricity of anchor
ecs = e at 1kPa on CSL
F = Pullout force
FH = Horizontal component force
Fn = Normal force perpendicular to plate anchor
Fs = Shear force along plate anchor
FV = Vertical component force
FE = Finite element
FEM = Finite element method
FPS = Floating Production System
FPSO = Floating Production, Storage and Offloading
ew = Distance of shank weight to the front face of plate anchor
f = Shank friction
H = Plate anchor embedment depth

xxiii
Hi = Initial embedment depth
Hmin = Minimum mesh density
HSD = Embedment depth between shallow and deep embedment
Hs = Separation embedment depth
hm = Model depth
k = Strength gradient with depth for normally consolidated soil
k = Permeability
L = Length of anchor
LB = Lower Bound
LT = Long term consolidation
M = Moment
M0 = Initial moment corresponding to zero net vertical load
N = Centrifuge scaling ratio
NC = Normally consolidated soil
NCEL = Naval Civil Engineering Laboratory
Nc = Ultimate pullout capacity factor
Nc0 = Ultimate pullout capacity factor for weightless soil
Ncsh = Ultimate pullout capacity factor for initially shallowly embedded
vented plate anchor
NcTBar = Bearing capacity factor for T-Bar
PIV = Particle Image Velocimetry
Q = Pullout force
Qu = Ultimate pullout force
Qushear = Shear resistance from shear plane above plate anchor
Qusoil = Soil weight above plate anchor
q = Ultimate pullout pressure
qu = Ultimate pullout pressure
RITSS = Remeshing and Interpolation Technique with Small Strain
R2 = Correlation coefficient for fitted curve
SEPLA= Suction Embedded Plate Anchor
SPAR = SPAR platform
SS = Small strain analysis
ST = Short term consolidation
St = Soil sensitivity

xxiv
su = Soil undrained shear strength
su,disturbed= Disturbed soil shear strength
sua = Shear strength at the centre of inclined anchor
sub = Undrained shear strengths at the bottom edges of plate anchor
su0 = Original soil shear strength at current plate anchor depth
sui = Soil strength at initial embedment depth
sut = Undrained shear strengths at the top edges of plate anchor
SW0 = Weightless soil
t = Thickness of plate anchor
tT = Time
T* = Normalized tension
TL = Total Lagrangian formulation
TLM = Taut-leg mooring
TLP = Tension Leg Platform
UB = Upper Bound
UL = Updated Lagrangian formulation
V = Vented plate anchor
v = Installation or pullout rate
VDPA = Vertically driven plate anchor
VLA = Drag Embedded Anchors and Vertically Loaded Anchors
Wa′ = Difference between the anchor weight in air and buoyancy force
Wshank = Shank weight
X = Independent variables (particle or the body-point)
z = Depth
z* = Normalized depth
β = Anchor orientation angle
γ = Bulk soil unit weight
γ′ = Effective soil unit weight
γa′ = Effective anchor weight
δ = Displacement interval of remeshing
ν = Poisson’s ratio
ρ = Density of the model object in centrifuge
ξ = Position of a particle X

xxv
θa = Angle of force F at the padeye to the horizontal
θ0 = Chain angle (to the horizontal) at the soil surface
κ = Slope of OC line
λ = Slope of NC line
σv′ = Vertical stress
τ = Relative time
φ = Friction angle
ψ = Dilation angle
Δze = Loss of embedment

1-1
CHAPTER 1. INTRODUCTION
1.1. Trends of the Offshore Oil and Gas Industry
Since the late 1980s, with the world’s oil and gas demands increasing daily, shallow
water hydrocarbon reserves are being exhausted. The oil and gas industry has been
increasingly focusing its resources on deeper water development fields, with some
locations reaching water depths of 3000 m (Aubeny et al. 2001; Clarkston et al.
2001). It is expected that due to the deep water development, $29,737 million US
dollars will be spent on the global floating production market in the next five years
according to the data presented by www.infield.com. In the regions of
Asia/Australasia, a 60% increase in spending is forecasted, from US $4.3 billion to
US $6.86 billion.
1.2. Deep Water Production Units and Mooring Systems
As the water depth increases, the fixed platforms supported by gravity foundations
become unsuitable and uneconomical. Instead, in the deep water environment, there
are many different types of drilling and production platforms/vessels used in the
extraction of oil and gas such as Tension Leg Platforms (TLPs), SPAR platforms
(SPARs), Floating Production Systems (FPS) and Floating Production, Storage and
Offloading (FPSOs) (Colliat 2002; Loez 2002; Roesset and Yao 2002; Shimamura
2002). Each has their advantages and disadvantages, depending mainly upon water
depth for its selection criteria. Figure 1-1 (Gulf of Mexico Region Minerals

2-1
CHAPTER 2 LITERATURE REVIEW
2.1. Introduction
This chapter incorporates a survey of the literature relevant to the prediction of plate
anchor performance in numerical and experimental study, which includes the basic
theories of quantifying bearing capacity, loss of embedment of plate anchors during
keying and the suction installation effect. Large deformation theory in numerical
analysis with special attention to geomechanics is discussed. Recent numerical and
experimental works in the relevant areas are presented respectively.
2.2. Plate Anchor Capacities
A summary of research into plate anchor capacities in clay is presented hereafter,
which is divided into the numerical/theoretical and experimental based studies.
2.2.1. Numerical Study
The early research of theoretical and finite element (FE) studies on the capacities of
plate anchors in clay can be found in Ashbee (1969), Vesic (1971), and Gunn (1980).
Vesic (1971) proposed an analytical approach for the pullout capacity of horizontal
anchors based on the solutions for the problem of an expanding cavity close to the
surface of a semi-infinite rigid plastic solid. These solutions gave the ultimate radial
pressure needed to break out a cylindrical or a spherical cavity embedded at a depth

2-2
below the surface of a solid. The pullout capacities for strip and circular anchors
were then assessed by assuming the pullout load was equivalent to the ultimate
cylinder and spherical cavity pressure, plus the weight of soil acting directly above
the anchors.
The numerical study of pullout capacity factors for strip and circular anchors in clay
was studied numerically by Rowe and Davis (1982) using conventional small strain
FE analysis. The suction effect was shown by the difference in pullout capacity
factors for attached (no breakaway) and vented (immediate breakaway) anchors, with
separation between soil and anchor assumed for the latter case when tension
appeared. In their study, an elasto-plastic finite element analysis was performed to
determine the pullout capacity factor of anchors. For a vented anchor with deep
embedment, there was no ultimate uplift capacity achieved. Instead, the pullout
capacity factor was estimated by taking the capacity at a given displacement. The
anchor capacity was therefore dependent on the soil stiffness. Figure 2-1 shows the
definition of the failure, which was named as k4 failure in this paper.
Kumar (1999) proposed a kinematic approach for the uplift of strip foundations in
clay. The method was based on the upper bound theorem of limit analysis and
satisfies the kinematic admissibility of the chosen collapse mechanism. The effect of
the yielding partial soil shear strength parameters along the interfaces of slices on the
collapse load was investigated by introducing the soil strength factor “m”. The uplift
capacity increased with the increase in values of “m”. The results obtained compared
reasonably well with the other existing theories as well as the experimental data both
in sands and clay.
More recently, Yu (2000) derived an expression for the break-out factor based on
more accurate analytical solutions for cavity expansion in cohesive-frictional soil. In
this solution it was assumed that break-out occurs if the boundary of the plastic zone
(due to the anchor pullout action) predicted by cavity expansion theory was
sufficiently close to or on the ground surface (Figure 2-2). In other words, plate
anchors broke out when the plastic flow was not confined by the outer elastic zone.
2-3
The most rigorous limiting capacity of strip, circular and rectangular anchors
embedded in homogeneous and non-homogeneous soils was investigated by
Merifield et al. (2003b; 2001), using finite element formulations of limit analyses
based on rigid plastic soil response. Upper and lower bound solutions for vented
anchors with smooth and rough interfaces in weightless soil were presented and they
showed how the effect of soil weight could be allowed by superimposing the soil
weight, with limiting capacity factors given for deeply embedded anchors where
breakaway was suppressed. Limiting capacity factors for strip anchors were found to
be 10.8 (lower bound) and 11.96 (upper bound), regardless of anchor roughness.
Corresponding lower bound values for deeply embedded square and circular plate
anchors with rough interfaces were found to be 11.9 and 12.56, respectively.
Martin and Randolph (2001) have reported upper bound and lower bound solutions
for plate with full soil attachment at plate base. It was assumed that there was no
restriction on the development of tensile stress, thus a “no breakaway” condition was
simulated. By coinciding upper bound and lower bound solutions, exact solutions for
deeply embedded circular plate have been found as Nc = 12.42 for smooth anchors
and Nc = 13.31 for rough anchors.
Thorne et al. (2004) studied the behaviour of horizontal strip anchors buried in clay.
Possible mechanisms of failure were reviewed. It showed that the behaviour of the
strip anchors was a function of several non-dimensional factors: the plate anchor
embedment ratio, the relative effects of overburden pressure and shear strength, and
the capacity of the pore fluid to accept tension. It was also demonstrated that the
ultimate tensile stress was dependant on the availability of water at the surface of the
soil and within the soil beneath the strip anchor.
The important effect of anchor inclination has received very little attention by
researchers. The only numerical work for inclined plate anchors can be found by
Merifield et al. (2005). Consideration was given to the effect of embedment ratios
and anchor inclination angles. The results were presented as breakout factors in chart
form to facilitate use in solving practical design problems.
2-4
Plastic yield envelopes obtained from finite element (FE) analyses for drag plate
anchors have been studied by Bransby and O'Neill (1999), O'Neill et al. (2003) and
Elkhatib and Randolph (2005). The method is based on the assumption that, as an
anchor is dragged through soft undrained soils, failure of the soil around the anchor
consists of localised plastic flow. These papers present results from FE studies
investigating the behaviour of soil surrounding an anchor plate. Plate anchors were
subjected to vertical, horizontal and moment loading to characterise a plastic yield
envelope. Plate anchor capacity and yielding loci under these combined loading were
studied. Mathematical expressions fitted to the data provided idealized yield loci in
combined load space. The anchor’s trajectory was then determined using a
kinematics approach.
2.2.2. Experimental Study
Over the last four decades a number of researchers have proposed approximate
techniques to estimate the uplift capacity of plate anchors in various types of soil
(Adams and Hayes 1967; Ali 1968; Bhatnagar 1969; Das 1978; Das 1980; Das et al.
1985; Das and Puri 1989; Das et al. 1994; Davie and Sutherland 1977; Kupferman
1971; Meyerhof 1973; Meyerhof and Adams 1968; Ranjan and Arora 1980; Vesic
1971). In an attempt to reduce sample preparation times, many researchers choose to
adopt small scale model testing. Model anchors can be between 38 mm and 50 mm
in size. The size of the testing chamber generally ranges from 500 mm in width and
diameter up to 1000 mm.
Earlier model tests on circular anchors have been conducted by Spence (1965),
Adams and Hayes (1967), Ali (1968) and Kupferman (1971). In these investigations,
anchors were positioned horizontally (and pulled vertically) in remoulded soils
ranging from soft to stiff in strength. It was found that the anchor capacity increases
with embedment depth before finally reaching a constant value. This transition was
defined as “deep” anchor behaviour and occurred at embedment ratios H/B ranging
from 1.5 to 5.
2-5
Meyerhof and Adams (1968) and Meyerhof (1973) estimated break-out factors for
horizontal anchors based on a limited number of laboratory model tests. Meyerhof
and Adams (1968) performed laboratory tests using circular anchors, and Meyerhof
(1973) performed tests on both circular and strip anchors. Using their results, a
general theory for the uplift resistance for both circular and strip anchors was
proposed. Their solutions were only approximate, as they made several key
assumptions regarding the anchor failure mechanism and the earth pressure
distribution along the failure surface.
Vesic (1971) performed a number of laboratory pullout tests on horizontal circular
plate anchors in soft and stiff clays and compared the results with the analytical
solutions. As mentioned by Vesic, these results may have been from the study of Ali
(1968) and Bhatnagar (1969), who investigated the pullout resistance of anchor
plates and anchor piles in soft bentonite clay and silty clay respectively. The
observed resistances of the soil were compared with the solution (Vesic 1971).
Several effects like soil remoulding, rate and character of loading, soil adhesion, soil
suction force, ocean bottom slope, load inclination and soil liquidity were discussed
respectively. Results also indicated a significant variation between the theoretical and
laboratory estimates of anchor capacity.
Davie and Sutherland (1977) performed vertical uplift of circular anchors in clay.
Dimensional analysis was used to establish the similarity conditions between
prototype and models. Anchors used in this study were 25 mm - 200 mm. Two clays
were prepared by mixing sodium bentonite and glycerine, a silty clay and Fayles
Blue clay. Coloured markers were used in the clay sample to observe deformation
and cracking patterns, which provided some guidance on the failure mechanism
(Figure 2-3).
Das (1978; 1980) provided tentative procedures, based on model laboratory tests, for
estimation of the ultimate uplift capacity of square, circular, and rectangular anchors
embedded horizontally in purely cohesive soil. These tests were mostly performed in
soft clays with a limited number of tests performed in stiff clays. The model anchors
used had widths of 38 mm - 50 mm and lengths of 38 mm - 190 mm and were vented
at the base to eliminate suction effects by the insertion of a hollow tube. Results

2-6
showed that the breakout factor of foundations located at a relatively shallow depth
increases linearly with embedment ratio up to a value of about 6. Beyond this value,
there was a gradual decrease, reaching a maximum at critical embedment ratio. For
square and circular foundations, the critical ratio varies from about 3 in soft clay to
about 7 for medium and stiff clays. The maximum breakout factor was found to be
about 9 for deep anchors. Based on the experimental data (Das 1978), Das (1980)
suggested procedures to estimate ultimate pullout capacity of plate anchors in clay.
Rowe (1978) studied the uplift behaviour of horizontal rectangular anchors, with the
results being summarised by Rowe and Davis (1982). A test program was designed
to study the uplift behaviour of model rectangular anchors for the case of immediate
breakaway. The model anchors were made from a 6 mm thick brass bar with width
from 13 mm – 38 mm and lengths ranging from 64 mm – 190 mm and aspect ratio
L/B between 3 and 8. A technique of underlaying the anchor with filter paper was
adopted to prevent adhesion between the underside of the anchor plate. Hollow
anchor rods were used to prevent the development of suction. This method was
similar to that used by Adams and Hayes (1967). Rowe and Davis (1982) concluded
that anchor behaviour can be divided into two categories, shallow anchor behaviour
(H/B ≤ 4.5) and deep anchor behaviour (H/B ≥ 4.5). Rowe and Davis (1982)
observed that their laboratory findings showed encouraging agreement with their
theoretical solutions.
The load capacity of vertical plate anchors in purely cohesive soil has not received
much attention in the literature. The published works of Ranjan and Arora (1980),
and Das et al. (1985) appear to summarise all the laboratory based research in this
area. Das et al. (1985) conducted a number of laboratory pullout tests on vertical
anchors with width to length ratios (L/B) varying from one (square) to five
(rectangular) in very soft to firm soils. In these tests, the conditions behind the
anchor are not clearly defined and no attempt appears to have been made to measure
or avoid the suction forces that develop behind the anchor. It was observed that the
anchor capacity increased with embedment ratio. Ultimate capacity was defined as
load at which the anchors were completely pulled out or beyond which the load-
displacement plot became practically linear. Das et al. (1985) defined the embedment
depth at which the anchor capacity reaches a constant value as the “critical

2-7
embedment depth”, and later presented simple empirical relationships for estimating
this value.
A limited number of results for the capacity of inclined square and strip anchors can
be found in the works of Meyerhof (1973) and Das and Puri (1989). The study of
Das and Puri (1989) appears to be the most significant experimental attempt to
quantify the capacity of inclined anchors. In their tests, the capacity of shallow
square anchors embedded in compacted clay with an average undrained shear
strength of 42 kPa was investigated. Pullout tests were conducted on anchors at
inclinations ranging between 0° (horizontal) and 90° (vertical) for embedment ratios
(H/B) of up to four. A simple empirical relationship was suggested for predicting the
capacity of square anchors at any orientation which compared reasonably well with
the laboratory observations. Das and Puri (1989) also concluded that anchors with
aspect ratios (L/B) of 5 or greater would, for all practical purposes, behave as a strip
anchor.
During the pullout of plate anchors in clay, the suction force may be a large part of
the total holding capacity. Das et al. (1994) studied the short-term ultimate uplift
capacity of a circular plate anchor embedded in soft saturated clay. The tests were
conducted with and without venting the bottom of the plate anchor in order to
determine the variation of the suction force with embedment ratio. The variation of
the suction force is presented in terms of the undrained shear strength of the clay and
also the net ultimate uplift capacity.
Das (1995) also studied the creep test with sustained uplift loads at varying
embedment ratios. Based on the model test results, the variation with time had been
determined for the rate of strain of the soil located above the plate anchor. Empirical
formulas for obtaining the rate of anchor uplift have been proposed.
Most of these experimental studies referenced above led to empirical correlations
based on laboratory model tests. The experimental studies included ‘venting’ the
anchor base, so as to eliminate any suction, but even without such intervention,
cavitations behind the anchor under conditions with very low ambient stresses (or

2-8
high ratios of shear strength to overburden stress) limit their applicability to field
situations, particularly offshore.
2.2.3. Industry Design Code
Apart from the research work quoted above, there were also some calibrated design
codes for plate anchors in clay. US NCEL (Naval Civil Engineering Laboratory)
guidelines (Rocker 1985) discussed static and dynamic holding capacities for direct-
embedment plate anchors (propellant-driven anchors (Figure 2-4), vibratory-driven
anchors, impact-driven anchors, jetted in anchors and auger anchors) in clay. Short-
term, long-term and disturbance effect were investigated. Other factors like holding
capacity on slopes, creep under static loading were also investigated. Soil strength
reduction factor was suggested for soil with different soil sensitivities. Table 2-1
depicts the reduction factors suggested by Rocker (1985).
Dahlberg (2004) described the features, advantages and limitations of a new design
code for plate anchors in clay, which is applicable to offshore platforms. The design
code prescribed the use of partial safety factors that were calibrated on the basis of
structural reliability analysis to meet specified annual failure probabilities.
2.3. Other Issues of Plate Anchor Behaviour
2.3.1. Rotation of Anchors
For the anchors installed vertically like SEPLAs, the anchor embedment depth will
reduce as the plate rotates during pullout. As offshore clay deposits are typically
characterised by an increasing strength profile with depth, any loss in embedment
will correspond to a non-recoverable loss in potential anchor capacity.
US NCEL guidelines (Rocker 1985) proposed that this loss of embedment was twice
the anchor width in cohesive soils and it was believed that keying distance may be

2-9
longer in highly sensitive soils but may be shorter as more time elapses between
penetration and keying.
However, SEPLA field tests reported by Wilde et al. (2001) indicated a smaller,
though wide, range of vertical displacement during anchor keying, of 0.5 - 1.7 times
the plate width. One to one and a half times plate width was observed during a
quarter-scale offshore test and half plate width during full scope test.
O'Loughlin et al. (2006) used centrifuge tests to assess the keying characteristics of
plate anchors in clay. Tests were carried out adjacent to a Perspex window in plane
strain chambers located in a drum centrifuge channel (Figure 2-5). Plate anchors
displacement was quantified through a series of digitally captured images of the clay-
Perspex interface. The results showed a strong dependence on loss in embedment
with loading eccentricity. The findings have been explained using plasticity and
combined loading principles.
Gaudin et al. (2008) extended the analysis performed by O’loughlin et al. (2006) by
investigating the influence of the load inclination on the loss of embedment. Results
have demonstrated that the loss in embedment increased with the increase of loading
inclination.
The overall range of embedment loss from the work quoted above is disconcertingly
wide, equating to a high degree of uncertainty in the ultimate holding capacity.
2.3.2. SEPLAs Installation Effect
During installation of SEPLAs, the soils in the vicinity of the anchors may be
disturbed and remoulded (Randolph et al. 2005), which was discussed for direct-
embedment anchors by NECL guidelines (Rocker 1985).
Wilde et al. (2001) applied field testing of SEPLAs to investigate the disturbance
effect of the suction installation. The disturbance effect factor was suggested to be

2-10
0.8 – 1.0 for the soil with soil sensitivity St < 2. And for the moderately sensitive clay
2 ≤ St ≤ 5, the disturbance effect factor was approximately 0.7.
Gaudin et al. (2006) investigated the influence of the installation process of SEPLAs
in clay. A 1/145th reduced plate anchor model was used to assess capacity and loss of
embedment. Results showed a loss of anchor pullout capacity for the suction
embedded anchors immediately following the retrieval of the caisson due to the
weakening of the clay in the vicinity of the anchor. As the clay regained strength
with time, the anchor capacity increased to match those of the simply jacking in
anchors. The loss of anchor embedment during the keying process was observed to
be lower for the suction embedded anchors than for the simply jacking in anchors,
but both set of data correlated closely with the load inclination at the anchor padeye.
2.3.3. Anchor Chain Behaviour
During pullout of plate anchors, anchor chain slides and cuts through clay especially
during an inclined pullout. The anchor chain may show an inverse catenary profile.
Neubecker and Randolph (1995) published a method to obtain chain profile by
solving the force distribution and geometric profile of an embedded anchor chain
(see Figure 2-6). This expression greatly simplified the procedure for estimating the
load and inclination of an embedded chain at some connection point in the soil. The
analytical work was corroborated with extensive laboratory test results.
O'Neill et al. (2003), Thorne (1998), Elkhatib and Randolph (2005) adopted the
profile of the anchor chain profile by Neubecker and Randolph (1995) and used it for
drag-in anchor FE analysis. Results showed a good agreement between numerical
analysis and physical modelling for drag-in anchors.
Neubecker and O'Neill (2004) applied a parametric study of an embedded chain.
Mooring line slippage response was carried out by developing graphical relationships.
The efficiencies have been identified for offshore installation of anchor chain.

2-11
2.4. Large Deformation Formulations
In describing the motion of a body, there exist four methods of formulation which are
called the material, the referential, the spatial, and the relative formulations (Gadala
et al. 1983).
“1. In the material description, the independent variables are the particle or the body-
point X, and the time tT. This description is conceptually the most natural one and is
the one exclusively used in analytical dynamics. However, it is rarely used in
continuum mechanics, or specifically in finite element applications.
2. In the referential description, the independent variables are the position X of a
particle X in an arbitrarily chosen reference configuration, and the time tT. It is
important to notice that the choice of the reference configuration is arbitrary and
essentially this choice would not affect the results. A particular referential
description was introduced by Euler where the position X of the body-point X at the
particular time tT = 0 is used to describe the motion. This particular description is
often called the Lagrangian formulation in the literature. However, any other choices
of the reference configuration at a specific time other than tT = 0 would still be
Lagrangian in nature, in the sense that the independent variable x is considered at a
fixed time instant.
3. In the spatial description, the independent variables are the current position x of
the particle X, and the time tT. This description is usually called the Eulerian
description. With the spatial description, we are concerned with what is happening in
a fixed region of space as time goes on, which seems to be perfectly suited for the
study of fluids. However, for the same reason the spatial description is awkward for
the expression of the principles of mechanics, since the laws of dynamics refer to
what is happening to the body, and not to the region of space which the body
momentarily occupies. It is also important to emphasize the fact that the independent
variable x is a function of the Lagrangian position X and the time tT, i.e. x = x (X, tT).
Therefore all material derivatives will be much more difficult to handle in spatial
description.
2-12
4. In the relative description, the independent variables are the position x in a current
or present configuration and the time τ. In relative description the reference
configuration depends upon time. The current or present configuration is taken as the
reference configuration and the past and future configurations are described relative
to the current or present one. The variable time τ is the time when the particle X
occupied a position ξ, where ξ = ξt (x, τ). It is important to realise that the relative
description is referential, or Lagrangian in nature, in the sense that the reference
position is now denoted by x at time t rather than X at time tT = 0. This will justify
the classification of updated Lagrangian formulation as a special case of the relative
description as will be discussed later. ”
In finite element approach to continuum mechanics problems, only the last three
descriptions are used namely the Lagrangian and Eulerian formulations. The
referential description is called Total Lagrangian (TL) in literature. The spatial
description is usually called the Eulerian description and the relative description is
referential, or Lagrangian in nature into the category of Updated Lagrangian (UL) in
literature.
2.4.1. Updated Lagrangian and Eulerian Description
The Lagrangian approach is largely used in solid mechanics applications and is
particularly suitable for cases in which unconstrained flow occurs over free
boundaries, because the mesh closely represents material boundaries. Hibbitt et al.
(1970) introduced the first finite element formulation for large strain problems. In
their approach they used a total Lagrangian formulation. Later on, McMeeking and
Rice (1975) pioneered the use of updated Lagrangian formulation (UL) in the same
area of applications. The two formulation methods have been widely used for both
steady and non-steady static large plastic strain problems. Bathe and Ozdemir (1976)
introduced an implicit final form of the non-linear equilibrium equations where all
the non-linear stiffness contributions were combined in one stiffness term. In the TL
method, the initial configuration of the body is used as the reference state and all
variables (e.g. stresses and strains) are measured with respect to the initial

2-13
configuration. In the UL method, the current configuration of the body is used during
the analysis. Both TL and UL are commonly used to deal with large displacements,
rotations and strains of solids. As explained before, they are all categorises of
referential description. It should be noted that the TL method and the UL method are
not two different solutions to the problem, but rather two different ways of
linearization of the equilibrium equations and should result in the same solution to
the problem. In theory, they can both be used in problems with large deformations
and large strains. The main drawback of the TL and UL methods is the loss of
convergence and accuracy when severe mesh distortion occurs. A serious limitation
of the Lagrangian approaches is gross distortion of individual finite elements that
accompanies large strains within the body. Cheng and Kikuchi (1986) have described
mesh rezoning techniques to circumvent the limitations associated with element
distortion. However, complex contact boundary representation may still be impaired
using an updated Lagrangian mesh.
The Eulerian formulation, on the other hand, is a natural approach for fluid
mechanics problems that involve a control volume. This approach is particularly
suitable, and has been used widely, for steady-state analysis of forming processes
involving large material flow, but minimal change in boundary shape, such as rolling
and extrusion problems. Since the mesh is spatially fixed in this approach, no mesh
distortion occurs, which makes it computationally efficient. However, for the same
reason, the approach is inherently unable to model the unconstrained flow of material
on free boundaries, and may only be used when the boundaries of the deformed
material are known a priori. Although, there has been some attempt to remedy this
problem by iteratively updating the surface, these attempts usually amount to
modifying the boundaries outside finite element solution domain on a trial and error
basis.
Although many analysts describe relative or updated Lagrangian formulation under
the name of Eulerian formulation (Lu 2004), it could be worthy to mention the key
difference of the Updated Lagrangian and Eulerian description.
As discussed above, the referential description employs some assigned reference
configuration. If the reference configuration is taken at t = 0, it will be a particular
2-14
case of referential description which is called Lagrangian. If the reference
configuration is taken at a variable time t, then we have a relative description, which
is referential in nature. In a general relative description we describe the past and
future relative to the present. Hence, we may be marching backward or forwards with
respect to the current, or present, configuration. In updated Lagrangian formulation,
we describe the future with respect to the present, i.e. we march backwards, which is
a special case of the relative description. In updated Lagrangian or relative
formulation, the independent variables are x and τ, where x is the position occupied
by the material point X at time t. This indicates that x is independent of the variable
time τ. A feature which justifies the referential nature of the relative description and
its distinction from spatial or Eulerian description in which the two variables x and t
used to describe the motion are dependent, as x = x (X, tT). For the same reason,
material derivatives and other relations which are obvious and easy to derive in
material or referential description seem to be more difficult to handle in spatial
description. However, spatial or Eulerian description seems to be perfectly suited to
the study of fluids, where we may observe the condition of a flow in a fixed region of
space. In such study, it is not easy to determine the paths of the particles, and at any
time t we may not know what was the reference position X occupied at time tT = 0 by
the fluid particle now at x. In this case it is convenient to describe variables as
functions of the position x and the variable time t.
2.4.2. Arbitrary Lagrangian-Eulerian (ALE)
As motioned above, the Lagrangian formulation is easy to implement, efficient and
fast converging, especially when the strains are relatively small. However,
difficulties arise when this approach is used for problems involving large
deformation, nonlinear boundary conditions that change in the course of deformation,
and when element distortion and mesh entanglement are critical factors in the
analysis.
In an attempt to overcome the limitations of the pure Lagrangian and Eulerian
approaches, a more flexible approach called Arbitrary Lagrangian-Eulerian (ALE)
has been developed. Generally, ALE is a finite element formulation in which the
2-15
reference system (computational mesh) is not a priori fixed in space or attached to
the body, but an arbitrary computational reference system. In other words, in an ALE
formulation, the finite element mesh need not adhere to the material or be fixed space
but may be moved arbitrarily relative to the material. A proper ALE formulation
should reduce to Lagrangian formulation if we choose to use the same motion for the
computational and materials meshes. On the other hand, if we choose to fix the
computational mesh, an ALE formulation should reduce to Eulerian formulation.
Combining the merits of both Lagrangian and Eulerian formulations, ALE easily
handles mesh distortion and entanglement. More importantly, if the nodes on the
current interface of tool-workpiece are specified as Eulerian points, it may eliminate
load fluctuations, may describe precisely any contact boundary conditions and make
boundary condition updating no longer necessary after each incremental step. Thus,
it is evident that ALE method is ideally more suited for solving a variety of complex
problems in solid mechanics, especially those dealing with finite strain deformation
and fracture.
The concept of ALE was first proposed in fluid mechanics. Later, the ALE method
was introduced into the finite element method by Belytschko and Kennedy (1978) in
response to the need for non-linear simulation techniques for nuclear safety analysis.
In soil mechanics, ALE was first introduced by Haber (1984). Since then, The
approach was later extended to history-dependent materials and in particular metal-
forming applications by Liu et al. (1988), Huetink et al. (1990), Ghosh and Kikuchi
(1991), Benson (1989), and Gadala and Wang (1998), Gadala et al. (2002), Gadala
and Wang (2000), Wang and Gadala (1997), among others.
In ALE theory, there are usually two categories. In one category, an operator-split
approach is used in which each step of the analysis is decoupled into a Lagrangian
step and a convection step. In the former step, the solution to Lagrangian motion is
obtained, and in the latter step, this solution is mapped to the desired mesh to
complete the ALE step (Benson 1989; Huetink et al. 1990). In the second category,
the fully coupled equations involving both material and mesh velocities are solved
(Gadala et al. 2002; Gadala and Wang 1998; Gadala and Wang 2000; Ghosh and
Kikuchi 1991; Liu et al. 1988; Wang and Gadala 1997). Both of the methods have
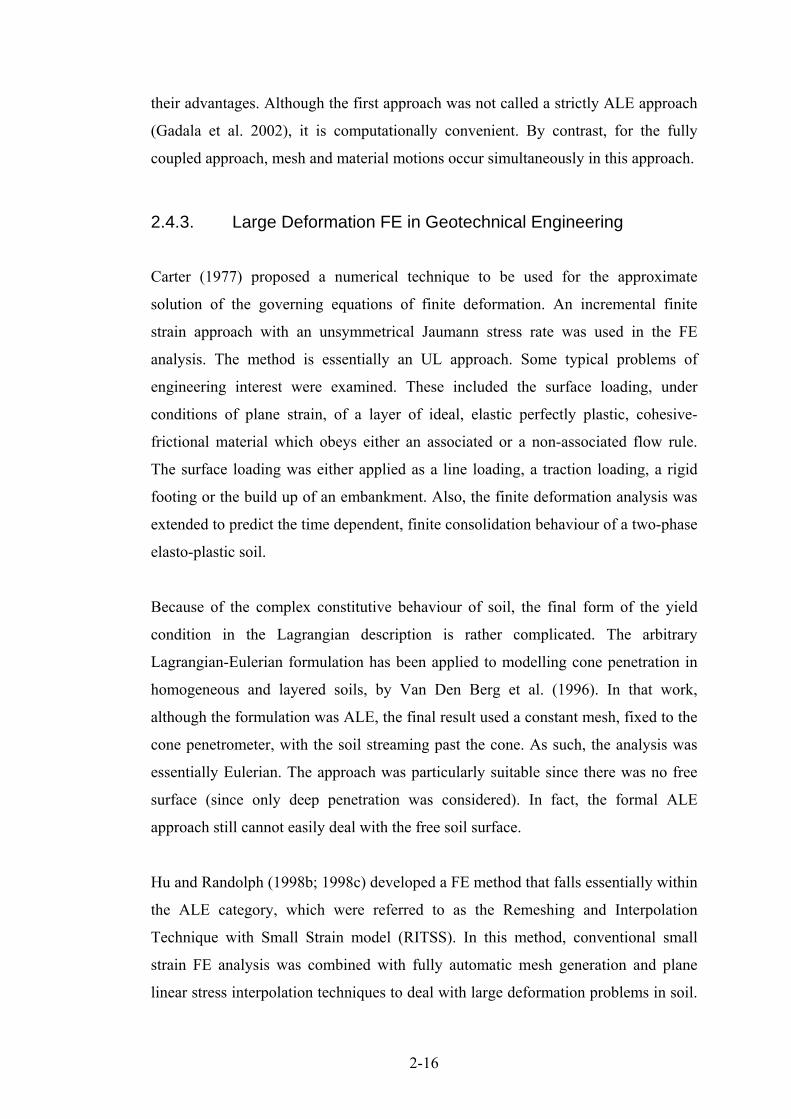
2-16
their advantages. Although the first approach was not called a strictly ALE approach
(Gadala et al. 2002), it is computationally convenient. By contrast, for the fully
coupled approach, mesh and material motions occur simultaneously in this approach.
2.4.3. Large Deformation FE in Geotechnical Engineering
Carter (1977) proposed a numerical technique to be used for the approximate
solution of the governing equations of finite deformation. An incremental finite
strain approach with an unsymmetrical Jaumann stress rate was used in the FE
analysis. The method is essentially an UL approach. Some typical problems of
engineering interest were examined. These included the surface loading, under
conditions of plane strain, of a layer of ideal, elastic perfectly plastic, cohesive-
frictional material which obeys either an associated or a non-associated flow rule.
The surface loading was either applied as a line loading, a traction loading, a rigid
footing or the build up of an embankment. Also, the finite deformation analysis was
extended to predict the time dependent, finite consolidation behaviour of a two-phase
elasto-plastic soil.
Because of the complex constitutive behaviour of soil, the final form of the yield
condition in the Lagrangian description is rather complicated. The arbitrary
Lagrangian-Eulerian formulation has been applied to modelling cone penetration in
homogeneous and layered soils, by Van Den Berg et al. (1996). In that work,
although the formulation was ALE, the final result used a constant mesh, fixed to the
cone penetrometer, with the soil streaming past the cone. As such, the analysis was
essentially Eulerian. The approach was particularly suitable since there was no free
surface (since only deep penetration was considered). In fact, the formal ALE
approach still cannot easily deal with the free soil surface.
Hu and Randolph (1998b; 1998c) developed a FE method that falls essentially within
the ALE category, which were referred to as the Remeshing and Interpolation
Technique with Small Strain model (RITSS). In this method, conventional small
strain FE analysis was combined with fully automatic mesh generation and plane
linear stress interpolation techniques to deal with large deformation problems in soil.

2-17
Remeshing and interpolation of historical variables can be carried out after a
specified number of steps. After large deformation occurs and the soil boundary
becomes irregular, the regenerated mesh can fit the boundary of arbitrary shape very
well, and the excessive mesh distortion is successfully prevented. As for ordinary FE
analysis, the accuracy of the solution increased with the number of increments. Thus
fast mesh generation and interpolation methods are essential for this method.
RITSS has been successfully adopted in analysing the penetration problems of a strip
footing and jack-up spudcan foundations into a non-homogeneous soil, as well as
pipe penetration in non-homogeneous soil (Hu and Randolph 1995; 1998a; 1998d)
and has demonstrated powerful ability in analysing large deformation problems in
geomechanics. In recent years, Lu et al. (2004), Hossain et al. (2005), Zhou and
Randolph (2006) have used the RITSS method for cone penetration, spudcan
penetration and suction caisson installation respectively.
Nazem et al. (2006) used an ALE method based on the operator-split technique to
study a number of classic geotechnical problems. The ALE method included the
mesh refinement and the remapping of state variables. A proposed mesh refinement
scheme was used to avoid the mesh generation algorithm, which does not change the
global degrees of freedom or the connectivity of elements, and hence can be easily
implemented in existing finite element codes. A consistency condition was enforced
by projecting the stress states back to the yield surface according to a drift correction
scheme which ensures that no strain is caused during the drift correction. Global
equilibrium was achieved by additional Newton iterations after the remapping of
stresses.
Susila and Hryciw (2003) used an auto-adaptive remeshing technique to study cone
penetration analysis in sands. A commercial finite element software ABAQUS was
utilized to employ the technique. A “weighted area smoothing” technique was used
to relocate coordinates of nodes during remeshing.
Walker and Yu (2006) used the explicit dynamics procedure and the adaptive
meshing tool in the commercial finite element software ABAQUS to study cone
penetration in clay. The adaptive meshing technique in ABAQUS combines the

2-18
features of a pure Lagrangian analysis and an Eulerian analysis. Therefore, it was
referred to be an ALE. A smoother mesh was created by sweeping iteratively over
the adaptive domain. During each mesh sweep, nodes in the domain were relocated
based on the positions of neighbouring nodes and element centres. A volume
smoothing technique was used to improve the quality of the mesh and one mesh
sweep was performed after each increment.
2.5. Summary and Conclusions
Researchers have endeavoured to develop plate anchor bearing capacity theories.
However, most of the theories are limited to conventional small strain analysis or 1g
small model tests, anchors are usually considered to be immediately breakaway cases,
which took away the effect of suction underneath plate anchors.
Plate anchor keying and disturbance effect are crucial for bearing capacity of
SEPLAs. The literature review for plate anchor rotation and disturbance is limited.
The determinations of loss of embedment during rotation are largely dependent on
experience rather than systematic analysis. The overall range of embedment loss
during anchor keying from past research work is disconcertingly wide, equating to a
high degree of uncertainty in the ultimate holding capacity. Efforts to establish an
engineering design code for loss of anchor performance, especially loss of
embedment, is important.
Large deformation analyses have been carried out in soil mechanics for foundation
penetration, cone penetration and suction caisson installation. Large deformation
analyses have not been extensively carried out for plate anchor analysis.
The literature review relating to plate anchor bearing capacity and large deformation
theory reveals the need for large deformation analysis for plate anchors. The
prediction or successful design guide can provide valuable information for
engineering practice of plate anchor design.

2-19
Table 2-1 Strength reduction factor (Rocker 1985)
Soil type Strength reduction factor, η
Very soft, moderately sensitive, clayey
silt, su ≈ 7 kPa, St ≈ 3
0.8-0.9
Soft, moderately consolidated, silty clay,
su ≈ 14 kPa, St ≈ 3
0.8
Pelagic clay, su ≈ 8 kPa, St ≈ 3 0.7
Foraminiferal sand-silt, 77-86%
carbonate, su ≈ 15 kPa, St ≈ 10
0.25

2-20
Figure 2-1 Definition of failure (Rowe and Davis 1982)
Figure 2-2 Conditions of cavity expansion (Yu 2000)

2-21
Figure 2-3 Cracking pattern (Davie and Sutherland 1977)
Figure 2-4 Installation sequence of propellant embedment anchor (Rocker 1985)

2-22
Figure 2-5 Plate anchor during rotation (O’Loughlin et al. 2006)
Figure 2-6 Chain element force system (Neubecker and Randolph 1995)

1-2
Management Service 2001) depicts the typical types of platforms that are used at
comparative water depths.
Deepwater mooring technology is critical in securing offshore drilling and
production vessels under various harsh conditions, with loads arising from waves,
wind, loop currents and even tsunami. Methods for anchoring these offshore facilities
have evolved from the traditional catenary mooring systems to taut-leg mooring
systems, where the angle between the mooring line and the mudline may be as high
as 40° to 50° (Ehlers et al. 2004). Figure 1-2 shows the difference of the catenary and
taut-leg mooring systems (Shimamura 2002). The taut-leg mooring systems are
introduced because lightweight mooring legs are required in the deeper and rougher
water. The initial design of a combination of wire, chain, and studless chain is
replaced by synthetic fibre (polyester) rope because of its superior strength to weight
ratio. To use synthetic fibre rope, a higher initial line tension is applied and the
restoring force is derived from the elastic spring force of the synthetic fibre rope
rather than the catenary force. As a result of taut mooring, the anchor padeye has an
imposed vertical load. This has necessitated innovative new anchor design systems
which will be discussed in the next section.
1.3. Floating Platform Anchoring Concepts
The common types of anchor systems used in deep water are suction caissons
(Andersen et al. 1993; Anderson and Jostad 1999; Chen and Randolph 2004;
Dendani and Colliat 2002; House et al. 1999; Maniar et al. 2003); drag embedded
anchors and vertically loaded anchors (VLAs) (Dahlberg et al. 2004; Dahlberg and
Strom 1999; Stewart 1992b); torpedo and deep penetration anchors (DPAs) (Lieng et
al. 2000; Medeiros 2002; O'Loughlin et al. 2004) and suction embedded plate
anchors (SEPLAs) (Dove et al. 1998; Dove et al. 2000; Wilde et al. 2001) in deep
water condition. Figure 1-3 shows the typical shapes of these anchors.
Among these anchors, VLAs and Suction Caissons are relatively proven anchor
types and SEPLAs and DPAs are two development concepts (Ehlers et al. 2004).

1-3
1.3.1. SEPLA Concept
SEPLA is generally installed by (1) inserting a vertically oriented plate anchor
attached to a suction caisson; (2) withdrawing the suction caisson; (3) rotating the
plate into an inclined position. This process is schematically illustrated in Figure 1-4
(Ehlers et al. 2004). This installation procedure allows for more accurate positioning
of the anchor, thereby avoiding many of the uncertainties associated with drag-
embedment anchors in estimating the anchor’s pullout capacity. Moreover, since the
suction caisson is used only as an insertion tool in this design, it can be reused.
Hence, SEPLA anchors can potentially achieve significant cost savings over suction
caisson anchors. The SEPLA has a very specific method of installation that allows
versatility, accuracy of placement, and excellent economy and minimisation of
installation time.
1.3.2. SEPLA Development History
In the late 1980s, a company called CSO Aker Maritime (AMC) organized and
managed a joint industry project to study the use of polymeric fibres for floating
production systems (American Bureau of Shipping (ABS) , (2001)). Taut-leg
synthetic moorings were just being considered for use with floating systems in deep
water production. The major problem then was to develop an economical anchoring
method for use in the Gulf of Mexico’s ultra deep water fields (water depth
approaching 1000 m at that time). At that time, the choices for handling vertical
loads were driven piles, drilled and grouted piles or deadweight anchors; none of
these options were economical. From 1992 to 1994, Aker Maritime and five oil
companies (with the support of two anchor manufacturers) ran a joint industry
project investigating anchors suitable for TLM (Taut-Leg Mooring) use. The project
had two important results: development of vertically loaded anchors (VLA) and the
conclusion that suction caissons were also TLM-viable.
Suction caissons were considered but still rather expensive for drilling operations
since the piles had to be left in the ground. After a number of suction caissons had
been installed in the early 1990s, Aker Maritime, working with Shell and Amoco,

1-4
proved the concept of a removable suction caisson in 1997. Meanwhile, Petrobras
was perfecting the use of VLAs for use in the Campos Basin. For deep water fields in
the Gulf of Mexico’s, the next problem to solve was how to apply sufficient force to
drag the VLA down to the desired depth. Normally, embedment force comes from
the bollard pull of an anchor handling boat. Even if boats could be found to apply
sufficient force, the problem was complicated by the lack of precision in locating the
anchors. But precise location can be obtained with the proven technology of the
Suction Caisson.
Aker Maritime then developed the SEPLAs to combine the advantages of the Suction
Caissons and VLAs. In this way, operators would have a plate anchor to push down
where it was needed, and they would know exactly where it was. The idea was
developed in 1997, model and scale tests completed in a clear synthetic clay known
as Laponite in 1998 (Bowles and Fulton 2001; Dove 2000; Dove and Roraas 2000;
Dove et al. 2000; Wilde et al. 2001). The embedment, follower separation and
rotation under load operations were clearly observed. Figure 1-5 shows the SEPLAs
during transportation.
A full-scale field test was completed in 1999, where a single SEPLA held one leg of
the semi-submersible Ocean Victory in 1,310 m (4,300 ft) of water (Dove et al. 2000;
Fulton et al. 2002; Wilde et al. 2001). The SEPLA had a 2.4 m × 6.1 m (8 ft × 20 ft)
fluke and a 0.9 m × 6.1 m (3 ft × 20 ft) keying flap, and was installed to an initial
penetration of 25.9 m (85 ft). The success of the test brought SEPLA certification by
the US Minerals Management Service (MMS) and the ABS. AMC initiated a series
of onshore 1/5th quasi-static pullout tests of SEPLA anchors in 2001 in order to
enhance the performance database for plate anchors in general.
The commercial installations of SEPLA consist exclusively of mooring for MODUs
(Mobile Offshore Drilling Unit). In October 2000, two of the eight conventional
mooring legs on the MODU Homer Ferrington in 1400 m (4600 ft) water depth were
replaced with preset taut-leg moorings using SEPLA anchors with 2.4 m × 6.1 m (8
ft by 20 ft) flukes embedded to 19.2 m (63 ft) and 21.3 m (70 ft). In June 2001, the
first complete preset eight taut-leg mooring system for a MODU in the Gulf of
Mexico using polyester mooring lines and SEPLAs was performed in water depths of

1-5
1860m (6090 ft) to 1950 m (6380 ft). In August 2001, eight hollow fluke SEPLAs
were installed as anchor points for the Ocean Confidence’s taut-leg polyester
mooring system. In addition, four solid fluke SEPLAs were installed as part of the
secondary mooring system for the dynamically positioned Deep Water Horizon
MODU.
From July to Sepetember 2003, 19 SEPLA anchors were installed in the Kizomba A
and Xikomba fields, offshore Angola, as anchor points for MODUs being used for
long term drilling. The anchors were designed as a permanent system.
In 2006, 12 SEPLAs were permanently installed as foundation for the ATP Rowan
Midland FPU mooring system in Gulf of Mexico (Paganie 2006). The anchors were
permanently installed to water depth of 910 m (3000 ft).
The detailed development of SEPLAs can be found in Table 1-1 (Intermoor 2007).
1.4. Research Needs
Although there are some industry uses of the SEPLAs in offshore fields, SEPLAs are
still a new type of foundation for offshore engineering in deep water exploration. The
potential for cost savings relative to other types of foundation has led to a need for
improved understanding of its behaviour.
The uplift capacity of anchors in soil has been a subject of study for the last three
decades, with the majority of past research being experimentally based. Systematic
bearing capacity studies of plate anchors have not been conducted. The experimental
studies included ‘venting’ the anchor base, so as to eliminate any suction. Most
numerical studies can be found relating to anchor behaviour in purely cohesive soil
and also falls into the “immediate breakaway” category, where it is assumed that the
soil/anchor interface cannot sustain tension. However, it has long been recognised
that soil suction can have a significant effect on the ultimate collapse load of plate
anchors (Vesic 1971). Although the actual magnitude of any adhesion or suction

1-6
force is highly uncertain, assuming there is no soil suction will result in conservative
estimation of the actual pullout resistance.
The pullout behaviour of plate anchors is usually treated as a small strain problem in
numerical analysis, thus, there is no geometrical nonlinearity considered. However,
the development of pullout capacity of an anchor could take more than 1 time of the
anchor width (Rowe and Davis 1982). In recent years, there has been a rapid
development of advanced numerical method in geomechanics due to the availability
of high-speed digital computers. Significant effort has been spent on introducing the
important concepts of finite strain and large deformation, i.e., geometrical
nonlinearity. Implementing such large deformation analysis will be highly valuable
to study the pullout behaviour of plate anchors.
Anchors are frequently placed at orientations somewhere between horizontal and
vertical, depending on the application and design requirements, particularly offshore.
For the SEPLAs used in offshore applications, the effect of inclination on the pullout
capacity is important since after installation the anchor will be positioned
perpendicular to the anchor pullout direction.
The anchor pullout and rotation process, before the full capacity of anchor is reached,
is commonly referred to as “keying”. During keying, the anchor moves upwards, thus
embedment depth will reduce as the plate rotates during pullout. As offshore clay
deposits are typically characterised by an increasing strength profile with depth, any
loss in embedment will correspond to a non-recoverable loss in potential anchor
capacity. However, the study on plate anchor keying tests showed a wide range in
loss of embedment by field tests and centrifuge tests (Gaudin et al. 2006; O'Loughlin
et al. 2006; Rocker 1985; Wilde et al. 2001). The loss of the embedment during
anchor keying is still based on experience and there are no conclusive solutions.
The effect of soil disturbance due to suction caisson installation on plate anchor
capacity was investigated through in situ tests (Wilde et al. 2001). Their results
showed that due to soil disturbance the anchor capacity was reduced 20 % in soil
with sensitivity less than 2 and 30 % in soil with sensitivity between 5 and 2. No
other studies have been performed for the installation effect of the suction caissons.

1-7
Successful study of the suction installation effect can give better understanding of the
anchors in the field.
1.5. Aims of Current Research
Plate anchors have been increasingly used in deeper water development fields. The
present research has investigated the pullout behaviour of SEPLAs in uniform and
NC (normally consolidated) clay, which is a potential offshore foundation type for
deep-water situations. The objectives were to study the behaviour of SEPLAs during
keying and continuous pullout, and:
• To determine pullout capacities of model plate anchors using numerical
analysis and experimental techniques with different soil profiles.
• To identify separation failure mechanisms between the soil underneath plate
anchors and anchor base when full soil attachment/full suction at plate base
cannot be guaranteed, through laboratory tests and numerical simulations.
• To develop a two-dimensional load control large deformation method to
simulate continuous keying of anchors with different inclinations of loading
and assess the keying of anchors by using a transparent “soil” in centrifuge.
• To quantify the influence of soil disturbance during suction caisson
installation on plate anchor capacity by numerical analysis and centrifuge
tests.
• To develop methods for safe and economic design of SEPLAs in various soil
conditions.
1.6. Thesis Structure

1-8
The thesis consists of eight chapters including this introduction. A brief summary of
each chapter is given below:
Chapter 2: The historical review of plate anchor theory is given in both
experimental and numerical studies. The basic theories of quantifying vertical and
inclined pullout bearing capacity are discussed in detail. Experimental works in the
relevant area are presented. A review of plate anchors history in offshore industry is
summarised for anchor keying, loss of embedment during keying and installation
effect followed by a review of large deformation formulations and the application of
large deformation analysis in soil mechanics.
Chapter 3: Details of the techniques used in this research are described. The first
part was devoted to the numerical modelling concept and the large deformation
analysis. The physical modelling equipment and experimental details relevant to the
testing program are summarised for the second part. The second part also describes
the soil properties of kaolin clay and transparent “soil” used in this research.
Chapter 4: Conventional small strain analysis and large deformation analysis by
using RITSS (Remeshing and Interpolation Technique with Small Strain) for
vertically pulled out strip or circular plate anchors are examined. The results of small
strain analysis are compared with existing numerical and experimental results. The
results from successful large deformation FE analyses are used to predict the
separation depth which can be employed as a new design method to predict the
anchor pullout capacity. Three dimensional small strain analyses were carried out for
square and rectangular plate anchors to assess three dimensional effects.
Chapter 5: Numerical study and 1 g experimental work for inclined pullout plate
anchors in uniform and NC clay are discussed. The first part summarises the
numerical analysis results for inclined pullout strip plate anchors with distinction of
full attached and vented plate anchors in uniform clay. The second part describes the
results from the 1g laboratory test. The third part summarises the effect of the
normally consolidated (NC) clay profile.

1-9
Chapter 6: Large deformation analyses using RITSS were carried out to simulate
the continuous rotation of plate anchors. Plate anchors were pulled out vertically or
with inclined pullout angle. The results from successful numerical simulation are
compared with centrifuge results from other researchers and the transparent “soil”
test conducted in the centrifuge.
Chapter 7: SEPLA tests were performed by using the apparatus, strategies and
procedures described in Chapter 3 in kaolin clay and transparent “soil”. Numerical
analysis was conducted by simulating a disturbed zone due to suction installation.
The disturbance effect is discussed in detail.
Chapter 8: Conclusion and recommendations for further work on this topic.

1-10
Table 1-1 Development of SEPLAs and current use (InterMoor 2007)
Date Client Project Application Comments 2006 ExxonMobil Kizomba-C
Permanent MODU Presets
10 anchors for MODU
10 SEPLA anchors have been ordered and will be permanently installed in 4th quarter 2006.
2006 Chevron Jack Well Test 8 anchors for MODU
Polyester/SEPLA mooring provided under lease arrangement.
2006 ATP Gomez 12 anchors for Production Unit
First permanent SEPLA. 12 SEPLA anchors permanently installed as foundation for the ATP Rowan Midland FPU mooring system.
2003 ExxonMobil Kizomba-A / Xikomba Permanent MODU Presets
18 anchors for MODU
18 SEPLA anchors permanently installed for various drill centres. First SEPLAs used outside the GoM.
2001 BP Deepwater Horizon SEPLA Preset
4 anchors as backup to DP
Four-leg SEPLA system installed as backup to DP system.
2001 BP Ocean Confidence Polyester/SEPLA Preset
Full anchor spread for MODU
Designed, supplied and installed a full 8-point Polyester/SEPLA mooring system for the Ocean Confidence.
2001 Internal R&D
1/5th scale tests Land Tests Testing program to collect more holding capacity data.
2000 Dominion Oil
Homer Ferrington at MC-595
2 Anchors for MODU
Two SEPLAs used to shorten two legs on the Homer Ferrington to avoid munitions dump.
1999 JIP Ocean Victory Polyester/SEPLA JIP
Anchor for MODU
First SEPLA used by MODU (Ocean Victory). First use of polyester rope for a MODU in the Gulf of Mexico.
1998 Tatham Offshore
Supply Boat Bow Mooring System
Supply Boat Mooring Anchor
First commercial installation of a SEPLA.
1998 Internal R&D
Initial Field Tests Offshore Tests
A series of offshore tests were conducted to demonstrate the installation and holding capacity of SEPLAs.

1-11
Figure 1-1 Deepwater Development Systems in the Gulf of Mexico Basic Options (Gulf of Mexico Region Minerals Management Service, 2001)

1-12
Figure 1-2 The catenary and taut-leg mooring systems (Shimamura, 2002)
(a) Suction Caisson (Gulf of Mexico Region Minerals Management Service, 2001)
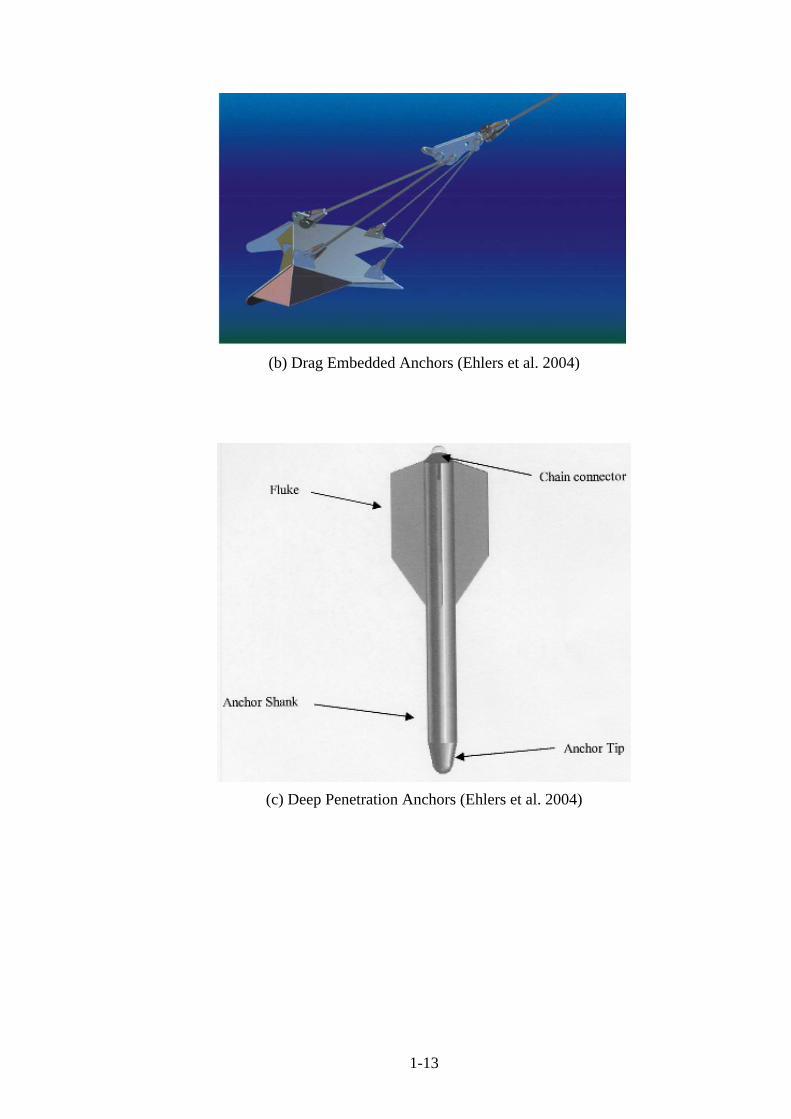
1-13
(b) Drag Embedded Anchors (Ehlers et al. 2004)
(c) Deep Penetration Anchors (Ehlers et al. 2004)
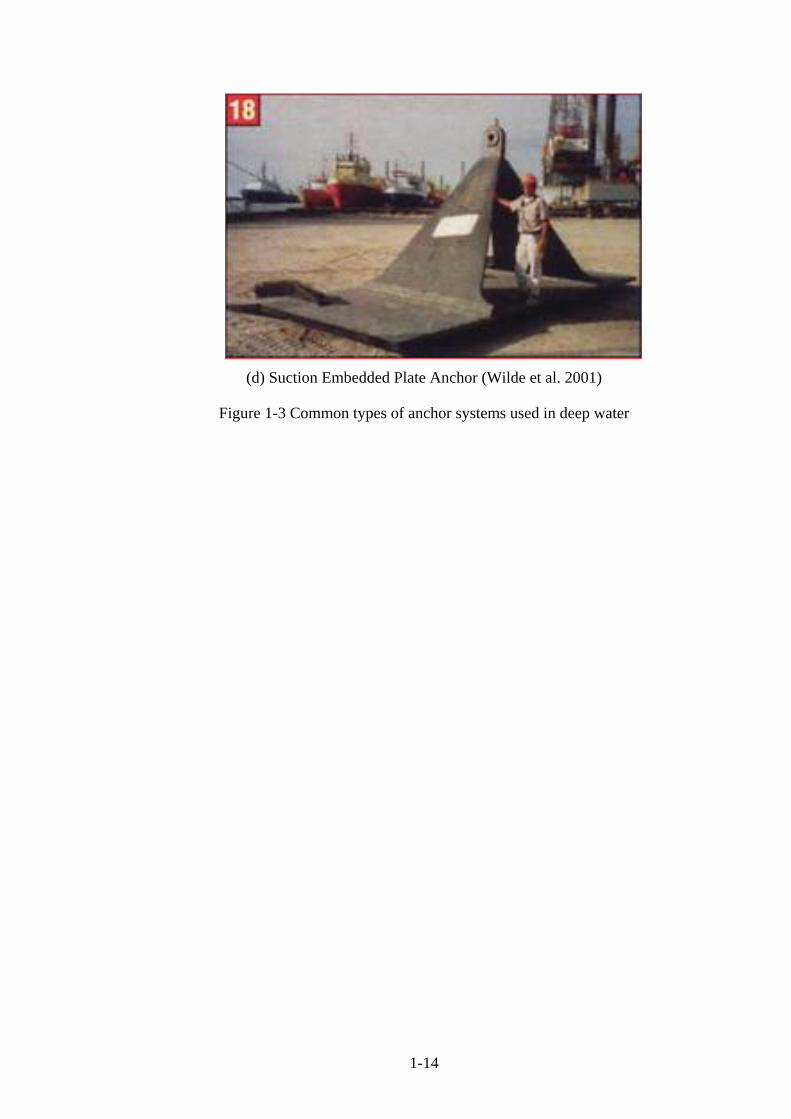
1-14
(d) Suction Embedded Plate Anchor (Wilde et al. 2001)
Figure 1-3 Common types of anchor systems used in deep water

1-15
Figure 1-4 Installation of a SEPLA (Ehlers et al. 2004)

1-16
Figure 1-5 AMC SEPLAs during transportation (Bowles 2000)

3-1
CHAPTER 3. RESEARCH METHODS
3.1. Introduction
The main focus of this research is to reveal bearing capacity and loss of embedment
during keying for plate anchors. Therefore, numerical modelling, using AFENA
(Carter and Balaam 1990) and ABAQUS (2005) was undertaken in this research.
This chapter discusses details of the numerical modelling concepts.
Physical testing, using 1g test, beam and drum centrifuge at the University of
Western Australia, are the means to investigate plate anchor capacity, SEPLA
installation effect and anchor keying behaviour. In centrifuge tests, kaolin clay and
transparent “soil” samples were used as media to study the plate anchor’s behaviour.
This chapter discusses details of centrifuge modelling as well as the transparent
“soil”.
3.2. Numerical Modelling Concept
3.2.1. Finite Element Analysis
Some of the most common methods of analysis used in geotechnical engineering to
solve boundary value problems are listed in Table 3-1. Included are numerical
methods as well as some more traditional techniques that may be amenable to hand
calculations. The numerical methods may be classified as follows: the finite
difference method (FDM), the finite element method (FEM), the boundary element

3-2
method (BEM) and the discrete element method (DEM). Potts and Zdravković (2001)
and Carter et al. (2000) discussed the advantages and disadvantages of various
numerical methods used in geotechnical engineering.
The finite element method is still the most widely used and probably the most
versatile method for analysing boundary value problems in geotechnical engineering
since its first application in the 1960s for the analysis of embankments.
For a particular plate anchor analysis, which requires continuous pullout and keying,
large deformation FE analysis is essential for providing more accurate and reliable
results. AFENA (Carter and Balaam 1990) with RITSS modification for large
deformation was used for this research for large deformation pullout and keying
analysis.
3.2.2. Two-Dimensional or Three-Dimensional Analysis?
In the field operation, plate anchor foundations are always square or rectangular.
Three-dimensional numerical analysis is essential to assess the shape factor by
simulating in situ stresses and strains.
However three-dimensional simulation takes a long time, especially for large
deformation analysis. Thus two-dimensional analysis is thus chosen for large
deformation analysis. In order to look at the three - dimensional effect, small strain
FE analyses using ABAQUS (HKS 2005) in three dimensions were conducted to
assess three-dimensional effect.
3.2.3. Plate Anchor Modelling
When anchors are embedded in clay, suction force beneath plate anchors may play an
important role in the total pullout analysis. For most numerical analysis and
experimental studies previously performed on anchors, they were usually considered
as “immediately breakway” or “vented” case, therefore, no suction force was allowed
at the base of the anchor. On the other hand, for the anchors in situ, due to the initial

3-3
stress condition and pore pressure change during pullout, the suction force was a
large part of the total pullout force and it would be conservative for anchor design if
suction force is not allowed.
In current study, both fully attached (A) and vented (V) conditions on the back face
of the anchor were considered, with nodal joint elements (Herrmann 1978) used on
the soil-anchor interface. The fully attached case, where tension was permitted across
the nodal joint, simulates the case where a combination of overburden stress and
suction maintains full contact between soil and anchor. In the vented case, the nodal
joint elements allowed separation immediately after the normal stress reduced to zero.
3.3. H-Adaptive RITSS Method
This study used the RITSS method, which was proposed by Hu and Randolph (1998b;
1998d) for applications in geotechnical engineering with modifications for plate
anchor analysis. RITSS method falls into the category of the remeshing methods
proposed by Cheng and Kikuchi (1986). This technique has been implemented into a
FE package, AFENA (Carter and Balaam 1990). RITSS includes a fully automatic
mesh generation, H-Adaptive mesh refinement, finite element solution and transfer
of field quantities etc.
3.3.1. Mesh Generation
A powerful mesh generation method has to be fully automatic, while the generated
mesh is smooth and the density of mesh is easily to control. The mesh generation
method adopted here (Johnston and Sullivan 1992) falls into the nodal connection
class (Ho-Le 1988; Lo 2002; Owen and ANSYS 1998). Mesh generation techniques,
which make this method very powerful, are described below.
The first step generates a mesh representing the boundary geometry of the model. In
the next step the interior region of the model is processed to produce an array of
appropriately spaced nodes. This step is further broken down into two distinct

3-4
processes: normal offsetting of the nodes on the current boundary (at the edge of the
vacant region), and processing the resulting new points to determine new nodal
locations. These processes are repeated until the domain has been filled, with an
appropriate convergence criterion satisfied. Finally a Delaunay triangulation (Sloan
1993) make appropriate element connections to form a triangular finite element mesh.
Multiple-connected boundaries of objects, like holes, are solved easily by normal
offsetting because operates on a local level. Interior holes are handled as an
implementation of the multiple section row concepts. The boundary of each hole is
treated as an additional section of the row formed by the exterior boundary. Each
section represents a closed loop of points and is processed separately through the
offsetting procedure. Figure 3-1 shows the offsetting procedure for a case with both
interior and exterior boundaries. Since the nodes around the hole point outward from
the hole into the region to be meshed, the row expands as a convex region until a
collision with the inward moving exterior section is detected. A collision between a
section associated with a hole and another section is resolved by collapsing an
overlap and joining the sections at the collision site. Once joined, the combined row
sections are processed as a single section. Figure 3-2 shows the collision of the
sections of the interior boundary and exterior boundary.
Multiple material regions are implemented by using separate row sections which
share the same boundary. Nodes on the boundaries are defined once and reference
points for mesh generation are created separately for each section.
3.3.2. Mesh Smoothing
A variety of mesh improvement techniques has been developed to improve the
quality of meshes created by automatic techniques. Some of the existing techniques
for improving the quality of an existing FE mesh include: (1): topological and
quality-based operators – including node insertion or local refinement techniques;
edge/face swaps; and node removal or element deletion. (2): Smoothing – modifying
node placement so as to improve the elements shape without modifying the mesh
connectivity.

3-5
Mesh smoothing, which is used in this study, includes Laplacian smoothing, smart
Laplacian smoothing and optimization-based smoothing. Laplacian smoothing is by
far the most common smoothing technique. Laplacian smoothing, in its simplest
form, consists of recursively placing each node at the average of the nodes connected
to it. This technique generally works quite well for meshes in convex regions.
However, it can result in distorted or even inverted elements near concavities in the
model. Figure 3-3 and Figure 3-4 show the crash of the Laplacian smoothing. Smart
Laplacian smoothing is a modified Laplacian smoothing technique, which simply
deletes a crashed mesh by the Laplacian smoothing.
A newer form of smoothing that is receiving more attention lately, is optimization-
based smoothing. Instead of moving nodes based on a heuristic algorithm, as is done
in Laplacian smoothing, the nodes are moved so as to minimize a given distortion
metric. Some of the developments in this area include works by Canann et al. (1993),
Freitag (1997) and Parthasarathy and Kodiyalam (1991).
Freitag’s method was chosen in the current study due to the ability to combine the
advantages of the Laplacian smoothing and optimization-based smoothing methods.
In this approach, the smart Laplacian smoother was used to adjust every grid point
and was followed by the optimization-based algorithm only in the poorest-quality
elements. This technique was only twice as computationally expensive as the smart
Laplacian smoother used alone and achieved meshes comparable in quality to those
obtained when the optimization-based smoother was used for all grid points. Figure
3-5 and Figure 3-6 show the mesh before mesh smoothing and after smooth for a
particular plate anchor analysis.
3.3.3. Mesh Refinement To minimise discretization error in the FE method, the element size needs to be
sufficiently small. The meshes should be designed such that the elements are
generally concentrated in the most highly stressed zones. H-adaptive mesh
generation was used to adjust the element size according to the discretization error,
so that the element size need only be reduced in a high error region.

3-6
For non-linear elasto-plastic analysis, Hu and Randolph (1998b) proposed an SPR-
strain error estimator given by,
( ) ( )2/1
***i /e
i⎥⎥⎦
⎤
⎢⎢⎣
⎡Ω
⎪⎭
⎪⎬⎫
⎪⎩
⎪⎨⎧
Ω−−= ∫Ω
ihTh dεεεε (3-1)
in which Ωi is the area of element i in two dimensional analysis (or volume for three
dimensional analysis), εh are the strains from the FE solution, ε* are the strains
recovered by SPR (Superconvergent Patch Recovery, (Zienkiewicz and Zhu 1992)).
The non-dimensional characteristic of this error estimator makes it easy to use.
When the discretization error is estimated using Equation 3-1, the initial coarse mesh
can be refined. The detailed procedure on mesh refinement and minimum element
size selection has been published by Hu and Randolph (1998d).
3.3.4. H-Adaptive RITSS Method In the RITSS method, a large deformation problem was solved using incremental
small strain analyses by frequent remeshing and interpolation of stress field and soil
properties over the analysed domain. An h-adaptive mesh generation was used to
create an initial optimal mesh and for remeshing after each updated domain boundary.
To simulate large deformations, small strain analysis needs to be continued on a
newly generated mesh. As such, field quantities must be transferred from the old
mesh to the new mesh by interpolation. These quantities include stresses, also
material properties depending on the constitutive model applied. (Hu and Randolph
1998b; Hu and Randolph 1998d) discussed five approaches for the advection of the
field variables and concluded that the Modified Unique Element Method (MUEM)
was most suitable. For all large deformation analysis presented in this dissertation,
All variables on gauss points was interpolated from the old Gauss points by MUEM.
The procedure of the MUEM is explained briefly by the following steps:

3-7
(a) Update the coordinates of the old mesh (according to displacements over the
previous solution steps) to form a reference mesh;
(b) Find which element of the reference mesh contains the particular Gauss point of
the new mesh;
(c) Interpolate (or extrapolate) the stress values at the new Gauss point using the
three Gauss points in the reference element.
3.4. Experimental Concept
3.4.1. Centrifuge or 1 g?
A 1 g test at standard earth gravity, more often called conventional model test, is
easier to perform and less costly than centrifuge testing. For undrained geotechnical
problems where the loads depend primarily on cohesive soil strength, and not on
gravitational forces, reasonable modelling accuracy can be achieved without the need
for centrifuge testing. However, with those problems where the loads depend on
gravitational forces, 1 g test could cause problems since the gravitational field of soil
is not modelled correctly under standard gravity.
In order to simulate a field situation and real strength ratio in a laboratory, it is
crucial to replicate properly the in situ soil stress field. And when a cavitation is
created during plate anchor pullout, due to the small scale of model plate anchor, the
overburden stress level is much lower than the one in the field situation. Thus, soil
back flow either never occurs or occurs at a lower embedment depth. In order to
model the field situation, this can be achieved through careful centrifuge modelling
of the field stress levels, on which the behaviour of soils is particularly dependent.
Hence an actual overburden pressure is achieved and subsequently soil failure
mechanisms changing with depth can be modelled properly. Centrifuge model testing
therefore allows the use of small model structures to simulate the dimensions of a

3-8
full size prototype, whilst maintaining field stress levels. In current study, both 1g
and centrifuge test were used to study plate anchor bearing capacity and keying
behaviour.
3.4.2. Centrifuge Modelling
The basic principles of centrifuge modelling for geotechnical purposes have been
described in detail by Schofield (1980) and Taylor (1995).
The self-weight stresses in the model are enhanced by the centrifugal acceleration, in
order to model in situ stresses. All linear dimensions of the model are scaled down N
times, and a centrifugal acceleration of N times earth’s gravity (g) is applied during
the test, where N is called the scaling ratio. Therefore, the vertical stress, σv’, at
model depth, hm, can be obtained by:
mv hgN ⋅⋅⋅= ρσ ' (3-2)
where ρ is the density of the model object
In order to correctly replicate a prototype response in a small-scale model it is
necessary to develop scaling relationships, which link the model behaviour to that of
the prototype. In order to derive these relationships, various physical factors that
determine the prototype response must be identified and scaled accordingly in the
model. Scaling laws can be derived by making use of dimensional analysis or from a
consideration of the governing differential equations. However, the basic scaling law
is derived from the need that ensures stress similarity between the model and the
corresponding prototype. Schofield (1980) and Taylor (1995) discussed in detail the
modelling laws that apply to centrifuge testing. Table 3-2 listed the modelling laws
in details.
In physical modelling studies, it is seldom possible to replicate precisely all details of
the prototype and some approximations have to be made. It is important to recognise
that model studies are not perfect and to inquire into the nature of any shortcomings,

3-9
like particle size effects and rotational acceleration field, and to evaluate their
magnitude.
3.4.3. Image Analysis
Digital analyses of photos from centrifuge test were performed by careful
examination and Particle Image Velocimetry (PIV) analysis.
White et al. (2003) and White et al. (2005) developed a new system for precise
measurement of soil movement around a foundation in physical testing, which is
called Particle Image Velocimetry (PIV).
PIV is a velocity-measuring procedure originally developed in the field of
experimental fluid mechanics (Adrian 1991). White et al. (2003) and White et al.
(2005) developed a technique, which uses the principles of PIV to gather
displacement data from sequences of digital images captured during geotechnical
model tests. Concise details are presented in White et al. (2003). The principles of
PIV analysis are summarised in Figure 3-7.
To perform PIV analysis in transparent soil test, coloured flock powder was used to
track the movement of transparent soil .Detail of the transparent soil set up will be
discussed in Chapter 6.
3.5. Test Equipment and Apparatus
All testings was conducted at the University of Western Australia. The Centre for
Offshore Foundations Systems (COFS), located at the University of Western
Australia, also supplied test equipment and apparatus to undertake the laboratory
testings.
3.5.1. Plate Anchor Model
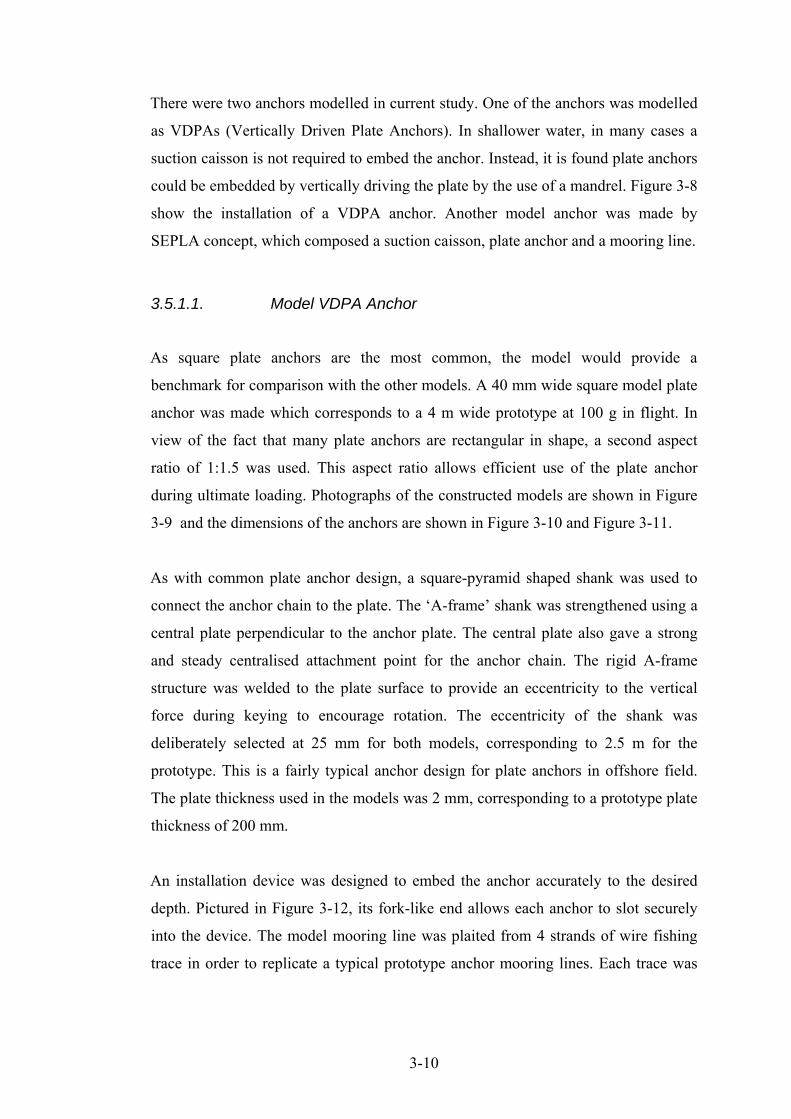
3-10
There were two anchors modelled in current study. One of the anchors was modelled
as VDPAs (Vertically Driven Plate Anchors). In shallower water, in many cases a
suction caisson is not required to embed the anchor. Instead, it is found plate anchors
could be embedded by vertically driving the plate by the use of a mandrel. Figure 3-8
show the installation of a VDPA anchor. Another model anchor was made by
SEPLA concept, which composed a suction caisson, plate anchor and a mooring line.
3.5.1.1. Model VDPA Anchor
As square plate anchors are the most common, the model would provide a
benchmark for comparison with the other models. A 40 mm wide square model plate
anchor was made which corresponds to a 4 m wide prototype at 100 g in flight. In
view of the fact that many plate anchors are rectangular in shape, a second aspect
ratio of 1:1.5 was used. This aspect ratio allows efficient use of the plate anchor
during ultimate loading. Photographs of the constructed models are shown in Figure
3-9 and the dimensions of the anchors are shown in Figure 3-10 and Figure 3-11.
As with common plate anchor design, a square-pyramid shaped shank was used to
connect the anchor chain to the plate. The ‘A-frame’ shank was strengthened using a
central plate perpendicular to the anchor plate. The central plate also gave a strong
and steady centralised attachment point for the anchor chain. The rigid A-frame
structure was welded to the plate surface to provide an eccentricity to the vertical
force during keying to encourage rotation. The eccentricity of the shank was
deliberately selected at 25 mm for both models, corresponding to 2.5 m for the
prototype. This is a fairly typical anchor design for plate anchors in offshore field.
The plate thickness used in the models was 2 mm, corresponding to a prototype plate
thickness of 200 mm.
An installation device was designed to embed the anchor accurately to the desired
depth. Pictured in Figure 3-12, its fork-like end allows each anchor to slot securely
into the device. The model mooring line was plaited from 4 strands of wire fishing
trace in order to replicate a typical prototype anchor mooring lines. Each trace was

3-11
0.8 mm in diameter which, when plaited, gives a model chain with a nominal bearing
diameter of 2.2 mm (319 mm in prototype under 145g).
3.5.1.2. SEPLA Model
The model SEPLA employed for the centrifuge tests comprised a suction caisson, a
plate anchor and a mooring line (Figure 3-13), each at a reduced scale of 1:145.
A square plate anchor (Figure 3-14) was machined from stainless steel and was 35
mm wide and 1 mm thick, which is 5.075 m wide and 0.145 m thick in prototype
scale at centrifuge test acceleration of 145g. The padeye was located on the 1 mm
thick triangular anchor shank at an eccentricity of 23 mm, which equals to
eccentricity ratio e/B = 0.66. The chain was attached to the padeye of the anchor with
two load cells (one next to the padeye and another one above the clay).
The suction caisson was fabricated from aluminium and has an outside diameter of
30 mm, an internal height of 169 mm and a wall thickness of 0.4 mm, thus modelling
a prototype caisson 4.35 m in diameter, 24.5 m high with a wall thickness of 0.58 m
(Figure 3-15). At the tip of the caisson, three vertical slots, 1 mm wide, 17.5 mm
high and separated by 90° in plan were cut into the tip of the caisson to accommodate
the plate anchor. Other instrumentation for the caisson included two miniature pore
pressure transducer (PPT) in the caisson lid to measure the internal water pressure,
and another one on top of the caisson lid to monitor the external water pressure. A
pneumatic valve was also built into the caisson lid to allow venting of the caisson
during self-weight installation, and sealing of the caisson during suction installation
or (sealed) pullout.
In addition to the suction installation tests, further tests were performed where
anchors were jacked in, using a 6 mm diameter purpose-made tool (Figure 3-16). As
the soil disturbance generated using this method of installation was considered to be
negligible, these tests were conducted as benchmark tests for assessing soil
disturbance effect in suction caisson installation.

3-12
3.5.2. Fixed Beam Centrifuge Test and 1g Test
3.5.2.1. Beam Centrifuge
The fixed beam centrifuge located at the University of Western Australia is a
Acutronic Model 661 geotechnical centrifuge. A swinging platform with maximum
radius of 1.8 m enables packages up to 200 kg to be accelerated to a maximum 200 g
(the machine is rated to 40 g-tonnes). At the maximum 200 g, the rotational speed is
340rpm with a platform velocity of 230 km/hr. The fixed beam geotechnical
centrifuge at UWA is depicted in Figure 3-17. Both dual hydraulic/pneumatic slip
rings and single phase 250 Volt 10 Amp mains power slip rings were used in
this research. The dual slip ring can pass any combination of air or water through to
the centrifuge simultaneously. The air was generally used to control the open and
closed states of the valve in the suction caisson lid, and the water was used to
compensate evaporation during spinning of the centrifuge. Single slip ring and
dual slip ring were used respectively during consolidation of the sample and
while the suction caisson was being installed. The units also have the capacity to
carry DC volts via two auxiliary electrical slip rings, where the data collected
from various instrumentations on the centrifuge arm were digitised (A/D
conversion) and then transferred to the control room. In-flight motion was recorded
by the high speed digital cameras mounted on the centrifuge package. A full
description of the equipment and associated facilities can be found in Randolph et al.
(1991).
3.5.2.2. Aluminium Beam Centrifuge Strongbox
A rectangular strongbox was used for both 1g tests and beam centrifuge tests. The
box had inside dimensions of 390 mm × 650 mm × 325 mm deep, giving a total
maximum capacity of 82.4 L. The box was made of solid aluminium, weighs about
70 kg, and allows drainage through a hose in the bottom of the box. The aluminium
strongbox is also compatible with the hydraulic press, allowing over consolidation to
be achieved in the test container.

3-13
3.5.2.3. Electric Actuator
The actuator, shown in Figure 3-18 on a beam strong box, was used to perform all
the pullout operations required for the pullout tests. It was powered by a 30 V DC
servo motor, which allows movement in both the horizontal and vertical direction.
Independent control was allowed in both directions of displacement, with a
maximum stroke of 180 mm and 250 mm in the horizontal and vertical axes
respectively. Movement can be performed with a maximum of 7 kN load (in tension
or compression). The actuator was designed to carry various types of load cells,
including tension cells, compression cells, and T-bar cells. The maximum velocity of
the actuator is 3 mm/s.
3.5.2.4. T-Bar Penetrometer
The T-bar, as shown in Figure 3-19, is a penetrometer to test the undrained shear
strength of soft soils. It has been used in site investigation and in the centrifuge
testing (Stewart and Randolph 1991; Stewart and Randolph 1994; Watson 1999;
Watson et al. 1998). The advantage of the T-bar penetrometer is that it incorporates
the advantages of the cone penetrometer (which gives a continuous profile of
“strength”) and the vane shear device (which gives an “exact” or direct measure of
shear strength) and is relatively simple to construct and use. The principle of this and
other types of ‘flow- round’ penetrometers (such as ball-penetrometer and plate-
penetrometer) is to force the soil to flow around the probe in order to minimise the
relative magnitude of volume expansion of the soil due to insertion of the device. In
this way, correction of the measured penetration resistance due to the overburden
stress is minimised (Watson et al. 1998).
The model T-bar penetrometer used for this study comprises a cylindrical cross bar,
of 5 mm diameter and 20 mm long, attached at a right angle (to form a T) at the end
of a vertical shaft, which narrows to 4.5 mm diameter behind the T-bar (Figure 3-19).
When the T-bar was pushed into the soil, the penetration resistance was measured by
a highly sensitive load cell situated immediately behind the bar. The cylindrical

3-14
surface of the T-bar was sand blasted to create a relatively rough surface, while the
ends of the bar were machined smooth to minimise end effects.
The analytical value of bearing capacity factor for T-bar, NcTBar (Randolph and
Houlsby 1984; Stewart and Randolph 1991) is dependent on the surface roughness of
the cylinder, with a range of 9.14 - 9.21 for a fully smooth interface to 11.9 for a
fully rough interface (Martin and Randolph 2006). As it is impractical to expect
either a fully smooth or fully rough interface, an intermediate value of NcTbar was
recommended as 10.5 for general use (Randolph and Houlsby 1984; Watson 1999).
This value has been used in interpreting soil strength in this study.
3.5.2.5. Other Equipment
Load cells
The COFS possesses a large range of load cells for different types of tests and
different magnitude of load. The load cells, properly strain gauged, are used to
measure pullout load response.
Syringe pump
Suction installation of the caisson in this research was utilised by a motor-driven
syringe pump, which was powered by a Maxon motor combined with a planetary
gear head capable of delivering torque up to 4.5 Nm. Details of the syringe pump
were described by House (House 2002). A resolution of 500 encoder counts per
revolution was provided by a photoelectric optical digital encoder. The 50 mm
diameter aluminium piston has a maximum stroke of 190 mm, and the maximum
volume of water it can accommodate is 370 × 103 mm3. The maximum drive rate of
the motor shaft is 3 mm /s. A pore pressure transducer is located within the syringe
pump to record pressures developed in response to suction or purging of the fluid
within the stainless steel cylinder. The syringe pump was housed on the centrifuge
platform (Figure 3-20) and was designed to sustain a maximum pressure of 700 kPa.
3.5.3. Drum Centrifuge

3-15
The drum centrifuge located at the University of Western Australia (Figure 3-21) has
a 1.2 m diameter and a maximum acceleration level of 485 g. A central set of
actuators provides vertical and radial motions that, combined with a fixed load cell
allow a combined vertical, horizontal and moment motion to be applied to the
footing. By using two concentrically driven shafts connected by a Dynaserv motor, a
relative motion between the outer channel and the central tool table can be achieved
and controlled. This allows the instrument testing tools that are fixed to the actuator
to be modified or changed without affecting the acceleration level on the soil.
The outer channel of the drum centrifuge has a 300 mm vertical height and a 200 mm
radial depth. In this study pre-consolidated transparent soil specimens were placed
into the drum centrifuge strongbox (Figure 3-22) fitted in its position within the
channel. The strongbox base has a radius of 560 mm in flight.
There are two on-board data acquisition systems: one is fitted on the channel and the
other is fitted on the tool table. The basic systems can record a total of 32 direct
signals, transferred through the sliprings, on both the channel and the tool table. Each
system comprises an onboard computer with A/D conversion board and a pair of 8
channel instrumentation amplifiers. Digital signals from each onboard computer are
transferred to a single data acquisition computer in the control room via a RS232 link.
The off-board computer stores the data to the disk, and allows control over sampling
frequency and signal integration, synchronises sampling from the two systems, and
transfers the saved data to a second computer for real time graphics display. Further
technical details of the drum centrifuge can be found in Stewart et al. (1998).
3.5.3.1. Aluminium Drum Centrifuge Strongbox
A specially made strongbox was used in this study. The box consisted of a plexiglass
window at one side in order to record plate anchor and soil movement. The box has
an internal size of 258 × 80 × 160 mm. The chamber is modular, allowing either side
of each chamber to be replaced with a Perspex panel. Only special types of filter
have pore sizes small enough to prevent the loss of the silica fume during
consolidation. A ceramic disc was cut by diamond saw to make four rectangular

3-16
pieces that were fitted into an aluminium frame. And then the frame with the ceramic
filter was screwed onto a lower drainage plate with the honeycomb of 3 mm holes
drilled into it to be used as the drainage base.
3.5.3.2. Camera
Cannon PowerShot S50 digital camera with a 5 Mega Pixel resolution (resolution:
2592 × 1944 pixels and frame rate: 0.4 Hz) was used. A specially made cradle was
used to set the digital camera in front of the strongbox in the drum channel. The
cradle was mounted fully forward in the central slots so that the centre of the images
was lined up with the mid-height of the channel (Figure 3-22). Camera stage was
positioned at a right angle to the plexiglass window, to avoid lens distortion. In this
position, the view field of the camera was 193 mm wide and 144 mm high with the
bottom of the soil specimen just visible. The digital camera was modified by
attaching a small weight to the shutter. Under centrifuge acceleration, this weight
would press the camera shutter, thus trigger the continuous shooting mode of the
camera. This allowed images to be captured at a rate of approximately 0.4 Hz, until
the memory card (2 GB) was full or the battery was flat.
3.6. Soil Samples
3.6.1. Preparation of Transparent “Soil”
Transparent material has been used for laboratory observation of optical flow
patterns in geomechanics in since the 1990s. Iskander et al. (1994) investigated the
geotechnical properties of a transparent material developed by Mannheimer and
Oswald (1993) and found it to be similar in many respects to natural soils and, in
particular, to soft clay. Application has employed the material to study fluid flow
patterns around a prefabricated vertical drain (Welker et al. 1999). Gill (1999) used
transparent material test to study pile penetration in clays. Two families of
transparent materials have been developed for modelling sand and clay respectively
by Iskander (Iskander et al. 2002; Liu et al. 2003; Sadek et al. 2002; Sadek et al.

3-17
2003). Table 3-3 summarises existing research work about transparent “soil” in
literatures.
Gill’s transparent material recipe was replicated in current study to model transparent
clay. The transparent material was made of fumed silica powder, light paraffin oil
with R.I. = 1.462 -1.468 and density 840 - 852 kg/m3 and white spirit with R.I. =
1.437 and density 780 kg/m3.
This transparent material, which was made from 6% by weight of the fumed silica, (a
mix of 70% by volume of the paraffin and 30% by volume of the white spirit), has
clay-sized particles and exhibits similar geotechnical properties to natural clay. Table
3-4 summarises the properties of the transparent soil used in this study. In light of the
geotechnical similarities to clay, the term “transparent soil” has been used to refer to
this material throughout the remainder of the thesis. When the silica powder was
mixed with the pore fluid it created a myriad of air bubbles. To make the bubbles rise
and take all air out of the mixture a vacuum pump was used. Mixed samples were
placed into a sealed desiccator and connected to the vacuum pump inside a fume
cupboard. The ‘O’ ring seal between the desiccator top and base was covered with
silicon grease prior to closure. The desiccator was de-aired for a period of around 5
hours. This procedure allowed the air bubbles to rise to the surface and be drawn out
by the pump.
After the mixing, transparent soil sample was consolidated in the drum centrifuge
strongbox (Figure 3-23). Consolidation was conducted by dead load first followed by
air pressure press up to internal pressure of 220 kPa (Figure 3-24 and Figure 3-25).
The coefficient of consolidation was found to have a value of ~ 0.66 m2/year.
3.6.2. Preparation of Kaolin Clay Sample
The plate anchor tests were also performed on overconsolidated and normally
consolidated specimens of Speswhite Kaolin clay (Al-Tabbaa 1987) at 1g and
centrifuge tests. This clay has been used in numerous laboratory studies such as:
Piles (Randolph et al. 1979); Shallow/deep foundations (Martin and Houlsby 2000);

3-18
Pile bridge abutments (Stewart 1992a); Skirted foundations for offshore structures
(Watson 1999); Spudcan foundation (Hossain 2004). The key properties are well
established and presented in Table 3-5.
3.6.2.1. 1g Test
Clay samples were prepared by consolidating kaolin slurry. Homogeneous slurry was
obtained by mixing kaolin powder with 120 % water content (approximately twice
the liquid limit) in a conventional barrel mixer (Figure 3-26). The mixer was
equipped with a vacuum pump via a jubilee connection. Each sample was mixed in
the mixer for 4 hours. A vacuum of 80 kPa was maintained throughout the mixing
period to de-air the slurry.
After mixing, the slurry was transferred directly to the strongbox, with care taken not
to reintroduce air into the sample. The sample was then left to sit for one hour to
allow any air bubbles to escape to the surface. The samples were placed on the
consolidation press (Figure 3-27) with low initial sample pressures, which were
gradually increased as the surface clay gathered stiffness. To give maximum soil
sample height, each sample had to be topped up with clay slurry a few times because
the volume of the sample was reduced due to loss of water over the consolidation
period.
3.6.2.2. Centrifuge Test
A normally consolidated soil sample was prepared in the beam centrifuge.
Essentially, the soil slurry was produced in the same manner as for the 1g tests,
except that the consolidation process was performed by spinning the sample in the
centrifuge rather than applying a uniform surface pressure. By consolidating a soil
sample in the centrifuge, a normal soil strength profile was achieved. During
consolidation, fluid was added to the package in-flight through the hydraulic
slip-ring to compensate for evaporation losses. The external standpipe was set with
an overflow that maintained a constant water level within the sample, and
therefore a constant mass of the package. Three pore pressure transducers were

3-19
generally installed at different depths within the sample to monitor
consolidation progress through the dissipation of excess pore pressures. Once
consolidated, T-bar penetration tests were performed to assess the in situ strength
of the sample before commencement of the tests.

3-20
Table 3-1 Summary of common analysis methods (Carter et al. 2000)
Method of Analysis
Bound Theorems Elastoplastic Analysis
Limit
Theorem
s
Lower Upper
Elastic
analysis Closed-form Numerical
Equilibrium Overall √
Locally ×
√ × √ √ √
Compatibility × × √ √ √ √(1)
Boundary
Conditions
Force
only
Force
only
Displacement
only
√ √ √
Constitutive
Model
Failure
criterion
Perfectly rigid plasticity Elastic Elastoplastic Any(2)
Collapse
Information
√ √ √ × √ √
Information
before
Collapse
× × × √ √ √
Comment Simple
Safe or
unsafe?
Safe
estimat
e
of
collapse
Unsafe
estimate
of collapse
Closed
form
solutions
available
Complicated Powerful
computer
techniques
Examples Slip
circle,
Wedge
Methods
Many Limited FDM,
FEM,
BEM and
DEM
(1) Inherent and induced material discontinuities can be simulated.
(2) Includes perfect plasticity and models that can allow for complicated behaviour
such as discontinuous deformations, degradation (softening), and non-local effects.

3-21
Table 3-2 Centrifuge scaling laws
Parameter Scaling Relationship
Gravity N
Stress 1
Strain 1
Length 1/N
Force 1/N2
Density 1
Mass 1/N3
Velocity 1
Time (consolidation) 1/N2
Acceleration N

3-22
Table 3-3 Transparent soil test in the literature review
Researcher Category Solid Mean diameter
Allersma
(1988)
Sand crushed glass 2 - 3 mm
Iskander et
al. (1994)
Clay/silt amorphous silica 1.6 μm – 25 μm
Sadek et al.
(2002)
Sand silica gel
amorphous silica
0.5 - 1.5 mm and
2 - 5 mm
Sadek et al.
(2002)
Clay/silt amorphous silica powder 1.6 μm – 25 μm
Gill, D. R.
(1999)
Clay amorphous silica powder 0.1 - 0.35 μm

3-23
Table 3-4 Transparent soil properties after consolidation to σ'v = 220 kPa
Property Value
Density 942 kg/m3
Particle Size 0.1 – 0.4 μm
Consolidation Coefficient, cv 0.66 m2/year
Reflective Index 1.457
Undrained Shear Strength, su 18 kPa (T-bar)
Permeability , k 1.0 ×10⁻¹⁰ m/s
Compression index 0.34 (in e versus
log10σ'v space)
Secondary compression index 0.02 (Δecreep
/Δlog10(time))

3-24
Table 3-5 Kaolin clay properties
Property value
Specific Gravity, Gs 2.60
Liquid limit, LL (%) 61
Plastic limit, PL (%) 27
Plasticity index, PI 34
Consolidation coefficient, cv
(m2/year) 2.6
Undrained strength ratio 0.18
Critical state friction constant, M 0.92
e at 1kPa on CSL, ecs 2.14
Slope of NC line, λ 0.205
Slope of OC line, κ 0.044
Sensitivity factor, St 2 - 2.8

3-25
exterior boundary
points generated by exterior boundary
interior boundary
points generated by interior boundary
Figure 3-1 Mesh generation method
Figure 3-2 Single section after collision

3-26
Figure 3-3 A local submesh where Laplacian smoothing fails: the original local submesh
Figure 3-4 A local submesh where Laplacian smoothing fails: the results of Laplacian smoothing, which is a tangled mesh

3-27
Figure 3-5 Mesh generated by triangulation
Figure 3-6 Smoothed mesh
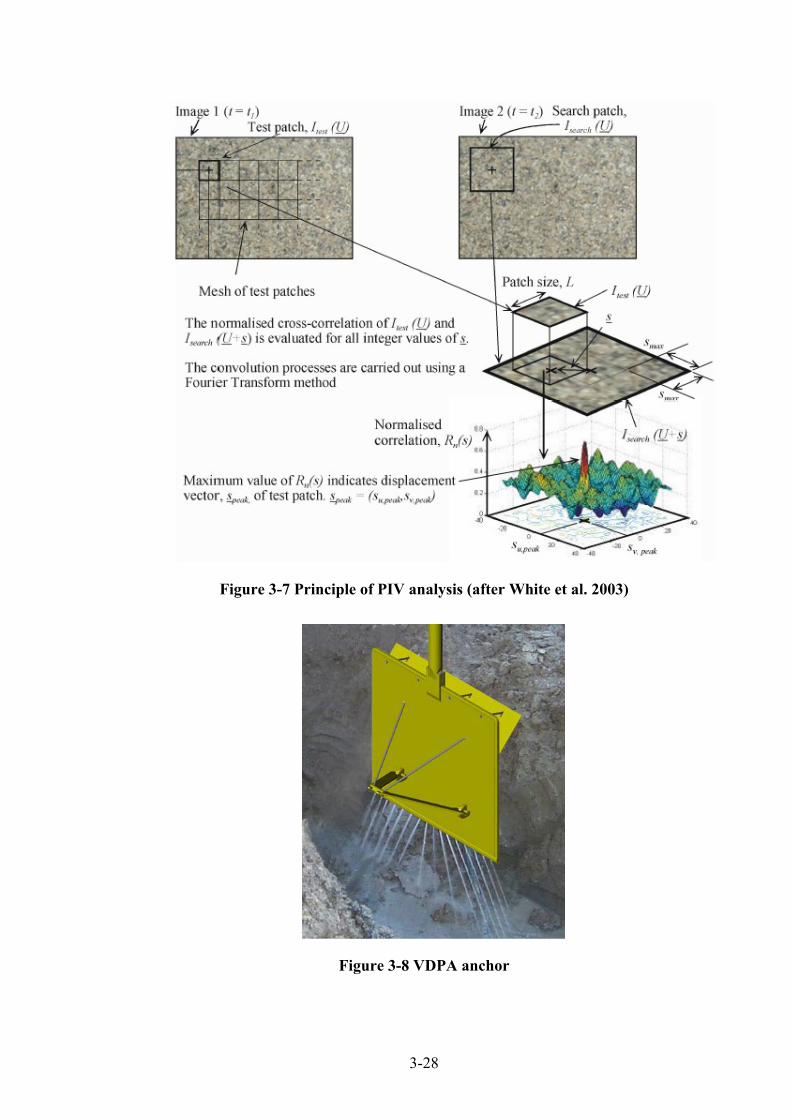
3-28
Figure 3-7 Principle of PIV analysis (after White et al. 2003)
Figure 3-8 VDPA anchor
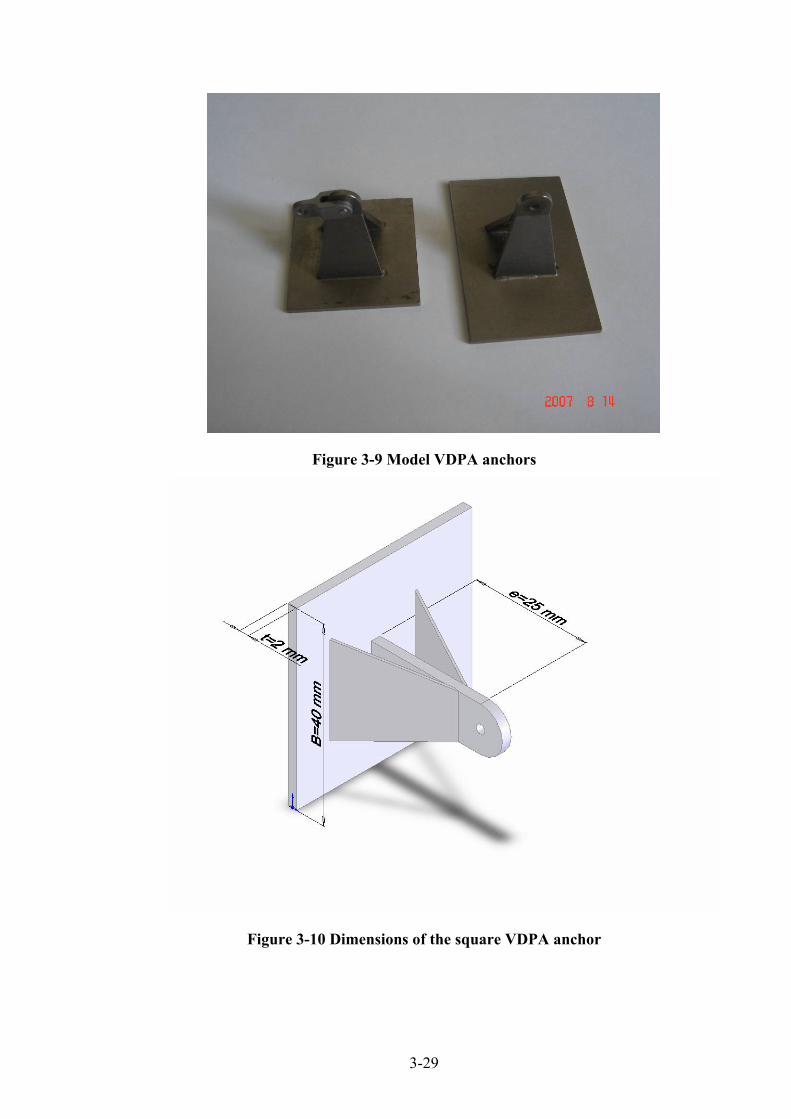
3-29
Figure 3-9 Model VDPA anchors
Figure 3-10 Dimensions of the square VDPA anchor

3-30
Figure 3-11 VDPA anchor dimensions
Figure 3-12 Installation methods

3-31
Figure 3-13 Model SEPLA
Figure 3-14 Model SEPLA anchor
Suction caissonLoad cell
Plate anchor

3-32
Figure 3-15 Suction caisson plate anchor installation tool
Figure 3-16 Jacked in anchor installation tool
PPTTo syringe pump
Drainage valve
To vertical guide

3-33
Figure 3-17 UWA beam centrifuge
Figure 3-18 Actuator on beam centrifuge box

3-34
20 mm
5 mm
Figure 3-19 Schematic diagram of T-bar penetrometer (after Stewart, 1992)
Figure 3-20 Syringe pump on drum beam centrifuge
Syringe pump
Actuator
Strong box
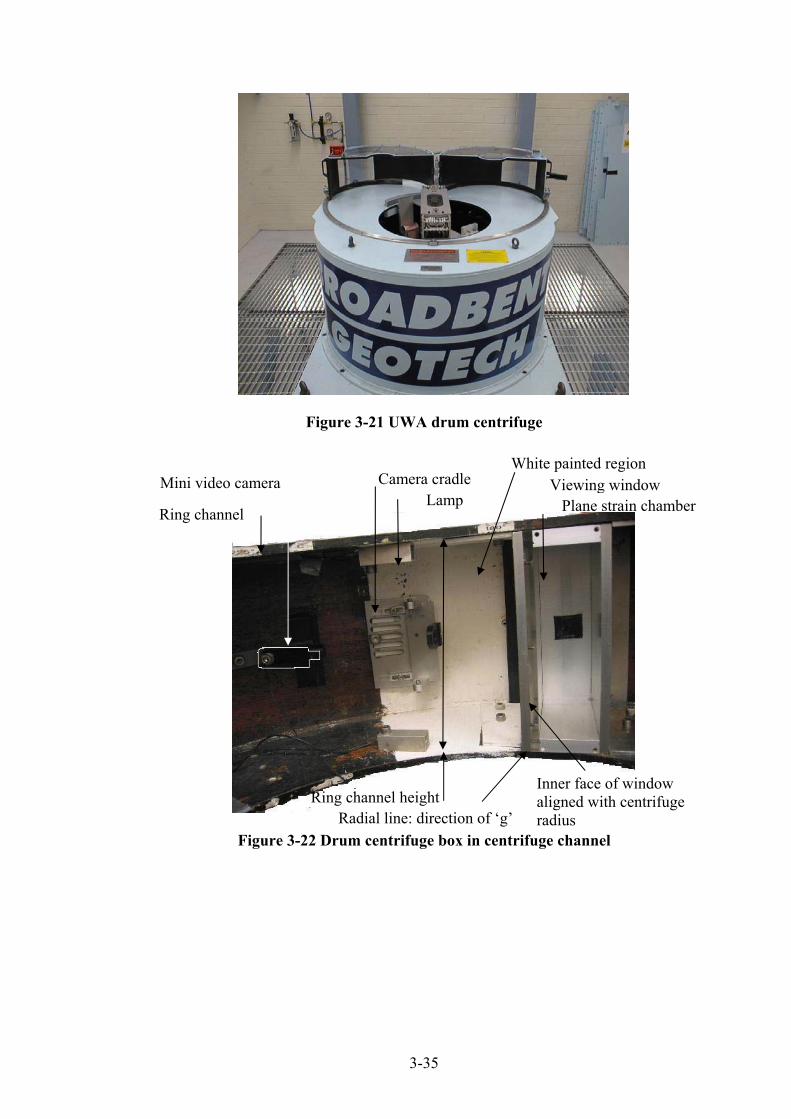
3-35
Figure 3-21 UWA drum centrifuge
Figure 3-22 Drum centrifuge box in centrifuge channel
Ring channel
Mini video camera Camera cradle Lamp
White painted region Viewing window
Plane strain chamber
Inner face of window aligned with centrifuge radius Radial line: direction of ‘g’
Ring channel height

3-36
Transparent soil
Plain strain chamber
Chamber extension
Consolidation pressure
Figure 3-23 Transparent soil in drum centrifuge box
Figure 3-24 Consolidation of transparent soil sample with a dead load on top
Dead load
Consolidation frame
Drum box
Drum box extension

3-37
Figure 3-25 The transparent mixture under consolidation by air pressure
Figure 3-26 Kaolin clay mixer
Pressure
Drum box extension
Drum box

3-38
Figure 3-27 Over-consolidation Kaolin clay chamber

4-1
CHAPTER 4. VERTICAL PULLOUT OF PLATE ANCHORS IN CLAY
4.1. Introduction
The uplift capacity of anchors in soil has been a subject of study for the last three
decades, with the majority of past research being experimentally based (Adams and
Hayes 1967; Ali 1968; Bhatnagar 1969; Das 1978; Das 1980; Das et al. 1985; Das
and Puri 1989; Das et al. 1994; Davie and Sutherland 1977; Kupferman 1971;
Meyerhof 1973; Meyerhof and Adams 1968; Ranjan and Arora 1980; Vesic 1971).
The pullout capacity factor for pre-embedded strip and circular anchors in clay was
studied numerically by Rowe and Davis (1982) using small strain analysis. In their
study, an elastic-plastic finite element analysis was performed to determine the
pullout capacity factor of the anchor. However, for a vented anchor with deep
embedment, no ultimate uplift capacity was achieved. Instead, the pullout capacity
factor was estimated by taking the capacity at a given displacement.
The limiting capacity of pre-embedded strip, circular and rectangular anchors in
homogeneous and non-homogeneous soils was investigated by Merifield et al.
(2003a; 2001), using finite element formulations of limit analyses based on rigid
plastic soil response. Upper and lower bound solutions for vented anchors with
smooth and rough interfaces in weightless soil were presented and they showed how
the effect of soil weight could be allowed for by superimposing the latter. Limiting
capacity factors for strip anchors have been reported. Corresponding lower bound

4-2
values for deeply embedded square and circular plate anchors with rough interfaces
were also studied.
Exact values for deeply embedded ultra thin circular plate anchors were reported for
smooth and rough interfaces respectively (Martin and Randolph 2001).
In this chapter, the behaviour of strip and circular plate anchors during vertical
pullout in uniform and normally consolidated (NC) clays was studied by using
AFENA (Carter and Balaam 1990) finite element package in this chapter. Both fully
bonded (attached), and ‘vented’ (no suction at anchor rear face) anchors were
considered. The current numerical results for pre-embedded anchors were compared
with existing laboratory test data, finite element results and analytical solutions.
Continuous pullout of plate anchors were conducted by using RITSS large
deformation methods coded in AFENA package. Separation behind plate anchors
was simulated and the separation depth was investigated.
Three-dimensional FE analyses were performed by using ABAQUS (HKS 2005)
finite element package. The bearing capacities of pre-embedded square or
rectangular anchors were compared with circular anchors and existing laboratory
data.
4.2. Pre-embedded Plate Anchor Analyses
Small-strain analyses were undertaken, where the strip and circular plate anchors
were ‘wished into place’ at each embedment depth without consideration of large
deformations during pullout. The soil was simulated as an elastic-perfectly plastic
material with Tresca yield criterion. Poisson’s ratio ν = 0.49 and friction and dilation
angles φ = ψ = 0 were set to simulate undrained soil conditions. Both strip and
circular plate anchors were analysed with different embedment ratio H/B or H/D up
to 10, where H is the plate embedment depth, B is the width and D is the diameter of
the anchor (Figure 4-1). The thickness ratio of the anchor, t/B (or t/D), was 0.05
except where indicated. The soil stiffness ratio was homogeneous with E/su = 500,
where E is Young’s modulus and su is the undrained shear strength. For analyses
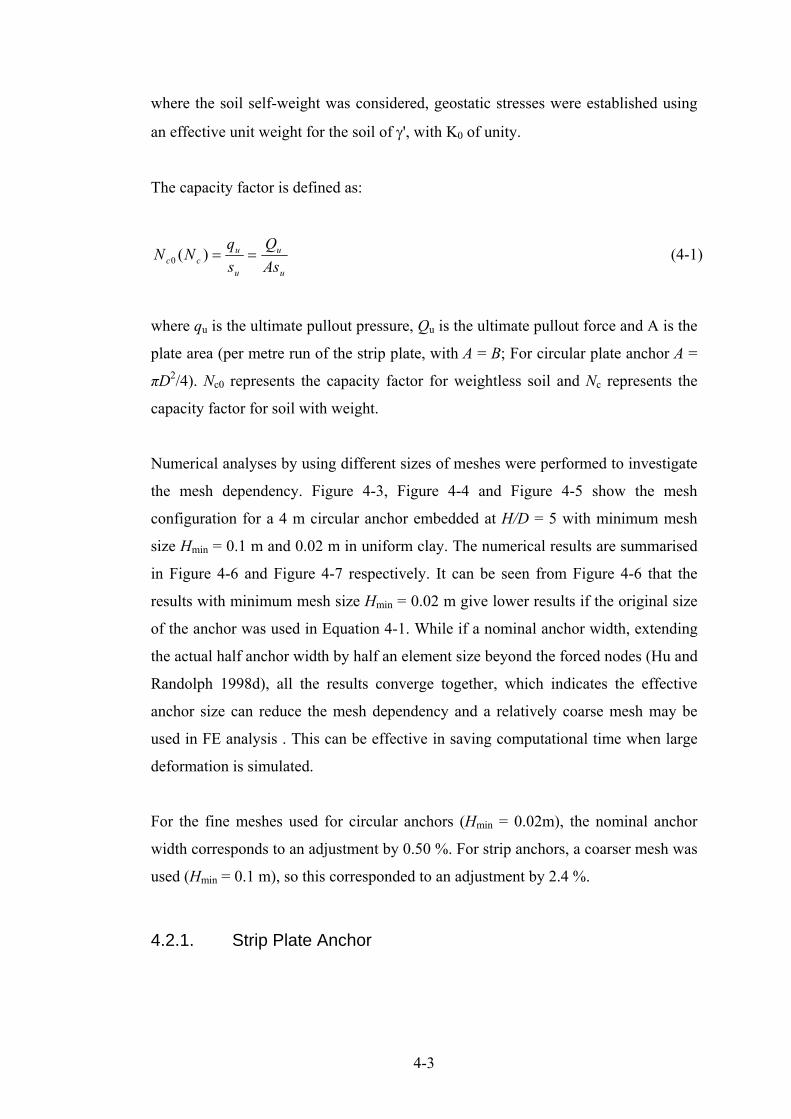
4-3
where the soil self-weight was considered, geostatic stresses were established using
an effective unit weight for the soil of γ', with K0 of unity.
The capacity factor is defined as:
u
u
u
ucc As
Qsq
NN ==)(0 (4-1)
where qu is the ultimate pullout pressure, Qu is the ultimate pullout force and A is the
plate area (per metre run of the strip plate, with A = B; For circular plate anchor A =
πD2/4). Nc0 represents the capacity factor for weightless soil and Nc represents the
capacity factor for soil with weight.
Numerical analyses by using different sizes of meshes were performed to investigate
the mesh dependency. Figure 4-3, Figure 4-4 and Figure 4-5 show the mesh
configuration for a 4 m circular anchor embedded at H/D = 5 with minimum mesh
size Hmin = 0.1 m and 0.02 m in uniform clay. The numerical results are summarised
in Figure 4-6 and Figure 4-7 respectively. It can be seen from Figure 4-6 that the
results with minimum mesh size Hmin = 0.02 m give lower results if the original size
of the anchor was used in Equation 4-1. While if a nominal anchor width, extending
the actual half anchor width by half an element size beyond the forced nodes (Hu and
Randolph 1998d), all the results converge together, which indicates the effective
anchor size can reduce the mesh dependency and a relatively coarse mesh may be
used in FE analysis . This can be effective in saving computational time when large
deformation is simulated.
For the fine meshes used for circular anchors (Hmin = 0.02m), the nominal anchor
width corresponds to an adjustment by 0.50 %. For strip anchors, a coarser mesh was
used (Hmin = 0.1 m), so this corresponded to an adjustment by 2.4 %.
4.2.1. Strip Plate Anchor

4-4
The strip plate anchor was pre-embedded in uniform strength soil with embedment
ratio H/B = 0.5, 1, 2, 3, 4, 5, 6, 7, 8, 9, 10. Both fully attached (A) and vented (V)
bases were considered, with smooth and rough interfaces.
Results from the FE analyses are shown in Figure 4-8 and Figure 4-10 for attached
and vented rough anchors in weightless soils. The current FE results are compared
with existing laboratory test data (Das 1980; Rowe and Davis 1982), FE limit
analysis (Merifield et al. 2001; Merifield 2002, Rowe 1978) and FE results (Elkhatib
and Randolph 2005; Rowe and Davis 1982).
For the attached plate anchor (A) (Figure 4-8), the current FE results stay 2.6 %
above the FE results from Rowe and Davis (1982). The overall trend is similar from
both FE analyses but the current FE analysis is expected to provide more accurate
results due to the SPR adaptive mesh. The limiting capacity factor for deep
embedment, Nc0 = 11.7, is reached at an embedment ratio of HSD/B = 2, which
indicates the critical embedment between shallow embedment (H/B < HSD/B) and
deep embedment (H/B > HSD/B). Results by Merifield (2002) are higher than current
studies as they are upper bound FE analysis results.
The anchor thickness (t/B) will influence the limiting capacity factor. The breakout
factor increases with increase of anchor thickness, which gives a higher Nc0 for an
anchor with a thickness than the exact solution of 11.42 for an infinitely thin plate
(Rowe 1978). Upper bound solutions (Bransby and O'Neill 1999) suggested that the
relative increase will be just less than 2 t/B, or about 10 % in this case. Limiting Nc0
values of 11.62 and 11.93 for rough strip anchors with t/B = 0.05 and 0.14
respectively were reported by Elkhatib and Randolph (2005) from finite element
analyses using an extremely fine mesh, confirming the effect of plate thickness. The
value of 11.7 obtained here (t/B = 0.05) agrees reasonably well with these results.
The limiting capacity factors for anchors with different t/B are plotted in Figure 4-9.
The results show that the relative increase in limiting Nc0 is about 3.4 t/B.
For a plate anchor with vented base (V) (Figure 4-10), there are two groups of results
shown. In the lower group, the results from the FE analysis of Rowe and Davis (1982)
and from the experimental results of Rowe and Davis (1982) stay closely together. In

4-5
the upper group, current FE results match well with the upper bound (UB) and lower
bound (LB) solutions from Merifield et al. (2001), the cavity expansion solutions
from Yu (2000) and the laboratory data from Das (1980). The difference between
these two groups may be largely due to the soil stiffness (i.e. the ratio of E/su),
especially for the FE results from Rowe and Davis (1982) where a truncated capacity
was used. For the results in the lower group, the soil stiffness ratio, E/su, was quoted
as 100 to 200, but higher stiffness ratios are applicable to the upper group. For the
current FE analyses the stiffness ratio was 500, while the bound solutions are based
on rigid plasticity, which means the stiffness ratio is infinite. The cavity expansion
analyses are expressed in terms of the radius of the elastic-plastic boundary, relative
to the semi-width of the plate, and are thus independent of E/su, although the stiffness
ratio must exceed 12(H/B)2 for the solutions to be valid. The dependency on soil
stiffness is more significant when the plate is deeply embedded (H/B > 3), since no
limit load is reached without large displacements. This was observed in the
laboratory tests by Das (1980) and the laboratory tests and FE analyses of Rowe and
Davis (1982). In both laboratory tests and FE analyses, the pullout capacity was
taken at a displacement of 15 to 20 % of the plate width when the plate was
embedded deeply (H/B > 3) rather than the ultimate pullout capacity at failure.
To examine the effect of soil weight, the same vented plate anchors were analysed in
soils with strength ratios, su/γ'B of ∞ (SW0), 0.066, 0.16, 0.5 and 1. The pullout
capacity results are shown in Figure 4-11. It is apparent that a non-zero soil weight
delays the separation between the soil and the anchor base. There is no separation
observed for the soil with the lowest strength ratio 0.066 even at H/B = 0.5, while
separation occurs when H/B > 1 for the stronger soil with su/γ'B = 0.16 and H/B > 6
for the soil with su/γ'B = 1. Thus, the separation depth increases with increasing soil
strength ratio. As noted by Merifield et al. (2001), the overburden pressure plays an
important role in determining the separation depth for vented plate anchors. It is
worth mentioning that the roughness of the plate has little influence on the bearing
capacity of strip anchors. Thus the results for a smooth anchor are not shown.
The soil weight effect can also be demonstrated by the soil flow mechanisms and
plastic zone shown in Figure 4-12 to Figure 4-20. For an embedment of H/B = 1

4-6
(Figure 4-12), both the attached anchor and the vented anchor with su/γ'B = 0.066
show a failure mechanism extending to the soil surface. A vertical shear plane can be
seen extending upward from the edge of the anchor, and soil is drawn in behind the
anchor, even for a vented anchor base. This is because the over burden pressure at
the anchor base in relatively high compared to the shear strength. A plastic zone
(Figure 4-13) indicates that a localised plastic zone forms behind the anchor and a
plastic zone along the vertical shear plane on top of the anchor. However, when the
soil strength ratio is increased, separation occurs between the soil and the underside
of vented anchors (Figure 4-14) and only the vertical shear plane above the plate is
formed. This is because, with increased soil strength ratios, the over burden pressure
at the anchor base is relatively low comparing to the soil strength. Thus separation
occurs. The plastic zone (Figure 4-15, enlarged in Figure 4-16) for this case only
exists along the vertical shear plane. When the anchor is deeply embedded (H/B = 7,
Figure 4-17), a local failure mechanism occurs for the attached case with a localised
plastic zone (Figure 4-18). The same mechanism occurs for vented anchors, provided
su/γ'B is not too high. However, for weightless soil, or very high strength ratio, the
mechanism for a vented anchor becomes more like a cavity expansion (Figure 4-19
and Figure 4-20). This is why the FE results of anchor breakout factor for vented
anchors agree well with the ones from cavity expansion theory (Figure 4-10).
4.2.2. Circular Plate Anchor
The pullout capacity factor of circular plate anchors with pre-embedment was also
calculated using Equation 4-1 (now with A = πD2/4) for pre-embedment ratios H/D =
0.5, 1, 2, 3, 4, 5, 6, 7 and a rough soil-anchor interface. The capacity factors in
weightless soil (Nc0) are shown in Figure 4-21. For the attached plate (A), the current
FE results lie above the laboratory test data (Das et al. 1994). Although the test
anchor was embedded in soil with soil behind the plate, it is suspected that soil-plate
separation might have occurred due to cavitations occurring behind the model plate
anchors in these small scale tests conducted under normal gravity (1 g), which gives
a high soil strength ratio. The critical embedment between shallow and deep
embedment is HSD/D = 1, which is lower than for the strip anchor (HSD/B = 2). For
deep embedment (H/D > HSD/D), the current FE result (Nc0 = 13.46, for t/D = 0.05) is

4-7
2.7 % above the exact analytical solution (Nc = 13.11, for t = 0) for a deeply
embedded ultra-thin rough plate (Martin and Randolph 2001). The difference is
partly due to the finite thickness of the anchor, and partly due to numerical effects in
the FE analyses. In order to investigate the influence of the thickness effect, anchors
with different thickness from t/B = 0.025 to 0.2 were analysed and results are shown
in Figure 4-22. The increase in limiting Nc0 is about 9.3 t/B, which is much greater
than 3.4 t/B for strip plate anchors.
Unlike for the strip anchor, the anchor roughness effect on the capacity of a circular
plate anchor is more profound. The FE analyses show that the pullout capacity for a
smooth circular plate anchor is about 4 % lower than for a fully rough anchor. This
is similar to the 5.6 % difference in the exact solutions for infinitely thin deeply
embedded anchors (Martin and Randolph 2001). Figure 4-23 and Figure 4-24 show
the flow mechanism for rough and smooth plate anchors respectively. The volume of
the soil flow for the rough anchor is larger than that for the smooth anchor. This is
why the limiting bearing factor of a rough anchor is higher than the one of a smooth
anchor.
For the vented anchor (V) (Figure 4-25), the current small strain FE results with
ultimate pullout factors stay close to the lower bound solution of Merifield et al.
(2003a) until H/D = 5. A limit pullout capacity factor is reached in current FE results
when anchor is embedded deeply (H/D ≥ 5). Cavity expansion solutions from Yu
(2000) show no limiting value reached even when H/D > 7. This is because in cavity
expansion analyses, soil weight was used to setup initial soil pressure. As shown in
Figure 4-11, the soil weight can converge the vented anchor response to the attached
anchor response.
The effect of soil stiffness on the vented anchor response was also investigated. In
Figure 4-26, the anchor response is shown for an embedment ratio of H/D = 4 and
three soil stiffness ratios (E/su = 500, 2000 and 10,000). For the stiffer soils, the
ultimate pullout capacity is reached at small pullout displacements, of 0.08 D and 0.2
D respectively for E/su = 10000 and 2000. When the soil stiffness ratio is reduced to
500, the ultimate pullout capacity is not reached within a small pullout displacement.
Therefore, if the pullout capacity is measured at a pullout displacement of 0.2 D, the

4-8
bearing capacity decreases with decreasing soil stiffness. The plate pullout capacity
factors at a displacement of 0.2 D are also shown in Figure 4-25. The lower values
from the FE results by Rowe and Davis (1982) might well be due to the soft soil
analysed (E/su ≅ 166).
4.2.3. Circular Anchors in Normally Consolidated Clay
In offshore applications, marine deposits are normally consolidated (NC) or lightly
overconsolidated with strength increasing linearly with depth. In this section, plate
anchors embedded in NC clay will be analysed. All soil parameters were the same as
the above analysis, except that the soil strength profile used in this analysis was su =
kz, where z is the soil depth and k is the strength gradient with depth (Figure 4-1).
And E/su was maintained as constant E/su = 500.
Figure 4-27 and Figure 4-28 show the uplift capacity factors obtained from the
analyses of fully attached and vented rough circular anchors in soil with uniform
strength and a normally consolidated strength profile su = 1. z (kPa). Uplift bearing
capacity factors is calculated as for plate anchors in uniform clay:
ua
u
ua
uc As
Qsq
N ==0 (4-2)
where sua is the soil strength at the centre of the anchor
For attached anchors, although shallowly embedded anchors in uniform clay give
slightly lower capacities than that in NC clay. They demonstrate similar trend and the
capacity factors for deeply embedded anchors are identical. The difference for the
shallowly embedded anchors may be due to the tension is allowed in the Tresca
model used in current analysis. Typical plastic zones and flow mechanism for
anchors in NC clay are found to be similar with those in uniform clay and not shown
here. From this study, it can be concluded that the bearing capacity for an attached
anchor in NC clay can be calculated by the soil shear strength at the embedded depth
and the breakout factors from uniform clay study. For NC soil, the critical depth is

4-9
HSD/D = 2 comparing to that in uniform soil HSD/D = 1. The high Nc0 at H/D = 0.5 is
due to the low sua, since HSD/D = 2 for NC soil, Nc0 need to reach the limiting Nc0
gradually.
In the analyses of the vented anchors in NC soil with the same strength profile, it is
found that the difference between the anchors in uniform and NC clay are more
significant. This can be explained by the soil flow mechanism in Figure 4-29 and
Figure 4-30. These figures are similar to those anchors in uniform clay found in
Figure 4-19 and Figure 4-20. However, when the anchors are embedded in NC clay
and the base is vented, the soil flow mechanism is not fully localised, so the bearing
capacity of anchors is not only dependent on the soil strength at the anchor
embedment depth but also the soil failure zone above the anchor has lower strength
in NC soil. The uplift capacity breakout factor of vented plate anchor in NC clay is
lower than that in uniform clay.
The above small strain analyses have shown that the soil strength ratio (su/γ'B or
su/γ'D) and soil stiffness (E/su) play an important role on the soil flow mechanism,
hence anchor pullout capacity factor (Nc). Although existing laboratory test data,
analytical solutions and finite element results can be rationalised by the current FE
results, the small strain analyses cannot take account of non-linear effects of
geometry changes, such as the approaching soil surface and surface heave, during
continuous pullout. Large deformation FE analyses of continuous pullout have
therefore been undertaken in order to investigate the ‘separation’ point at which soil
on the back face of the anchor breaks away from the anchor base.
4.3. Continuous Plate Anchor Pullout Analysis
Continuous pullout analysis of both strip and circular anchors was undertaken.
Anchors with fully attached base and vented base were simulated to investigate the
soil-plate separation phenomenon. Both uniform and normally consolidated (NC)
clays were modelled, with friction and dilation angles φ = ψ = 0. The undrained shear
strength ratios were su/γ'D (or su/γ'B) = 0.1 to 1 for uniform clay and k/γ' = 0.03 to 0.5

4-10
for NC clay. The stiffness ratio of soil was kept constant as E/su = 500. The
buoyancy effect on anchor capacity was removed by assigning the anchor the same
unit weight as the surrounding soil.
4.3.1. Anchor in Uniform Clay
4.3.1.1. Effects of Soil Stiffness and Large Deformation
Although a weightless soil is not the case in the field, a large deformation analysis in
weightless soil can provide comparison with the small strain analysis results.
Because the geostatic stress in weightless soil is zero, the anchor will separate
immediately after pullout. A rough circular plate anchor in uniform soil is
investigated.
Figure 4-31 shows the results from both large deformation (LD) analysis by using
RITSS method and small strain (SS) analysis for a circular anchor with embedment
ratio H/D = 4. The effect of soil stiffness on vented anchor is also investigated. In
Figure 4-31, the soil response with two stiffness (E/su = 500, 2000) are shown. The
large deformation result shows that the ultimate pullout capacity for deeply
embedded anchors (Nc=13.5) can never be reached in a soft soil, since the
embedment is decreasing with increasing pullout distance. Therefore, it is apparent
that, if the pullout capacity is truncated at 20% D pullout distance, the result is
dependent on the soil stiffness. The plate pullout capacity factors at a displacement
of 20% D are also shown in Figure 4-32 for both small strain and large deformation
analysis. Soil stiffness (E/su) plays an important role for anchor capacity in large
deformation analysis results, which is similar to conclusion in 4.2.2.
4.3.1.2. Pullout Capacity and Separation Depth
The effects of soil strength ratio (su/γ'D = 0.039) and anchor base condition (A or V)
on anchor pullout responses are shown in Figure 4-33 for circular plate anchors with
initial embedment Hi/D = 1 and 0.5. The anchor force has been normalised as q/su (or
Q/Asu). From the results of anchor with attached base of Hi/D = 1, it can be seen that

4-11
the pullout resistance factor is constant q/su = 13.7 until to the embedment reaches
HSD/D = 0.75. This value is lower that for small strain analysis of attached anchors
(HSD/D = 1). This marks the transition point from a deeply embedded anchor to a
shallowly embedded anchor. When the anchor was initially embedded at a depth
shallower than Hi/D = 0.5 with attached base, the breakout factor reaches its limiting
value at initial pullout, and then coincides with that of deeper anchors (Hi/D = 1).
When the anchor base was vented, the breakout factor shows exactly the same
response at the initial pullout until the embedment reaches H/D = 0.3. This indicates
the depth of soil separation from the anchor base, hence Hs/D = 0.3 for this case.
With further pullout, the breakout factor decrease linearly and more rapidly than for
an attached anchor. Although the anchors were initially embedded at different depths
(Hi/D = 0.5 and Hi/D = 1), both initial embedment are deeper than the separation
point, and the separations occurred at the same depth.
In order to show the effect of su/γ'D, the anchor pullout responses are shown in
Figure 4-34 for circular plate anchors embedded in uniform soil with soil strength
ratio su/γ'D = 0.065 and su/γ'D = 0.039, at initial embedment depths, Hi/D, of 0.5, 1
and 2. For the attached anchor with Hi/D = 2, the normalised pullout capacity is
constant (Nc = 13.7) during the initial pullout, but starts to decrease at an embedment
HSD/D = 0.75, which marks the transition from deep embedment to shallow
embedment. This value is lower than that from obtained small strain analyses (HSD/D
= 1.0, see the SS-A curve in Figure 4-34). After this transition, the pullout capacity
from large deformation analysis is higher than that from small strain analysis. The
reduced transitional embedment depth and the higher capacity in large deformation
analysis are due to the heave formed in large deformation analysis, which is
discussed in the following section. For the attached anchor with Hi/D = 1 and 0.5, the
pullout capacity factor reaches the SS-A curve instantly after the initial pullout; and
then it converges to the A-curve for large deformation. The unique curve for the
attached plate can be expressed as below from curve fitting (A-curve in Figure 4-35
for a circular anchor):

4-12
75.0for7.13
75.0for 6.30.11
≥=
≤⎟⎠⎞
⎜⎝⎛+=
DHN
DH
DHN
c
c
for circular anchor (4-3 a)
4.1for 7.11
4.1for 2.26.8
≥=
≤⎟⎠⎞
⎜⎝⎛+=
BHN
BH
BHN
c
c
for strip anchor (4-3 b)
The development of the ‘attached’ A-curve for strip anchors is similar to that for
circular anchors, and shown in Figure 4-35. It should be noted that the A-curve is
only unique for the cases analysed (i.e. Hi/D > 0.5) and the curve will diverge for
different strength ratios (su/γ'D), at shallow depths. For any plate anchor embedded
shallower than Hi/B = 0.5, there may be insufficient soil above the plate to form the
full heave and the pullout response is expected to converge to the SS-A curve
gradually. However, the A-curve presented here covers a practical range of anchor
embedment.
When the anchor base is vented with Hi/D = 1 and 2, the pullout capacity factor
shows exactly the same response as the attached anchor during initial pullout. The
graph in Figure 4-34 was enlarged in Figure 4-36 to clearly show the separation
depth for these two cases. Soil-anchor separation occurs at embedment depths of
Hs/D = 0.55 for su/γ'D = 0.065 and Hs/D = 0.3 for su/γ'D = 0.039. The separation
embedment depth (Hs) marks the transition from full soil-anchor attachment to
breakaway of soil behind the anchor once the normal stress reduces to zero (since no
suction is considered). The initial embedment depth has no effect on the separation
depth (see results for Hi/D = 1 and 2 with su/γ'D = 0.065). After the separation depth
(Hs) is reached, the anchor capacity decreases linearly and more rapidly with further
pullout than for an attached anchor. When the vented anchor is initially embedded
above the separation depth (i.e. Hi/D = 0.5 < Hs/D = 0.55 for su/γ'D = 0.065), the

4-13
ultimate pullout capacity of the anchor is quickly developed (see Equation 4-4 below)
and separation occurs immediately.
For an initially shallowly embedded vented anchor (Hi < Hs), the pullout capacity
factor (Ncsh) can be derived from the shear resistance from the shear plane above the
anchor (Qushear) (as indicated in Figure 4-14) and the soil weight immediately above
the anchor (Qusoil). This can be expressed as:
HsDAs
AHDHsAs
QQN
uu
u
u
usoilushearcsh ⎟⎟
⎠
⎞⎜⎜⎝
⎛ γ+=
γ+π=
+=
'4
for circular anchor (4-4 a)
HsBAs
AHHsAs
QQN
uu
u
u
usoilushearcsh ⎟⎟
⎠
⎞⎜⎜⎝
⎛ γ+=
γ+=
+=
'22
for strip anchor (4-4 b)
where A is the anchor area and γ' is the effective soil unit weight.
To examine the effect of soil strength ratio (su/γ'B or su/γ'D) on soil-anchor separation
depth ratio (Hs/D), more analyses were conducted with soil strength ratios up to 1.
The results are plotted in Figure 4-37 for both strip plate anchors and circular plate
anchors. The linear relationship between the separation depth ratio (Hs/B or Hs/D)
and the soil strength ratio (su/γ'B or su/γ'D) can be expressed as:
D
sD
H us'
0.8γ
≈ for circular anchor (4-5 a)
Bs
BH us
'4.6
γ≈ for strip anchor (4-5 b)
The correlation coefficient for both fitted curves is R2 = 0.99. Note that, by
expressing the right hand sides of these relationships in terms of su/σ'v, where σ'v =
γ'H, the separation criterion can be expressed as:

4-14
0.13 s
'v
u >σ
for circular anchors (4-6 a)
0.16 s
'v
u >σ
for strip anchors (4-6 b)
4.3.1.3. Soil Flow Mechanism
Figure 4-38 depicts the soil flow mechanisms at H/B = 0.3 after continuous pullout
for an initially deeply embedded circular anchor (Hi/D = 2) in soil with su/γ'D =
0.065. In this case, a separation depth ratio of Hs/B = 0.55 is observed for the vented
anchor (see Figure 4-34). Before the separation depth is reached, the soil flow
mechanism is similar to the ones in Figure 4-12 (a) and Figure 4-17 (a) with fully
localised soil flow mechanisms. For both attached and vented anchors, soil heave is
observed, which is the reason why the transitional embedment depth (HSD) from
continuous pullout analysis is shallower than that from small strain analysis, where
heave is not simulated.
For an initially shallowly embedded circular anchor (Hi/D = 0.5 < Hs/D = 0.55) with
vented base, separation between the soil and anchor occurs as the pullout capacity
given by Equation 4-3 is reached. The soil flow mechanism during the initial pullout
is similar to that in Figure 4-14. Figure 4-40 shows the flow mechanism at H/D = 0.3.
The soil heave, in this case, is smaller compared to that for an initially deeply
embedded anchor (Figure 4-38), and this affects the gradient of the response curve
following soil-plate separation (Figure 4-34).
Therefore, in uniform soil, when a vented plate anchor is initially deeply embedded
(Hi > Hs), the pullout capacity will reach the A-curve first (Equation 4-3). Separation
occurs when the anchor embedment reaches the separation depth (H = Hs); when a
vented anchor is initially shallowly embedded (Hi < Hs), the pullout capacity is
limited by Ncsh (Equation 4-4) at which point separation occurs.
4.3.2. Anchor in Normally Consolidated Clay
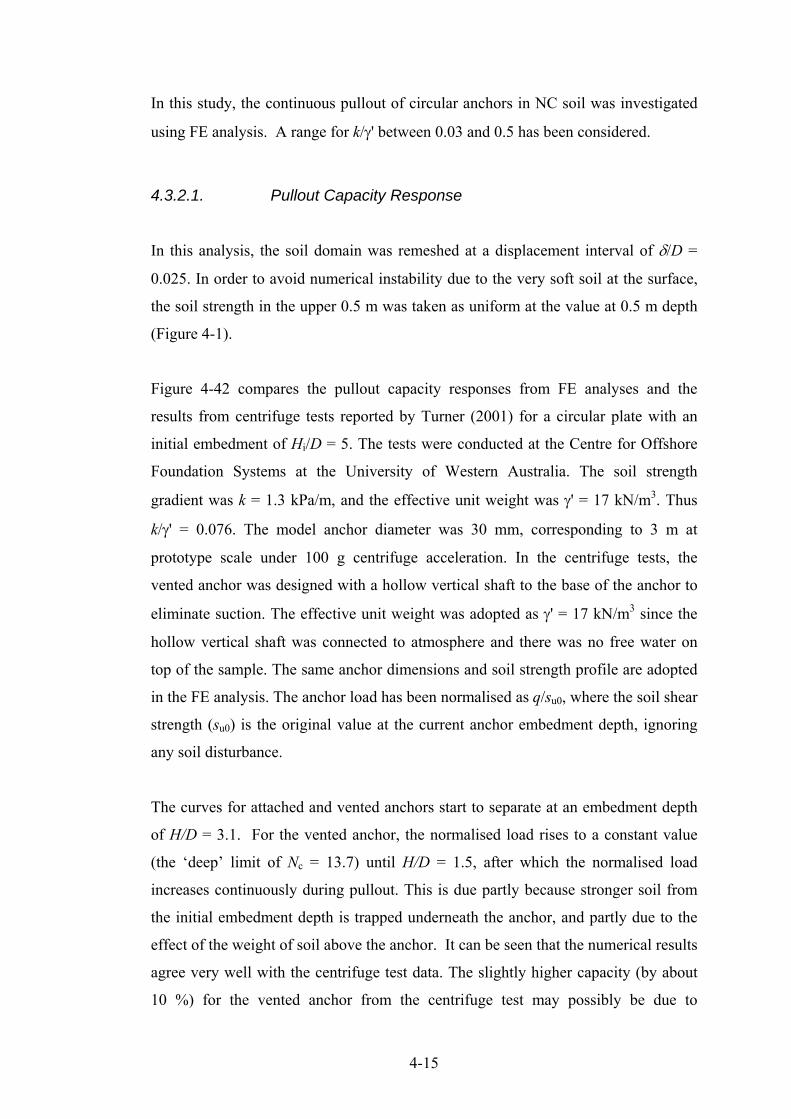
4-15
In this study, the continuous pullout of circular anchors in NC soil was investigated
using FE analysis. A range for k/γ' between 0.03 and 0.5 has been considered.
4.3.2.1. Pullout Capacity Response
In this analysis, the soil domain was remeshed at a displacement interval of δ/D =
0.025. In order to avoid numerical instability due to the very soft soil at the surface,
the soil strength in the upper 0.5 m was taken as uniform at the value at 0.5 m depth
(Figure 4-1).
Figure 4-42 compares the pullout capacity responses from FE analyses and the
results from centrifuge tests reported by Turner (2001) for a circular plate with an
initial embedment of Hi/D = 5. The tests were conducted at the Centre for Offshore
Foundation Systems at the University of Western Australia. The soil strength
gradient was k = 1.3 kPa/m, and the effective unit weight was γ' = 17 kN/m3. Thus
k/γ' = 0.076. The model anchor diameter was 30 mm, corresponding to 3 m at
prototype scale under 100 g centrifuge acceleration. In the centrifuge tests, the
vented anchor was designed with a hollow vertical shaft to the base of the anchor to
eliminate suction. The effective unit weight was adopted as γ' = 17 kN/m3 since the
hollow vertical shaft was connected to atmosphere and there was no free water on
top of the sample. The same anchor dimensions and soil strength profile are adopted
in the FE analysis. The anchor load has been normalised as q/su0, where the soil shear
strength (su0) is the original value at the current anchor embedment depth, ignoring
any soil disturbance.
The curves for attached and vented anchors start to separate at an embedment depth
of H/D = 3.1. For the vented anchor, the normalised load rises to a constant value
(the ‘deep’ limit of Nc = 13.7) until H/D = 1.5, after which the normalised load
increases continuously during pullout. This is due partly because stronger soil from
the initial embedment depth is trapped underneath the anchor, and partly due to the
effect of the weight of soil above the anchor. It can be seen that the numerical results
agree very well with the centrifuge test data. The slightly higher capacity (by about
10 %) for the vented anchor from the centrifuge test may possibly be due to

4-16
imperfect venting beneath the anchor. The initial transient peak in capacity in the
centrifuge test results may be due to initially high friction along the shaft used to
extract the anchors.
4.3.2.2. Separation Depth
The separation depth for plate anchors in NC clay depends on the soil strength at the
initial depth (sui). This is because the stronger soil at the initial embedment is trapped
around the plate during pullout, particularly before separation occurs. Thus, the soil
strength ratio should be calculated using sui (= kHi), hence sui/γ'D = (k/γ')(Hi/D).
Figure 4-43 shows the separation depth for a circular plate anchor in NC clay and the
fitted curve for the anchor in uniform clay. Figure 4-44 and Figure 4-45 show
contour of the original soil depth for an attached and vented plate anchor respectively.
The results for NC clay stay within 5 % of the fitted curve for uniform soil. Thus the
separation depth for an anchor in NC clay can be estimated using Equation 4-5 with
su taken as the value at the initial embedment. Note that, similar to uniform strength
soil, the separation criterion in NC soil can be expressed as k/γ' (or sui/γ'v0) greater
than 0.13 (or 0.16 for strip anchors). Since lightly overconsolidated offshore
sediments have typical strength gradients greater than 1 kPa/m, and effective unit
weights less than 7 kN/m3 (giving k/γ' > 0.14) care needs to be taken in the design of
plate anchors, since some degree of suction below the anchor will be needed for the
full ‘deep’ capacity of the anchor to be achieved.
4.4. 3D Plate Anchor Analysis
To date, much numerical study for anchor behaviour has been limited to plane strain
problems or axial symmetrical problems except lower bound solution by Merifield et.
al. (2003a). To study the behaviour of rectangular and square anchors, numerical
study of rectangular and square anchors was performed in clay.
The square and rectangular plate anchors were ‘wished into place’ at each
embedment depth in uniform weightless clay. The soil was simulated as an elastic-

4-17
perfectly plastic material with Tresca yield criterion. Poisson’s ratio ν = 0.49 and
friction and dilation angles φ = ψ = 0 were set to simulate undrained soil conditions.
Rectangular anchors were analysed with different aspect ratio L/B = 1, 2, 3, 4, 5,
where L is the length of the anchor and B is the width (Figure 4-46). Different
embedment ratios H/B were analysed up to 10, where H is the plate embedment
depth. The soil stiffness ratio was homogeneous with E/su = 500. The soil anchor
interface was assumed to be rough and the anchor base can be fully attached or
vented.
Figure 4-47 shows the comparison of the numerical results by using AFENA and
ABAQUS for circular anchors. Generally speaking, the breakout factor results using
these two types of software for circular anchors embedded at a given embedment
depth are identical for deeply embedded anchors. The slight difference in Nc0 at
shallow embedment may be due to the different element types used in 2D AFENA
and 3D ABAQUS analyses. In the following square and rectangular anchor analyses,
ABAQUS was used.
Figure 4-48 and Figure 4-49 show bearing capacity factors for square and rectangular
anchors respectively. As expected, the breakout factors for square and rectangular
anchors in weightless soil are lower than those for circular anchors at the same
embedment ratios.
The maximum breakout factors for attached square anchors is about 13.39, which is
about 2 % lower than those of circular anchors. The difference in maximum breakout
factors for rectangular anchors with L/B = 4 and L/B = 5 is identical for both attached
case and vented case, which means the anchor with L/B = 5 can be taken considered
as a strip anchor. The critical depth between shallow and deep embedment for
attached square anchors is close to that of circular anchors and the critical depth of
attached rectangular anchors is higher than that of circular anchor or square anchors,
and converge to that of strips anchors.
Figure 4-50 and Figure 4-51 show the comparison of the numerical results for squre
and rectangular anchors. The three dimensional numerical analysis for vented
anchors show encouraging agreement with lower bound solutions by Merifield et. al.

4-18
(2003) and Das (1980) small scale laboratory tests. Results from current study are
about 10 % higher than Merifield et. al. (2003) and Das (1980) results, since
Merifield et. al. (2003) provides lower bound solution and Das’s (1980) test results
were conducted in softer soil.
4.5. Conclusions
In small strain analysis, the pullout capacity factor (Nc0) in weightless soil with
uniform strength shows good agreement with existing small scale laboratory test and
numerically truncated FE results. The discrepancies in the existing laboratory data
and analytical solutions are found to be due to the effects of soil strength ratio (su/γ'B
for strip anchor or su/γ'D for circular anchor) and soil stiffness ratio (E/su). At low
soil strength ratios, separation occurs for vented anchors, and the anchor capacity
mobilised at a given displacement, such as 0.2D, increases with increasing soil
stiffness ratio.
From small strain analysis of fully attached anchors, the transitional embedment
depth from shallow to deep failure mechanisms was found to be HSD/B = 2 for strip
anchors and HSD/D = 1 for circular anchors. Soil unit weight has no effect on the
pullout response of an attached anchor. The ultimate pullout capacity factors for
deeply embedded and fully attached anchors were found to be: Nc = 11.6 and 11.7
respectively for smooth and rough strip anchors; Nc = 13.1 and 13.5 for smooth and
rough circular anchors, both for a thickness ratio of 0.05.
In large deformation analysis of plate anchors in uniform soil, the continuous pullout
response of an attached anchor forms a unique curve regardless of soil unit weight, γ',
soil strength, su and anchor size B (or D), which is referred here as the A-curve (see
Equation 4-3) for any anchor embedded to a depth of at least half of the anchor size
initially. This A-curve is similar to that from small strain analysis (i.e. SS-A curve).
However, the transitional embedment depth from shallow to deep embedment is
reduced to HSD/B = 1.4 for strip anchors and HSD/D = 0.75 for circular anchors due to
the soil heave formed during continuous pullout.

4-19
For a vented anchor in uniform soil, the soil below the anchor breaks away from the
anchor at a certain embedment depth (Hs). The separation depth ratio (Hs/B or Hs/D)
was found to increase linearly with the undrained shear strength ratio of soil, su/γ'B or
su/γ'D. The linear relationships are given in Equation 4-5 and correspond to soil
strength ratios of su/σ'v0 of 0.13 and 0.16 respectively for circular and strip anchors.
When a vented anchor is initially embedded below the separation depth, the pullout
response converges to the A-curve first. After the anchor embedment reaches the
separation depth, the pullout capacity decreases rapidly and linearly. When an anchor
is initially embedded above the separation depth, the ultimate pullout capacity is
determined by the shear resistance from the vertical shear plane and the soil weight
above the anchor, with separation occurring immediately.
For circular anchors embedded in NC clay with continuous pullout, the FE results
agree very well with data from centrifuge model tests. As for the case of anchors in
NC clay, separation is governed by the strength ratio and occurs for k/γ' ≥ 0.13 or
0.16 respectively for circular and plate anchors.
The breakout factors for square and rectangular anchors in weightless soil are lower
than those for circular anchors at the same embedment ratios, and rectangular
anchors with L/B = 5 can be taken as strip anchors. The transitional embedment
depth, from shallow to deep embedment, is HSD/B = 2 for a square anchor, same as
that of circular anchors; And the transition depth for rectangular anchors gradually
deceases from HSD/B = 2 to HSD/B = 3 with increasing aspect ratios, same as strip
anchors.

4-20
H
D(B)
Attached or Vented
su = kz
su(z)
Qu
su
Normally consolidated or uniform clay E = 500su
z 0.5m
t
Figure 4-1 Plate anchor embedded in NC and uniform clay
(a) Circular anchors (b) Strip anchors
Figure 4-2 Plate anchors in FE analysis

4-21
Figure 4-3 Mesh configuration (Hmin = 0.1)
Figure 4-4 Mesh configuration (Hmin = 0.02, course mesh)

4-22
Figure 4-5 Mesh configuration (Hmin = 0.02, fine mesh)
0
2
4
6
8
10
12
14
16
0 1 2 3 4 5 6 7H/D
N c0
Hmin=0.02,Coarse meshHmin=0.02,Fine meshHmin=0.1
Figure 4-6 Breakout factors calculated by the original width of circular plate anchors

4-23
0
2
4
6
8
10
12
14
16
0 1 2 3 4 5 6 7H/D
N c0
Hmin=0.02,Coarse meshHmin=0.02,Fine meshHmin=0.1
Figure 4-7 Breakout factors calculated by the effective width of circular plate anchors
0
2
4
6
8
10
12
14
16
18
0 1 2 3 4 5 6 7 8 9 10H/B
N c0
Current FE, A
FE, A (Rowe and Davis)
FE, A (Elkhabit et al., t/B = 0.14)FE, A (Elkhabit et al., t/B = 0.05)Exact, A (Rowe, t = 0)
Merifield (2002)
Figure 4-8 Pullout capacity of rough strip anchor with pre-embedment in weightless soil (A, small strain)

4-24
N c0 = 3.4 t/B + 11.5, R2 = 0.99
11.0
11.2
11.4
11.6
11.8
12.0
12.2
12.4
0 0.05 0.1 0.15 0.2 0.25t/B
N c0
This study,FEExact solution (t=0) Rowe 1978Elkhatib and Randolph 2005,FEFitted line (This study, FE)
Figure 4-9 Thickness effect for strip anchors (small strain)
0
2
4
6
8
10
0 1 2 3 4 5 6 7 8 9 10H/B
N c0
Current FE, VLab Test, V (Das, L/B = 5)Lab Test, V (Rowe and Davis, L/B = 5)Lab Test, V (Rowe and Davis, L/B = 8)
FE, V (Rowe and Davis)
UB, V (Merifield et al.)
LB, V (Merifield et al.)
CE, V (Yu)
Figure 4-10 Pullout capacity of rough strip anchor with pre-embedment in weightless soil (V, small strain)
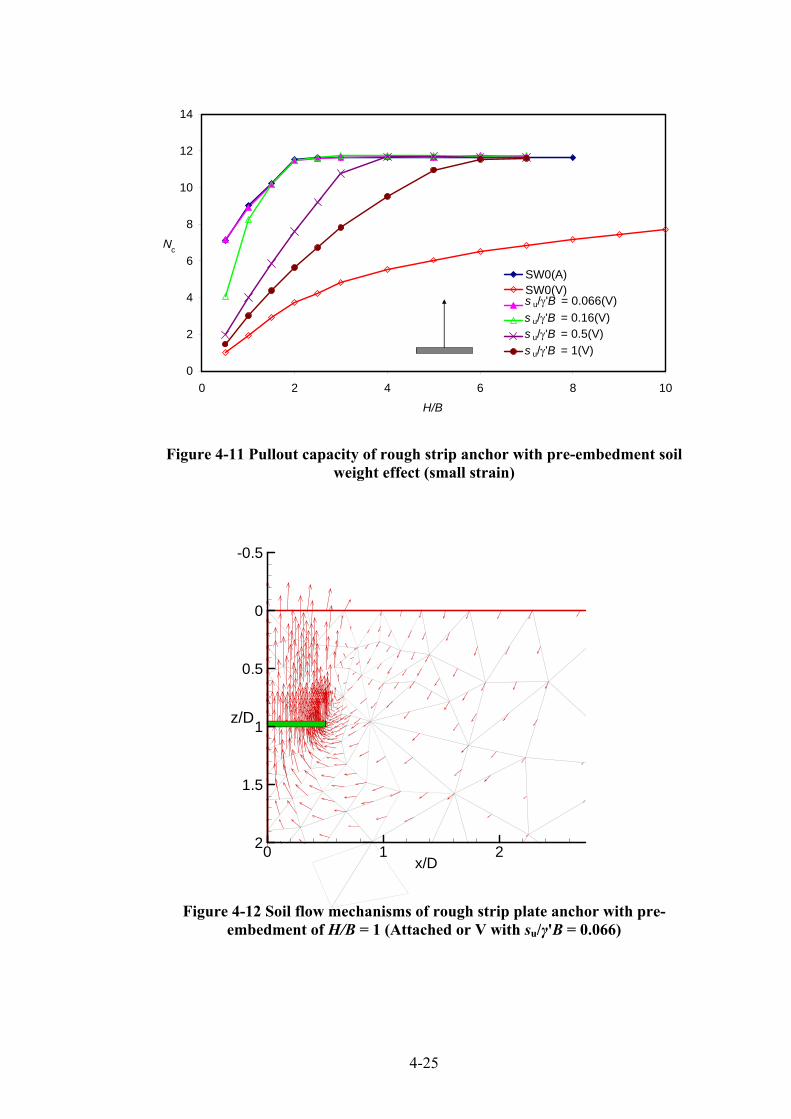
4-25
0
2
4
6
8
10
12
14
0 2 4 6 8 10H/B
Nc
SW0(A)SW0(V)s u/γ'B = 0.066(V)s u/γ'B = 0.16(V)s u/γ'B = 0.5(V)s u/γ'B = 1(V)
Figure 4-11 Pullout capacity of rough strip anchor with pre-embedment soil weight effect (small strain)
x/D0 1 2
-0.5
0
0.5
1
1.5
2
z/D
Figure 4-12 Soil flow mechanisms of rough strip plate anchor with pre-embedment of H/B = 1 (Attached or V with su/γ'B = 0.066)

4-26
Figure 4-13 Plastic zone of rough strip plate anchor with pre-embedment of H/B = 1 (Attached or V with su/γ'B = 0.066)
x/D0 1 2
-0.5
0
0.5
1
1.5
2
z/D
Figure 4-14 Soil flow mechanisms of rough strip plate anchor with pre-embedment of H/B = 1 (Vented with su/γ'B > 0.15)

4-27
Figure 4-15 Plastic zone of rough strip plate anchor with pre-embedment of H/B = 1 (Vented with su/γ'B > 0.15)
Figure 4-16 Enlarged plastic zone of rough strip plate anchor with pre-
embedment of H/B = 1 (Vented with su/γ'B > 0.15)

4-28
x/D0 1 2
5.5
6
6.5
7
7.5
8
z/D
Figure 4-17 Soil flow mechanisms of rough strip plate anchor with pre-embedment of H/B = 7 (Attached or vented with su/γ'B < 1)
Figure 4-18 Plastic zone of rough strip plate anchor with pre-embedment of H/B = 7 (Attached or vented with su/γ'B < 1)
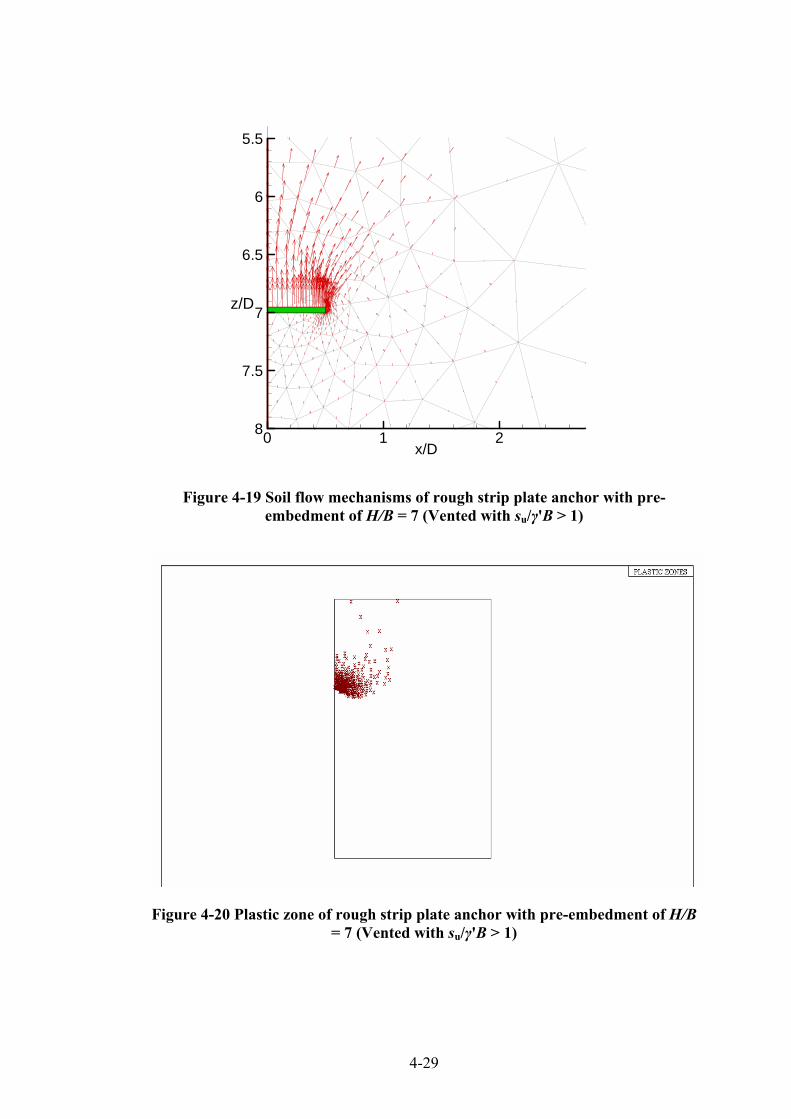
4-29
x/D0 1 2
5.5
6
6.5
7
7.5
8
z/D
Figure 4-19 Soil flow mechanisms of rough strip plate anchor with pre-embedment of H/B = 7 (Vented with su/γ'B > 1)
Figure 4-20 Plastic zone of rough strip plate anchor with pre-embedment of H/B = 7 (Vented with su/γ'B > 1)
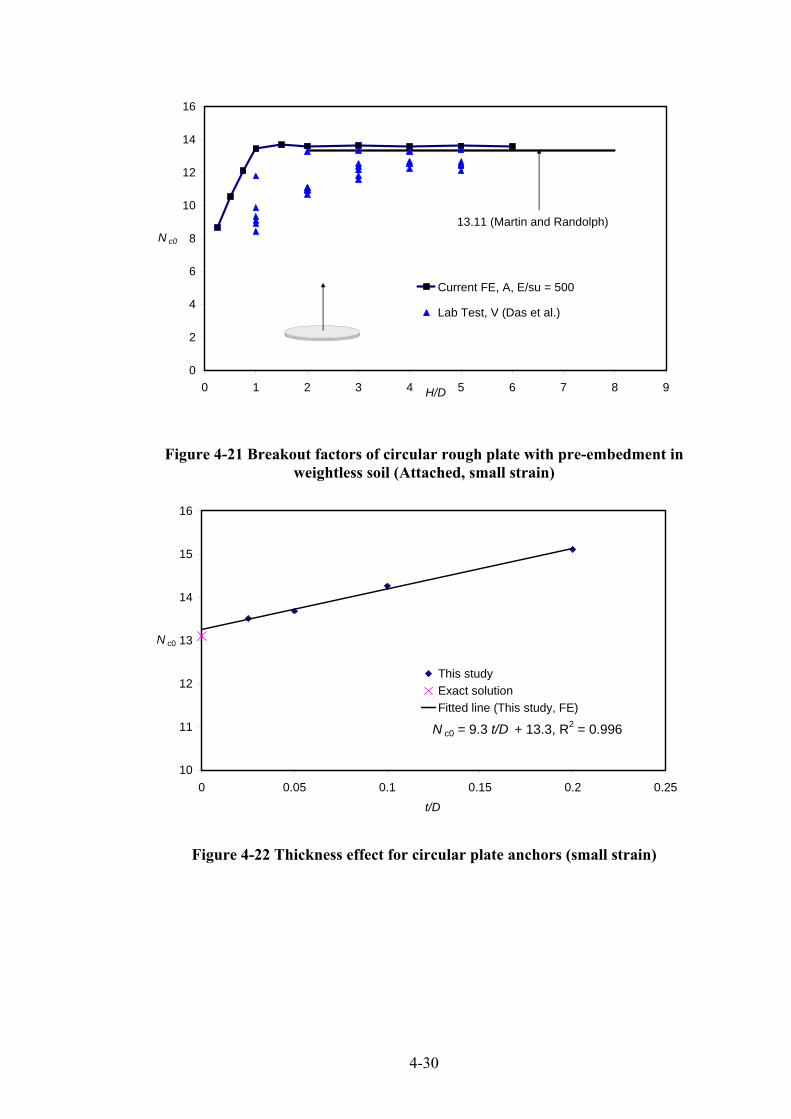
4-30
0
2
4
6
8
10
12
14
16
0 1 2 3 4 5 6 7 8 9H/D
N c0
Current FE, A, E/su = 500
Lab Test, V (Das et al.)
13.11 (Martin and Randolph)
Figure 4-21 Breakout factors of circular rough plate with pre-embedment in weightless soil (Attached, small strain)
N c0 = 9.3 t/D + 13.3, R2 = 0.996
10
11
12
13
14
15
16
0 0.05 0.1 0.15 0.2 0.25t/D
N c0
This studyExact solutionFitted line (This study, FE)
Figure 4-22 Thickness effect for circular plate anchors (small strain)

4-31
x/D0 0.5 1 1.5
4
4.2
4.4
4.6
4.8
5
5.2
5.4
z/D
Figure 4-23 Soil flow mechanism for deep embedded rough circular anchors
x/D0 0.5 1 1.5
4
4.2
4.4
4.6
4.8
5
5.2
5.4
z/D
Figure 4-24 Soil flow mechanism for deep embedded smooth circular anchors

4-32
0
2
4
6
8
10
12
14
0 1 2 3 4 5 6 7 8 9H/D
N c0
Current FE, V, E/su = 500Lab Test, V, (Das et al.)Current FE, V, E/ = 500 at 20%DCurrent FE, V, E/ = 2000 at 20%DCurrent FE, V, E/ = 10000 at 20%D
LB, V (Merifield et al.)
FE, V (Rowe and Davis)
CE, V (Yu)
su
susu
Figure 4-25 Breakout factors of circular rough plate with pre-embedment in weightless soil (Vented, small strain)
0
2
4
6
8
10
12
0 0.2 0.4 0.6 0.8 1 1.2Pullout displacement / D
q/s u
E/s u = 10000 E/s u = 2000E /s u = 500
Figure 4-26 Pullout response of circular rough plate with pre-embedment (soil stiffness effects (V, H/D = 4))

4-33
0
2
4
6
8
10
12
14
16
0 1 2 3 4 5 6 7H/D
N c0
Uniform soil
NC soil su=1.0z kPa
Figure 4-27 Non-homogeneity effect in small strain analysis for circular anchors (Attached)
0
2
4
6
8
10
12
0 1 2 3 4 5 6 7H/D
N c0
Uniform soil
NC soil su=1.0z kPa
Figure 4-28 Non-homogeneity effect in small strain analysis for circular anchors (Vented)

4-34
x/D0 0.5 1 1.5
4
5
z/D
Figure 4-29 Soil flow in NC soil for circular plate anchors
Figure 4-30 Plastic zone in NC soil for circular plate anchors
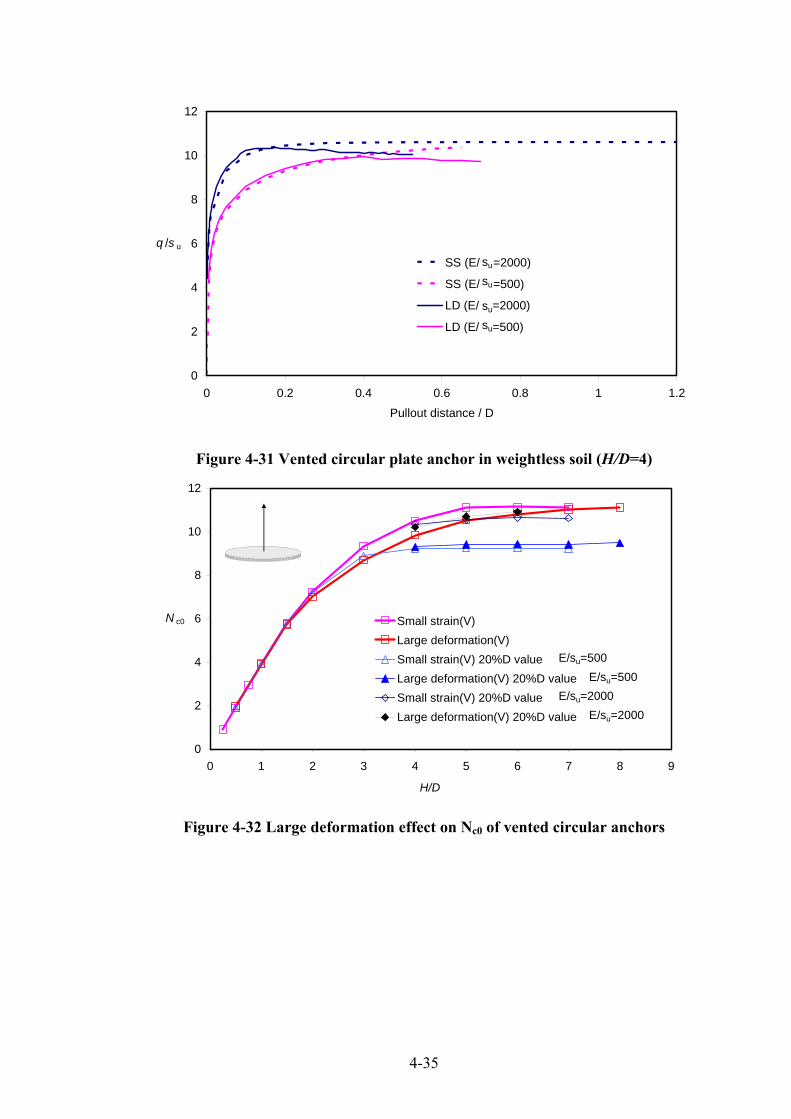
4-35
0
2
4
6
8
10
12
0 0.2 0.4 0.6 0.8 1 1.2Pullout distance / D
q /s u
SS (E/ =2000)
SS (E/ =500)
LD (E/ =2000)
LD (E/ =500)
su
su
su
su
Figure 4-31 Vented circular plate anchor in weightless soil (H/D=4)
0
2
4
6
8
10
12
0 1 2 3 4 5 6 7 8 9
H/D
N c0 Small strain(V)Large deformation(V)Small strain(V) 20%D valueLarge deformation(V) 20%D valueSmall strain(V) 20%D valueLarge deformation(V) 20%D value
E/su=500E/su=500
E/su=2000E/su=2000
Figure 4-32 Large deformation effect on Nc0 of vented circular anchors

4-36
0.00
0.20
0.40
0.60
0.80
1.00
1.20
0 2 4 6 8 10 12 14 16
q /su
H/D
HsD
H i /D = 0.5(A)H i /D = 0.5(V)H i /D = 1(A)H i /D = 1(V)
Hs
Figure 4-33 Breakout factors for continuous pullout of rough circular plate
anchors Hi/D = 0.5 and 1, su/γ’D = 0.039
0.0
0.5
1.0
1.5
2.0
2.5
0 2 4 6 8 10 12 14 16
q /s u
H/D
H SD
H s
H i /D = 0.5(A) su/γ'D = 0.065H i /D = 0.5(V) su/γ'D = 0.065H i /D = 1(A) su/γ'D = 0.065H i /D = 1(V) su/γ'D = 0.065H i /D = 2(A) su/γ'D = 0.065H i /D = 2(V) su/γ'D = 0.065
SS-A
A-curve
H i /D = 1(V) su/γ'D = 0.039
Figure 4-34 Breakout factors for continuous pullout of rough circular plate anchors
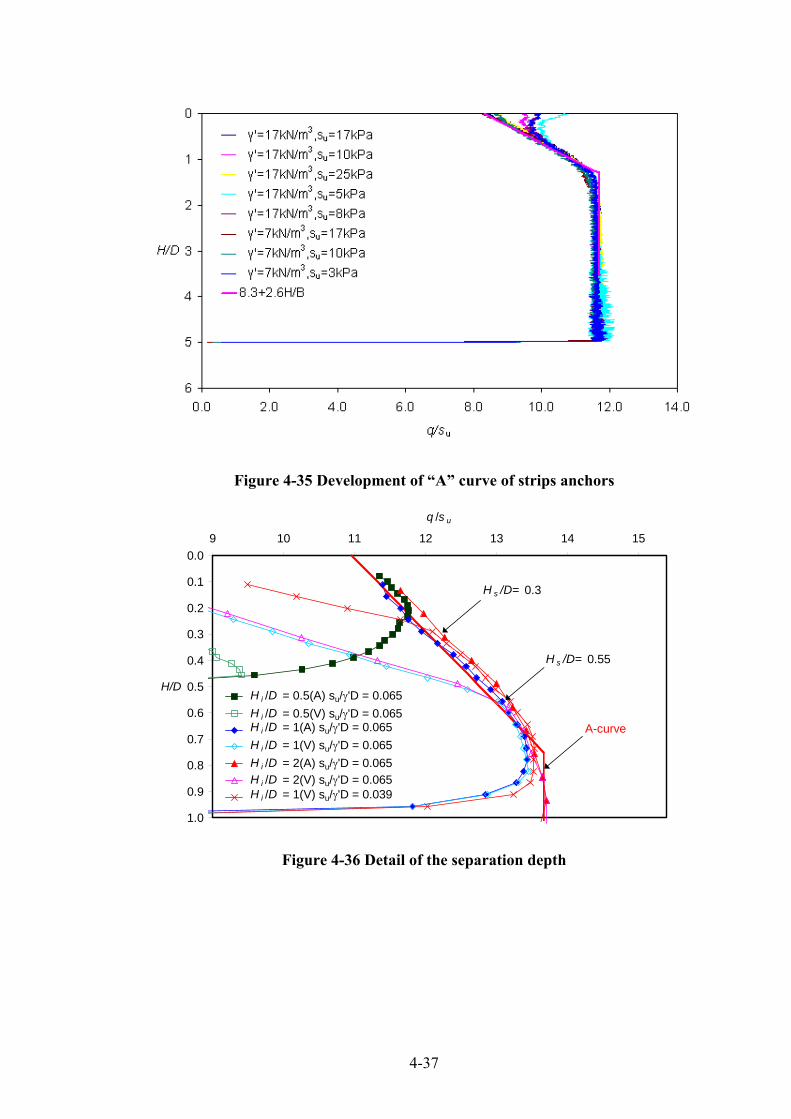
4-37
Figure 4-35 Development of “A” curve of strips anchors
0.0
0.1
0.2
0.3
0.4
0.5
0.6
0.7
0.8
0.9
1.0
9 10 11 12 13 14 15
q /s u
H/D
H s /D= 0.3
H i /D = 0.5(A) su/γ'D = 0.065H i /D = 0.5(V) su/γ'D = 0.065H i /D = 1(A) su/γ'D = 0.065H i /D = 1(V) su/γ'D = 0.065H i /D = 2(A) su/γ'D = 0.065H i /D = 2(V) su/γ'D = 0.065H i /D = 1(V) su/γ'D = 0.039
A-curve
H s /D= 0.55
Figure 4-36 Detail of the separation depth

4-38
0
1
2
3
4
5
6
7
8
9
0 0.2 0.4 0.6 0.8 1 1.2
s u/γ 'D (s u/γ'B)
H s/D(H s/B )
Circular anchor
Fitting curve(Circular)
Strip anchor
Fitting curve(Strip)
Figure 4-37 Separation embedment ratios for vented plate anchor in uniform clay
x/D0 1 2
0
1
2
z/D
Figure 4-38 Soil flow mechanisms of a deeply embedded circular anchor during continuous pullout at H/D = 0.3 (Hi/D = 2, su/γ'D = 0.065, Hs/D = 0.55, Attached
anchor)

4-39
x/D0 1 2
0
1
2
z/D
Figure 4-39 Soil flow mechanisms of a deeply embedded circular anchor during continuous pullout at H/D = 0.3 (Hi/D = 2, su/γ'D = 0.065, Hs/D = 0.55, Vented
anchor)
x/D0 1 2
0
1
2
z/D
Figure 4-40 Soil flow mechanisms of a shallowly embedded circular anchor during continuous pullout at H/D = 0.3 (Hi/D =0.5, su/γ'D = 0.065, Hs/D = 0.55,
Attached anchor)

4-40
x/D0 1 2
0
1
2
z/D
Figure 4-41 Soil flow mechanisms of a shallowly embedded circular anchor during continuous pullout at H/D = 0.3 (Hi/D =0.5, su/γ'D = 0.065, Hs/D = 0.55,
Vented anchor)
0
1
2
3
4
5
6
0 5 10 15 20 25 30 35 40 45 50
q /s u0
H/D
Current FE, A
Current FE, V
Centrifuge(V)
Centrifuge(A)
Figure 4-42 Pullout response of a circular plate anchor in NC clay from Hi/D = 5 (k/γ' = 0.076)

4-41
0
1
2
3
4
5
6
7
8
9
10
0 0.2 0.4 0.6 0.8 1 1.2 1.4
s ui / γ 'D
H s/D
Circular anchor in NC clay
Fitting curve for uniform clay
Figure 4-43 Separation depth of circular plate anchors in NC clay
5
2.5
5
7.5
10
12.5
15
17.520
x(m)0 2 4 6 8
-3
-2
-1
0
1
2
3
4
5
z(m)
Figure 4-44 Contour or original depth of circular anchor in NC clay (Attached)
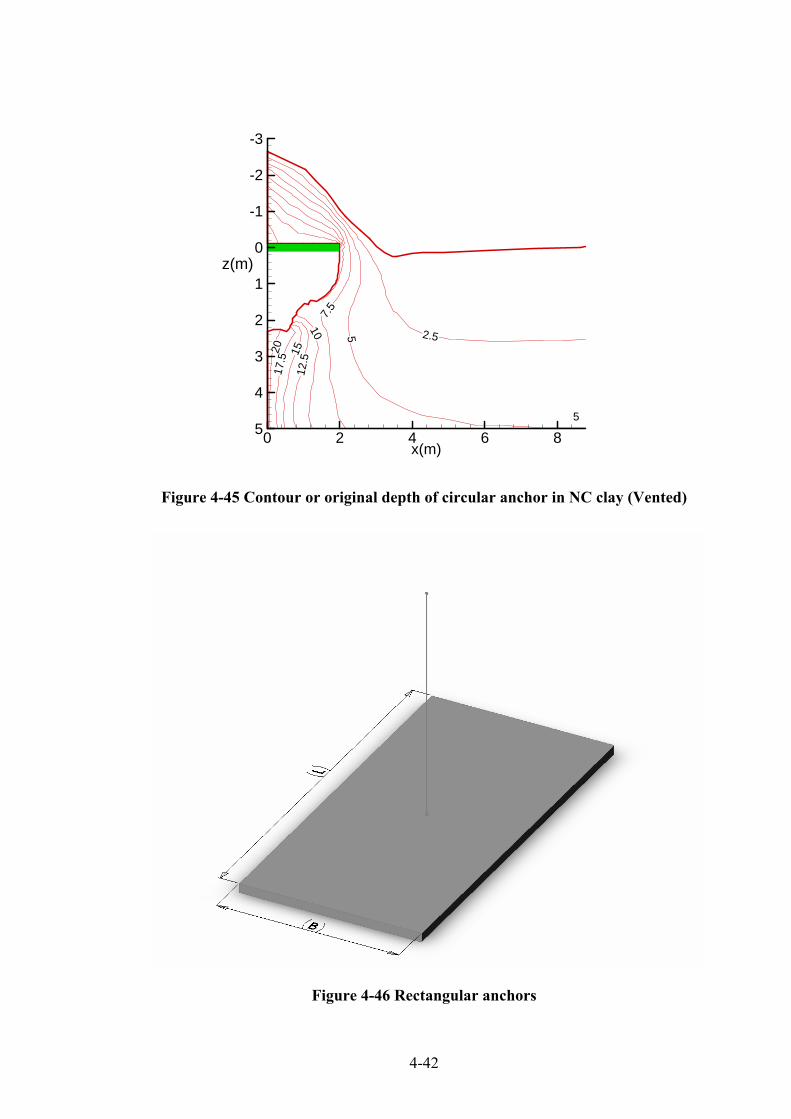
4-42
5
2.55
7.5
10
12.5
15
17.5
20
x(m)0 2 4 6 8
-3
-2
-1
0
1
2
3
4
5
z(m)
Figure 4-45 Contour or original depth of circular anchor in NC clay (Vented)
Figure 4-46 Rectangular anchors

4-43
0
2
4
6
8
10
12
14
16
0 1 2 3 4 5 6 7H/D
N c0
ABAQUS AttachedAFENA AttachedABAQUS VentedAFENA Vented
Figure 4-47 Circular plate anchor bearing capacity using ABAQUS and AFENA (small strain)
0
2
4
6
8
10
12
14
16
0 1 2 3 4 5 6H/D(H/B)
N c0
CircularRectangular L/B=1Rectangular L/B=2Rectangular L/B=3Rectangular L/B=4Rectangular L/B=5
Figure 4-48 Effect of anchor shape (Attached, small strain)

4-44
0
2
4
6
8
10
12
0 1 2 3 4 5 6H/D(H/B)
N c0CircularRectangular L/B=1Rectangular L/B=2Rectangular L/B=3Rectangular L/B=4Rectangular L/B=5
Figure 4-49 Effect of anchor shape (Vented, small strain)
0
2
4
6
8
10
12
0 1 2 3 4 5 6H/B
N c0This studyMerifield et. al. 2003Das 1980 test 1Das 1980 test 2
Figure 4-50 Square anchor (small strain)

4-45
0
2
4
6
8
10
12
0 1 2 3 4 5 6H/B
N c0
This study
Merifield et.al. 2003
Das 1980
Figure 4-51 Rectangular L/B=2 (small strain)

5-1
CHAPTER 5. INCLINED PULLOUT OF PLATE ANCHORS IN CLAY
5.1. Introduction
In the previous chapter, plate anchors under vertical pullout were studied. However,
anchors are frequently placed at orientations somewhere between horizontal and
vertical, depending on the application and design requirements, particularly offshore.
The important effect of anchor inclination has received very little attention by
researchers. The only numerical work found for inclined plate anchors is by
Merifield et al. (2005). Consideration was given to the effect of embedment ratios
and anchor inclination angles.
A limited number of results for the capacity of inclined square and strip anchors can
be found in the works of Meyerhof (1973) and Das and Puri (1989). The study of
Das and Puri (1989) appears to be the most significant experimental attempt to
quantify the capacity of inclined anchors. In their tests, the capacity of shallow
square anchors embedded in compacted clay with an average undrained shear
strength of 42 kPa was investigated. Pullout tests were conducted on anchors at
inclinations ranging between 0° (horizontal) and 90° (vertical) for embedment ratios
(H/B) of up to four. A simple empirical relationship was suggested for predicting the
capacity of square anchors at any orientation which compared reasonably well with
the laboratory observations. Das and Puri (1989) also concluded that anchors with
aspect ratios (L/B) of 5 or greater would, for all practical purposes, behave as a strip
anchor.
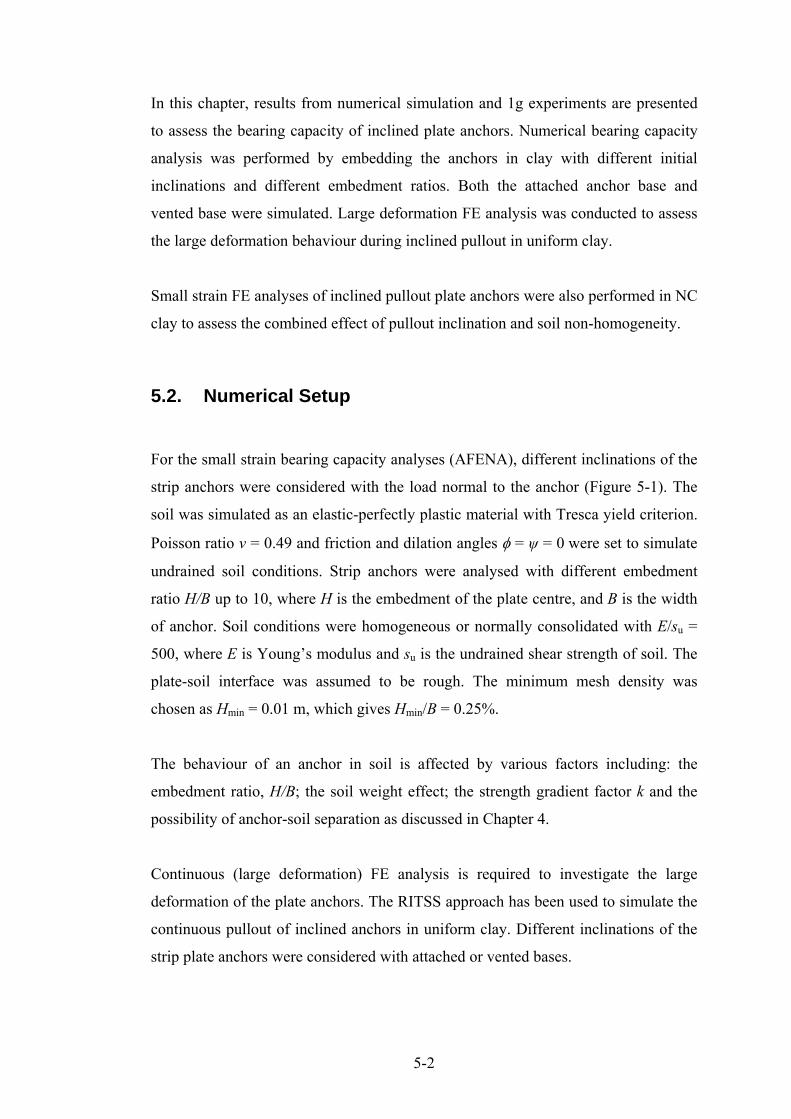
5-2
In this chapter, results from numerical simulation and 1g experiments are presented
to assess the bearing capacity of inclined plate anchors. Numerical bearing capacity
analysis was performed by embedding the anchors in clay with different initial
inclinations and different embedment ratios. Both the attached anchor base and
vented base were simulated. Large deformation FE analysis was conducted to assess
the large deformation behaviour during inclined pullout in uniform clay.
Small strain FE analyses of inclined pullout plate anchors were also performed in NC
clay to assess the combined effect of pullout inclination and soil non-homogeneity.
5.2. Numerical Setup
For the small strain bearing capacity analyses (AFENA), different inclinations of the
strip anchors were considered with the load normal to the anchor (Figure 5-1). The
soil was simulated as an elastic-perfectly plastic material with Tresca yield criterion.
Poisson ratio ν = 0.49 and friction and dilation angles φ = ψ = 0 were set to simulate
undrained soil conditions. Strip anchors were analysed with different embedment
ratio H/B up to 10, where H is the embedment of the plate centre, and B is the width
of anchor. Soil conditions were homogeneous or normally consolidated with E/su =
500, where E is Young’s modulus and su is the undrained shear strength of soil. The
plate-soil interface was assumed to be rough. The minimum mesh density was
chosen as Hmin = 0.01 m, which gives Hmin/B = 0.25%.
The behaviour of an anchor in soil is affected by various factors including: the
embedment ratio, H/B; the soil weight effect; the strength gradient factor k and the
possibility of anchor-soil separation as discussed in Chapter 4.
Continuous (large deformation) FE analysis is required to investigate the large
deformation of the plate anchors. The RITSS approach has been used to simulate the
continuous pullout of inclined anchors in uniform clay. Different inclinations of the
strip plate anchors were considered with attached or vented bases.

5-3
5.3. 1g Experimental Setup in Uniform Clay
One g small-scale floor tests in Kaolin clay were carried out at The University of
Western Australia’s Centre for Offshore Foundation Systems (COFS).
The square VDPA plate anchors and the installation device mentioned in Chapter 3
were used in the 1g test to embed the anchor accurately to the desired depth. The
anchors were installed at a rate of 1 mm/s vertically down, to allow an undrained
penetration. Once the anchor was embedded to the desired depth, retraction of the
installing bar was accomplished.
The test layout consists of a pulley system to extract the anchor at an angle. Figure
5-2 illustrates the pulley system and the orientation of the actuators, whilst Figure
5-3 shows the pulley. The configuration allowed the horizontal axis to be utilised for
a horizontal travel of 240 mm as a part of the pull out distance. The pullout angle is
chosen as β = 25°, 45° and 65° respectively. The actuator could move horizontally
and vertically in order to get the maximum displacement.
Two load cells located on the chain, one close to the anchor and another on the
actuator, monitored the force during continuous pullout, while two transducers
measured displacement of the actuator from which the anchor displacement could be
determined.
Four floor tests were conducted. Table 5-1 contains an overview of the type of test,
soil profile and anchor pullout details.
The locations of the T-bar tests and anchor installation had to be positioned so that
one test would not affect another test through soil disturbance. Figure 5-4 and Figure
5-5 show the arrangement for these tests and layout of the T-bars.
After the test was complete, the soil was cut with a special soil-cutting tool by
aligning the cut along the expected anchor path on plane (lining up the cutting tool

5-4
with the edge pulley and anchor installation site) and removing the cut-off portion,
thus revealing a cross section of the anchor’s path.
5.4. Inclined Pullout of Strip Plate Anchors in Uniform Clay
5.4.1. Numerical Results
5.4.1.1. Weightless Soil
The small strain FE results for the anchors with different inclination are shown in
Figure 5-6 and Figure 5-7 in terms of the breakout factor, for both attached anchor
and vented anchor bases. Soil weight was not included in these analyses, although it
does not affect the results for the attached plate anchors. However, ignoring self-
weight will trigger the immediate separation and lead to the underestimation of the
capacities of the vented anchors.
The pullout capacity increases with increasing embedment ratio H/B shown in Figure
5-6 for the attached plate anchors. The pullout capacity reaches a limit when a deep
and localised failure mechanism is formed at a critical embedment ratio (HSD/B),
where HSD/B = 3. For embedment ratio H/B ≥ 3, there is no effect from the inclined
pullout angle, the limiting breakout factor is Nc = 11.7, which is 2% greater than the
exact solution of 11.42. With embedment ratio H/B < 3, the pullout capacity factor
decreases with increasing β. This means that at the same embedment depth, a vertical
plate anchor (β = 90°) with horizontal loading shows the lowest pullout capacity and
a horizontal plate anchor (β = 0°) with vertical loading shows the highest pullout
capacity. This can also explained by comparing Figure 5-8 and Figure 4-12 with the
plastic zones. However, the difference in pullout capacity is small for β varying from
90° to 67.5°.
Figure 5-8 and Figure 5-9 indicate that the failure mechanism for vertical anchors is
almost asymmetrical around the anchor. For anchors with H/B > 3, the failure
mechanism becomes fully localised around the anchor and is unaffected by the

5-5
position of the soil surface and this also applies to inclined pullout anchors found in
Figure 5-10 as well.
By contrast, with the attached plate anchors, the pullout capacities of the vented plate
anchors (Figure 5-7) show no limiting breakout factor with the embedment ratio up
to 8. This can be explained by the difference in flow mechanisms shown in Figure
5-9 and Figure 5-11 for vertical anchors and Figure 5-10 and Figure 5-12 for inclined
anchors (β = 45°) at same embedment depth H/B = 5. For the attached plate anchor
(Figure 5-9 and Figure 5-10), a fully localised flow mechanism is formed. However,
for the vented plate anchor embedded at the same depth (H/B = 5, Figure 5-11 and
Figure 5-12), a cavity expansion flow to the surface is evident. For embedment ratios
H/B < 5, the vented plate anchor shows an increasing pullout capacity with
increasing inclination angle (β). This is again contrary to the observations from the
attached anchors. For a given embedment depth with H/B < 5, a vertical plate anchor
shows the highest pullout capacity and a horizontal plate anchor shows the lowest
capacity. This is again due to the size of the plastic zone in Figure 5-11 and Figure 4-
18. This observation is consistent with the laboratory study by Das and Puri (1989),
noting that in both studies the soil weight was either ignored (as here) or was
negligible (small scale, 1g tests). Figure 5-7 also suggests that there is very little
difference in pullout capacities between a horizontal anchor (β = 0°) and an inclined
anchor with β = 22.5° once the plate base is vented.
At an embedment ratio of one, the vented anchor behaves essentially as a simple
retaining wall structure (Figure 5-13). This find is consistent with the results by
Merifield (2002). The failure mechanism consists primarily of a rigid triangular
wedge which moves at an angle of approximately 45° to the horizontal with the zone
of plastic shearing being entirely above the base of the anchor. Therefore the anchor
capacity and mode of failure can be compared to the results of a passive wedge
analysis, which is typically performed when solving earth pressure problems.
The plastic zones for attached and vented plate anchors are shown in Figure 5-14,
Figure 5-15, Figure 5-16 and Figure 5-17, Figure 5-18, Figure 5-19 respectively. The
extent of surface deformations increases with increasing embedment depth (Figure
5-17 and Figure 5-18). The failure mechanism is more complex and involves some

5-6
yielding of the material below the base of the deeply embedded anchor (Figure 5-18).
The lateral extent of surface deformation also increases with increasing inclination
angle (Figure 5-19). The failure mechanisms can also be used to explain the breakout
factors difference in Figure 5-6 and Figure 5-7.
The breakout factors for the vented plate anchors are compared with the lower and
upper bound solutions from (Merifield et al. 2005) in Figure 5-21 and Figure 5-22 for
β of 45° and 22.5°. The current FE results fall between the lower bound and upper
bound solutions for H/B < 7, beyond which they are little higher than the upper
bound solution for β = 22.5°. This is because the Merifield et al. (2005) results are
for a rigid-plastic soil, whereas the present results model elastic strains.
5.4.1.2. Soil Weight Effect
Soil weight (or overburden pressure) has an important effect on the plate anchor
breakout factor. Merifield et al. (2003) indicated that the effects of initial stresses in
the soil due to self-weight can be accounted for by increasing the breakout factor by
σ’v/su where σ’v is the initial normal stress on the rear face of the anchor. Chapter 4
has investigated soil weight effect for horizontal plate anchors with vertical pullout.
Soil weight effect for inclined plate anchors will be investigated in this section.
Figure 5-23 shows the results for inclined plate anchors with vented base embedded
in soil with normalised strength ratio su/γ'B = 0.074. The plate anchor shows the
same behaviour as fully attached base results. According to the separation depth
theory introduced in Chapter 4, the separation depth in this case is Hs/B = 0.47. This
explains why the anchors show fully attached anchor behaviour as all the anchors
were embedded with H/B > 0.47. Figure 5-24 shows the results for plate anchors
embedded in soil with higher normalised strength ratio su/γ'B = 0.221. For the
anchors deeply embedded (H/B ≥ 2), the anchors show fully attached anchor
behaviour and the anchors embedded with H/B < 2 show vented anchor behaviour.
This indicates that the anchors separate at an embedment ratio between H/B = 1 and
H/B = 2, while the separation depth ratio by Equation 4-5b indicates that Hs/B = 1.41.
Figure 5-25, Figure 5-26 and Figure 5-27 shows yet some other results with even

5-7
higher su/γ'B = 0.357, 0.536 and 0.893. And separation depth ratios for these three
anchors are Hs/B = 2.29, 3.43 and 5.72 respectively. For the anchor with su/γ'B =
0.893. All of the anchors show breakout factors less than 11.7, which indicates that
all the anchors have a vented base, and the separation depth of this anchor is 5.72
according to the estimation by Equation 4-5b. Thus the separation depth of the
inclined plate anchors can be estimated by the equation from vertical pullout plate
anchors. For anchors embedded deeper than this depth, the bearing capacities of
anchors can be calculated by the fully attached anchors. And the anchors embedded
shallower than this depth will show vented anchor behaviour.
5.4.1.3. Large Deformation Results
Figure 5-28 shows the results from the large deformation analysis to confirm the
conclusion made in the last section. Two anchors embedded at the same initial
embedment ratio Hi/B =5 with su/γ'B = 0.174 were embedded with different
inclination angles β = 45° and β = 22.5°. The anchors were pulled out with the
constant inclination angle by displacement control large deformation FE analysis.
Initially, the two anchors showed the same bearing capacity factors until an
embedment ratio of HSD/B = 1.7. Then the bearing capacities dropped for both of the
anchors. But the anchor with pullout angle β = 22.5° drops slower than the one with
pullout angle β = 45° and then faster when H/B < 0.9. At H/B < 0.9, the two curves
join together and crossed over each other, which indicated a separation depth of Hs/B
= 0.9. During the rest of the pullout, the anchor with pullout angle β = 45° showed
higher bearing capacity factor than the one with β = 22.5°. The separation depth
given by Equation 4-5b is Hs/B = 0.94 for this case. The difference may be due to
different surface heave generated during the large deformation pullout. Figure 5-29
shows another example with su/γ'B = 0.368. Separation depth agrees well with
estimation using Equation 4-5b.
5.4.2. Experimental results
Soil characterisation tests were performed using a T-bar penetrometer (Stewart and
Randolph 1994). Figure 5-30 to Figure 5-33 show the T-bar test results from the four

5-8
1g tests respectively. The average shear strength of the soils is 6.35 kPa, 6.3 kPa,
11.6 kPa and 9.5 kPa respectively.
Figure 5-34 shows the breakout factor of square plate anchors with different pullout
angles. By comparing the breakout factors with numerical results for vertical pullout
vented square plate anchors in Chapter 4, it can be seen clearly that the current tests
show a vented anchor base. For anchors with vented base pullout, the breakout factor
can be calculated using Equation (5-1) so as to eliminate the effect of the soil plug
above the anchor (Das 1978). The soil plug can be seen clearly in Figure 5-35 to
Figure 5-38 when the sample was bisected after the anchor pullout test. The cavity
formed in the soil proves that there is no suction evident during anchor pullout.
Calculation of breakout factors is shown below:
u
u
u
u
c s
HAQ
s
WAQ
Nβγβ 2
0
sinsin −=
−= (5-1)
where W is the weight of soil plug above the plate anchor.
It can be seen from Figure 5-34 that the breakout factors for anchors for all pullout
angles reach Nc0 = 8.8 (average). At very shallow embedment (H/B < 2), the 25°
pullout plate anchor has the highest bearing capacity and the 65° pullout has the
lowest bearing capacity. This finding is consistent with the conclusion in the last
section for strip plate anchors. The 3D numerical results were obtained using
ABAQUS (HKS 2005) for horizontal plate anchors. The results for a vented plate
anchor in Figure 5-34 show the same trend as the experimental results. However, the
breakout factor from the numerical study is Nc0 = 10.5 at H/B = 5, which is a little
higher than the experimental results; this is because the numerical analysis starts
from the anchor in position without rotational effect. While in experiments, the
anchor was installed vertically, thus the anchor needs to rotate first before reaching
the full capacity. The rotational effect will be discussed in chapter 6.
The square anchor results are also compared with the small scale test of Das and Puri
(1989) in Figure 5-39. It can be observed that for a deeply embedded plate anchor
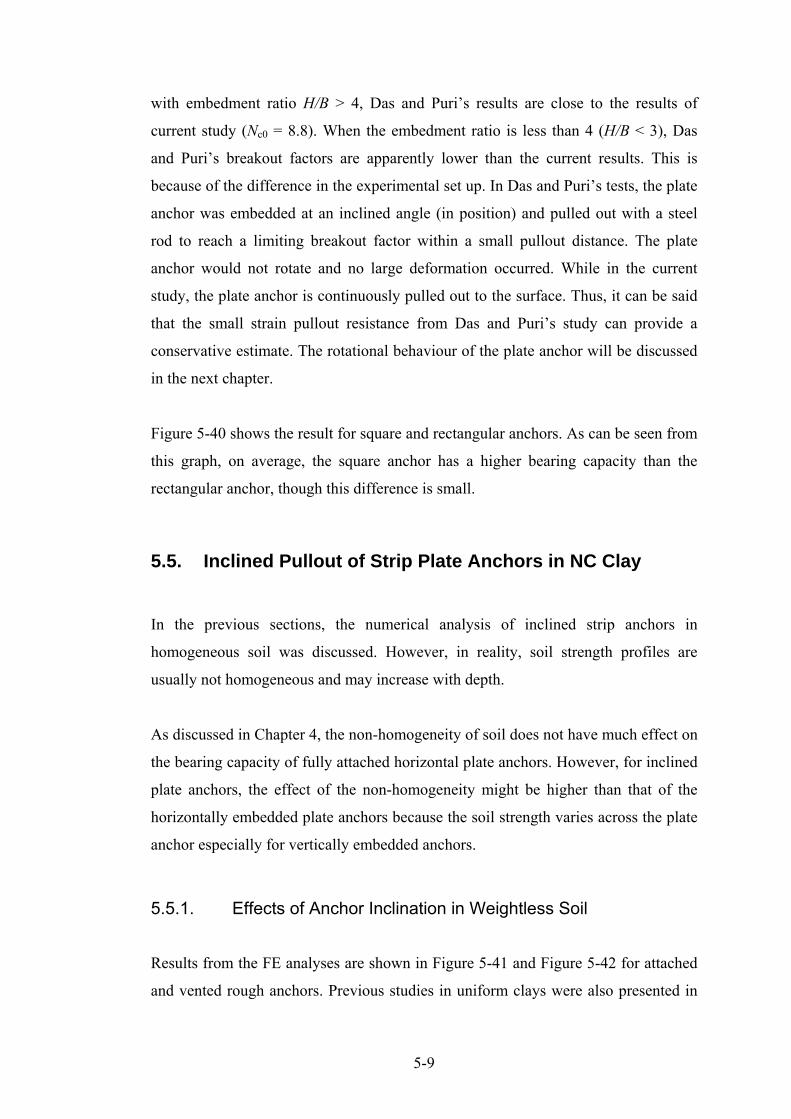
5-9
with embedment ratio H/B > 4, Das and Puri’s results are close to the results of
current study (Nc0 = 8.8). When the embedment ratio is less than 4 (H/B < 3), Das
and Puri’s breakout factors are apparently lower than the current results. This is
because of the difference in the experimental set up. In Das and Puri’s tests, the plate
anchor was embedded at an inclined angle (in position) and pulled out with a steel
rod to reach a limiting breakout factor within a small pullout distance. The plate
anchor would not rotate and no large deformation occurred. While in the current
study, the plate anchor is continuously pulled out to the surface. Thus, it can be said
that the small strain pullout resistance from Das and Puri’s study can provide a
conservative estimate. The rotational behaviour of the plate anchor will be discussed
in the next chapter.
Figure 5-40 shows the result for square and rectangular anchors. As can be seen from
this graph, on average, the square anchor has a higher bearing capacity than the
rectangular anchor, though this difference is small.
5.5. Inclined Pullout of Strip Plate Anchors in NC Clay
In the previous sections, the numerical analysis of inclined strip anchors in
homogeneous soil was discussed. However, in reality, soil strength profiles are
usually not homogeneous and may increase with depth.
As discussed in Chapter 4, the non-homogeneity of soil does not have much effect on
the bearing capacity of fully attached horizontal plate anchors. However, for inclined
plate anchors, the effect of the non-homogeneity might be higher than that of the
horizontally embedded plate anchors because the soil strength varies across the plate
anchor especially for vertically embedded anchors.
5.5.1. Effects of Anchor Inclination in Weightless Soil
Results from the FE analyses are shown in Figure 5-41 and Figure 5-42 for attached
and vented rough anchors. Previous studies in uniform clays were also presented in

5-10
Figure 5-41 and Figure 5-42 for comparison. The capacity factor in NC clay has been
defined as:
ua
u
ua
ucc As
Qsq
NN ==)(0 (5-2)
where sua is the shear strength at the centre of the anchor; Nc0 represents capacity
factor in weightless soil and Nc represents capacity factor in soil with weight.
Similar to results in uniform clay, the horizontally embedded plate anchors in NC
clay have the highest bearing capacity for fully attached anchors and the vertically
embedded anchors show highest bearing capacity if the anchor base is vented.
From Figure 5-41, it can be seen that the capacity factors for anchors in NC clay are
always less than those in uniform clay. The degree of non-homogeneity of the clay
around the anchor can be defined as: (sut – sub)/sua, where sut and sub are undrained
shear strengths at the top and bottom edges of the plate anchor. This can also be
expressed as kB×sinβ/sua = B×sinβ/Hi, where kB×sinβ/sua = 0 for uniform soil and
horizontal anchor in NC clay.
For anchors at the same embedment depth, the difference in the capacity factors
between anchors in uniform clay and NC clay increase with increasing β. This means
a vertical anchor (β = 90°) with horizontal loading has the highest difference as the
non-homogeneity of the shear strength distribution around a vertical anchor is most
significant among the anchors. In addition, the critical depth of the plate anchors
increase with the increasing β, with the critical depths HSD/B = 3 for horizontal
anchors and HSD/B = 9 for vertical plate anchors respectively.
Figure 5-43 and Figure 5-44 show the flow mechanism for an attached horizontal
anchor and an inclined anchor (β = 45°) respectively. By comparing the flow
mechanisms in Figure 5-9 and Figure 5-10, it is noted that they all have a localised
flow mechanism, though the flow mechanism in NC clay has a centre at the top at the
anchor, rather than at the centre of the anchor. Since the soil failure zone moved
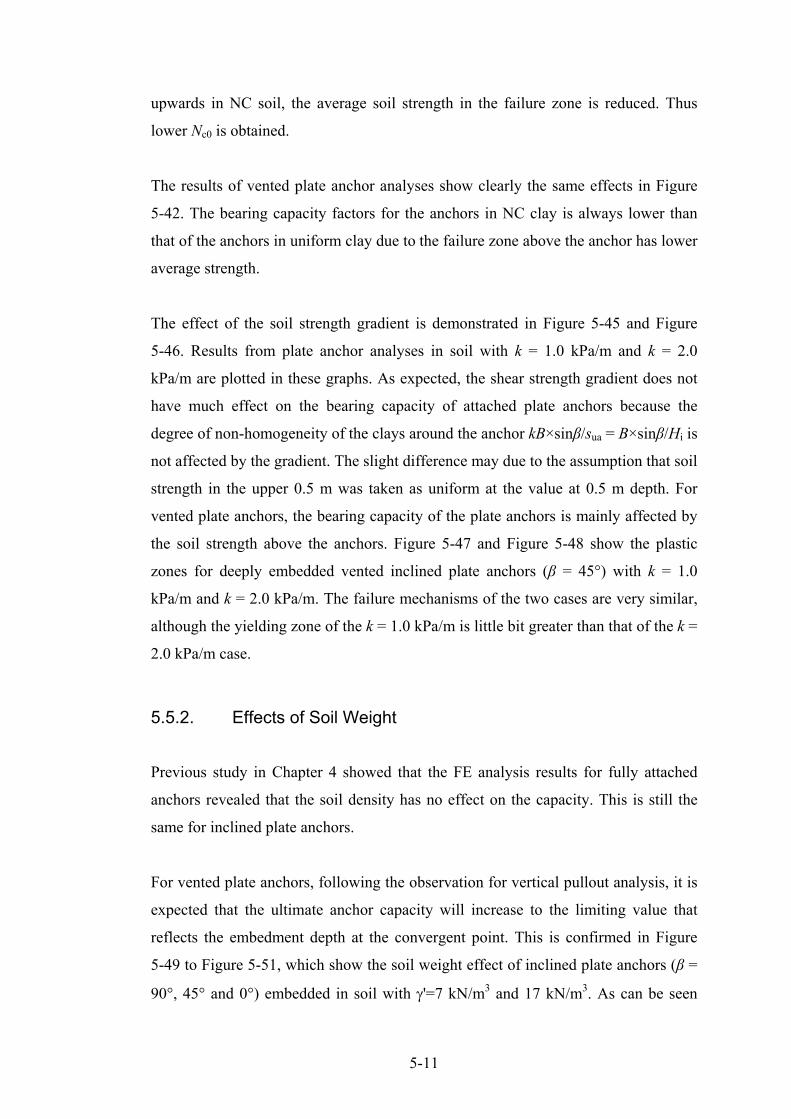
5-11
upwards in NC soil, the average soil strength in the failure zone is reduced. Thus
lower Nc0 is obtained.
The results of vented plate anchor analyses show clearly the same effects in Figure
5-42. The bearing capacity factors for the anchors in NC clay is always lower than
that of the anchors in uniform clay due to the failure zone above the anchor has lower
average strength.
The effect of the soil strength gradient is demonstrated in Figure 5-45 and Figure
5-46. Results from plate anchor analyses in soil with k = 1.0 kPa/m and k = 2.0
kPa/m are plotted in these graphs. As expected, the shear strength gradient does not
have much effect on the bearing capacity of attached plate anchors because the
degree of non-homogeneity of the clays around the anchor kB×sinβ/sua = B×sinβ/Hi is
not affected by the gradient. The slight difference may due to the assumption that soil
strength in the upper 0.5 m was taken as uniform at the value at 0.5 m depth. For
vented plate anchors, the bearing capacity of the plate anchors is mainly affected by
the soil strength above the anchors. Figure 5-47 and Figure 5-48 show the plastic
zones for deeply embedded vented inclined plate anchors (β = 45°) with k = 1.0
kPa/m and k = 2.0 kPa/m. The failure mechanisms of the two cases are very similar,
although the yielding zone of the k = 1.0 kPa/m is little bit greater than that of the k =
2.0 kPa/m case.
5.5.2. Effects of Soil Weight
Previous study in Chapter 4 showed that the FE analysis results for fully attached
anchors revealed that the soil density has no effect on the capacity. This is still the
same for inclined plate anchors.
For vented plate anchors, following the observation for vertical pullout analysis, it is
expected that the ultimate anchor capacity will increase to the limiting value that
reflects the embedment depth at the convergent point. This is confirmed in Figure
5-49 to Figure 5-51, which show the soil weight effect of inclined plate anchors (β =
90°, 45° and 0°) embedded in soil with γ'=7 kN/m3 and 17 kN/m3. As can be seen

5-12
from these graphs, all plate anchors embedded in soil with soil weight γ'=17 kN/m3
show a fully attached plate anchor behaviour as expected because they have a lower
ratio of k/ γ'. However, the anchors embedded in soil with soil weight γ'=7 kN/m3
does not show the same behaviour for anchors with different inclination angles.
Obviously, the horizontal anchor (β = 0°) with vertical pullout has the highest
possibility of separation from the soil while the vertical anchor (β = 90°) with
horizontal pullout has the lowest possibility of separation. This can be explained by
the soil flow mechanism around the anchors. For a vertical anchor, because the soil
flow mechanism has a flow centre at the top of the anchor (Figure 5-43), the
separation is more difficult as the soil strength is lower at this depth.
Figure 5-52 compares the inclined pullout anchor results for vented plate anchors in
NC clay with those of anchors in uniform clay with two normalised strength ratio
su/γ'B = 0.36 and 0.89. As can be seen from this graph, when the anchor is embedded
shallowly, the separation depth is closer to the normalised strength ratio su/γ'B = 0.36.
As the embedment depth approaches the deep embedment depth, the separation
depth approaches that of su/γ'B = 0.89. This can be explained by the low shear
strength at lower embedment, which has been demonstrated in Chapter 4.
5.6. Conclusions
In this chapter, the bearing capacities of inclined plate anchors in uniform and NC
clay were accessed by small strain and large deformation FE analysis.
It was found that the bearing capacities of inclined plate anchors are affected with
both the inclination angle and the base conditions. For fully attached plate anchors,
the horizontally embedded plate anchors have the highest bearing capacity while the
vertically embedded anchors show the highest bearing capacity if the anchor base is
vented.
5-13
The soil weight plays an important role in the bearing capacity analysis. The
separation depth of the plate anchors can be assessed by the simple equation from
vertically pulled out plate anchors.
The extent of surface deformations increase with increasing embedment depth. The
failure mechanism is more complex and involves some yielding of the material
below the base of the deeply embedded anchor. The lateral extent of surface
deformation also increases with increasing inclination angle.
In the 1g test, it can clearly be seen that the current tests show a vented anchor base.
At very shallow embedment (H/B < 2), the 25° pullout plate anchor has the highest
bearing capacity and the 65° pullout has the lowest bearing capacity and generally
the square anchor has a higher bearing capacity than the rectangular anchor.
In NC clay, it can be seen that the capacity factors for anchors in NC clay are always
less than those in uniform clay. For anchors at the same embedment depth, the
difference in the capacity factors between anchors in uniform clay and NC clay
increases with increasing β. Normally, the flow mechanism in NC clay has a centre
at the top at the anchor, rather than at the anchor centre.

5-14
Table 5-1 Summary of testing details in 1g tests (Hi/B=5)
Characteristics Test 1 Test 2 Test 3 Test 4
Test Type Floor Floor Floor Floor
Soil Profile Soft Soft Hard Hard
Soil weight, γ' 17 17 17 17
Shear Strength, su
(kPa) 6.35 6.3 11.6 9.5
Number of Pullouts 2 4 2 4
Pullout Angle(s) ° 65 25, 45 65 25, 45
Anchor dimensions
L=40mm ,
B=40mm;
And
L=60mm
B=40mm
L=40mm ,
B=40mm;
And
L=60mm
B=40mm
L=40mm ,
B=40mm;
And
L=60mm
B=40mm
L=40mm ,
B=40mm;
And
L=60mm
B=40mm

5-15
Figure 5-1 Numerical analysis setup
β Kaolin clay
ChainLoad cell
Load cell
H
Figure 5-2 1g testing setup
5-16
Figure 5-3 Pulley
Figure 5-4 Testing arrangement for 65° pullout

5-17
Figure 5-5 Testing arrangement for 45° and 25° pullout
0
2
4
6
8
10
12
14
0 1 2 3 4 5 6H/B
N c0β = 0°, 22.5°, 45°, 67.5°, 90°
β
Figure 5-6 Bearing capacities of inclined strip plate anchors - Attached plate
anchors (Weightless soil, small strain)

5-18
0
1
2
3
4
5
6
7
8
9
0 2 4 6 8 10 12H/B
N c0β = 90°, 67.5°, 45°, 22.5°, 0°
β
Figure 5-7 Bearing capacities of inclined strip plate anchors - Vented plate anchors (Weightless soil, small strain)
x/D3 4 5 6
0
1
2
3
z/D
Figure 5-8 Flow mechanisms for vertical strip plate anchor - Attached plate anchor (H/B=1, small strain, β = 90°)

5-19
x/D3 4 5 6 7
3
3.5
4
4.5
5
5.5
6
6.5
7
z/D
Figure 5-9 Flow mechanisms for vertical strip plate anchor - Attached plate anchor (H/B=5, small strain, β = 90°)
x/D3 3.5 4 4.5 5 5.5 6 6.5 7
2.5
3
3.5
4
4.5
5
5.5
6
6.5
z/D
Figure 5-10 Flow mechanisms for inclined strip plate anchor - Attached plate anchor (H/B=5, small strain, β = 45°)

5-20
x/D3 4 5 6 7
3
3.5
4
4.5
5
5.5
6
6.5
7
z/D
Figure 5-11 Flow mechanisms for vertical strip plate anchor - Vented plate anchor (H/B=5, small strain, β = 90°)
x/D3 3.5 4 4.5 5 5.5 6 6.5 7
2.5
3
3.5
4
4.5
5
5.5
6
6.5
z/D
Figure 5-12 Flow mechanisms for the inclined plate anchor - Vented plate anchor (H/B=5, small strain, β = 45°)

5-21
x/D3 4 5 6
0
1
2
3
z/D
Figure 5-13 Flow mechanisms for the vertical plate anchor - Vented plate anchor (H/B=1, small strain, β = 90°)
Figure 5-14 Plastic zone for vertical strip plate anchor - Attached plate anchor
(H/B=5, β = 90°)

5-22
Figure 5-15 Plastic zone for vertical strip plate anchor - Attached plate anchor
(H/B=5, β = 45°)
Figure 5-16 Plastic zone for vertical strip plate anchor - Attached plate anchor
(H/B=5, β = 0°)

5-23
Figure 5-17 Plastic zone for vertical strip plate anchor - Vented plate anchor (H/B=1, β = 90°)
Figure 5-18 Plastic zone for vertical strip plate anchor - Vented plate anchor (H/B=5, β = 90°)
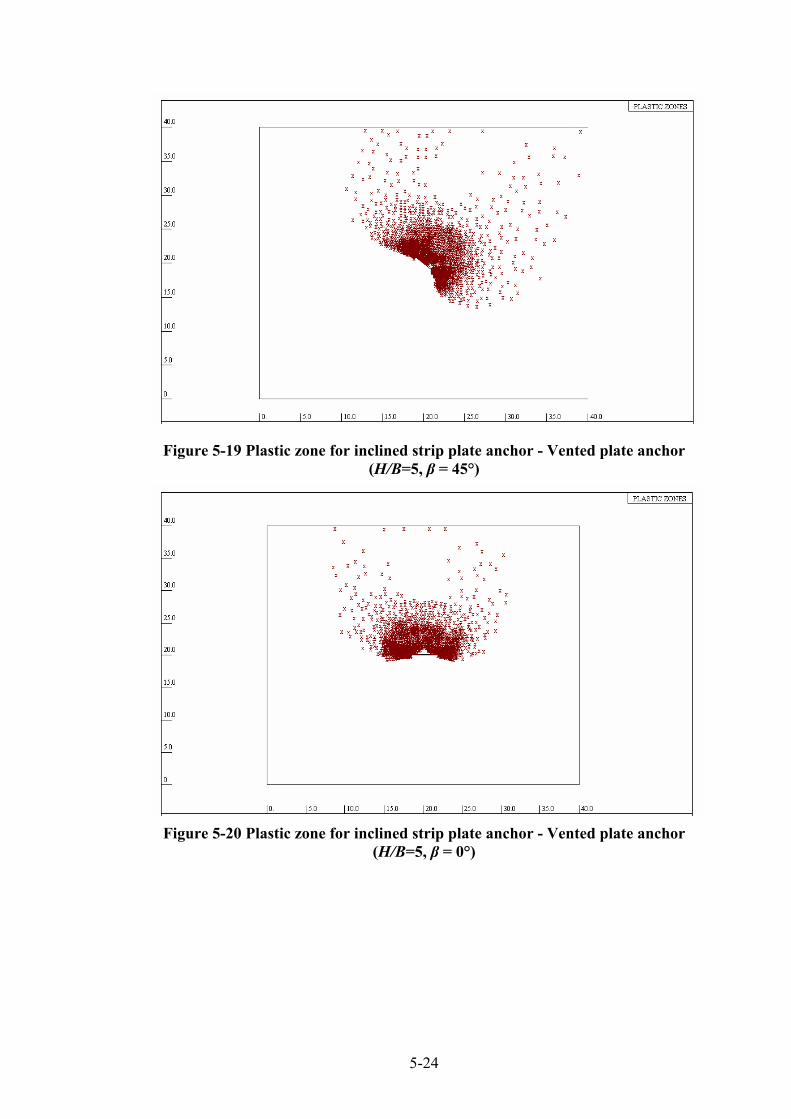
5-24
Figure 5-19 Plastic zone for inclined strip plate anchor - Vented plate anchor (H/B=5, β = 45°)
Figure 5-20 Plastic zone for inclined strip plate anchor - Vented plate anchor
(H/B=5, β = 0°)

5-25
0
1
2
3
4
5
6
7
8
9
0 2 4 6 8 10 12H/B
N c0
This study
Merifield et al. (45°LB)
Merifield et al. (45°UB)β
Figure 5-21 Pullout capacity comparison with the results from Merifield et al. (2005) for vented strip plate anchors - β = 45°
0
1
2
3
4
5
6
7
8
9
0 2 4 6 8 10 12H/B
N c0
This study
Merifield et al. (22.5°LB)
Merifield et al. (22.5°UB)β
Figure 5-22 Pullout capacity comparison with the results from Merifield et al. (2005) for vented strip plate anchors - β = 22.5°

5-26
0
2
4
6
8
10
12
14
0 1 2 3 4 5 6H/B
N c
H s/B = 0.47
β = 0°, 22.5°, 45°, 67.5°, 90°
β
Figure 5-23 Vented strip plate anchor soil weight effect - su/γ'B = 0.074
0
2
4
6
8
10
12
14
0 1 2 3 4 5 6H/B
N c
H s/B = 1.41
β = 0°, 22.5°, 45°, 67.5°, 90°
β
Figure 5-24 Vented strip plate anchor soil weight effect - su/γ'B = 0.221

5-27
0
2
4
6
8
10
12
14
0 1 2 3 4 5 6H/B
N c
β = 90°,67.5°, 45°, 22.5°, 0°
Hs/B =2.29
β
Figure 5-25 Vented strip plate anchor soil weight effect - su/γ'B = 0.357
0
2
4
6
8
10
12
14
0 1 2 3 4 5 6H/B
N c
β = 90°, 67.5°, 45°, 22.5°, 0°
H s/B = 3.43
β
Figure 5-26 Vented strip plate anchor soil weight effect - su/γ'B = 0.536
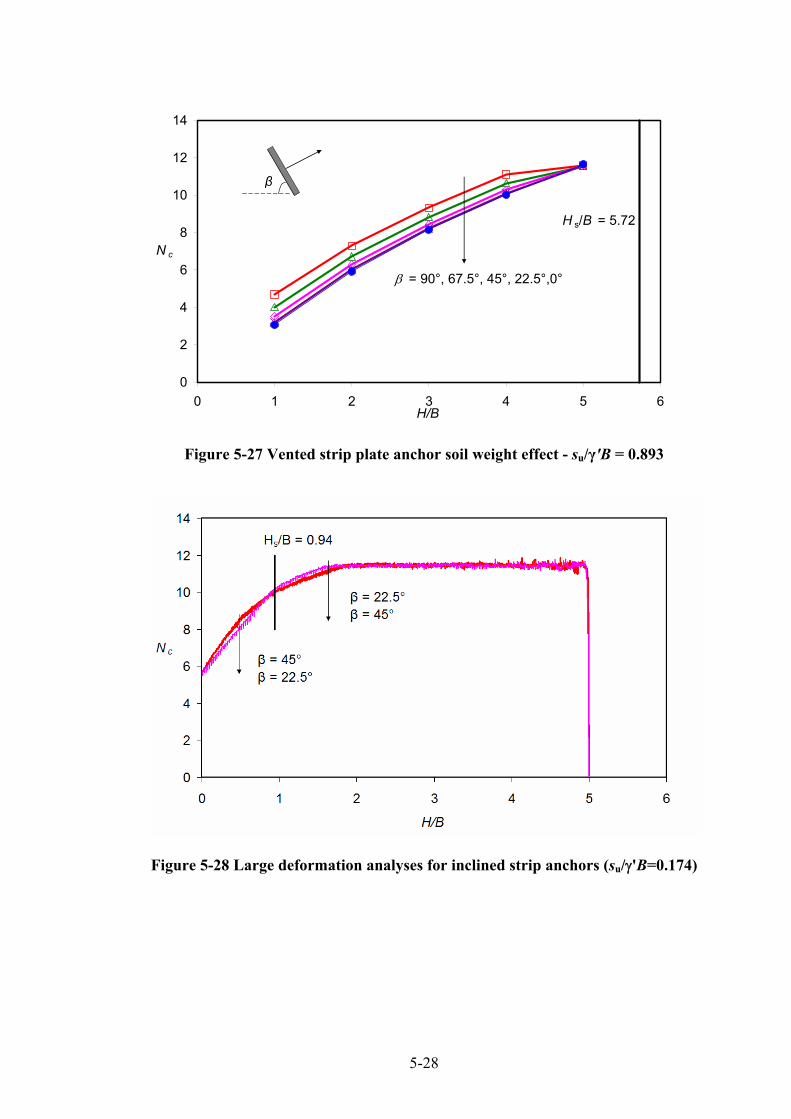
5-28
0
2
4
6
8
10
12
14
0 1 2 3 4 5 6H/B
N c
β = 90°, 67.5°, 45°, 22.5°,0°
H s/B = 5.72
β
Figure 5-27 Vented strip plate anchor soil weight effect - su/γ'B = 0.893
Figure 5-28 Large deformation analyses for inclined strip anchors (su/γ'B=0.174)

5-29
Figure 5-29 Large deformation analyses for inclined strip anchors (su/γ'B = 0.368)
-250
-200
-150
-100
-50
0-10 -5 0 5 10
su (kPa)
Dep
th (m
m)
Figure 5-30 T-bar test (T1)
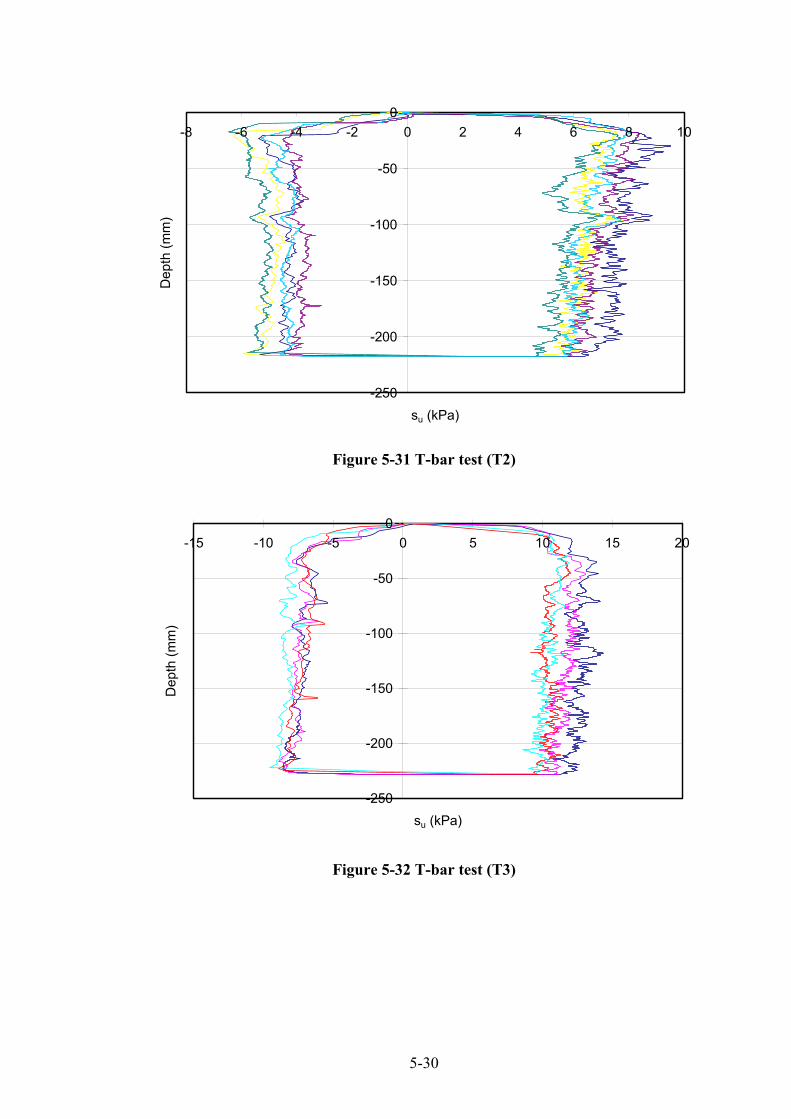
5-30
-250
-200
-150
-100
-50
0-8 -6 -4 -2 0 2 4 6 8 10
su (kPa)
Dep
th (m
m)
Figure 5-31 T-bar test (T2)
-250
-200
-150
-100
-50
0-15 -10 -5 0 5 10 15 20
su (kPa)
Dep
th (m
m)
Figure 5-32 T-bar test (T3)

5-31
-250
-200
-150
-100
-50
0-15 -10 -5 0 5 10 15 20
su (kPa)
Dep
th (m
m)
Figure 5-33 T-bar test (T4)
0
1
2
3
4
5
60 2 4 6 8 10 12 14 16
q/s u
H/B
T1 25°T2 45°T3 25°T4 45°T4 65°FE (Vented) 90°
Figure 5-34 Breakout factors for square anchor in uniform clay

5-32
Figure 5-35 Test 2: Square anchor 45° cutaway
Figure 5-36 Test 3: Square anchor 65° cutaway

5-33
Figure 5-37 Test 4: Square anchor 45° cutaway
Figure 5-38 Test 4: Square anchor 25° cutaway

5-34
0
1
2
3
4
5
60 2 4 6 8 10 12
q/s u
H/B
T3 25°T4 45°T4 65°Das 1989 90°Das 1989 70°Das 1989 50°Das 1989 30°
Figure 5-39 Breakout factors for square anchor in uniform clay
0
1
2
3
4
5
60 2 4 6 8 10 12 14 16
q/s u
H/B
T1 Square 25°T2 Square 45°T2 Rectangular 45°T2 Rectangular 65°T3 Square 25°T3 Rectangular 25°T4 Square 45°T4 Rectangular 45°T4 Square 65°T4 Rectangular 65°
Figure 5-40 Breakout factors for square anchors and rectangular anchors in uniform clay
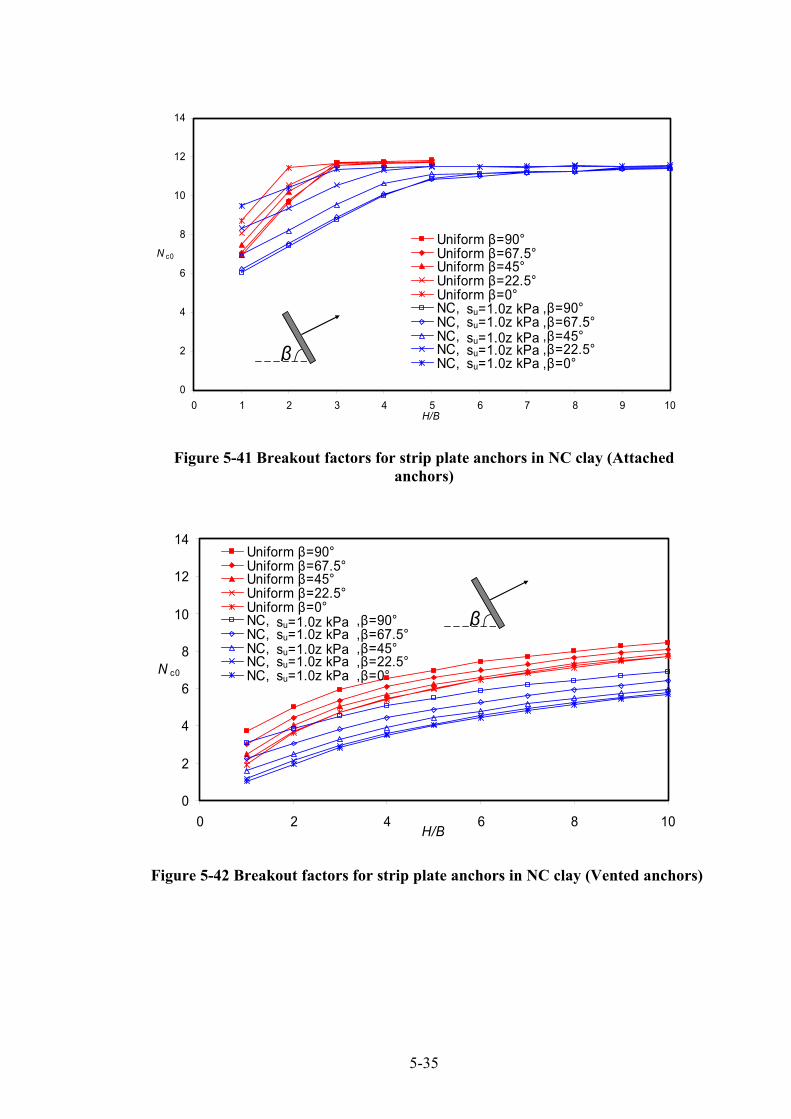
5-35
0
2
4
6
8
10
12
14
0 1 2 3 4 5 6 7 8 9 10H/B
N c0
Uniform β=90°Uniform β=67.5°Uniform β=45°Uniform β=22.5°Uniform β=0°NC, ,β=90°NC, ,β=67.5°NC, ,β=45°NC, ,β=22.5°NC, ,β=0°
su=1.0z kPasu=1.0z kPasu=1.0z kPasu=1.0z kPasu=1.0z kPaβ
Figure 5-41 Breakout factors for strip plate anchors in NC clay (Attached anchors)
0
2
4
6
8
10
12
14
0 2 4 6 8 10H/B
N c0
Uniform β=90°Uniform β=67.5°Uniform β=45°Uniform β=22.5°Uniform β=0°NC, ,β=90°NC, ,β=67.5°NC, ,β=45°NC, ,β=22.5°NC, ,β=0°su=1.0z kPa
su=1.0z kPasu=1.0z kPasu=1.0z kPasu=1.0z kPa
β
Figure 5-42 Breakout factors for strip plate anchors in NC clay (Vented anchors)
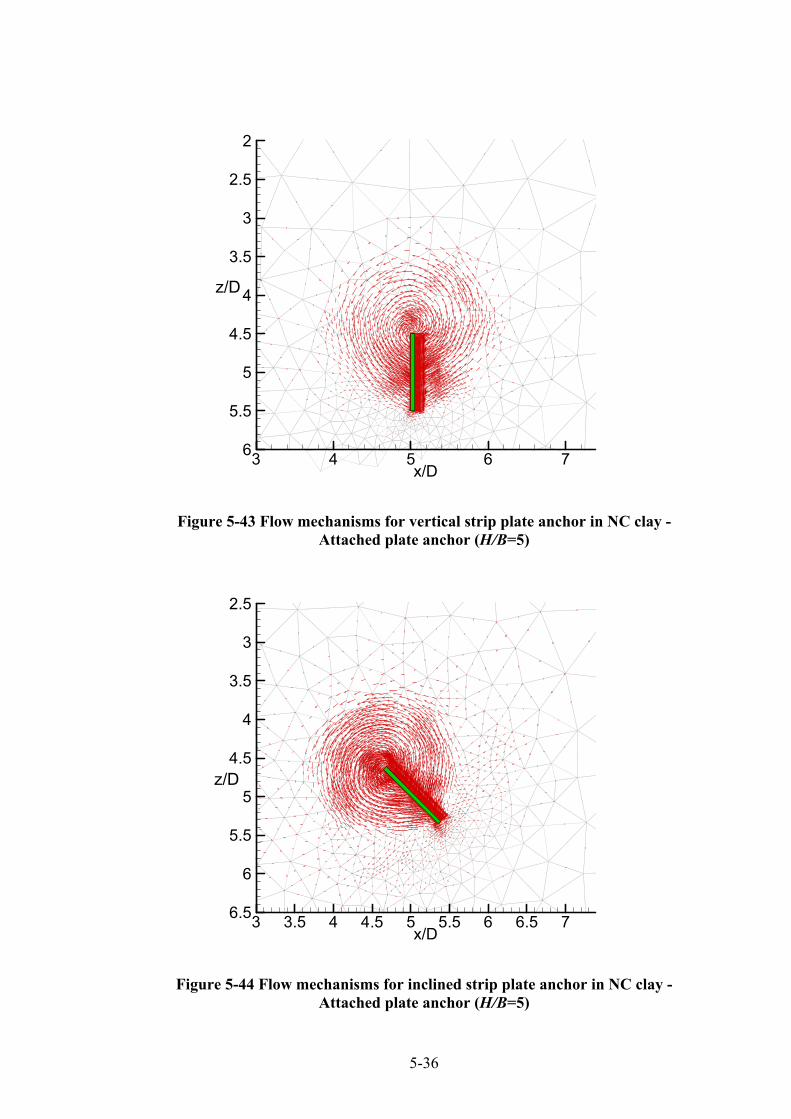
5-36
x/D3 4 5 6 7
2
2.5
3
3.5
4
4.5
5
5.5
6
z/D
Figure 5-43 Flow mechanisms for vertical strip plate anchor in NC clay - Attached plate anchor (H/B=5)
x/D3 3.5 4 4.5 5 5.5 6 6.5 7
2.5
3
3.5
4
4.5
5
5.5
6
6.5
z/D
Figure 5-44 Flow mechanisms for inclined strip plate anchor in NC clay - Attached plate anchor (H/B=5)

5-37
0
2
4
6
8
10
12
14
0 2 4 6 8 10H/B
N c0
NC, ,β=90°NC, ,β=67.5°NC, ,β=45°NC, ,β=22.5°NC, ,β=0°NC, ,β=90°NC, ,β=67.5°NC, ,β=45°NC, ,β=22.5°NC, ,β=0°
su=2.0z kPasu=2.0z kPa
su=1.0z kPasu=1.0z kPasu=1.0z kPa
su=2.0z kPa
su=2.0z kPasu=2.0z kPa
su=1.0z kPa
su=1.0z kPaβ
Figure 5-45 Soil shear strength gradient effect – Attached strip anchors (su=1.0z kPa/m and su=2.0z kPa/m)
0
2
4
6
8
10
12
14
0 2 4 6 8 10H/B
N c0
NC, ,β=90°NC, ,β=67.5°NC, ,β=45°NC, ,β=22.5°NC, ,β=0°NC, ,β=90°NC, ,β=67.5°NC, ,β=45°NC, ,β=22.5°NC, ,β=0°
su=2.0z kPasu=2.0z kPa
su=1.0z kPasu=1.0z kPa
su=2.0z kPa
su=1.0z kPa
su=1.0z kPa
su=2.0z kPasu=2.0z kPa
su=1.0z kPa
β
Figure 5-46 Soil shear strength gradient effect –Vented strip anchors (su=1.0z kPa/m and su=2.0z kPa/m)
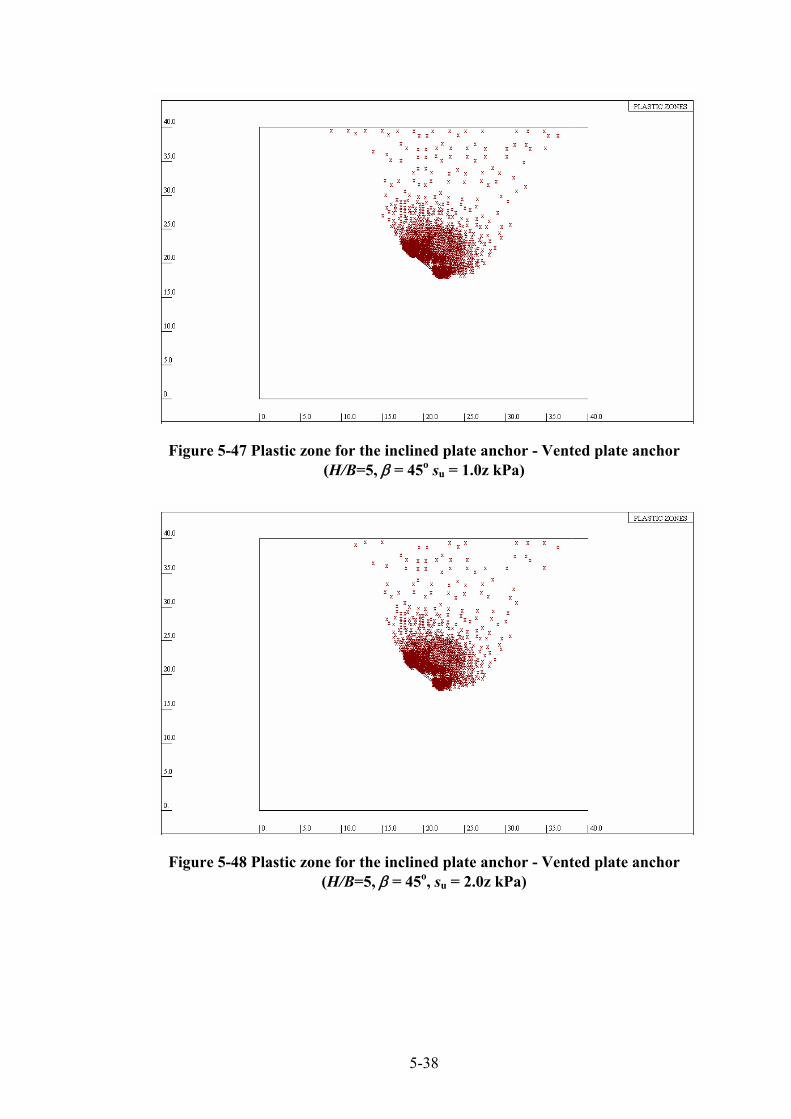
5-38
Figure 5-47 Plastic zone for the inclined plate anchor - Vented plate anchor (H/B=5, β = 45o su = 1.0z kPa)
Figure 5-48 Plastic zone for the inclined plate anchor - Vented plate anchor (H/B=5, β = 45o, su = 2.0z kPa)

5-39
0
2
4
6
8
10
12
14
0 2 4 6 8 10H/B
N c
Attachedγ'=17kN/m³γ'=7kN/m³
β
Figure 5-49 Soil weight effect in NC clay (su=1.0z kPa/m, β=90°)
0
2
4
6
8
10
12
14
0 2 4 6 8 10H/B
N c
Attachedγ '=17kN/m³γ '=7kN/m³
β
Figure 5-50 Soil weight effect in NC clay (su=1.0z kPa/m, β=45°)

5-40
0
2
4
6
8
10
12
14
0 2 4 6 8 10H/B
N c
Attachedγ'=17kN/m³γ'=7kN/m³
Figure 5-51 Soil weight effect in NC clay (su=1.0z kPa/m, β=0°)
0
2
4
6
8
10
12
14
0 2 4 6 8 10H/B
N c
NC, ,β=90°NC, ,β=67.5°NC, ,β=45°NC, ,β=22.5°NC, ,β=0°Uniform, ,β=90°Uniform, ,β=67.5°Uniform, ,β=45°Uniform, ,β=22.5°Uniform, ,β=0°Uniform, ,β=90°Uniform, ,β=67.5°Uniform, ,β=45°Uniform, ,β=22.5°Uniform, ,β=0°
su=1.0z kPasu=1.0z kPasu=1.0z kPasu=1.0z kPasu=1.0z kPa
su/γB =0.36su/γB =0.36su/γB =0.36su/γB =0.36su/γB =0.36su/γB =0.89su/γB =0.89su/γB =0.89su/γB =0.89su/γB =0.89
β
Figure 5-52 NC soil effect for soil with weight (γ'=7kN/m3)

6-1
CHAPTER 6. KEYING OF VERTICALLY INSTALLED PLATE ANCHORS IN CLAY
6.1. Introduction
Since most plate anchors are installed vertically, the anchor pullout and rotation
process, before the full capacity of the anchor is reached, is commonly referred to as
“keying”. During keying, the anchor moves upwards, thus embedment depth reduces
as the plate rotates during pullout (Figure 6-1). As offshore clay deposits are
typically characterised by an increasing strength profile with depth, any loss in
embedment will correspond to a non-recoverable loss in potential anchor capacity.
Reports on the loss of embedment of vertically installed anchors during keying show
a large range. US Naval Civil Engineering Laboratory guidelines (Rocker 1985)
propose that the loss of embedment during anchor keying is twice the anchor breadth
in cohesive soils, whilst recognising that the loss of embedment is also a function of
anchor geometry, soil type, soil sensitivity and duration of time between penetration
and keying. Wilde et al. (2001) reported in situ full scale and reduced scale onshore
and offshore test results for SEPLAs in clay. Soil sensitivity was in the range 1.8 –
4.0 for the different test sites and the loss of embedment during keying was 0.5 - 1.7
times the anchor breadth, with lower embedment losses corresponding to higher soil
sensitivities.
In order to study the effect of loading eccentricity on the keying process, O’Loughlin
et al. (2006) conducted tests adjacent to a Perspex window in custom fabricated
plane strain chambers located within a drum centrifuge channel. Plate anchor
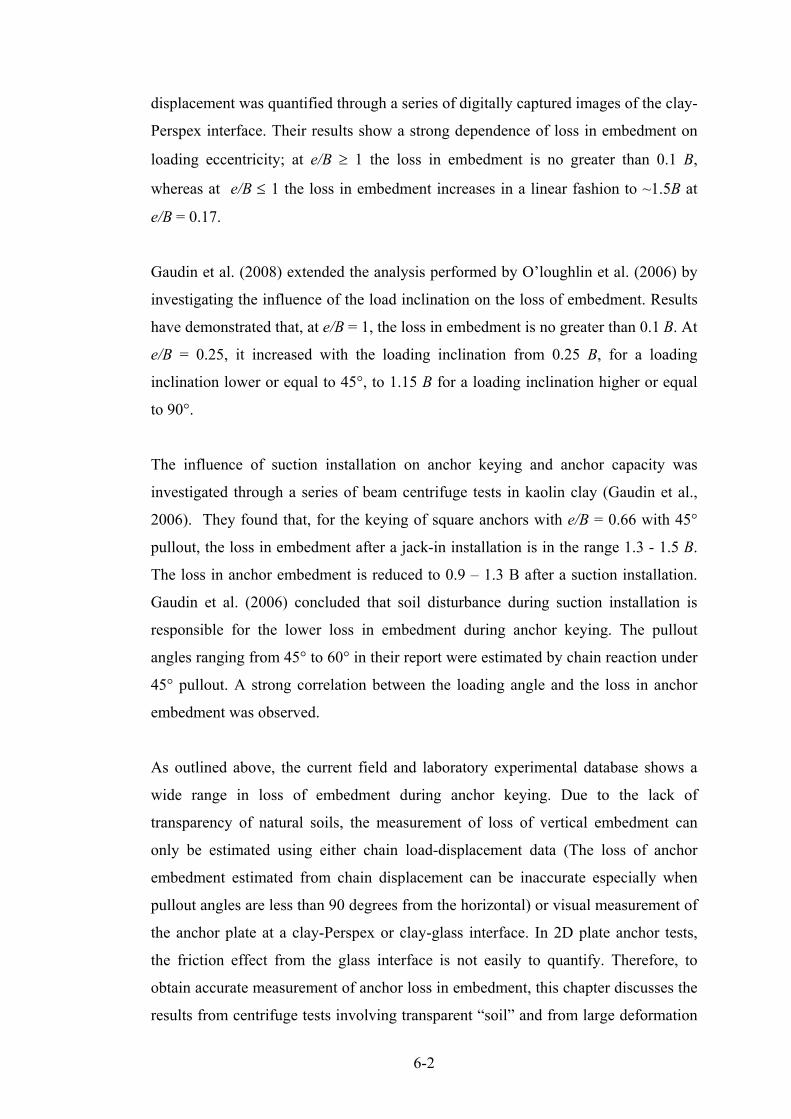
6-2
displacement was quantified through a series of digitally captured images of the clay-
Perspex interface. Their results show a strong dependence of loss in embedment on
loading eccentricity; at e/B ≥ 1 the loss in embedment is no greater than 0.1 B,
whereas at e/B ≤ 1 the loss in embedment increases in a linear fashion to ~1.5B at
e/B = 0.17.
Gaudin et al. (2008) extended the analysis performed by O’loughlin et al. (2006) by
investigating the influence of the load inclination on the loss of embedment. Results
have demonstrated that, at e/B = 1, the loss in embedment is no greater than 0.1 B. At
e/B = 0.25, it increased with the loading inclination from 0.25 B, for a loading
inclination lower or equal to 45°, to 1.15 B for a loading inclination higher or equal
to 90°.
The influence of suction installation on anchor keying and anchor capacity was
investigated through a series of beam centrifuge tests in kaolin clay (Gaudin et al.,
2006). They found that, for the keying of square anchors with e/B = 0.66 with 45°
pullout, the loss in embedment after a jack-in installation is in the range 1.3 - 1.5 B.
The loss in anchor embedment is reduced to 0.9 – 1.3 B after a suction installation.
Gaudin et al. (2006) concluded that soil disturbance during suction installation is
responsible for the lower loss in embedment during anchor keying. The pullout
angles ranging from 45° to 60° in their report were estimated by chain reaction under
45° pullout. A strong correlation between the loading angle and the loss in anchor
embedment was observed.
As outlined above, the current field and laboratory experimental database shows a
wide range in loss of embedment during anchor keying. Due to the lack of
transparency of natural soils, the measurement of loss of vertical embedment can
only be estimated using either chain load-displacement data (The loss of anchor
embedment estimated from chain displacement can be inaccurate especially when
pullout angles are less than 90 degrees from the horizontal) or visual measurement of
the anchor plate at a clay-Perspex or clay-glass interface. In 2D plate anchor tests,
the friction effect from the glass interface is not easily to quantify. Therefore, to
obtain accurate measurement of anchor loss in embedment, this chapter discusses the
results from centrifuge tests involving transparent “soil” and from large deformation

6-3
finite element analyses. Various factors relevant to the anchor keying process are
considered. These factors include loading eccentricity, anchor submerged unit weight
in soil, pullout angle, soil shear strength profile, and plate anchor thickness.
6.2. Numerical Setup
Numerical analyses were conducted using the Finite element (FE) package AFENA
(Carter and Balaam 1990), with modifications to simulate the large deformations of
soils. Although small strain finite element analyses can provide solutions for the
anchor capacity when an anchor is pre-embedded in the soil and a load is applied
normal to the plate, continuous (large deformation) FE analysis is required to
investigate the rotational behaviour of plate anchors during keying. The RITSS
approach has been used to simulate the continuous pullout of the anchor.
Although modelling of square and rectangular anchor rotation is a three dimensional
problem, to reduce computational time and to simplify the problem, a two
dimensional strip plate anchor pre-embedded vertically in clay was analysed. The
interface between the soil and the anchor plate was assumed to be rough, and as the
plate anchors are considered to be deeply embedded (i.e. the soil failure surface does
not extend to the soil surface), the soil and the back face of the anchor plate were
assumed to be fully attached.
6.2.1. Anchor Loading System
The plate anchor in the FE analyses constitutes an anchor plate connected
perpendicularly to an anchor shank. Regarding the anchor shank, two types of
analysis were conducted:
(a) Analyses including shank weight (Wshank) and shank resistance (f);
(b) Analyses ignoring shank weight and shank resistance.
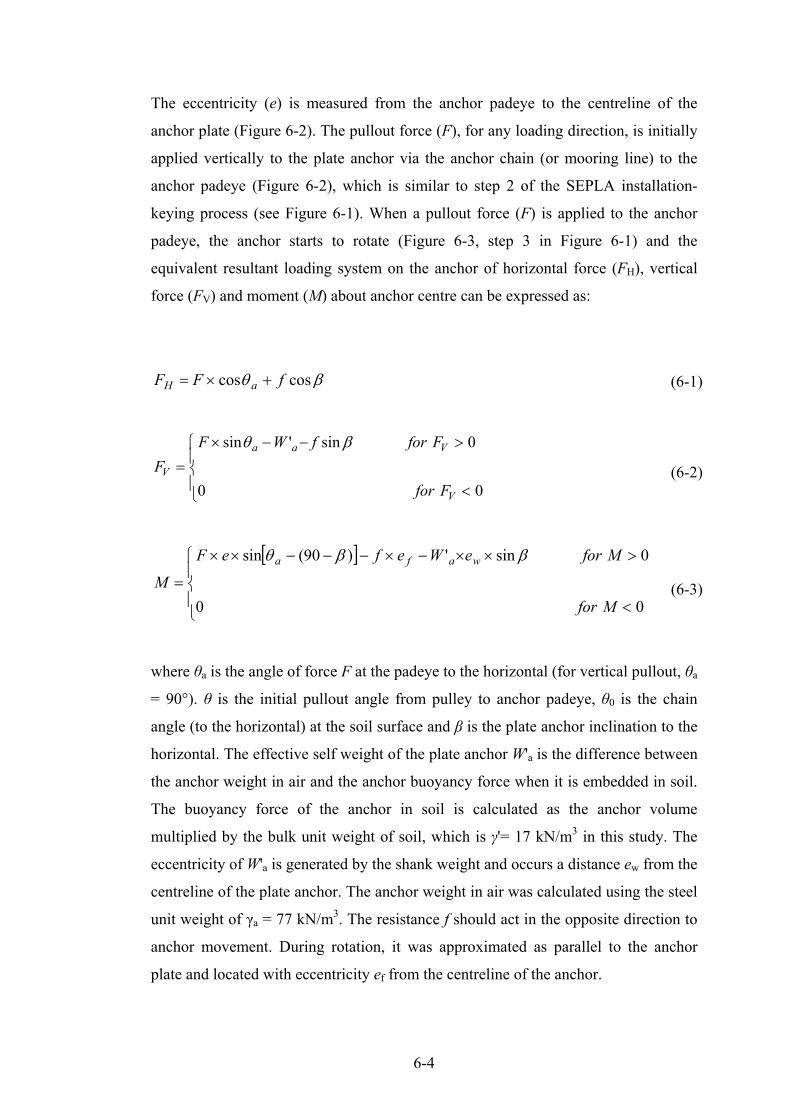
6-4
The eccentricity (e) is measured from the anchor padeye to the centreline of the
anchor plate (Figure 6-2). The pullout force (F), for any loading direction, is initially
applied vertically to the plate anchor via the anchor chain (or mooring line) to the
anchor padeye (Figure 6-2), which is similar to step 2 of the SEPLA installation-
keying process (see Figure 6-1). When a pullout force (F) is applied to the anchor
padeye, the anchor starts to rotate (Figure 6-3, step 3 in Figure 6-1) and the
equivalent resultant loading system on the anchor of horizontal force (FH), vertical
force (FV) and moment (M) about anchor centre can be expressed as:
βθ coscos fFF aH +×= (6-1)
⎪⎩
⎪⎨
⎧
<
>−−×=
00
0sin'sin
V
Vaa
V
Ffor
FforfWFF
βθ
(6-2)
[ ]
⎪⎩
⎪⎨
⎧
<
>××−×−−−××
=00
0sin')90(sin
Mfor
MforeWefeF
Mwafa ββθ
(6-3)
where θa is the angle of force F at the padeye to the horizontal (for vertical pullout, θa
= 90°). θ is the initial pullout angle from pulley to anchor padeye, θ0 is the chain
angle (to the horizontal) at the soil surface and β is the plate anchor inclination to the
horizontal. The effective self weight of the plate anchor W'a is the difference between
the anchor weight in air and the anchor buoyancy force when it is embedded in soil.
The buoyancy force of the anchor in soil is calculated as the anchor volume
multiplied by the bulk unit weight of soil, which is γ'= 17 kN/m3 in this study. The
eccentricity of W'a is generated by the shank weight and occurs a distance ew from the
centreline of the plate anchor. The anchor weight in air was calculated using the steel
unit weight of γa = 77 kN/m3. The resistance f should act in the opposite direction to
anchor movement. During rotation, it was approximated as parallel to the anchor
plate and located with eccentricity ef from the centreline of the anchor.

6-5
6.2.2. Anchor Chain Analysis
In order to accurately simulate the anchor keying process, it is necessary to account
for the forces developed along the anchor chain (particularly when the anchor is not
pulled out vertically). For an inclined anchor pullout, when the anchor chain slides
and cuts through the soil, an inverted catenary shape is formed, and this generates
significant frictional capacity along the length of the chain (Neubecker and Randolph
1995). The analytical solution proposed by Neubecker and Randolph (1995), which
relates the chain orientation, the chain tension and the chain bearing resistance per
unit length, was used in the present study to estimate the chain profile at any given
stage during keying. Thus the chain tension force at the anchor padeye can be
estimated using:
QHQdzF H
za =≈− ∫ =0
20
2 )(2
θθ (6-4)
where θ0 is the chain angle at the soil surface, F is the chain tension at the (padeye)
attachment point at depth H, Q is the chain tension at a depth z and Q is the average
bearing resistance (per unit length of chain) over the depth from soil surface (z = 0)
to the padeye embedment depth H.
The chain profile can be estimated
in uniform soil by:
)2
12
(2
*20
*20
*
*
*
zTTT
z+−+=
θθ (6-5)
whereas in normally consolidated soil by:
))(
2
12
1ln(2
2*20
**
20
*
**
zTz
T
zT
++
++=
θ
θ
(6-6)

6-6
where QD
FT =* is the normalized tension; z* is the normalized depth. (embedment
depth z divided by embedment depth of padeye D).
6.2.3. Interaction between Chain Analysis and Anchor Analysis
Initially the anchor chain (and hence the force applied to the anchor) was assumed to
be vertical at the padeye, i.e. θa = 90˚. After the first step of remeshing in the FE
analysis, the position of the anchor and the whole domain was updated according to
the anchor and chain displacements, the new interaction point between the soil
surface and chain element system could then be calculated. Hence the new θ0 could
be used to calculate the new pullout angle θa from Equation 6-4. This updating
process was repeated until the keying process was complete (Figure 6-4). The full
procedure for the large deformation analysis of anchor keying may therefore be
summarised as:
Step 1: Set up the initial force F at the padeye vertically (θa = 90°);
Step 2: Use Equations 6-1 to 6-3 to calculate the equivalent forces and moment
applied to the anchor;
Step 3: Conduct small-strain incremental FE analyses;
Step 4: Update anchor location and chain profile; Mesh updating and stress
interpolation.
Step 5: Calculate new θa using Equation 6-4;
Step 6: Apply a new force F with the new θa;
Step 7: Stop if the anchor ultimate bearing capacity is reached, otherwise go to Step
2.

6-7
6.3. Experimental Setup
The centrifuge tests were carried out using the UWA (University of Western
Australia) drum centrifuge (Stewart et al. 1998).
In order to observe anchor rotational behaviour, physical tests were carried out in a
pre-consolidated uniform transparent material in the drum centrifuge (Figure 6-5).
The test was performed in a plane strain testing chamber with internal dimensions
258 mm long, 80 mm wide and 150 mm deep. The chamber was modular, allowing
either side of each chamber to be replaced with a Perspex panel to facilitate visual
observations of the test. In addition a row of 3 mm diameter beads was initially
suspended on a horizontal thread within the sample to facilitate observation and
measurement of soil displacements. The thread was removed when the sample
achieved sufficient strength to take the weight of the suspended beads. Consolidation
of the slurry was achieved initially by dead load, followed by air pressure to a final
consolidation stress of 220 kPa. Back analysis of the settlement-time data indicated
that the sample had a coefficient of vertical consolidation ~0.66 m2/yr.
To facilitate optical measurement of the plate anchor keying process, a digital camera
was placed within a custom made cradle which supports the camera lens at high
acceleration levels. The cradle was mounted securely in the drum channel and
oriented as such that the camera lens axis was perpendicular to the measurement
plane. Testing arrangement in the drum centrifuge channel was set up according to
arrangement reported by White et al. (2005). A Canon S50 camera with a 5 Mega
Pixel resolution (2592 × 1944 pixels) was used for digital image capture. The camera
was set to continuous shooting mode, which, for the Canon S50, results in a full-
resolution capture frequency of 0.5 Hz. Remote triggering of the camera was
achieved using a small mass fixed to the shutter, which activates the camera into
continuous shooting mode when the acceleration reaches and is maintained above a
certain level (typically 25g).
6-8
VDPA anchor was used in the experiment. The anchor was manually installed at 1g
to an anchor centre depth of 120 mm (= 3B). After installation, the soil sample was
located within the drum centrifuge channel and the centrifuge acceleration level
increased to achieve 100 g at the centre of the strong box. Soil characterisation tests
were performed using a T-bar penetrometer (Stewart and Randolph 1994). The
undrained shear strength profiles are summarised in Figure 6-6, where after a depth
of 20 mm (2 m in prototype), su is seen to be tolerably constant and equal to 18 kPa.
The experimental arrangement is such that the anchors can be pulled out vertically or
at an inclined angle (β = 60°) (Figure 6-7). The chain connected to the anchor padeye
was pulled out at a constant rate of v = 0.25 mm/s, which gives a dimensionless
velocity of vB/cv in excess of 30 thus ensuring undrained behaviour (Finnie and
Randolph 1994).
6.4. Pre-embedded Strip Plate Anchor Analysis
Before the large deformation analyses were conducted, a few small strain analyses
(AFENA) in weightless soil were performed in order to explore the soil failure
mechanism for a vertically embedded 4 m wide strip plate anchor under different
loading conditions. These analyses were devised to show the potential movement of
the plate under different combinations of inclined force and moment loading. The
soil was simulated as an elastic-perfectly plastic material with Tresca yield criterion.
Poisson’s ratio ν = 0.49 and friction and dilation angle were set to φ = ψ = 0 to
simulate undrained weightless soil conditions. The undrained shear strength was
taken as su = 5 kPa, and the soil stiffness ratio was homogeneous with E/su = 500,
where E is Young’s modulus.
The effects of anchor loading eccentricity ratio (e/B) and loading inclination (θ) on
anchor rotation were studied. Soil flow mechanisms under different loading
conditions at various anchor embedment are shown in Figure 6-8 to Figure 6-11. For
the horizontal pullout (Figure 6-8), since the pullout direction is perpendicular to the
anchor orientation the anchor only translates in the pullout direction without rotation.
When a 45˚ pullout force acts at the plate centre (Figure 6-9) the pullout force has no
eccentricity (e = 0). Thus, the dominant movement of the plate anchor is upwards.

6-9
Slight horizontal movement and rotation can be observed due to the loading
inclination. However, when the 45˚ pullout force is applied to the padeye with an
eccentricity ratio, e/B = 0.625, an anti-clockwise rotation of the anchor is evident
(Figure 6-10). This is due to the resultant moment about the anchor centre from the
eccentric loading. This rotational behaviour is more localised when the plate is
deeply embedded (Figure 6-11). Thus, the loading eccentricity plays a major role in
anchor rotation, though the loading inclination can also affect anchor movement.
6.5. Continuous Pullout Plate Anchors
Large deformation FE analyses and transparent soil tests were conducted to
investigate anchor rotation phases.
6.5.1. Anchor Keying Phases in Centrifuge Test
The loss of anchor embedment in transparent soil was determined by careful
examination of the digital photos captured during the test. The pullout response of
the anchor is shown in Figure 6-12 and the digital images from the transparent soil
test are presented in Figure 6-13 and Figure 6-14. Chain pullout distance is defined
as the chain movement during the pullout process.
From Figure 6-12, the pullout process can be divided into four phases: (1) Chain
tightening (1 to 2 for θ = 60° and 1' to 2' for θ = 90°); (2) Half way anchor rotation (2
to 3 for θ = 60° and 2' to 3' for θ = 90°); (3) Full rotation and pullout capacity
development (3 to 4 and 3' to 4'); (4) Steady pullout (4 to 5 and 4' to 5'). The detailed
process in different phases will be discussed together with the photos taken during
pullout below (Figure 6-13 and Figure 6-14).
6.5.1.1. Phase 1: Chain Tightening
Figure 6-13 (a), (b) and Figure 6-14 (a), (b) display the chain movement between
points 1 (1') and 2 (2') in Figure 6-12. The arrows show the movement of points from
6-10
previous positions to the current positions. It is apparent that the chain has a large
movement with inclined pullout and has little or no movement with vertical pullout.
The anchor in this phase does not show any movement at all. Thus, in Figure 6-12, a
limited chain movement is shown in vertical pullout (1'~2'), but a large chain
movement is observed in 60° pullout (1~2).
6.5.1.2. Phase 2: Half Way Anchor Rotation
Figure 6-13 (b), (c) and Figure 6-14 (b), (c) depict the anchor rotation after the chain
has tightened. For the inclined pullout with θ = 60°, the anchor starts to rotate a little
from point 2. The load increases gradually to position 3. From Figure 6-13 (c), it can
be seen the padeye of the anchor moves straight upwards while the anchor rotates
about 20°. According to the trajectories of the beads, the bead close to the top edge
of the anchor is pushed down and the bead close to the bottom edge of the plate is
lifted because of the soil flow around the edge of the anchor. This supports the
validity of the “attachment” assumption adopted for the numerical analyses.
For the vertical pullout anchor, the anchor rotates more (Figure 6-13(c)) than the
inclined pullout anchor (Figure 6-14(c)), which is around 42°. This is because the
anchor needs to rotate 90° during vertical pullout and it only needs to rotate 60°
during the inclined pullout.
6.5.1.3. Phase 3: Full Rotation and Pullout Capacity Development
From point 3 and 3', the anchors continue to rotate and pullout capacities develop
quickly to the ultimate value. The beads underneath the plate show the full flow
mechanism around the edge of the anchor.
Considering the keying-in process, the anchor moves 0.4 times the width of the
anchor to be fully rotated (Figure 6-13(d)) for the vertical pullout and only takes 0.3
times the width of the anchor (Figure 6-14(d)) for θ = 60° pullout.

6-11
6.5.1.4. Phase 4: Steady Pullout
Once the anchor is fully rotated to position (Figure 6-13 (d) and Figure 6-14 (d)), the
pullout capacities remain constant. The breakout factors for both inclined and
vertical pullout remain at 10.5 (Figure 6-12).
Figure 6-13 (e) and Figure 6-14 (e) show the anchor movement during the steady
pullout stage. For the inclined pullout with θ = 60°, the anchor moves straight with
the angle 61.2°, which is a little higher than the expected 60° pullout. The beads
close to the bottom edge of the anchor flow around the edge. But the beads close to
the top edge of the anchor move upward slightly and then stay in this position when
separations occur.
For the vertical pullout, after reaching full capacity at point 4', the anchor goes
straight upwards although the pullout angle is not exactly 90°. In the set up of the test,
it is impossible to set up precisely 90° pullout after the anchor rotation. The initial
90° is set up from the padeye of the plate anchor. After rotation of the anchor, due to
the anchor eccentricity (2.5 m in prototype), the pullout angle is around 85°.
6.5.2. Chain Profile in Centrifuge Test
Figure 6-15 shows the chain profiles during inclined pullout (θ = 60°). The origin is
set up at where the surface of the sample intersects with the exact 60° pullout
direction from the padeye of the anchor. Both the x-axis and z-axis are normalised by
the anchor width B = 4 m. It can be observed that during phase 1, the chain is pulled
straight and then cut through the transparent soil sample. At point 2, the chain shows
an inversed catenary profile, while the anchor is still kept at its original position. This
type of chain profile is the typical chain profile under low anchor loading condition.
From point 2 to point 3, the anchor is lifted upwards to some extent and the chain
still remains in the inversed catenary profile but this profile looks straighter than the
chain profile at point 2. This is the typical chain profile under medium anchor load
condition. During phase 3, the anchor pullout capacity is accumulated and the anchor

6-12
loading becomes very high. The chain profile during this stage shows an almost
straight line, which is parallel to the expected θ = 60° pullout direction.
6.5.3. Numerical Analysis
The transparent soil test was simulated numerically using a soil bulk unit weight γ' =
9.23 kN/m3, an anchor unit weight γa = 77 kN/m3 and undrained shear strength su =
18 kPa together with other undrained parameters adopted in the small strain analyses.
Two numerical simulations were conducted: (a) anchor shank weight and shank
resistance were neglected (Wshank = f = 0 and ew = 0 in Equation 6-1 to Equation 6-3);
(b) anchor shank weight and shank resistance were considered. (Wshank >0, f > 0 and
ew > 0 in Equation 6-1 to Equation 6-3); Both sets of numerical results are compared
with the centrifuge data in Figure 6-16 and Figure 6-17.
As can be seen from Figure 6-16, the numerical analysis that accounts for shank
weight and resistance is in better agreement with the centrifuge data. The main
disparity in the comparison is due to the different final plate orientations in the
numerical analysis and the centrifuge test. When the shank weight and resistance are
not considered, the loss of anchor embedment is approximately doubled at any given
plate orientation. Therefore, the shank weight and resistance have a positive effect on
reducing the loss of anchor embedment during keying.
Figure 6-17 plots the orientation of the plate anchor against the normalised loss in
anchor embedment (Δze/B, Figure 6-4). Also shown on Figure 6-17 are the results
from an FE simulation using geotechnical parameters equivalent to that of the
transparent soil and an anchor geometry ratio e/B = 0.625 and t/B = 0.05 which
matches that of the model anchor used in the centrifuge test. In the FE analysis,
anchor relative unit weight was γ'a = (77 – 9.23) kN/m3 = 67.8 kN/m3. Anchor shank
weight and resistance were considered in the FE analysis.
Figure 6-18 shows pullout response in the numerical simulation and Figure 6-19
shows the relationship of the loss in anchor embedment during keying with chain
displacement. Figure 6-20 shows the anchor position during rotation. It can also be

6-13
seen from this figure that from point 2 the anchor starts to rotate and the chain profile
becomes straighter. At point 3 the anchor rotation is about 35°, which corresponds to
approximately half of the total anticipated rotation (θ = 60°). Bearing capacity
develops gradually from point 2 to point 3, then dramatically from point 3 to point 4
(Figure 6-18). It can be observed that the ultimate breakout factor for the inclined
pullout is about Nc = 11.7, which agree with numerical bearing capacity results for
inclined pullout strip anchors in Chapter 5.
At point 4, the anchor centre has moved vertically upwards by 0.4 B to its fully
rotated position. Soil heave can be observed at the surface of the soil domain. After
the ultimate bearing capacity of the anchor is achieved at point 4, the anchor is pulled
out continuously at the pulley angle of 60°.
Figure 6-21 shows the soil flow mechanism when the anchor is at point 4. A
symmetric soil flow is observed, which means the anchor has stopped rotating. The
numerical analysis was stopped at this stage.
The good agreement that is apparent between the experimental and numerical
trajectories suggests that the numerical approach is robust to provide design
information when the anchor is simulated appropriately. Thus, it can be used as a
practical tool when anchor geometry varies.
6.6. Factors Affect Anchor Keying
Large deformation analyses (RITSS) were conducted to simulate the continuous
movement of the plate anchor during keying with different geometries to study the
factors which can affect anchor keying. The factors that were studied include soil
non-homogeneity, anchor padeye eccentricity, soil shear strength, anchor weight,
loading inclination and soil disturbance due to suction caisson installation.
6.6.1. Effect of Soil Non-Homogeneity

6-14
To study the effect of soil strength non-homogeneity on the anchor keying process,
large deformation FE analyses were conducted, where strip plate anchors with widths
of B = 2 m and 4 m were embedded in both uniform and normally consolidated (NC)
clays. The effective unit weight of the soil was γ' = 17 kN/m3 and the anchor unit
weight was considered as γa = 77 kN/m3. The anchor padeye eccentricity ratio was
e/B = 0.625 and the initial embedment ratio Hi/B was 3. The soil-anchor interface
was assumed to be rough. The undrained shear strength of the uniform soil was su =
8.4 kPa whereas the undrained shear strength of the NC soil was su = 0.7z kPa for the
anchor with B = 2 m and su = 1.4z kPa for the anchor with B = 2 m, where z is the
soil depth in metres. The selection of these two NC soil strength profiles is intended
that the soil strengths in both soils are the same as su = 8.4 kPa at the anchor
embedment depth of H = 3B. Other soil properties were selected to be consistent with
the small strain analyses. At the initial embedment depth of Hi = 3B = 12 m, the
undrained shear strength for both soils at the anchor centre are the same at sui = 8.4
kPa. Soil non-homogeneity around the plate was defined as (sut – sub)/sui, where sut
and sub are undrained shear strengths at the top and bottom edges of the vertical plate.
This can also be expressed as kB/sui, where kB/sui = 0 for uniform soil and kB/sui =
B/Hi = 0.33 in NC soil for a plate anchor embedded at H = 3B regardless of the soil
strength gradient k.
The anchor keying responses, during vertical pullout in uniform and NC soils, were
simulated. The initial set-up of the plate anchor with vertical pullout is the same as in
Figure 6-2. During the continuous pullout, the changes of anchor inclination (β)
against the loss in anchor embedment (Δze) are plotted in Figure 6-22. The loss in
anchor embedment (Δze) during keying was defined as the upwards movement of the
anchor centre. In these analyses, the anchor shank weight and resistance were not
considered in order to isolate the effect of the strength heterogeneity. It is evident
from Figure 6-22 that the anchor rotational behaviour is not influenced greatly by the
soil strength profiles during the first 40° of rotation (β = 90° - 50°). When the anchor
orientation angle, β, is less than 50°, the anchor in NC clay rotates slightly faster than
in uniform clay, however, the difference is minimal. The different responses from the
anchors of B = 2 m and 4 m are due to the anchor geometry, which is demonstrated
more in the following sections.

6-15
6.6.2. Effect of Anchor Padeye Eccentricity
In order to investigate the effect of varying the eccentricity ratio of the padeye,
numerical analyses were conducted whereby the eccentricity ratio was varied for
rough strip anchors. In order to compare the FE results with existing centrifuge test
data by O’Loughlin et al. (2006), three eccentricity ratios were considered: e/B = 1,
0.5 and 0.17 for strip plates of breath B = 3 m and thickness t = 0.2 m. In the
centrifuge tests (O'Loughlin et al. 2006) strip anchors were pre-embedded in NC
Kaolin clay at an initial embedment ratio of Hi/B = 3. The undrained shear strength
was determined using a T-bar penetrometer to give an average su = 0.7z kPa over the
depth of the sample. The plate anchor was pulled out vertically with a rigid shaft
connected to the anchor padeye at e/B ratios of 1, 0.5 and 0.17, and the length of the
strip anchor was equal to the width of the testing chamber to ensure that the anchor
remained in contact with the front Perspex panel. The Perspex panel was digitally
photographed, to facilitate observation and quantification of the keying process.
Experimental limitations restricted the final plate anchor orientation to β = 20°,
rather than an ideal β = 0°.
Comparisons of the FE results and the centrifuge test data of plate anchor trajectories
(plate anchor orientation versus loss in embedment) are shown in Figure 6-23. The
anchor padeye eccentricity in the centrifuge test was realised by an arm at the plate
centre and perpendicular to the plate. From Figure 6-23, it is apparent that the loss in
anchor embedment during keying decreases with increasing anchor padeye
eccentricity. O'Loughlin et al. (2006) explained the effect of the anchor eccentricity
by using plasticity concepts and yield loci theory (Bransby and O'Neill 1999;
Elkhatib and Randolph 2005; O'Neill et al. 2003). During keying, the plate anchor is
subjected to a combination of shear (Fs), normal (Fn) and moment (M) loading. If a
combination of Fs, Fn and M loads lie on the yield locus, then the displacement of the
plate will be normal to the yield locus at this load combination. If a vertically
embedded plate anchor is subjected to an eccentric vertical load, F, for the case
where the eccentricity of the applied load is high, the plate will be subjected to a high
moment (M) and commence rotation at a relatively low vertical load, F. As the plate
is initially vertical, the low F will be equilibrated by an equally low Fs. Hence the
starting point on the yield locus for the high eccentricity case is at low Fs and high M.

6-16
As the plate continues to key, the rotation will cause Fn to increase and Fs to decrease
so that the combined loading path is typical of that denoted by the solid line on
Figure 6-24. Recalling that normality requires the plastic displacements to be normal
to the yield surface, examination of the yield surface along the suggested loading
path reveals that the displacement vectors are principally perpendicular to the plate.
In terms of loss in embedment during keying, this means that significant vertical
movement will only occur when keying is completed. By contrast, for the anchor
with low eccentricity, a large vertical force is required to develop sufficient moment
to initiate plate rotation. Hence the starting point on the yield surface is high Fs and
low M. During loading the effective eccentricity will tend to reduce as the rotation
slowly increases, causing M to reduce further. At the same time Fs will decrease and
Fn will increase as the dominant forces on the plate gradually change from shear to
normal. The loading path is hence typical of that denoted by the dashed line on
Figure 6-24. Inspection of the yield loci along this path reveals displacements that
are mainly parallel to the plate, which corresponds with the very high loss in
embedment.
With the anchor padeye eccentricity ratios e/B = 1 and 0.5, the FE results agree with
the centrifuge test data well, though the final plate orientation in centrifuge test only
reaches β = 20° rather than the final β = 0° in FE analysis. O'Loughlin et al. (2006)
concluded that higher final angle, β, in the centrifuge test may be due to the rigid
shaft and the frictional contact with the testing panel of the anchor. The effect of the
resistance between the anchor end and the Perspex panel is more profound with a
lower eccentricity ratio of e/B = 0.17. In Figure 6-23, it can be seen that, with e/B =
0.17, the anchor in centrifuge test reaches the same final orientation (β = 20°) as the
other two anchors. However, the anchor rotation in centrifuge test is much slower
than that in FE analysis. It is anticipated that the friction between the anchor ends
and the test panel in the centrifuge test might play a more important role for an
anchor with low eccentricity. This is because the low eccentricity results in a low
rotation moment (Equation 6-3), thus the resistance to rotation due to the anchor-
panel friction becomes significant. Moreover in FE analysis, this low rotation
moment also results in a higher final anchor orientation (β =15°) than the ideal β = 0°.
6-17
However, with an eccentricity ratio e/B = 0.17, the anchor in numerical analysis
rotates much faster than the one in centrifuge test. This may be because that the
friction experienced by the anchor ends in the centrifuge tests has a greater effect
with reduced loading eccentricity, hence reduced moment applied to the plate.
6.6.3. Effect of Anchor Roughness and Shear Strength
The effect of anchor roughness and soil shear strength on anchor keying was studied
with four anchor padeye eccentricity ratios of e/B = 0.4, 0.5, 0.625 and 1.5, combined
with three undrained soil shear strengths of su/γ'B = 0.124, 0.294 and 1.471 in
uniform soil. The soil bulk unit weight was γ' = 17 kN/m3 and a steel anchor unit
weight was γa = 77 kN/m3, which result in the submerged anchor unit weight of γ'a =
γa – γ' = 60 kN/m3. The anchors were pulled out vertically (θ = 90°).
The effect of anchor roughness was investigated with a strip anchor of B = 4 m
embedded in a uniform soil of su/γ'B = 0.294. Both smooth and rough anchors with
various anchor padeye eccentricity ratios were analysed. The anchor responses to a
vertical pullout (θ = 90°) are shown in Figure 6-25. It is clear that the anchor
roughness effect is diminishing with increasing anchor padeye eccentricity ratio. For
anchors with e/B > 0.5, the anchor roughness effect is minimal. Both smooth and
rough anchors show the same loss in anchor embedment. For anchors with e/B ≤ 0.5,
the rough anchor rotates slower, thus has a greater loss in anchor embedment,
comparing to the smooth one.
The soil strength effect was studied with a strip anchor, having an eccentricity ratio
of e/B = 0.625, embedded in soils with various uniform strengths. The anchor keying
responses during vertical pullout are shown in Figure 6-26. It can be seen that the
loss in anchor embedment decreases with decreasing soil strength. The losses in
anchor embedment during keying are Δze/B = 0.65, 0.55 and 0.45 in the soils of
su/γ'B = 1.471, 0.294, 0.124 respectively. Figure 6-26 also shows that in the soft soils
of su/γ'B = 0.124, 0.294, the anchor roughness has little effect on the loss in anchor
embedment during anchor keying. In the stiff soil of su/γ'B = 1.471, the rough anchor

6-18
loses more embedment during keying than the smooth one, though the difference is
less than 10%.
6.6.4. Effect of Anchor Thickness and Weight Effect
To study the effect of anchor thickness, t, on anchor keying, large FE analyses have
been conducted with the anchor thickness ratios of t/B = 0.1, 0.067 and 0.05
combined with the anchor eccentricity ratios of e/B = 0.3, 0.4, 0.5, 0.75, 1 and 1.5.
The submerged anchor unit weight was considered as γ'a = 60 kN/m3 based on the
soil bulk unit weight of γ' = 17 kN/m3 and the steel anchor unit weight of γa = 77
kN/m3. The effect of anchor submerged unit weight, γ'a, on anchor keying has been
investigated by applying three submerged anchor unit weights of γ'a = 0, 60 kN/m3
and 70 kN/m3 to an anchor with e/B = 0.625. All the FE analyses were performed for
vertically pullout anchors in the uniform soil of su/γ'B = 0.294.
The numerical results of losses in embedment during anchor keying are summarised
in Figure 6-27. It can be seen that for eccentricity ratios e/B > 1, the anchor thickness
has minimal effect and the loss of embedment stabilises at Δze/B ~0.2. When e/B < 1,
the loss of anchor embedment increases with decreasing eccentricity ratio and
becomes more pronounced when e/B < 0.5. In addition, the loss of anchor
embedment is seen to increase with decreasing thickness ratio t/B, although this
effect becomes less pronounced as the eccentricity ratio increases. For example at
e/B = 0.3, there is ~100% higher loss of anchor embedment as t/B is halved from 0.1
to 0.05 whilst at e/B = 0.6 the increased loss in anchor embedment is ~50% for the
same reduction in t/B. Whilst this effect may be partially due to geometrical
considerations, it is quite likely that the increase in anchor self-weight due to the
thicker anchor plate causes an increase in the rotational moment about the anchor
padeye which would promote the keying process.
The anchor weight effect was also investigated numerically by varying the relative
anchor unit weight γ'a = γa - γ'. The numerical results are summarised in Figure 6-28,
where it can be seen that by increasing γ'a, the loss of embedment decreases; for
example the loss of embedment is halved (i.e. Δze/B reduces from ~0.8 to ~0.4) when
6-19
γ'a increases from 0 to 70 kN/m3. This observation is consistent with the results for
varying t/B, and reinforces the role of relative anchor unit weight during the anchor
keying process. This is further reinforced by Figure 6-29, which shows equivalent
results from weightless anchors with different eccentricity and plate thickness ratios.
It is apparent that the loss of embedment is relatively independent on the thickness
ratios for weightless anchors. For example, at e/B = 0.6 there is ~15% higher loss in
anchor embedment as t/B is halved from 0.1 to 0.05, compared with ~50% for
anchors of finite weight.
Figure 6-30 presents the loading path for anchors with high and low anchor weight.
For the case where the anchor weight is high, the resultant shear force, Fs is
relatively low. Hence the starting point on the yield locus for the high anchor weight
case is at low Fs, with the combined loading path as shown by the solid line on
Figure 6-30. This will lead to low vertical movement (or loss of embedment) during
keying. Consider now the case where the anchor weight is low. The starting point on
the yield surface is high Fs. The loading path is hence typical of that denoted by the
dashed line on Figure 6-30. Inspection of the yield loci along this path reveal
displacements that are more parallel to the plate, which corresponds with a higher
loss of embedment.
In order to permit a simple summary of the numerical results and to incorporate the
combined effect of loading eccentricity and plate thickness, a normalised anchor
geometry ratio is defined as1.0
03.0
⎟⎟⎠
⎞⎜⎜⎝
⎛⎟⎠⎞
⎜⎝⎛⎟⎠⎞
⎜⎝⎛
uABsM
Bt
Be ,
where M0 is the initial moment corresponding to zero net vertical load and defined as:
wafa eWefeWfM ×−×−×+= ''0 )( (6-7)
Figure 6-31 summarises the normalised loss in anchor embedment as a function of
the normalised anchor geometry ratio for the available numerical and experimental
data. The numerical and transparent soil test results in this study and centrifuge test
by O’Loughlin et al. (2006) and Gaudin et al. (2008) are seen to be broadly in good
agreement and indicate that loss in anchor embedment during keying may be
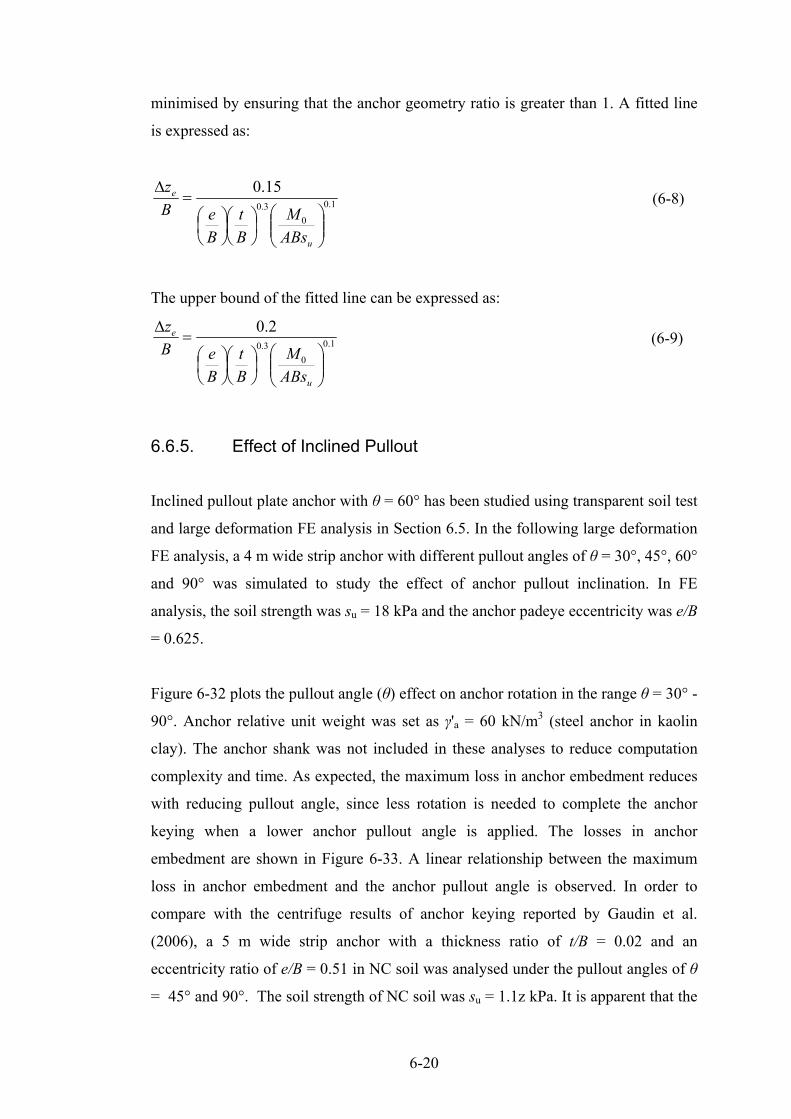
6-20
minimised by ensuring that the anchor geometry ratio is greater than 1. A fitted line
is expressed as:
1.0
03.0
15.0
⎟⎟⎠
⎞⎜⎜⎝
⎛⎟⎠⎞
⎜⎝⎛⎟⎠⎞
⎜⎝⎛
=Δ
u
e
ABsM
Bt
BeB
z (6-8)
The upper bound of the fitted line can be expressed as:
1.0
03.0
2.0
⎟⎟⎠
⎞⎜⎜⎝
⎛⎟⎠⎞
⎜⎝⎛⎟⎠⎞
⎜⎝⎛
=Δ
u
e
ABsM
Bt
BeB
z (6-9)
6.6.5. Effect of Inclined Pullout
Inclined pullout plate anchor with θ = 60° has been studied using transparent soil test
and large deformation FE analysis in Section 6.5. In the following large deformation
FE analysis, a 4 m wide strip anchor with different pullout angles of θ = 30°, 45°, 60°
and 90° was simulated to study the effect of anchor pullout inclination. In FE
analysis, the soil strength was su = 18 kPa and the anchor padeye eccentricity was e/B
= 0.625.
Figure 6-32 plots the pullout angle (θ) effect on anchor rotation in the range θ = 30° -
90°. Anchor relative unit weight was set as γ'a = 60 kN/m3 (steel anchor in kaolin
clay). The anchor shank was not included in these analyses to reduce computation
complexity and time. As expected, the maximum loss in anchor embedment reduces
with reducing pullout angle, since less rotation is needed to complete the anchor
keying when a lower anchor pullout angle is applied. The losses in anchor
embedment are shown in Figure 6-33. A linear relationship between the maximum
loss in anchor embedment and the anchor pullout angle is observed. In order to
compare with the centrifuge results of anchor keying reported by Gaudin et al.
(2006), a 5 m wide strip anchor with a thickness ratio of t/B = 0.02 and an
eccentricity ratio of e/B = 0.51 in NC soil was analysed under the pullout angles of θ
= 45° and 90°. The soil strength of NC soil was su = 1.1z kPa. It is apparent that the

6-21
lower the anchor thickness ratio, the higher is the loss in anchor embedment.
However, both anchors with different thickness ratios show the same gradient of the
linear relationship between the loss in anchor embedment and the anchor pullout
angle. This linear relationship can be expressed as:
θθ θ CkBze +⋅=
Δ (6-9)
in which kθ is the gradient and Cθ is a constant. The constant varies with various
anchor geometry. The gradient is found to be kθ = 0.005 for all anchors when θ is in
degree. It should be noted that the transparent soil test data are close to the FE
results. However, the centrifuge test data by Gaudin et al. (2006) are higher than the
FE results, though the centrifuge test data also show a linear relationship between the
loss in anchor embedment and the anchor pullout angle. This is because that, in the
transparent soil test, the loss in anchor embedment was measured at the anchor centre
via the digital images taken during anchor keying; whilst in the centrifuge test by
Gaudin et al. (2006) the loss in anchor embedment was back-calculated from the
anchor chain displacement measured above the soil surface. Although Gaudin et al.
(2006) considered the chain cutting and tightening effect during anchor initial pullout,
the back-calculation might not be accurate. More study is being conducted on the
relationship between the anchor chain displacement and the loss in anchor
embedment.
6.7. Conclusions
The keying behaviour of vertically installed plate anchor has been investigated in this
chapter, including the suction caisson installation effect. Large deformation finite
element (FE) analyses and centrifuge model tests were conducted. In FE analysis,
adaptive RITSS (remeshing and interpolation technique with small strain) method
was used to simulate continuous rotation of the plate anchor. In centrifuge tests, the
plate anchor was installed in a transparent soil sample to observe the anchor rotation.
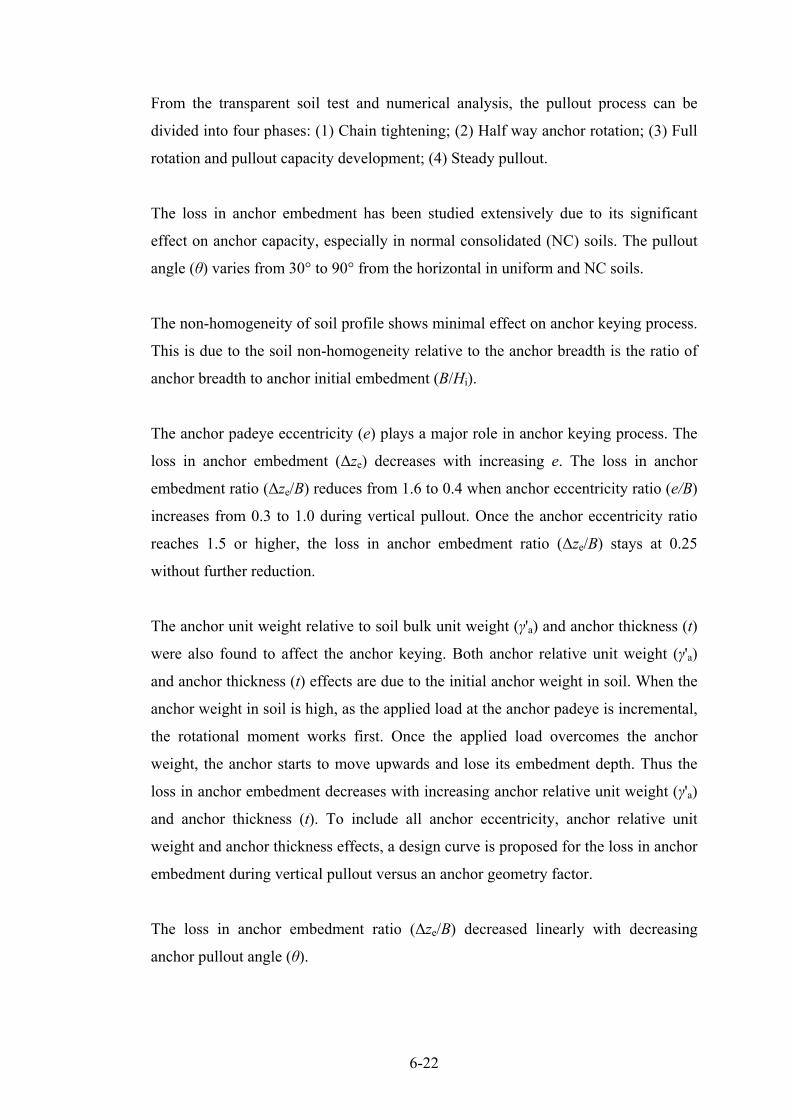
6-22
From the transparent soil test and numerical analysis, the pullout process can be
divided into four phases: (1) Chain tightening; (2) Half way anchor rotation; (3) Full
rotation and pullout capacity development; (4) Steady pullout.
The loss in anchor embedment has been studied extensively due to its significant
effect on anchor capacity, especially in normal consolidated (NC) soils. The pullout
angle (θ) varies from 30° to 90° from the horizontal in uniform and NC soils.
The non-homogeneity of soil profile shows minimal effect on anchor keying process.
This is due to the soil non-homogeneity relative to the anchor breadth is the ratio of
anchor breadth to anchor initial embedment (B/Hi).
The anchor padeye eccentricity (e) plays a major role in anchor keying process. The
loss in anchor embedment (Δze) decreases with increasing e. The loss in anchor
embedment ratio (Δze/B) reduces from 1.6 to 0.4 when anchor eccentricity ratio (e/B)
increases from 0.3 to 1.0 during vertical pullout. Once the anchor eccentricity ratio
reaches 1.5 or higher, the loss in anchor embedment ratio (Δze/B) stays at 0.25
without further reduction.
The anchor unit weight relative to soil bulk unit weight (γ'a) and anchor thickness (t)
were also found to affect the anchor keying. Both anchor relative unit weight (γ'a)
and anchor thickness (t) effects are due to the initial anchor weight in soil. When the
anchor weight in soil is high, as the applied load at the anchor padeye is incremental,
the rotational moment works first. Once the applied load overcomes the anchor
weight, the anchor starts to move upwards and lose its embedment depth. Thus the
loss in anchor embedment decreases with increasing anchor relative unit weight (γ'a)
and anchor thickness (t). To include all anchor eccentricity, anchor relative unit
weight and anchor thickness effects, a design curve is proposed for the loss in anchor
embedment during vertical pullout versus an anchor geometry factor.
The loss in anchor embedment ratio (Δze/B) decreased linearly with decreasing
anchor pullout angle (θ).
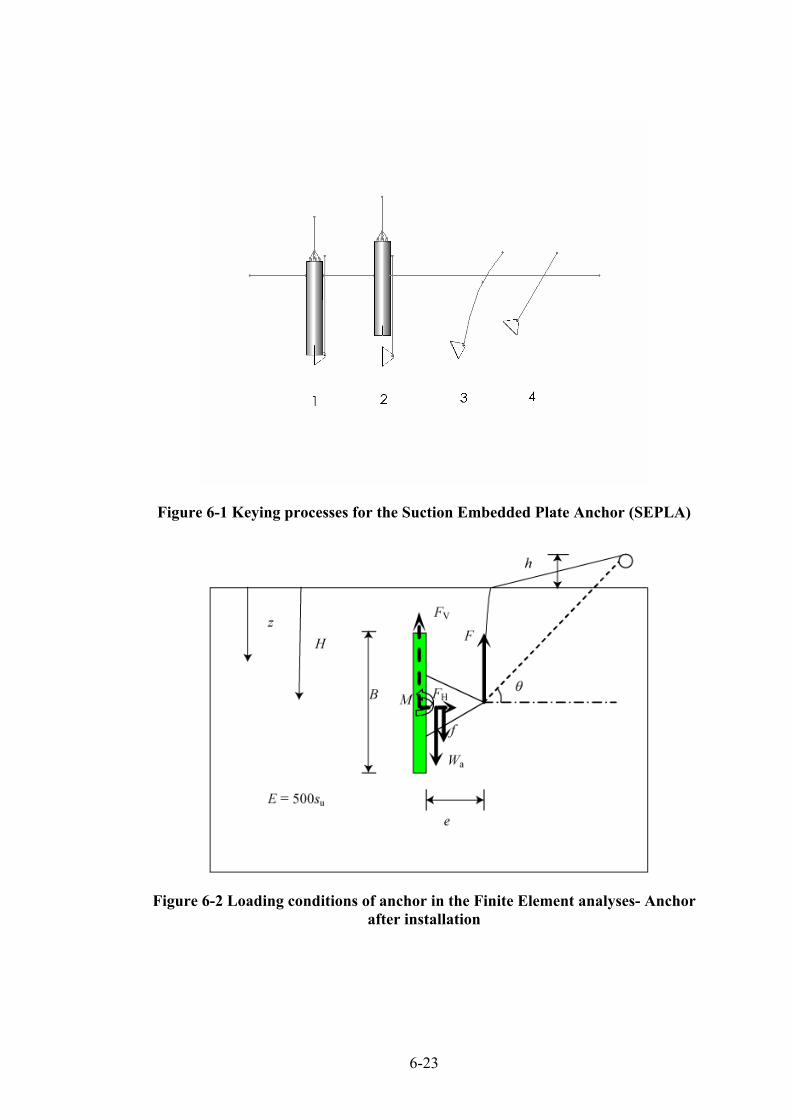
6-23
Figure 6-1 Keying processes for the Suction Embedded Plate Anchor (SEPLA)
Figure 6-2 Loading conditions of anchor in the Finite Element analyses- Anchor after installation

6-24
Figure 6-3 Loading conditions of anchor in the Finite Element analyses- Anchor during rotation (keying)
Figure 6-4 Loading conditions of anchor in the Finite Element analyses- Anchor with ultimate bearing capacity
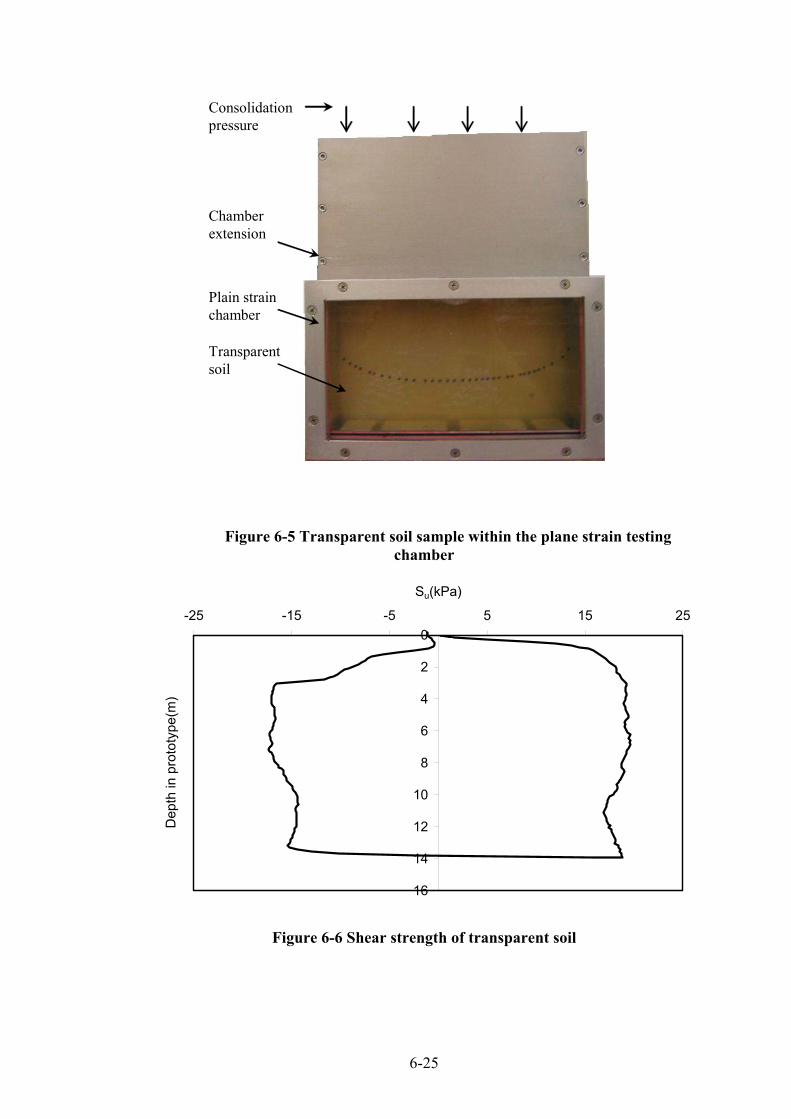
6-25
Transparent soil
Plain strain chamber
Chamber extension
Consolidation pressure
Figure 6-5 Transparent soil sample within the plane strain testing chamber
0
2
4
6
8
10
12
14
16
-25 -15 -5 5 15 25
Su(kPa)
Dep
th in
pro
toty
pe(m
)
Figure 6-6 Shear strength of transparent soil

6-26
Figure 6-7 Transparent soil test setup
x/B3.5 4 4.5 5 5.5 6 6.5
0
1
2
z/B
F
Figure 6-8 Soil flow mechanisms around a strip plate anchor (Horizontal
pullout, H/B=1)

6-27
x/B3.5 4 4.5 5 5.5 6 6.5
0
1
2
z/B
45
F
Figure 6-9 Soil flow mechanisms around a strip plate anchor (45° inclined
pullout without moment (e=0), H/B=1)
x/B3.5 4 4.5 5 5.5 6 6.5
0
1
2
z/B
45
F
Figure 6-10 Soil flow mechanisms around a strip plate anchor (45° inclined pullout with moment (e>0), H/B=1)

6-28
x/B4 5 6
4
5
6
z/B45
F
Figure 6-11 Soil flow mechanisms around a strip plate anchor (45° inclined pullout with moment (e>0, H/B=5)
0
2
4
6
8
10
12
0 2 4 6 8 10Chain Pullout distance in prototype (m)
N c
1
2
3
4 5
1'
2'
3'
4'5'
θ=90°
θ=60°θ
Figure 6-12 Transparent soil pullout response

6-29
(a) (b)
(c) (d)

6-30
(e)
Figure 6-13 Anchor keying in transparent soil test (e/B = 0.625, θ = 90o)
(a) (b)

6-31
(c) (d)
(e)
Figure 6-14 Anchor keying in transparent soil test (e/B = 0.625, θ = 60o)

6-32
-3.5
-3.0
-2.5
-2.0
-1.5
-1.0
-0.5
0.00 0.5 1 1.5 2
x/B
z/B Point 1Point 2Point 3Point 4Point 560°
Figure 6-15 Chain profile during inclined pullout θ = 60°
0
10
20
30
40
50
60
70
80
90
100
0 0.1 0.2 0.3 0.4 0.5 0.6
∆z e/B
Orie
ntat
ion
of p
late
anc
hor β
(°)
Wshank=0, f = 0
Wshank>0, f > 0
Transparent soil
Figure 6-16 Numerical simulation of transparent soil test in FE analysis (e/B=0.625, θ = 90o)
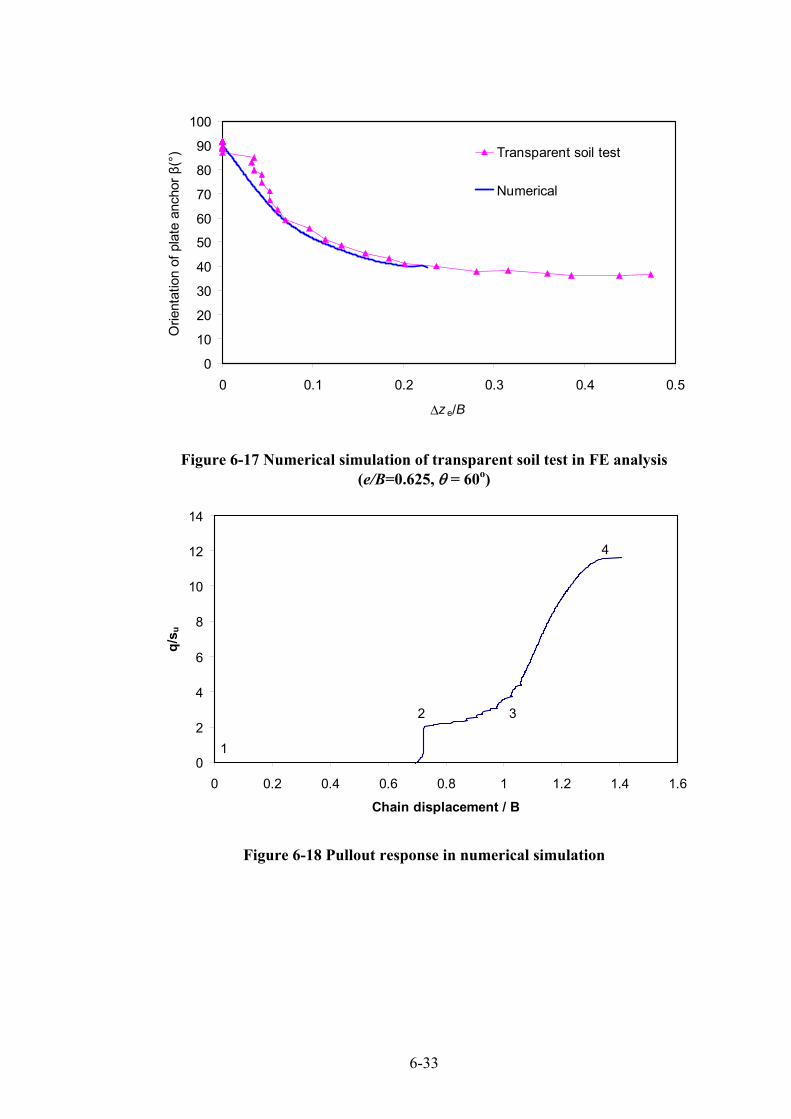
6-33
0
10
20
30
40
50
60
70
80
90
100
0 0.1 0.2 0.3 0.4 0.5
∆z e/B
Orie
ntat
ion
of p
late
anc
hor β
(°) Transparent soil test
Numerical
Figure 6-17 Numerical simulation of transparent soil test in FE analysis (e/B=0.625, θ = 60o)
0
2
4
6
8
10
12
14
0 0.2 0.4 0.6 0.8 1 1.2 1.4 1.6
Chain displacement / B
q/s u
1
2
4
3
Figure 6-18 Pullout response in numerical simulation
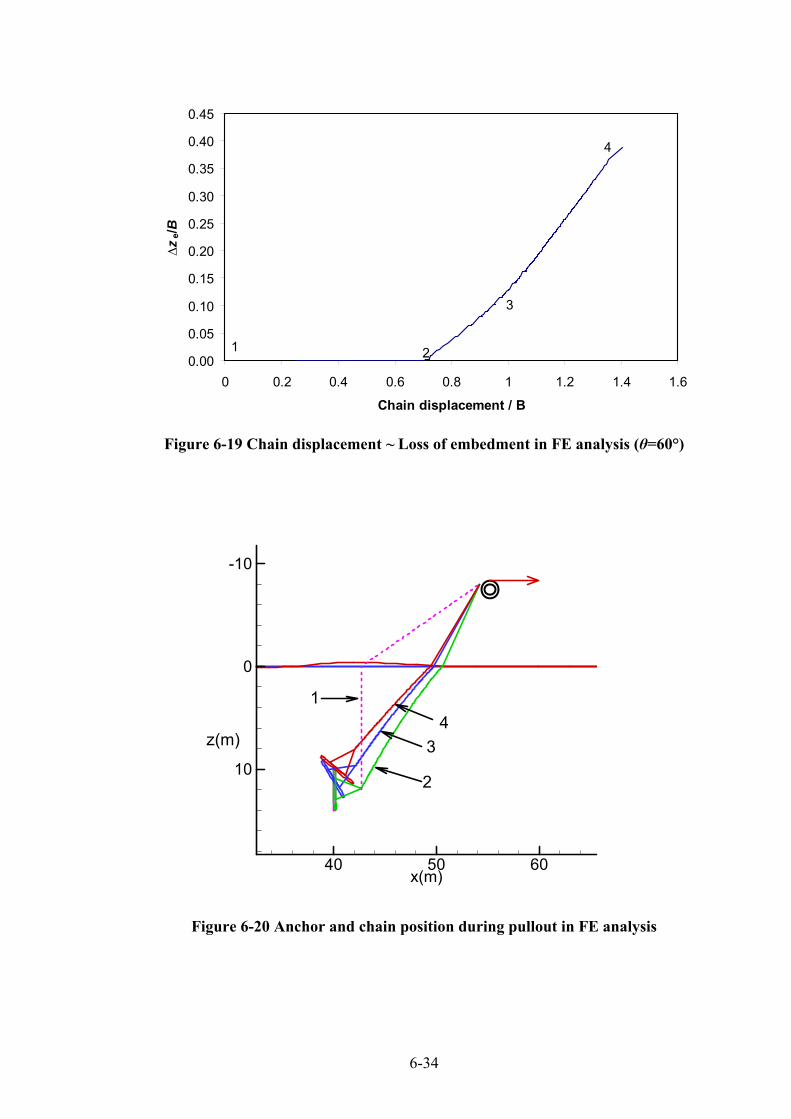
6-34
0.00
0.05
0.10
0.15
0.20
0.25
0.30
0.35
0.40
0.45
0 0.2 0.4 0.6 0.8 1 1.2 1.4 1.6
Chain displacement / B
∆ze/B
1 2
4
3
Figure 6-19 Chain displacement ~ Loss of embedment in FE analysis (θ=60°)
x(m)40 50 60
-10
0
10
z(m)
2
34
1
Figure 6-20 Anchor and chain position during pullout in FE analysis

6-35
x(m)36 38 40 42 44 46
6
8
10
12
14
16
z(m)
Figure 6-21 Flow mechanism during final pullout (FE)
0
10
20
30
40
50
60
70
80
90
100
0 0.1 0.2 0.3 0.4 0.5 0.6 0.7
∆ze/B
Orie
ntat
ion
of p
late
anc
hor β
(°)
B=4m,su = 8.4 kPa (kB/sui=0)B=4m,su = 0.7z kPa (kB/sui=0.33)B=2m,su = 8.4 kPa (kB/sui=0)B=2m,su = 0.7z kPa (kB/sui=0.33)
Figure 6-22 Effect of soil strength profile on anchor keying (Hi/B = 3, θ = 90°)

6-36
0
10
20
30
40
50
60
70
80
90
100
0 0.5 1 1.5 2 2.5 3
∆z e/B
Orie
ntat
ion
of p
late
anc
hor β
(°) Centrifuge results (O'Loughlin et al. 2006)
Numerical results (This study)
e/B=1
e/B=0.5
e/B=0.17
Figure 6-23 Plate anchor rotational behaviour in NC clay (su = 0.7kPa)
0
0.1
0.2
0.3
0.4
0.5
0.6
0.7
0.8
0.9
1
0 0.2 0.4 0.6 0.8 1
Fn/Fnmax
F s/F
smax
M/Mmax=0.99
M/Mmax=0
high eccentricity loading parth
low eccentricity loading parth
Figure 6-24 Combined loading paths for high and low eccentricity plate anchors (O’Loughlin et al. 2006)
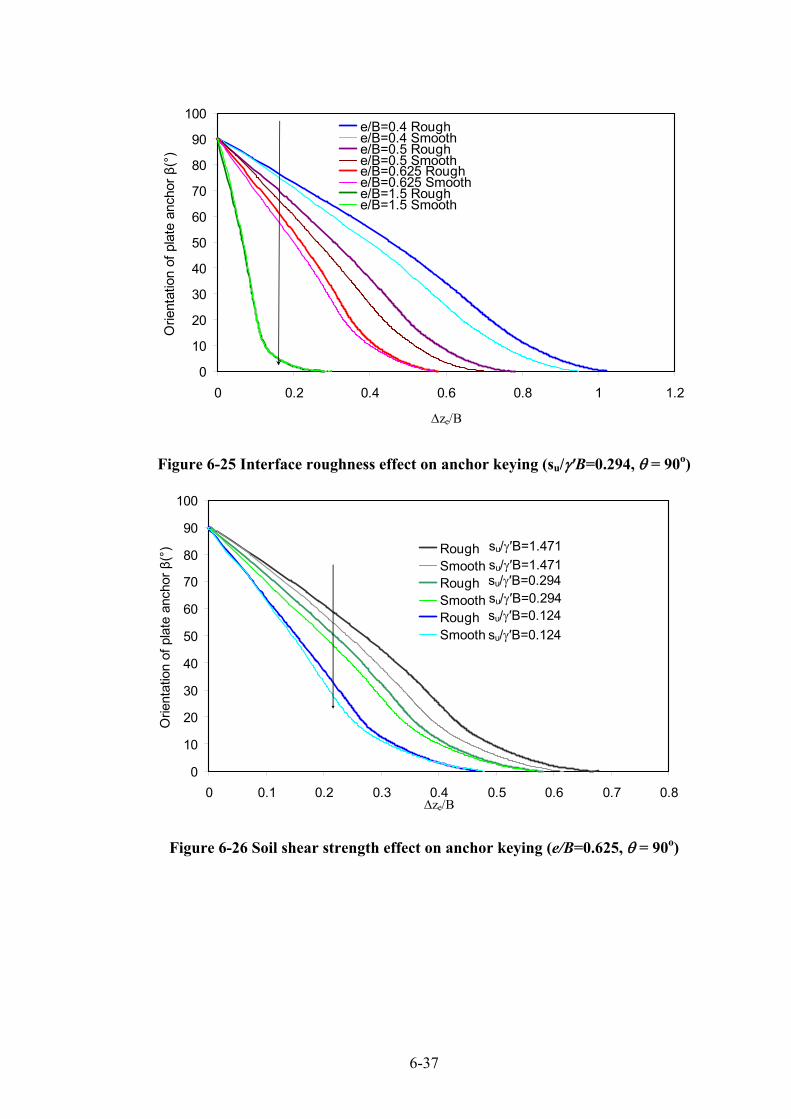
6-37
0
10
20
30
40
50
60
70
80
90
100
0 0.2 0.4 0.6 0.8 1 1.2
∆ze/B
Orie
ntat
ion
of p
late
anc
hor β
(°)
e/B=0.4 Roughe/B=0.4 Smoothe/B=0.5 Roughe/B=0.5 Smoothe/B=0.625 Roughe/B=0.625 Smoothe/B=1.5 Roughe/B=1.5 Smooth
Figure 6-25 Interface roughness effect on anchor keying (su/γ'B=0.294, θ = 90o)
0
10
20
30
40
50
60
70
80
90
100
0 0.1 0.2 0.3 0.4 0.5 0.6 0.7 0.8∆ze/B
Orie
ntat
ion
of p
late
anc
hor β
(°) Rough
SmoothRoughSmoothRoughSmooth
su/γ′B=1.471su/γ′B=1.471su/γ′B=0.294su/γ′B=0.294su/γ′B=0.124su/γ′B=0.124
Figure 6-26 Soil shear strength effect on anchor keying (e/B=0.625, θ = 90o)

6-38
0.0
0.2
0.4
0.6
0.8
1.0
1.2
1.4
1.6
1.8
0 0.2 0.4 0.6 0.8 1 1.2 1.4 1.6e/B
∆ze/
B
t/B=0.05
t/B=0.067t/B=0.1
Figure 6-27 Anchor thickness effect on anchor keying (e/B=0.625, θ = 90o)
0
10
20
30
40
50
60
70
80
90
100
0 0.2 0.4 0.6 0.8 1
∆z e/B
Orie
ntat
ion
of p
late
anc
hor β
(°)
γ'=0kN/m3 γa=0kN/m3 → γa'=0kN/m3
γ'=17kN/m3 γa=77kN/m3 → γa'=60kN/m3
γ'=7kN/m3 γa=77kN/m3 → γa'=70kN/m3
Figure 6-28 Effect of relative anchor unit weight on anchor keying (e/B=0.625, �θ = 90°)

6-39
0.00
0.20
0.40
0.60
0.80
1.00
1.20
0 0.2 0.4 0.6 0.8 1 1.2 1.4 1.6e/B
∆ze/
B
t/B=0.05
t/B=0.067
t/B=0.1
Figure 6-29 Loss of embedment for weightless anchors during vertical pullout
0.0
0.1
0.2
0.3
0.4
0.5
0.6
0.7
0.8
0.9
1.0
0.0 0.2 0.4 0.6 0.8 1.0
Fn/Fnmax
F s/F
smax
M/Mmax=0.99
M/Mmax=0
high anchor weight loading parth
low anchor weight loading parth
Figure 6-30 Combined loading paths for high and low plate anchor’s weight

6-40
0.00
0.50
1.00
1.50
2.00
2.50
0 0.2 0.4 0.6 0.8 1 1.2(e/B)×(t/B) 0.3 ×(M 0 /ABs u ) 0.1
∆ze/
BNumerical (t/B=0.05)Numerical (t/B=0.067)Numerical (t/B=0.1)Numerical (t/B=0.05)Numerical (t/B=0.067)Numerical (t/B=0.1)Numerical (t/B=0.05)Numerical (t/B=0.067)Fitted lineUpper boundNumerical (t/B=0.05,f>0,Wshank>0)Transparent soil test (t/B=0.05)Gaudin et al. (2008)O’Loughlin et al. (2006,t/B=0.067)
su/γ′B=1.471su/γ′B=1.471
su/γ′B=0.294
su/γ′B=0.124
su/γ′B=1.471
su/γ′B=0.294su/γ′B=0.294su/γ′B=0.124
su/γ′B=0.489su/γ′B=0.489
Figure 6-31 Loss in anchor embedment during keying effect factors (θ = 90o)
0
10
20
30
40
50
60
70
80
90
100
0 0.1 0.2 0.3 0.4 0.5 0.6∆z e/B
Orie
ntat
ion
of p
late
anc
hor β
(°)
θ = 60°θ = 90°
θ = 45°
θ = 30°θ
β
Figure 6-32 Anchor pullout under inclined pullout load (e/B = 0.625, γa′=60kN/m3)

6-41
0.0
0.2
0.4
0.6
0.8
1.0
1.2
1.4
1.6
1.8
0 20 40 60 80 100Pullout angle (°)
∆ze/B
Transparent soil test with shank t/B=0.05Numerical analysis t/B=0.05Gaudin et al. (2006) t/B=0.02Numerical analysis t/B=0.02
Figure 6-33 Comparison with existing laboratory data
7-1
CHAPTER 7. EFFECT OF SEPLAS INSTALLATION
7.1. Introduction
During the installation of Suction Embedded Plate Anchors (SEPLAs), soil in the
vicinity of the suction caisson can be disturbed. Figure 7-1 shows the installation of
the SEPLA (Aubeny et al. 2001).
Wilde et al. (2001) reported field tests on SEPLAs to investigate the disturbance
effect of the suction installation. The disturbance factor was suggested to be 0.8 – 1.0
for soil with sensitivity St < 2. While for the moderately sensitive clay 2 ≤ St ≤ 5, the
disturbance effect factor was approximately 0.7.
Gaudin et al. (2006) investigated the influence of the installation process of SEPLAs
in clay. A 1/145th reduced plate anchor model was used to assess capacity and loss of
embedment. Results showed a loss of anchor pullout capacity for the suction
embedded anchors immediately following the retrieval of the caisson due to
weakening of the clay in the vicinity of the anchor. As the clay regained strength
with time, when the anchor was pulled out after an elapsed time, the anchor capacity
increased to match those that were simply jacked in.
In this chapter, the suction caisson installation effect is investigated using finite
element analysis and centrifuge tests. In finite element analysis, a soil disturbed zone
varied from 3 times of the caisson wall thickness to the full area inside the caisson.
Centrifuge tests of suction embedded plate anchors were conducted in normally
consolidated kaolin clay (NC clay) and transparent uniform soil.
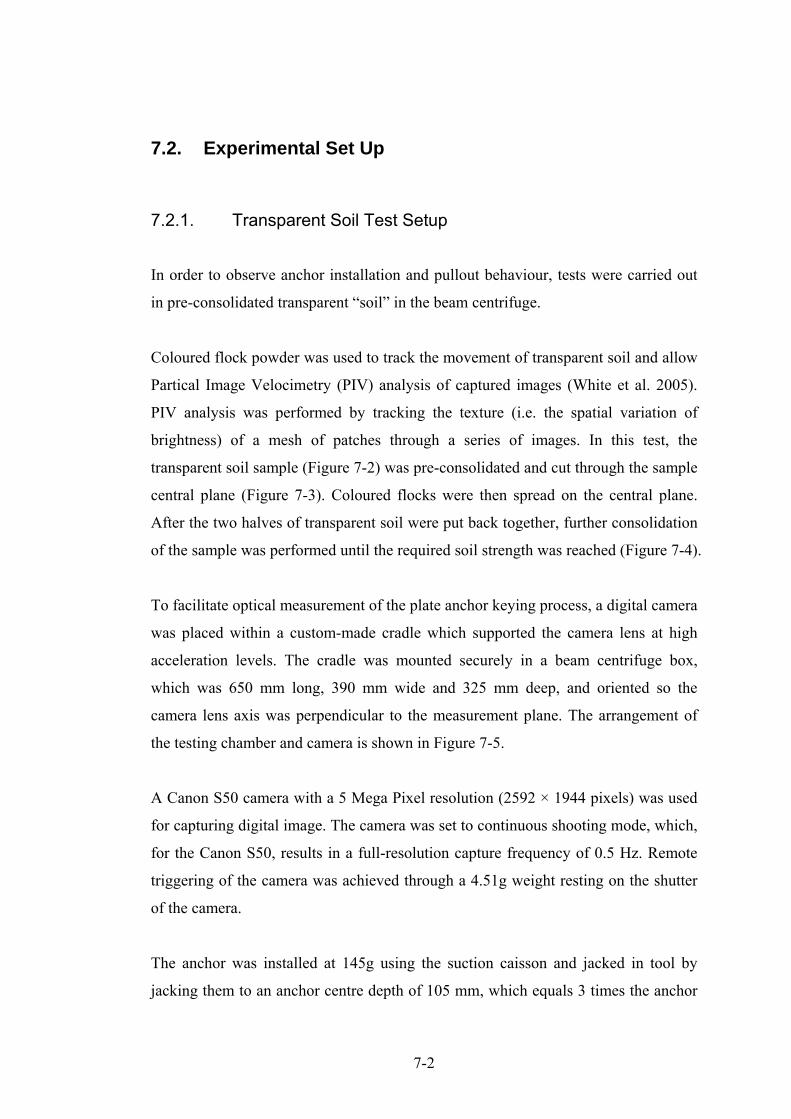
7-2
7.2. Experimental Set Up
7.2.1. Transparent Soil Test Setup
In order to observe anchor installation and pullout behaviour, tests were carried out
in pre-consolidated transparent “soil” in the beam centrifuge.
Coloured flock powder was used to track the movement of transparent soil and allow
Partical Image Velocimetry (PIV) analysis of captured images (White et al. 2005).
PIV analysis was performed by tracking the texture (i.e. the spatial variation of
brightness) of a mesh of patches through a series of images. In this test, the
transparent soil sample (Figure 7-2) was pre-consolidated and cut through the sample
central plane (Figure 7-3). Coloured flocks were then spread on the central plane.
After the two halves of transparent soil were put back together, further consolidation
of the sample was performed until the required soil strength was reached (Figure 7-4).
To facilitate optical measurement of the plate anchor keying process, a digital camera
was placed within a custom-made cradle which supported the camera lens at high
acceleration levels. The cradle was mounted securely in a beam centrifuge box,
which was 650 mm long, 390 mm wide and 325 mm deep, and oriented so the
camera lens axis was perpendicular to the measurement plane. The arrangement of
the testing chamber and camera is shown in Figure 7-5.
A Canon S50 camera with a 5 Mega Pixel resolution (2592 × 1944 pixels) was used
for capturing digital image. The camera was set to continuous shooting mode, which,
for the Canon S50, results in a full-resolution capture frequency of 0.5 Hz. Remote
triggering of the camera was achieved through a 4.51g weight resting on the shutter
of the camera.
The anchor was installed at 145g using the suction caisson and jacked in tool by
jacking them to an anchor centre depth of 105 mm, which equals 3 times the anchor

7-3
width. After installation, retrieval was achieved by pullout using the actuator and soil
strength was determined using the T-bar penetrometer. After installation, anchors
were pulled up at a rate of v = 0.1 mm/s using the mooring chain connected to the
padeye of the anchor. This rate gives a dimensionless velocity, vB/cv (where B is the
plate height and cv is the consolidation coefficient), in excess of 30 thus ensuring an
undrained behaviour (Finnie and Randolph 1994). The pullout angle was adjusted to
60˚ to the horizontal by moving the actuator.
7.2.2. Kaolin Test Setup
In order to investigate the influence of the installation process on the performance of
the anchor, centrifuge tests were also conducted in normally consolidated kaolin clay.
The experimental procedure, presented in Figure 7-6 (Gaudin et al. 2006), used two
actuators. Figure 7-7 and Figure 7-8 shows the centrifuge test setup before
installation:
1. Self-weight installation of the caisson. The first actuator released the caisson
by unwinding a wire connected to a rigid guideline screwed on the lid of the caisson.
The purpose of the guideline was to ensure the verticality of the penetration (Figure
7-9). A pneumatic valve fixed to the lid of the caisson was left open at this stage,
allowing the water to flow out of the caisson.
2. Application of the suction. The pneumatic valve fixed to the lid of the caisson
was closed, sealing the caisson. Suction was applied by a syringe pump connected to
the caisson through a flexible hose. The final penetration depth reached after suction
installation was about 148 mm for every test, which corresponds to 4.23 times the
width of the anchor.
3. Extraction of the caisson. The caisson was extracted by reversed pumping.
The pneumatic valve was left closed and the syringe pump was driven backward to
inject water inside the caisson. At the end of this stage, the anchor was assumed to be
left vertical at the depth reached by the tip of the caisson during the penetration.

7-4
4. Pullout of the anchor. The actuator was adjusted to achieve a 60° inclination
at the padeye of the anchor. The anchor was then pulled out at a rate of v = 0.4 mm/s.
This rate ensured a fully undrained behaviour of the anchor as the normalised
velocity vB/cv was higher than 30 (Finnie and Randolph 1994).
The centrifuge testing program included long term tests (LT, reconsolidation was
allowed between anchor installation and extraction) and short term tests (ST, pullout
was commenced immediately after installation). The reconsolidation time was set up
roughly at 1 hour, which corresponds to about 2.5 years in prototype.
7.3. Numerical Method
Small-strain analyses were undertaken, where the plate anchors were “wished into
place” at each embedment. The soil was simulated as an elastic-perfectly plastic
material with Tresca yield criterion. Poisson’s ratio ν = 0.49 and friction and dilation
angles φ = ψ = 0 were set to simulate undrained soil conditions. Circular plate
anchors were analysed with different embedment ratio H/D up to 4, where H is the
plate embedment depth, D is the diameter of the anchor (Figure 7-10). The soil
stiffness ratio was homogeneous with E/su = 500, where E is Young’s modulus and
su is the undrained shear strength. The shear strength for the soil is assumed to be
uniform. The interface between the anchor and soil was modelled as nodal joint
element (Herrmann 1978). The diameter of the plate anchor used in the finite
element analysis is D = 5 m corresponding to the width of the prototype anchor size
in the centrifuge test. The diameter of the caisson is DC = 4.4 m.
To consider the soil disturbance effect, the disturbed zone was modelled in the finite
element analysis with different sizes: (a) the disturbed zone was assumed to be 3
times the caisson wall thickness (Andersen and Jostad 2001; Andersen and Jostad
2004); (Zone 2 in Figure 7-10); (b) all soil inside the caisson is disturbed (Zone 2 and
3 in Figure 7-10). The undrained shear strength of the disturbed zone was related to
soil sensitivity as the following:

7-5
t
udisturbedu S
ss =, (7-1)
Where su is the soil strength undisturbed and St is soil sensitivity. In the finite
element analysis, h-adaptive mesh was used as optimal in reducing computation time
and maitaining accuracy of solutions (Hu and Randolph 1998b). Figure 7-11 shows
the mesh generated by the h-adaptive mesh generation program. It can be seen that
the mesh is finer in the high strain region around the plate rim and along the
disturbed zone.
Large deformation analyses were also undertaken. The soil is same as that in small
strain analysis. Strip plate anchors were analysed with eccentricity ratio e/B = 0.625
and the initial embedment ratio Hi/B = 3. Details of the set up will be discussed in the
following Section 7.4.3.
7.4. Results and Discussion
7.4.1. Centrifuge Tests
Soil strengths of kaolin clay and transparent soil samples were determined using T-
bar penetrometers (Stewart and Randolph 1991). It can be seen from Figure 7-12 that
an average uniform shear strength, su = 13 kPa, is achieved once the surface effect
becomes negligible for the transparent soil. Undrained shear strength profiles of
kaolin clay are illustrated in Figure 7-13. The measured shear strength profile may be
conveniently described in prototype scale by a constant shear strength gradient of 0.7
kPa/m before testing and of 0.9 kPa/m after testing respectively. The difference is
due to the cycles of swelling and re-consolidation of the sample as the testing took
two and half weeks to complete and the soil swelled and re-consolidated during
ramping down and ramping up of the centrifuge.
The anchor pullout response in transparent soil is shown in Figure 7-14. The pullout
pressure q is defined as pullout force Q divided by anchor area. Figure 7-15 and

7-6
Figure 7-16 display corresponding digitally captured images during pullout for the
anchor installed by suction caisson and jacked in tool respectively. The chain
movement between points 1 and 2 in Figure 7-14 corresponds to images in Figure
7-15 (a) and Figure 7-15 (b). This phase is when the chain cuts through soil while the
anchor stays in place without any movement at all.
Figure 7-15 (b) and Figure 7-15 (c) depict the anchor initial rotation while the chain
is tightened. These two images correspond to points 2 and 3 in Figure 7-14 when the
pullout pressure increases gradually. From Figure 7-15 (c), it can be seen that the
padeye of the anchor has moved vertically upwards as the anchor rotates about 22°.
Tracking the movement of the coloured flocks by PIV analysis can indicate the soil
movements in the vicinity of the rotating anchor, which is shown later in Figure 7-17
revealing soil flow around the plate anchor.
From point 3, the pullout capacity of the anchor is quickly increased to its full
capacity (point 4 in Figure 7-14) corresponding to image Figure 7-15 (d). At point 4,
the anchor has been fully rotated into its final position where the anchor is
perpendicular to the pullout direction. By measuring the anchor location between
Figure 7-15 (a) and Figure 7-15 (d), the loss in embedment during anchor keying (i.e.
the vertical movement of anchor centre between installation and full rotation) is
found to be 0.23 B.
Figure 7-15 (d) and Figure 7-15 (e) show steady anchor movement in the pullout
direction. The anchor pullout direction is measured as 56.7° from the horizontal,
which is a little lower than the expected 60°. This is due to the slight movement in
the vertical direction during the rotation phase. The bearing capacity of the anchor
during this stage still increases slightly between points 4 and 5 in Figure 7-14. This
increase is due to the stronger soil found in the upper layer (Figure 7-12). When the
plate is pulled out to the embedment depth ratio H/B = 1 (point 6 and Figure 7-15 (f)),
soil underneath the plate separates from the anchor base, hence suction force is lost.
In Figure 7-14, the bearing capacity drops dramatically after the soil-anchor
separation.

7-7
The pullout response of the anchor installed by jacking is similar to the one installed
by suction caisson (Figure 7-16). However, from Figure 7-18 it can be observed that
the one installed by suction caisson rotates more quickly than the one installed by
jacking. In order to exhibit this difference, the anchor rotations after different anchor
installation are plotted as the anchor orientation angle (Figure 7-15 (c)) versus the
loss in embedment during anchor keying of plate anchors in Figure 7-18. The angle β
and anchor movement were measured by careful examination of the digital images
captured.
As can be seen from Figure 7-18, initially the anchor installed by suction caisson
undergoes large rotation from vertical position to an orientation angle of 80˚ without
any vertical movement, due to the presence of suction installation above the anchor.
The overall rotation behaviours of both anchors are similar. Both anchors eventually
stabilized at an orientation angle β = 33.7° for the anchor installed by suction caisson
and β = 40.4° for the one installed by jacking. The loss of embedment is 0.23 B and
0.27 B for the suction caisson installed anchor and the jacked in anchor respectively.
Figure 7-19 shows the relationship between the chain displacement and loss of
embedment. It is obvious that once the anchor is fully rotated, after point 4 or 4’, the
loss of embedment and chain movement become linear.
Before the full rotation is reached, there was no anchor movement during chain
tightening. The chain tightening takes 0.017B and 0.035B chain displacement for
jacked in and suction installations respectively. This indicates the chain in suction
installation tightens faster than that of jacked in installation. Thus anchor rotates
faster in suction installation.
As the transparent soil sample is not perfectly uniform, the non-dimensional bearing
capacity factor Nc can be more representative in indicating the pullout response of
plate anchors.
When calculating the factor Nc, the local su value in Figure 7-12 is used. This was
accomplished by careful examination of the images captured. The results of Nc
factors are plotted in Figure 7-20. As can be seen from this Figure, initially there are

7-8
no significant differences for the anchors installed by different methods until the
anchor is fully rotated into position. This may be because the soil in the vicinity of
the anchors was disturbed during the rotation. After the anchor is fully rotated into
position, the breakout factor for the jacked in anchor is about 15% higher than that of
the suction caisson installed anchor.
According to Figure 7-19, the loss of embedment and chain movement become linear
once the anchor is fully rotated, so it becomes possible to estimate the loss of
embedment by assuming the anchor moves straight according to the anchor pullout
angle after the anchor is fully rotated. Figure 7-21 show the Nc factor calculated by
this estimation method. In comparison to the results in Figure 7-20 based on adopting
su from image analysis, the estimation method results agree well with the image
analysis method. This estimation method is found to better predict the loss of
embedment than the method used by Gaudin et al. (2006), which assumes the anchor
moves linearly after the chain has cut through the soil.
The pullout response of plate anchor in kaolin clay is plotted in Figure 7-22. There
are also four phases observed in overall pullout response, which is similar to the
results in transparent soil tests. However, in the kaolin clay test, the pullout
resistances drop dramatically after reaching point 4 when anchor capacity is fully
developed. This capacity drop is due to the decreasing soil strength when reaching
the soil surface. The ultimate pullout resistance for the long term (LT) jacked in
anchor is the lowest because this test was performed first of the three tests. The shear
strength profile at this stage is 0.7 kPa/m in prototype (Figure 7-13), which is lower
than that of 0.9 kPa/m when the short term (ST) jacked in anchor and suction
installed anchor were performed.
The loss of embedment for the anchors in kaolin clay is estimated by assuming the
anchor moves straight forward with steady inclined angle after the anchor is fully
rotated into position according to Figure 7-19. For the Nc factor in kaolin clay, the
soil strength profile 0.7 kPa/m is used for the LT jacked in anchor and 0.9 kPa/m for
the ST jacked in and suction caisson installed anchors. As can be seen in Figure 7-23,
maximum breakout factors for jacked in anchors in the kaolin test is found to be
11.03 and 10.9 respectively for LT test and ST test. After that, the breakout factors

7-9
stabilize at about 9.8 and 8.9, which is about 9 % difference. This may be due to the
difference of re-consolidation time. The higher Nc value shown on the graph when
H/B < 2 is because of the soil heave formed and the very low shear strength near the
surface. The maximum Nc for the ST suction caisson installed anchor is 10.6, which
is 4% lower than that for the LT jacked in anchor. It stabilizes at about 9.1, which is
7% lower than that in the LT jacked in anchor. The difference between the ST jacked
in anchor and the suction caisson installed anchor is not evident, which may be due
to the fact that both soils were disturbed during rotation.
The loss of embedment reported by Gaudin et al. (2006) is about 1.4 times the height
of the anchor for jacked in anchors, in comparison to 0.9 to 1.2 for suction embedded
anchors. Both these values are significantly higher than that observed in the
transparent soil test (0.27 B and 0.23 B respectively). The reason for this may be the
estimation method used in the kaolin clay test in Gaudin et al. (2006), since direct
observation was impossible in the kaolin clay tests.
From the centrifuge tests, the long term or short term jacked in anchor test shows an
Nc value 4 ~ 15 % higher than that for the short term suction caisson test.
7.4.2. Numerical Analysis: Suction Installation Effect on Anchor Capacity – Small Strain FE Analysis
Figure 7-24 illustrates the results from small strain FE analysis with varying
disturbance zone (Figure 7-10). In the FE analysis, soil sensitivity was set as St = 2.5.
From this figure, it can be seen that when there was no soil disturbance, the Nc0
breakout factor stabilized at 12.9 for square anchors. It should be noted that in the
numerical analysis, the anchors were considered as circular anchors, so the bearing
capacity of plate anchors should be reduced by 5 % for square anchors due to the
shape factor in Chapter 4. If the anchor is embedded in soil with disturbed zone as 3
times caisson wall thickness and full disturbance inside the caisson, the breakout
factors were 12.45 and 11.49 respectively, which is 3 % and 11 % less than 12.9.
Figure 7-25 and Figure 7-26 show the flow mechanism and plastic zone for the
anchor embedded in soil with fully disturbed zone in a caisson whilst Figure 7-27

7-10
and Figure 7-28 show the flow mechanism and plastic zone for the anchor in soil
with a disturbed zone 3 times of the thickness of the caisson wall. It is evident that if
the soil is fully disturbed within the caisson, the failure pattern has a bigger plastic
and deformation zone.
The breakout factors from the FE analysis and centrifuge tests (transparent soil tests
and kaolin tests) are plotted in Figure 7-29 for comparison. Results from Gaudin et al.
(2006) are also plotted. In the centrifuge test of Gaudin et al. (2006), the time
permitted to pullout the anchors after the installation is set as long term (LT) and
short term (ST) respectively. The short term means the anchor is pulled out as soon
as the installation is completed. For the LT tests, the reconsolidation time was set up
roughly at 1 hour, which corresponds to about 2.5 years in prototype.
The results for the current jacked in anchors and results from Gaudin et al. (2006) for
jacked in anchors are in a range of 10.9 – 13.5 with an average value of 12.3, which
is 4% lower than the result from numerical analysis for soil with no disturbance. This
may be due to the soil disturbance during keying. The results from the current study
are lower than the results obtained by Gaudin et al. (2006) because of the different
estimation methods used in loss in anchor embedment estimation, hence Nc0
calculation.
For the LT suction caisson installed anchors, the range of breakout factor is from
12.2 to 12.9 with average 12.4, which is only 1 % lower than the jacked in anchors.
Thus it can be seen that when anchors are pulled out after a long term of re-
consolidation after the caisson is retracted, the soil disturbance effect due to suction
caisson installation becomes minimal. At the same the short term capacity shows a
reduction in plate capacity by up to 19 % with a breakout factor 10.6 lower than 12.9
for an anchor in undisturbed soil. The result from the transparent soil test is about
22% less than 12.9.
Overall, by comparing the suction installed anchor with the jacked in installed anchor,
the suction installed anchor exhibits a lower bearing capacity factor in the short term,
which demonstrates the effect of soil disturbance due to suction installation. The soil
disturbance also reduces the loss of embedment during keying process (Figure 7-18).

7-11
However, after extraction of suction caisson, re-consolidation can diminish the effect
of soil disturbance. More investigations are needed to quantify the re-consolidation
time required to minimise soil disturbance effect. In practice, the anchor keying
process should occur right after suction caisson installation, and anchor bearing
capacity development should occur when soil undisturbed strength is recovered if
possible.
The soil sensitivity effect is also studied here. Figure 7-30 shows the results for
anchors embedded in soil with different soil sensitivity St = 2.5 and St = 5 from
simplified FE analysis. The soil disturbed zone is set up assuming the case all soil
inside the caisson are disturbed. The results for St = 5 exhibits 5 % greater reduction
in plate breakout factors. Also the plastic zone extends to the surface of the disturbed
zone (Figure 7-31). Thus, soil sensitivity plays an important role in plate bearing
capacity estimation.
7.4.3. Numerical Analysis: Suction Installation Effect on Anchor Rotation – Large Deformation FE Analysis
For SEPLAs, the soil in the vicinity of the suction caisson is remoulded during
installation. Gaudin et al. (2006) showed that the suction installation process reduces
the subsequent plate anchor capacity and appears to have an influence on the loss in
embedment during keying. The latter point has been examined using finite element
analyses as shown in Figure 7-32. In the analyses all the soil within the suction
caisson was assumed to be remoulded, with the remoulded shear strength related to
the intact undrained shear strength soil divided by the soil sensitivity of St = 2.5 as
the worst scenario. The un-remoulded soil shear strength was normally consolidated
with su = 0.7 z kPa. The size of the disturbed zone D was assumed to be equal to the
diameter of the suction caisson, which was 4.5 m in this case. The effective unit
weight of the soil was γ's = 17 kN/m3 and the anchor unit weight was considered as γa
= 77 kN/m3. The anchor padeye eccentricity ratio was e/B = 0.625 and the initial
embedment ratio Hi/B was 3. The thickness of the anchor was 0.2 m with the anchor
width B = 4 m.

7-12
The numerical results are presented in Figure 7-33, where it can be seen that the
anchor embedded in disturbed soil initially undergoes much larger vertical
displacements than the anchor embedded in intact soil. However, when the plate
orientation reaches β = 0 the loss in anchor embedment is much the same for both
remoulded and intact soil. The disturbance effect would appear to have most
consequence where the final anchor orientation is inclined, as is the case with several
mooring systems.
7.5. Conclusions
A series of centrifuge tests and FE analysis have been conducted in order to
investigate the influence of the installation process on the behaviour of suction
embedded plate anchors. The main findings are as follows:
After anchor installation, the anchor pullout process can be divided into four phases,
which is similar to the keying of anchors discussed in Chapter 6. The soil disturbance
affects all phases.
Maximum anchor capacity for jacked in anchors in the centrifuge test has been found
to correspond to an average bearing capacity factor of about 12.3, which is in
agreement with the FE analysis results for anchors embedded in undisturbed soils.
Suction installation affects the short term capacity of the anchor and the loss of
embedment during the keying process. The reduction in anchor capacity can be up to
22% by comparison with that for undisturbed soil. The loss of embedment in
disturbed soil is smaller for anchors in suction installation. However, when re-
consolidation is allowed after extraction of the suction caisson, the undisturbed soil
strength can be recovered. Thus, if possible, the anchor should be keyed into position
immediately after suction caisson extraction, and the anchor should develop its
capacity when the soil undisturbed strength is recovered.
During anchor keying and capacity development, soil sensitivity plays an important
role, thus, soil in situ sensitivity should be evaluated accurately. The limit anchor
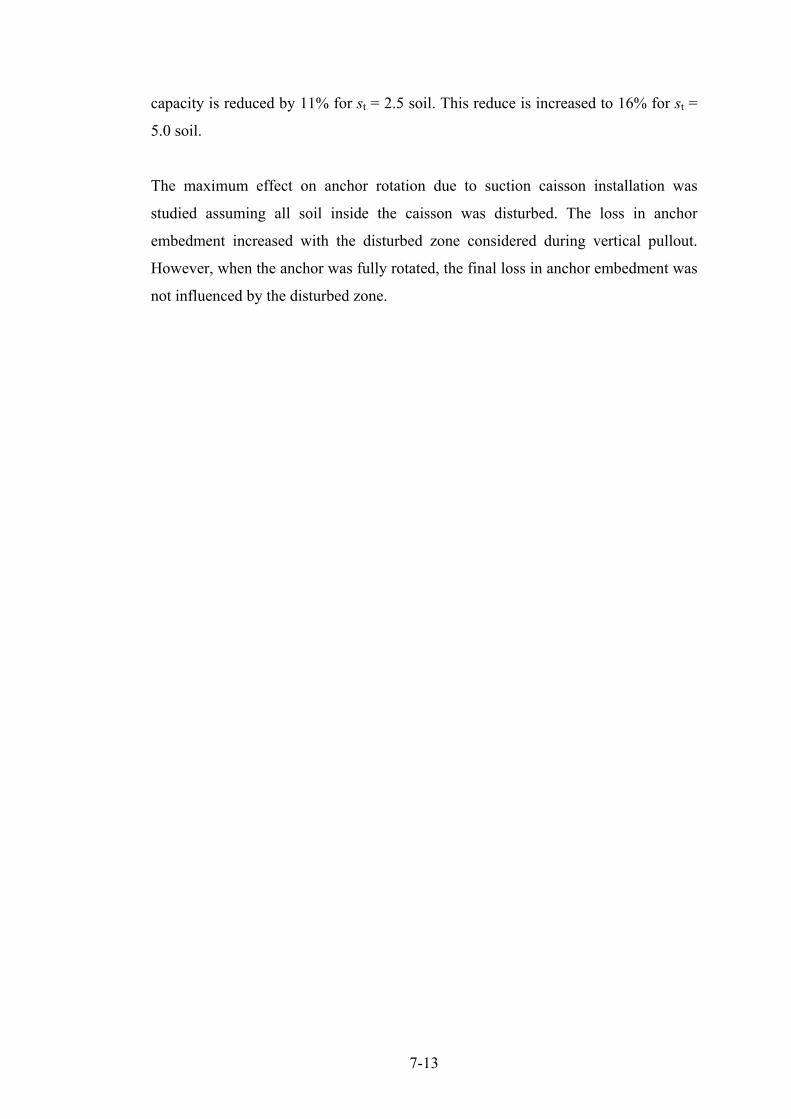
7-13
capacity is reduced by 11% for st = 2.5 soil. This reduce is increased to 16% for st =
5.0 soil.
The maximum effect on anchor rotation due to suction caisson installation was
studied assuming all soil inside the caisson was disturbed. The loss in anchor
embedment increased with the disturbed zone considered during vertical pullout.
However, when the anchor was fully rotated, the final loss in anchor embedment was
not influenced by the disturbed zone.

7-14
Insertion of anchorinside a suction caisson
Retraction ofsuction
Application of loadto rotated anchor
Anchor
Zone of disturbed soil
Suctioncaisson
Figure 7-1 Installation of SEPLA (Aubeny et al. 2001)
Figure 7-2 Transparent soil before cut into halves
Plane strain chamber
Transparent soil sample

7-15
Figure 7-3 Half transparent soil sample
Figure 7-4 transparent soil sample with Colored flock powder in the central plane
Plane strain chamber
Plane strain chamber Transparent soil sample
Transparent soil sample

7-16
Figure 7-5 Transparent soil test setup
Figure 7-6 Kaolin clay test setup (Gaudin et al., 2006)
Camera cradle
Transparent soil

7-17
Figure 7-7 Kaolin clay test setup
Figure 7-8 Plate anchor installation method
Actuator
Syringe pump
Strong box
Winch
Suction caisson
Monitoring camera
Actuator

7-18
Figure 7-9 Equipment for installation
Figure 7-10 Setup of numerical analysis
Installation guide
To syringe pump
Drainage valve
External ppt
Internal ppt
Water and Kaolin clay
Suction caisson

7-19
x/D0 1 2 3 4
0
1
2
3
4
z/D
Figure 7-11 Mesh generated using h-adaptivity
-25
-20
-15
-10
-5
0-15 -10 -5 0 5 10 15 20
s u(kPa)
Dep
th in
pro
poty
pe (m
)
Pull out Install
Figure 7-12 Shear strength profile of transparent soil

7-20
-30
-25
-20
-15
-10
-5
0-40 -30 -20 -10 0 10 20 30 40
s u(kPa)
dept
h in
pro
toty
pe (m
)TB1 Before testingTB2 Before testingTB3 After testingTB4 After testingTB5 After testing
Before testing
After testing
InstallPull out
Figure 7-13 Shear strength profile of kaolin clay
0
20
40
60
80
100
120
0 5 10 15 20Chain displacement in prototype (m)
Pre
ssur
e(kP
a)
20%
122'
3'3
4'
4
5'
5 6'
6
Suction caisson
Jacked in
Figure 7-14 Anchor pullout response in transparent soil (θ=60°)

7-21
(a) Point 1 (b) Point 2
(c) Point 3 (d) Point 4

7-22
(e) Point 5 (f) Point 6
Figure 7-15 Plate anchor during pullout in transparent soil sample after suction caisson installation (θ=60°)
(a) Point 1' (b) Point 2'

7-23
(c) Point 3' (d) Point 4'
(e) Point 5' (f) Point 6'
Figure 7-16 Plate anchor during pullout in transparent soil sample after jacked in installation (θ=60°)

7-24
Figure 7-17 PIV analysis
0
10
20
30
40
50
60
70
80
90
100
0 0.05 0.1 0.15 0.2 0.25 0.3 0.35 0.4 0.45 0.5
Δze/B
β
Jacked in
Suction caisson
θa
β
θ0.23B
0.27B
Figure 7-18 Anchor rotation for anchors installed by different methods in transparent soil (θ=60°)
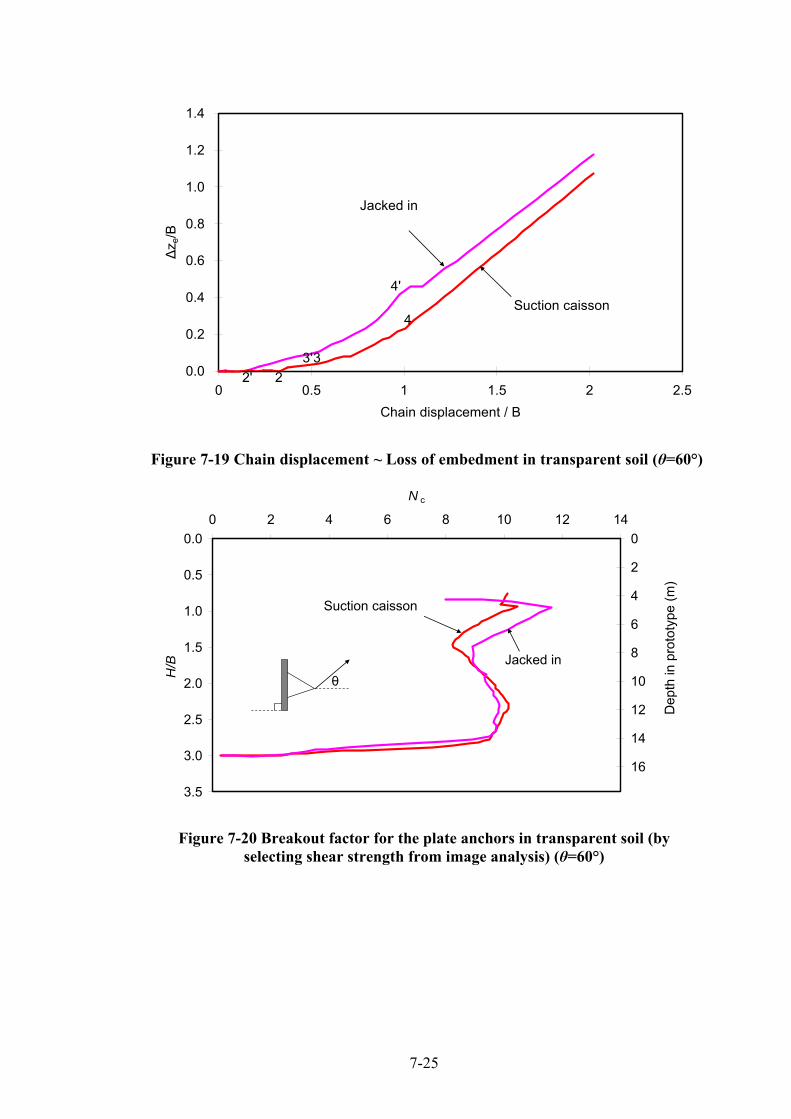
7-25
0.0
0.2
0.4
0.6
0.8
1.0
1.2
1.4
0 0.5 1 1.5 2 2.5Chain displacement / B
Δz e
/B
Jacked in
Suction caisson
22'33'
4
4'
Figure 7-19 Chain displacement ~ Loss of embedment in transparent soil (θ=60°)
0.0
0.5
1.0
1.5
2.0
2.5
3.0
3.5
0 2 4 6 8 10 12 14
N c
H/B
0
2
4
6
8
10
12
14
16
Dep
th in
pro
toty
pe (m
) Jacked in
Suction caisson
θ
Figure 7-20 Breakout factor for the plate anchors in transparent soil (by selecting shear strength from image analysis) (θ=60°)

7-26
0.0
0.5
1.0
1.5
2.0
2.5
3.0
3.50 2 4 6 8 10 12 14
N c
H/B
θ
Suction caisson
Jacked in
Figure 7-21 Breakout factor for the plate anchors in transparent soil (by estimating shear strength)
0
20
40
60
80
100
120
140
160
180
0 5 10 15 20 25 30 35Chain displacement in prototype (m)
Pre
ssur
e (k
Pa)
Suction caisson ST
Jacked in ST
Jacked in LT
1 2
3
4
θ
Figure 7-22 Anchor pullout response in kaolin clay (θ=60°)

7-27
0.0
0.5
1.0
1.5
2.0
2.5
3.0
3.5
4.0
4.5
0 2 4 6 8 10 12 14
N c
H/B
Jacked in (LT)
Jacked in (ST)
Suction caisson (ST)
θ
Figure 7-23 Breakout factor for the plate anchors in kaolin clay (θ=60°)
0
2
4
6
8
10
12
14
16
0 1 2 3 4 5 6H/D
N c0
No disturbance 3 times wall thickness disturbance
Fully disturbed
Figure 7-24 Breakout factors for soil with various disturbance zone

7-28
x/D0 0.5 1 1.5 2
3
4
5
z/D
Figure 7-25 Soil flow mechanism for a plate anchor in fully disturbed soil in a caisson
Figure 7-26 Plastic zone for a plate anchor in fully disturbed soil in a caisson
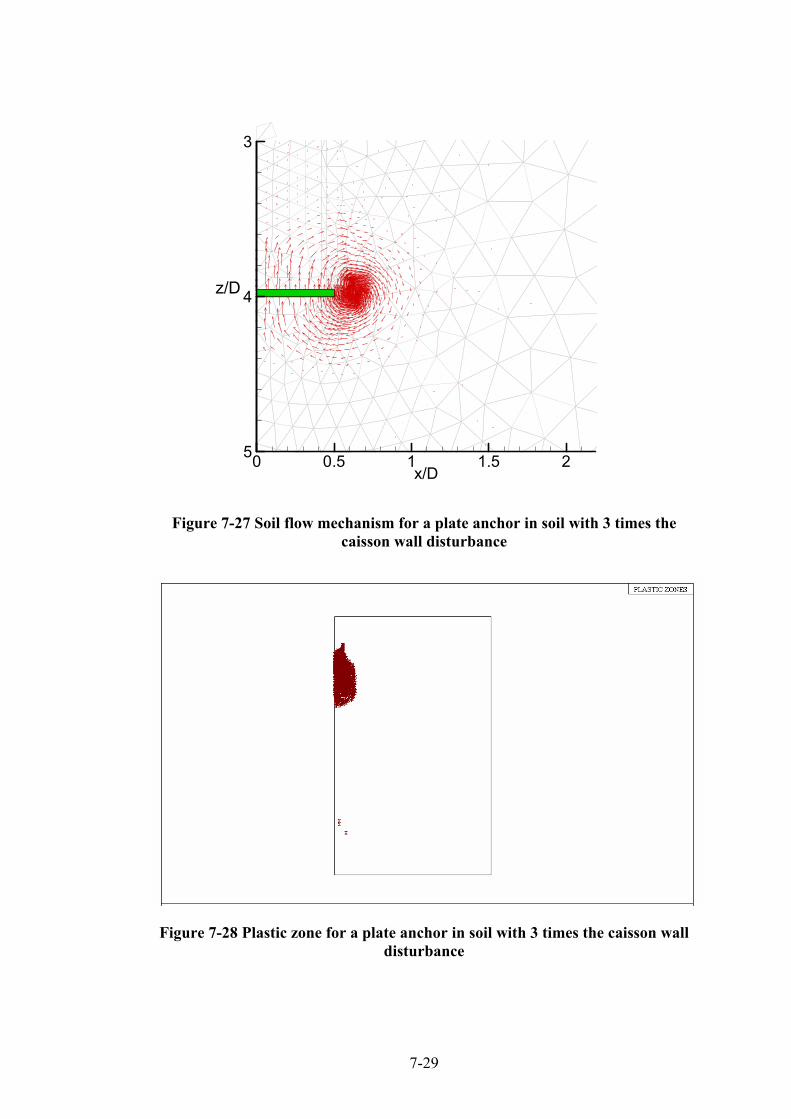
7-29
x/D0 0.5 1 1.5 2
3
4
5
z/D
Figure 7-27 Soil flow mechanism for a plate anchor in soil with 3 times the caisson wall disturbance
Figure 7-28 Plastic zone for a plate anchor in soil with 3 times the caisson wall disturbance

7-30
0
2
4
6
8
10
12
14
16
0 1 2 3 4 5 6H/B
N c0
Suction ST (Gaudin et al. 2006)Suction LT (Gaudin et al. 2006)Jacked in (Gaudin et al. 2006)Suction ST (Current)Jacked in (Current)transparent soil test
No disturbance
Field test lower bound (Wilde 2001)
3 times wall thickness disturbance
Fully disturbed
Figure 7-29 Effect of soil disturbance on Nc0 factor
0
2
4
6
8
10
12
14
16
0 1 2 3 4 5 6H/D
N c0No disturbance
St = 2.5St = 5
Figure 7-30 Effect of soil sensitivity

7-31
Figure 7-31 Plastic zone for plate anchor in soil with sensitivity St=5
Figure 7-32 Numerical setup for disturbance effect

7-32
0
10
20
30
40
50
60
70
80
90
100
0 0.1 0.2 0.3 0.4 0.5 0.6 0.7
∆z e/B
Orie
ntat
ion
of p
late
anc
hor β
(°)
Disturbed
Undisturbed
θ
Figure 7-33 Disturbance effect of suction installation (θ=90°)

8-1
CHAPTER 8. CONCLUDING REMARKS
8.1. General
Plate anchors are being used increasingly in deep water development fields. The
research has investigated the pullout behaviour of SEPLAs in uniform and NC
(normally consolidated) clays, which is a relevant offshore foundation type for deep-
water situations. The aims of this study were to determine the anchor capacity,
anchor keying and anchor installation effect for pre-embedded and continuous
pullout anchors in clay.
The majority of past research on anchor behaviour has been experimentally based
and very few numerical analyses have been performed to determine the ultimate
pullout load of anchors. Furthermore, most numerical studies can be found relating to
anchor behaviour in clay also fall into the “immediate breakaway” category. The
study presented in the thesis in determining the ultimate bearing capacity of anchors
is unique in that a separation depth concept and a large deformation formulation have
been used.
Anchors are frequently placed at orientations somewhere between horizontal and
vertical depending on the application and design requirements, particularly offshore.
The investigation into the effect of anchor orientation on the anchor capacity has
been conducted to study the inclination effect in uniform and NC clay.
Numerical analysis and transparent soil test have been performed in this thesis to
study the keying of plate anchors in clay. The significance of a wide range of

8-2
variables which influence anchor keying has been investigated, including anchor
roughness, anchor eccentricity, thickness and shear strength of soil etc.
The effect of soil disturbance due to suction caisson installation on plate anchor
capacity has been investigated by centrifuge testing and numerical analysis. The
numerical analysis was performed by simulating a disturbed zone in FE analysis.
8.2. Vertical Pullout of Plate Anchors in Uniform and NC Clay
The capacities of horizontal anchor during vertical pullout were investigated using
small strain and large deformation FE analysis.
In small strain analysis, the pullout capacity factor (Nc0) in weightless soil with
uniform strength showed good agreement with existing small scale laboratory test
and numerically truncated FE results. The discrepancies in the existing laboratory
data and analytical solutions were found to be due to the effects of soil strength ratio
(su/γ'B for strip anchor or su/γ'D for circular anchor) and soil stiffness ratio (E/su). At
high soil strength ratios, separation occurs for vented anchors, and the anchor
capacity mobilised at a given displacement, such as 0.2 D, increased with increasing
soil stiffness ratio.
From small strain analysis of fully attached anchors, the transitional embedment
depth from shallow to deep failure mechanisms was found to be HSD/B = 2 for strip
anchors and HSD/D = 1 for circular anchors. The ultimate pullout capacity factors for
deeply embedded and fully attached anchors were found to be: Nc = 11.6 and 11.7
respectively for smooth and rough strip anchors; Nc = 13.1 and 13.5 for smooth and
rough circular anchors, both for a plate thickness ratio of 0.05.
In large deformation analysis of plate anchors in uniform soil, the pullout response of
an attached anchor forms a unique curve regardless of soil unit weight, γ', soil
strength, su and anchor size B (or D).

8-3
For a vented anchor in uniform soil, the anchor breaks away from the soil below the
anchor at a certain embedment depth (Hs). The separation depth ratio (Hs/B or Hs/D)
was found to increase linearly with the undrained shear strength ratio of soil, su/γ'B or
su/γ'D. The linear relationships were given in Equation 4-5 and correspond to soil
strength ratios of su/σ'v of 0.13 and 0.16 for circular and strip anchors respectively.
When a vented anchor is initially embedded below the separation depth, the pullout
response converges to the A-curve first. After the anchor embedment reaches the
separation depth, the pullout capacity decreases rapidly and linearly. When an anchor
is initially embedded above the separation depth, the ultimate pullout capacity is
determined by the shear resistance from the vertical shear plane and the soil weight
above the anchor, with separation occurring immediately.
For circular anchors embedded in NC clay with continuous pullout, the FE results
agreed well with data from centrifuge model tests. As for the case of anchors in NC
clay, separation was governed by the strength ratio and occurs for k/γ' ≥ 0.13 or 0.16
respectively for circular and strip anchors.
The breakout factors for square and rectangular anchors in weightless soil were up to
2% lower than those for circular anchors at the same embedment ratios; rectangular
anchors with L/B = 5 can be considered as strip anchors.
8.3. Inclined Pullout Plate Anchor
The effect of anchor inclination in uniform and NC clay was investigated by
performing numerical analysis.
It was found that the bearing capacities of inclined plate anchors are affected by both
inclination angle and base conditions. For fully attached plate anchors, the
horizontally embedded plate anchors have the highest bearing capacity with the
vertically embedded anchors show the highest bearing capacity if the anchor base is
vented. The separation depth of the plate anchors can be assessed by the simple
equation from vertically pulled out plate anchors.
8-4
It can be seen clearly in the 1g test that the results show a vented anchor base. At
shallow embedment, plate anchors have the higher bearing capacity if plate anchor
orientation β is smaller. Generally the square anchors have a higher bearing capacity
than those of rectangular anchors.
In NC clay, it can be seen that the capacity factors for anchors in NC clay were
always less than those in uniform clay. For anchors at the same embedment depth,
the difference in the capacity factors between anchors in uniform clay and NC clay
increase with increasing β.
The flow mechanism in NC clay is non-symmetric and has a centre at the top of the
anchor, rather than at its centre for uniform clay.
8.4. Keying of Vertical and Inclined Pullout Plate Anchors in Clay
The loss in anchor embedment during keying for a vertically installed plate anchor
has been investigated. The influence factors studied include anchor geometry, anchor
submerged unit weight and pullout angle. Large deformation FE analyses and
centrifuge model tests were conducted. In the FE analysis, the adaptive RITSS
method was used to simulate continuous rotation of the plate anchor during keying.
In the centrifuge tests, the plate anchor rotation was observed via transparent soil
tests.
From the transparent soil test and numerical analysis, the pullout process can be
divided into four phases: (1) Chain tightening; (2) Half way anchor rotation; (3) Full
rotation and pullout capacity development; (4) Steady pullout.
Non-homogeneity of soil shear strength was found to have minimal effect on anchor
keying for a deeply installed plate anchor. Anchor roughness also had little effect on
anchor keying especially in soft soils.
8-5
The anchor padeye eccentricity (e) plays a major role in the anchor keying process.
The loss in anchor embedment (Δze) decreases with increasing e. The anchor unit
weight relative to soil bulk unit weight (γ'a) and anchor thickness (t) are also found to
affect the anchor keying.
These factors can be combined as a normalised anchor geometry
factor,1.0
03.0
⎟⎟⎠
⎞⎜⎜⎝
⎛⎟⎠⎞
⎜⎝⎛⎟⎠⎞
⎜⎝⎛
uABsM
Bt
Be . By using this anchor geometry factor, the loss in anchor
embedment can be predicted for vertical pullout of the anchor using a simple
relationship.
The loss in anchor embedment ratio (Δze/B) decreased linearly with decreasing
anchor pullout angle (θ).
8.5. Effect of SEPLAs Installation
Centrifuge tests and FE analyses were presented to study the influence of the
installation process on the behaviour of suction embedded plate anchors. In
Centrifuge test, jacked in and suction caisson installed plate anchors were
investigated.
It was found that maximum anchor capacity for jacked in anchors in the centrifuge
test corresponding to an average bearing capacity factor of 12.3, which is in
agreement with the FE analysis results for anchor embedded in undisturbed soils.
Suction installation affects the short term capacity of the anchor and the loss of
embedment during keying process. The reduction in anchor capacity can be up to
22% by comparison with that for undisturbed soil. If possible, the anchor should be
keyed into position immediately after suction caisson extraction in order to reduce
loss in anchor embedment during keying.

8-6
During anchor keying and capacity development, soil sensitivity played an important
role. Thus, soil in situ sensitivity should be evaluated accurately.
8.6. Future Work
Among desirable future work, the following topics are suggested to be the most
important and the most relevant to this study.
1. Although it is accurate and computationally efficient to use perfect elastic-
plastic model in large deformation analysis, the real soil behaviour is more
complex. The first priority in future work should, therefore, implement strain-
softening and hardening models for large deformation plate anchor analysis.
2. RITSS has been introduced to three dimensional space by Wang et al. (2007).
More analysis of square and rectangular anchors is recommended for study of
the three dimensional large deformation effect.
3. The installation effect of SEPLAs has been studied in this thesis by centrifuge
testing and small strain numerical analysis. More centrifuge tests and large
deformation analysis in 3D with consolidation is essential to investigate the
real behaviour of the anchors in the field.
4. Another interesting direction for future research concerns estimation of the
capacity of anchors, the loss of embedment during keying and the installation
effect of SEPLAs in layered soils.
5. The current study has focused only on plate anchor analysis in clay. Further
study of plate anchors in sand would be valuable.

9-1
CHAPTER 9. REFERENCES
Adams, J. I., and Hayes, D. C. (1967). "The uplift capacity of shallow foundations."
Ontario Hydro-Research Quarterly, 19(1), 1-13.
Adrian, R. J. (1991). "Particle imaging techniques for experimental fluid mechanics."
Ann. Rev. Fluid Mech., 23, 261–304.
Al-Tabbaa, A. (1987). "Permeability and Stress-strain Response of Speswhite
Kaolin," Ph.D Thesis, Cambridge University.
Ali, M. S. (1968). "Pull-out Resistance of Anchor Plates and Anchored Piles in Soft
Bentonite Clay," M.Sc Thesis, Duke University, Durham, N.C.
Andersen, K. H., Dyvik, R., Schroeder, K., Hansteen, O. E., and Bysveen, S. (1993).
"Field tests of anchors in clay II: Predictions and interpretation." J of Geotech.
Engrg, ASCE, 119 (10), 1532-1549.
Andersen, K. H., and Jostad, H. P. (2001). "Shear strength along outside wall of
suction anchors in clay after installation." ISOPE-2002: Twelfth (2002)
International Offshore and Polar Engineering Conference, Kyushu, Japan, 785-
794.
Andersen, K. H., and Jostad, H. P. (2004). "Shear strength along inside of suction
anchor skirt wall in clay." Proceedings of Annual Offshore Technology
Conference, Houston, U.S.A., OTC 16844.
Anderson, K. H., and Jostad, H. P. (1999). "Foundation Design of Skirted
Foundations and Anchors in Clay." Proceedings of Annual Offshore Technology
Conference, Houston, U.S.A., OTC 10824.
Ashbee, R. A. (1969). "A uniaxial analysis for use in uplift foundation calculations."
Report RD/L/R 1608, Central Electricity Research Laboratory.
Aubeny, C. P., Murff, D. J., and Roesset, J. M. (2001). "Geotechnical issues in deep
and ultra deep waters." International Journal of Geomechanics, 1(2), 225 - 247.
9-2
Bathe, K.-J., and Ozdemir, H. (1976). "Elastic-plastic large deformation static and
dynamic analysis." Computers & Structures, 6(2), 81-92.
Belytschko, T., and Kennedy, J. M. (1978). "Computer methods for subassembly
simulation." Nucl. Eng. Des.(47), 17-38.
Benson, D. J. (1989). "An efficient, accurate, simple ale method for nonlinear finite
element programs." Computer Methods in Applied Mechanics and Engineering,
72(3), 305-350.
Bhatnagar, R. S. (1969). "Pullout Resistance of Anchors in Silty Clay," M.Sc Thesis,
Duke University, Durham, N.C.
Bowles, T., and Fulton, T. (2001). "Full taut-leg polyester drilling unit mooring
established in Gulf of Mexico: System can go to 10,000 ft depths." Offshore,
61(12), 68-69.
Bransby, M. F., and O'Neill, M. P. (1999). "Drag anchor fluke-soil interaction in
clays." NUMOG VII Int. Symp. on Num. Models in Geomechs, Graz, Austria,
489-494.
Canann, S. A., Stephenson, M. B., and Blacker, T. D. (1993). "Optismoothing: An
optimization-driven approach to mesh smoothing." Finite Elements in Analysis
and Design, 13(2), 185-190.
Carter, J. P. (1977). "Finite deformation theory and its application to elastoplastic
soils," Ph.D thesis, University of Sydney.
Carter, J. P., and Balaam, N. (1990). "AFENA user's manual." Geotechnical
Research Centre, The University of Sydney.
Carter, J. P., Desai, C. S., Potts, D. M., Schweiger, H. F., and Sloan, S. W. (2000).
"Computing and computer modelling in geotechnical engineering." GeoEng
2000, Melbourne, Australia.
Chen, W., and Randolph, M. F. (2004). "Radial stress changes around caissons in
clay installed by jacking and by suction." Proceedings of the 14th International
Offshore and Polar Engineering Conference, Toulon, France, 493-499.
Cheng, J.-C., and Kikuchi, N. (1986). "A mesh re-zoning technique for finite element
simulations of metal forming processes." International Journal for Numerical
Methods in Engineering, 23, 219-228.
Clarkston, B. J., Dhuldhoya, N. P., Mileo, M. A., and Moncrief, J. R. (2001). "Gulf
of mexico ultra-deepwater development study." Proceedings of Annual Offshore
Technology Conference, Houston, U.S.A, OTC 12172.

9-3
Colliat, J. L. (2002). "Anchors for Deepwater to Ultradeepwater Moorings."
Proceedings of Annual Offshore Technology Conference, Houston, U.S.A.,
OTC 14306.
Dahlberg, R., Ronold, K. O., Strom, P. J., and Mathisen, J. (2004). "New calibrated
design code for plate anchors in clay." Proceedings of Annual Offshore
Technology Conference, Houston, U.S.A., OTC 16109.
Dahlberg, R., and Strom, P. J. (1999). "Unique onshore tests of deepwater drag-in
plate anchors." Proceedings of Annual Offshore Technology Conference,
Houston, U.S.A, 713-723.
Das, B. M. (1978). "Model tests for uplift capacity of foundations in clay." Soils and
Foundations, 18(2), 17-24.
Das, B. M. (1980). "A procedure for estimation of ultimate capacity of foundations
in clay." Soils and Foundations, 20(1), 77-82.
Das, B. M. (1995). "Creep of shallow plate anchor in soft clay." International
Journal of Offshore and Polar Engineering, 5(3), 230-234.
Das, B. M., Moreno, R., and Dallo, K. F. (1985). "Ultimate pullout capacity of
shallow vertical anchors in clay." Soils and Foundations, 25(2), 148-152.
Das, B. M., and Puri, V. K. (1989). "Holding capacity of inclined square plate
anchors in clay." Soils and Foundations, 29(3), 138-144.
Das, B. M., Shin, E. C., Dass, R. N., and Omar, M. T. (1994). "Suction force below
plate anchors in soft clay." Marine Georesources and Geotechnology, 12(1), 71-
81.
Davie, J. R., and Sutherland, H. B. (1977). "Uplift resistance of cohesive soils."
Journal of the Soil Mechanics and Foundations Division, ASCE, 103(9), 935-
952.
Dendani, H., and Colliat, J. L. (2002). "Girassol: Design analysis and installation of
the suction anchors." Proceedings of Annual Offshore Technology Conference,
Houston, U.S.A., OTC 14240.
Dove, P. (2000). "Experience with installation of deepwater polyester moorings, new
generation anchors." Offshore, 60(2), 68-70.
Dove, P., and Roraas, H. (2000). "Trial results from deepwater anchors, polyester
moorings." Offshore, 60(3), 66-67&100.

9-4
Dove, P., Treu, H., and Wilde, B. (1998). "Suction embedded plate anchor (SEPLA):
a new anchoring solution for ultra-deepwater mooring." Proc. Deep Offshore
Tech. Conf., New Orlean, U.S.A.
Dove, P., Weisinger, D., Abbassian, F., and Hooker, J. (2000). "The development
and testing of polyester moorings for ultradeep drilling operations."
Proceedings of Annual Offshore Technology Conference, Houston, U.S.A, OTC
12172.
Ehlers, C. J., Young, A. G., and Chen, J. H. (2004). "Technology assessment of
deepwater anchors." Proceedings of Annual Offshore Technology Conference,
Houston, U.S.A, OTC 16840.
Elkhatib, S., and Randolph, M. F. (2005). "The effect of interface friction on the
performance of drag-in plate anchors." Proc. Int. Symp. on Frontiers in
Offshore Geotechnics, Perth, Australia, 171-177.
Finnie, I. M. S., and Randolph, M. F. (1994). "Punch-through and liquefaction
induced failure of shallow foundations on calcareous sediments." Proc. Int.
Conf. on Behaviour of Offshore Structures, Boston, U.S.A., 217-230.
Freitag, L. (1997). "On combining Laplacian and optimization-based mesh
smoothing techniques." Trends in Unstructured Mesh Generation: Presented at
the 1997 Joint ASME/ASCE/SES Summer Meeting, Evanston, Illinois, 37-43.
Fulton, T. M., Veselis, T., Dove, P. G. S., Bowles, T., and Petruska, D. J. (2002).
"Introduction of Polyester Taut Leg Mooring Into the Gulf of Mexico."
Proceedings of Annual Offshore Technology Conference, Houston, U.S.A.,
OTC 14244.
Gadala, M. S., Movahhedy, M. R., and Wang, J. (2002). "On the mesh motion for
ALE modeling of metal forming processes." Finite Elements in Analysis and
Design, 38(5), 435-459.
Gadala, M. S., Oravas, G. A. E., and Dokainish, M. A. (1983). "A consistent eulerian
formulation of large deformation problems in statics and dynamics." Int. J. Non-
linear Mechanics, 18(1), 21-35.
Gadala, M. S., and Wang, J. (1998). "ALE formulation and its application in solid
mechanics." Computer Methods in Applied Mechanics and Engineering, 167(1-
2), 33-55.

9-5
Gadala, M. S., and Wang, J. (2000). "Computational implementation of stress
integration in FE analysis of elasto-plastic large deformation problems." Finite
Elements in Analysis and Design, 35(4), 379-396.
Gaudin, C., O'Loughlin, C. D., Randolph, M. F., and Lowmass, A. C. (2006).
"Influence of the installation process on the performance of suction embedded
plate anchors." Géotechnique, 56(6), 381-391.
Gaudin, C., Tham, K. H. and Ouahsine, S. (2008). "Plate Anchor Failure Mechanism
during Keying Process." Proceedings of the 18th International Offshore and
Polar Engineering Conference, 613-620.
Ghosh, S., and Kikuchi, N. (1991). "An arbitrary Lagrangian-Eulerian finite element
method for large deformation analysis of elastic-viscoplastic solids." Computer
Methods in Applied Mechanics and Engineering, 86(2), 127-188.
Gill, D. R. (1999). "Experimental and theoretical investigations of pile and
penetrometer installation in clay," Ph.D. Thesis, Trinity College, Dublin.
Gulf of Mexico Region Minerals Management Service. (2001). "Deepwater
Development Systems in the Gulf of Mexico Basic Options."
Gunn, M. J. (1980). "Limit analysis of undrained stability problems using a very
small computer." Proc. Symp. on Computer Applications in Geotechnical
Problems in Highway Engineering, Cambridge University, Engineering
Department, 5-30.
Haber, R. B. (1984). "A mixed eulerian-lagrangian displacement model for large-
deformation analysis in solid mechanics." Computer Methods in Applied
Mechanics and Engineering, 43(3), 277-292.
Herrmann, L. R. (1978). "Finite element analysis of contact problems." J. Eng.
Mech., ASCE, 104(5), 1043-1059.
Hibbitt, H. D., Marcal, P. V., and Rice, J. R. (1970). "A finite element formulation
for problems of large strain and large displacement." Int. J. Solid Struct(6),
1069-1086.
HKS. (2005). "ABAQUS user's manual." AQAQUS Inc.
Ho-Le, K. (1988). "Finite element mesh generation methods: a review and
classification." Computer-Aided Design, 20(1), 27-38.
Hossain, M. S. (2004). "Investigation of Soil Failure Mechanisms during Spudcan
Foundation Installation," Master Thesis, Curtin University of Technology.

9-6
Hossain, M. S., Hu, Y., Randolph, M. F., and White, D. J. (2005). "Limiting cavity
depth for spudcan foundations penetrating clay." Géotechnique, 55 (9), 679-690.
House, A. (2002). "Suction caisson foundations for buoyant offshore facilities," Ph.D
Thesis, The University of Western Australia.
House, A. R., Randolph, M. F., and Bordas, M. E. (1999). "Limiting aspect ratio for
suction caisson installation in clay." Proceedings of the 9th International
Offshore and Polar Engineering Conference, Brest, France, 676-683.
Hu, Y., and Randolph, M. F. (1995). "Numerical simulation of pipe penetration in
non-homogeneous soil." Proceedings of the 5th 1995 International Offshore
and Polar Engineering Conference. Part 1 (of 4), Jun 11-16 1995, Hague,
Netherlands, 522.
Hu, Y., and Randolph, M. F. (1998a). "Deep penetration of shallow foundations on
non-homogeneous soil." Soils and Foundations, 38(1), 241-246.
Hu, Y., and Randolph, M. F. (1998b). "H-adaptive FE analysis of elasto-plastic non-
homogeneous soil with large deformation." Computers and Geotechnics, 23(1),
61-83.
Hu, Y., and Randolph, M. F. (1998c). "Practical numerical approach for large
deformation problems in soil." International Journal for Numerical and
Analytical Methods in Geomechanics, 22(5), 327-350.
Hu, Y., and Randolph, M. F. (1998d). "A practical numerical approach for large
deformation problems of soil." International Journal for Numerical and
Analytical Methods in Geomechanics, 22(5), 327-350.
Huetink, J., Vreede, P. T., and Lugt, J. V. D. (1990). "Progress in mixed Eulerian–
Lagrangian finite element simulation of forming process." Int. J. Numer.
Methods Eng(30 ), 1441-1457.
Intermoor. (2007). "Intermoor Engineering."
Iskander, M., Lai, J., Oswald, C., and Mannheimer, R. (1994). "Development of a
transparent material to model the Geotechnical properties of soil." ASTM
Geotechnical Testing Journal, 17(4), 425-433.
Iskander, M. G., Liu, J., and Sadek, S. (2002). "Transparent amorphous silica to
model clay." Journal of Geotechnical and Geoenvironmental Engineering,
128(3), 262-273.
9-7
Johnston, B. P., and Sullivan, J. M. (1992). "Fully automatic two dimensional mesh
generation using normal offsetting." International Journal for Numerical
Methods in Engineering, 33(2), 425-442.
Kumar, J. (1999). "Kinematic slices approach for uplift analysis of strip
foundations." Int. J. Num. Methods in Geomechanics, 23(11), 1159-1170.
Kupferman, M. (1971). "The vertical holding capacity of marine anchors in clay
subjected to static and cyclic loading," M.Sc Thesis, University of
Massachusetts, U.S.A., Amherst.
Lieng, J. T., Kavli, A., Hove, H., and Tjelta, T. I. (2000). "Deep Penetrating Anchor:
Further Development, Optimization, and Capacity Verification." Proc. Tenth
International Offshore and Polar Conference, Seattle, Washington, 410-416.
Liu, J., Iskander, M. G., and Sadek, S. (2003). "Consolidation and permeability of
transparent amorphous silica." Geotechnical Testing Journal, 26(4), 390-401.
Liu, W. K., Chang, H., Chen, J.-S., and Belytschko, T. (1988). "Arbitrary lagrangian-
eulerian petrov-galerkin finite elements for nonlinear continua." Computer
Methods in Applied Mechanics and Engineering, 68(3), 259-310.
Lo, S. H. (2002). "Finite element mesh generation and adaptive meshing." Structural
analysis and CAD(4), 381–399.
Loez, B. (2002). "Girassol: The Biggest FPSO in the World: as Seen by Its
Contractor." Proceedings of the Annual Offshore Technology Conference,
Houston, 1899-1918.
Lu, Q. (2004). "A numerical study of cone penetration in clay," Ph.D thesis, The
University of Western Australia.
Lu, Q., Randolph, M. F., Hu, Y., and Bugarski, I. C. (2004). "A numerical study of
cone penetration in clay." Géotechnique, 54(4), 257-267.
Maniar, D. R., Vasques, F. F. G., and Tassoulas, J. L. (2003). "Installation and
pullout of suction caissons : Finite element simulation." Proceedings of the
22nd International Conference on Offshore Mechanics and Artic Engineering,
Cancun, Mexico, Paper Number 37501.
Mannheimer, R., and Oswald, C. (1993). "Development of transparent porous media
with permeability's of soils and reservoir materials." Ground Water, 31(5), 781-
788.
Martin, C. M., and Houlsby, G. T. (2000). "Combined loading of spudcan
foundations on clay: laboratory tests." Géotechnique, 50(4), 325-338.

9-8
Martin, C. M., and Randolph, M. F. (2001). "Applications of the lower and upper
bound theorems of plasticity to collapse of circular foundations." Proceedings
of 10th Internatinal Conference of the International Association for Computer
Methods and Advances in Geomechanics, Tucson, Balkema,U.S.A., 1417-1428.
Martin, C. M., and Randolph, M. F. (2006). "Upper-bound analysis of lateral pile
capacity in cohesive soil." Géotechnique 56(2), 141-145.
McMeeking, R. M., and Rice, J. R. (1975). "Finite element formulations for
problems of large elastic-plastic deformation." Int. J. Solids Struct.(11), 601-616.
Medeiros, C. J. (2002). "Low Cost Anchor System for Flexible Risers in Deep
Waters." Proceedings of Offshore Technology Conference, Houston, U.S.A.,
OTC 1415.
Merifield, R. S., Lyamin, A. V., and Sloan, S. W. (2005). "Stability of inclined strip
anchors in purely cohesive soil." Journal of Geotechnical and
Geoenvironmental Engineering, 131(6), 792-799.
Merifield, R. S., Lyamin, A. V., Sloan, S. W., and Yu, H. S. (2003a). "Three-
dimensional lower bound solutions for stability of plate anchors in clay."
Journal of Geotechnical and Geoenvironmental Engineering, 129(3), 243-253.
Merifield, R. S., Sloan, S. W., and Lyamin, A. V. (2003b). "The stability of inclined
plate anchors in purely cohesive soil." TR-2003-03, University of Southern
Queensland.
Merifield, R. S., Sloan, S. W., and Yu, H. S. (2001). "Stability of plate anchors in
undrained clay." Géotechnique, 51(2), 141-153.
Meyerhof, G. G. (1973). "Uplift resistance of inclined anchors and piles."
Proceedings of 8th International Conference on Soil Mechanics and Foundation
Engineering., Moscow, 167-172.
Meyerhof, G. G., and Adams, J. I. (1968). "The ultimate uplift capacity of
foundations." Canadian Geotechnical Journal, 5(4), 225-244.
Nazem, M., Sheng, D., and Carter, J. P. (2006). "Stress integration and mesh
refinement for large deformation in geomechanics." International Journal for
Numerical Methods in Engineering, 65(7), 1002-1027.
Neubecker, S. R., and O'Neill, M. P. (2004). "Study of chain slippage of embedded
anchors." Proceedings of Annual Offshore Technology Conference, Houston,
U.S.A.
9-9
Neubecker, S. R., and Randolph, M. F. (1995). "Profile and frictional capacity of
embedded anchor chains." Journal of Geotechnical Engineering, 121(11), 797-
803.
O'Loughlin, C. D., Lowmass, A., Gaudin, C., and Randolph, M. F. (2006). "Physical
modelling to assess keying characteristics of plate anchors." International
Conference on Physical Modelling in Geotechnics 2006, Hong Kong.
O'Loughlin, C. D., Randolph, M. F., and Richardson, M. (2004). "Experimental and
Theoretical Studies of Deep Penetrating Anchors." Proceedings of Annual
Offshore Technology Conference, Houston, U.S.A., OTC 16841.
O'Neill, M. P., Bransby, M. F., and Randolph, M. F. (2003). "Drag anchor fluke-soil
interaction in clays." Canadian Geotechnical Journal, 40(1), 78-94.
Owen, S., and ANSYS. (1998). "A survey of unstructured mesh generation
technology." Proceedings of the 7th International Meshing Roundtable
Paganie, D. (2006). "independent takes unconventional approach to hub-and-spoke
solution." Offshore, 66(5), 92-96.
Parthasarathy, V. N., and Kodiyalam, S. (1991). "A constrained optimization
approach to finite element mesh smoothing." Finite Elements in Analysis and
Design, 9(4), 309-320.
Potts, D. M., and Zdravković, L. (2001). Finite Element Analysis in Geotechnical
Engineering Application, Thomas Telford.
Randolph, M. F., Cassidy, M. J., Gourvenec, S., and Erbrich, C. (2005). "Challenges
of Offshore Geotechnical Engineering." Proc. 16th Int. Conf. on Soil Mech. and
Geotech. Engrg, Osaka, Japan, 1:123-176.
Randolph, M. F., and Houlsby, G. T. (1984). "The limiting pressure on a circular pile
loaded laterally in cohesive soil." Géotechnique, 34(4), 613-623.
Randolph, M. F., Jewell, R. J., Stone, K. J. L., and Brown, T. A. (1991).
"Establishing a new centrifuge facility." Proc. int. Conf. on Centrifuge
Modelling - Centrifuge 91, Boulder, Colorado, 3-9.
Randolph, M. F., Steenfelt, J. S., and Wroth, C. P. (1979). "The effect of pile type on
design parameters for driven piles." Proceedings 7th European Conference on
Soil Mechanics and Foundation Engineering, Brighton, 107-114.
Ranjan, G., and Arora, V. B. (1980). "Model studies on anchors under horizontal pull
in clay." Proc. 3rd Aust, N.Z Conf. Geomech, Wellington, N.Z., 65-70.
9-10
Rocker, K. (1985). Handbook for Marine Geotechnical Engineering, US Naval Civil
Engineering Laboratory, Port Hueneme, California, U.S.A.
Roesset, J. M., and Yao, J. T. P. (2002). "State of the art of structural engineering."
Journal of Structural Engineering, 128(8), 965-975.
Rowe, R. K. (1978). "Soil structure interaction analysis and its application to the
prediction of anchor behaviour," Ph.D thesis, University of Sydney.
Rowe, R. K., and Davis, E. H. (1982). "Behaviour of anchor plates in clay."
Géotechnique, 32(1), 9-23.
Sadek, S., Iskander, M. G., and Liu, J. (2002). "Geotechnical properties of
transparent silica." Canadian Geotechnical Journal, 39(1), 111-124.
Sadek, S., Iskander, M. G., and Liu, J. (2003). "Accuracy of digital image correlation
for measuring deformations in transparent media." Journal of Computing in
Civil Engineering, 17(2), 88-96.
Schofield, A. N. (1980). "Cambridge geotechnical centrifuge operations."
Géotechnique, 30(3), 227-268.
Shimamura, Y. (2002). "FPSO/FSO: State of the art." Journal of Marine Science and
Technology, 7(2), 59-70.
Shipping, A. B. o. (2001). "Buried treasure." Surveyor, 10-11.
Sloan, S. W. (1993). "A fast algorithm for generating constrained delaunay
triangulations." Computers & Structures, 47(3), 441-450.
Spence, B. E. (1965). "Uplift resistance of piles with enlarged bases in clay," MSc
thesis, Nova Scotia Technical College.
Stewart, D. P. (1992a). "Lateral loading of pile bridge abutments due to embankment
construction," Ph.D thesis, University of Western Australia.
Stewart, D. P., Boyle, R. S., and Randolph, M. F. (1998). "Experience with a new
drum centrifuge." Proc. Int. Conf. Centrifuge '98, Tokyo, Japan, 35-40.
Stewart, D. P., and Randolph, M. F. (1991). "A new site investigation tool for the
centrifuge." Proceedings Conference Centrifuge '91, Balkema, Rotterdam, 531-
538.
Stewart, D. P., and Randolph, M. F. (1994). "T-bar penetration testing in soft clay." J
Geotech. Engr. Div., ASCE, 120(12), 2230-2235.
Stewart, W. P. (1992b). "Drag Embedment Anchor Performance Prediction in Soft
Soils." Proceedings of Annual Offshore Technology Conference, Houston,
U.S.A., Paper No. OTC 6970.
9-11
Susila, E., and Hryciw, R. D. (2003). "Large displacement FEM modelling of the
cone penetration test (CPT) in normally consolidated sand." International
Journal for Numerical and Analytical Methods in Geomechanics, 27(7), 585-
602.
Taylor, R. N. (1995). Geotechnical centrifuge technology, Blackie Academic,
London.
Thorne, C. P. (1998). "Penetration and load capacity of marine drag anchors in soft
clay." Journal of Geotechnical and Geoenvironmental Engineering, 124(10),
945-953.
Thorne, C. P., Wang, C. X., and Carter, J. P. (2004). "Uplift capacity of rapidly
loaded strip anchors in uniform strength clay." Géotechnique, 54(8), 507-517.
Turner, D. J. (2001). "Study of pullout capacity of flat plate anchors in offshore
engineering," Final Year Undergraduate Report, Curtin University of
Technology.
Van Den Berg, P., Borst, R. D., and Huétink, H. (1996). "An Eulerean finite element
model for penetration in layered soil." International Journal for Numerical and
Analytical Methods in Geomechanics, 20(12), 865-886.
Vesic, A. S. (1971). "Breakout resistance of objects embedded in ocean bottom."
Journal of the Soil Mechanics and Foundations Division, ASCE, 97(9), 1183-
1205.
Walker, J., and Yu, H. S. (2006). "Adaptive finite element analysis of cone
penetration in clay." Acta Geotechnica, 1(1), 43-57.
Wang, D., Hu, Y., and Song, Z. (2007). "Large deformation analysis of rectangular
plate anchors in normally consolidated clay." Proceedings of 10th Australia
New Zealand Conference on Geomechanics, Brisbane, Australia, 268-273.
Wang, J., and Gadala, M. S. (1997). "Formulation and survey of ALE method in
nonlinear solid mechanics." Finite Elements in Analysis and Design, 24(4), 253-
269.
Watson, P. G. (1999). "Performance of skirted foundations for offshore structures,"
Ph.D Thesis, The University of Western Australia.
Watson, P. G., Newson, T. A., and Randolph, M. F. (1998). "Strength profiling in
soft offshore soils." Proceedings 1st International Conference on Site
Characterisation -ISC '98, Atlanta, 1389-1394.

9-12
Welker, A. L., Bowders, J. J., and Gilbert, R. B. (1999). "Applied research using a
transparent material with hydraulic properties similar to soil." Geotechnical
Testing Journal, 22(3), 266-270.
White, D. J., Randolph, M. F., and Thompson, B. (2005). "An image based
deformation measurement system for the geotechnical centrifuge." Int. J.
Physical Modelling in Geotechnics, 5(3), 1-12.
White, D. J., Take, W. A., and Bolton, M. D. (2003). "Soil deformation measurement
using particle image velocimetry (PIV) and photogrammetry." Géotechnique,
53(7), 619-631.
Wilde, B., Treu, H., and Fulton, T. (2001). "Field testing of suction embedded plate
anchors." 11th (2001) International Offshore and Polar Engineering
Conference, Jun 17-22 2001, Stavanger, 544-551.
Yu, H.-S. (2000). Cavity expansion methods in geomechanics, Kluwer Academic
Publishers.
Zhou, H., and Randolph, M. F. (2006). "Large deformation analysis of suction
caisson installation in clay." Canadian Geotechnical Journal, 43(12), 1344.
Zienkiewicz, O. C., and Zhu, J. Z. (1992). "Superconvergent patch recovery and a
posteriori error estimates. Part 2: error estimates and adaptivity." International
Journal for Numerical Methods in Engineering, 33(7), 1365-1382.