
PUGET SOUND NAVAL SHIPYARD INTERMEDIATE MAINTENANCE ... · PUGET SOUND NAVAL SHIPYARD INTERMEDIATE...
29
Naval Surface Warfare Center Carderock Division West Bethesda, MD 20817-5700 NSWCCD-73-TR--2016/553 May 2016 Signatures Department Technical Report PUGET SOUND NAVAL SHIPYARD INTERMEDIATE MAINTENANCE FACILITY PIER 6 FENDER PILE REPLACEMENT PROJECT ACOUSTIC MONITORING RESULTS Prepared by: Naval Surface Warfare Center, Carderock Division Signature Measurement and Systems Division Distribution Statement D: Distribution authorized to the Department of Defense and other Government Agencies; May 2016. Other requests for this document shall be referred to the Naval Surface Warfare Center, Carderock Division, Code 73. DESTRUCTION NOTICE: For unclassified, limited distribution documents, destroy by any method that would prevent disclosure of contents or reconstruction of the document. NSWCCD-73-TR--2016/553 May 2016 PUGET SOUND NAVAL SHIPYARD INTERMEDIATE MAINTENANCE FACILITY PIER 6 FENDER PILE REPLACEMENT PROJECT ACOUSTIC MONITORING RESULTS
Transcript of PUGET SOUND NAVAL SHIPYARD INTERMEDIATE MAINTENANCE ... · PUGET SOUND NAVAL SHIPYARD INTERMEDIATE...
Naval Surface Warfare Center Carderock Division West Bethesda, MD 20817-5700
NSWCCD-73-TR--2016/553 May 2016 Signatures Department Technical Report PUGET SOUND NAVAL SHIPYARD INTERMEDIATE MAINTENANCE FACILITY PIER 6 FENDER PILE REPLACEMENT PROJECT ACOUSTIC MONITORING RESULTS
Prepared by: Naval Surface Warfare Center, Carderock Division Signature Measurement and Systems Division
Distribution Statement D: Distribution authorized to the Department of Defense and other Government Agencies; May 2016. Other requests for this document shall be referred to the Naval Surface Warfare Center, Carderock Division, Code 73. DESTRUCTION NOTICE: For unclassified, limited distribution documents, destroy by any method that would prevent disclosure of contents or reconstruction of the document.
NSW
CC
D-7
3-T
R--
2016
/553
May
201
6 P
UG
ET
SO
UN
D N
AV
AL
SH
IPY
AR
D IN
TE
RM
ED
IAT
E M
AIN
TE
NA
NC
E
FAC
ILIT
Y P
IER
6 F
EN
DE
R P
ILE
RE
PLA
CE
ME
NT
PR
OJE
CT
AC
OU
STIC
MO
NIT
OR
ING
RE
SUL
TS
Pier 6 Fender Pile Replacement Project Page 1
Table of Contents
List of Tables ................................................................................................................................. ii List of Figures ............................................................................................................................... ii
INTRODUCTION .........................................................................................................................3 Project Area .........................................................................................................................3
PILE EXTRACTION AND INSTALLATION ...........................................................................4 Vibratory Pile Extraction .....................................................................................................4 Impact Pile Driving .............................................................................................................5
ACOUSTIC MONITORING .......................................................................................................7 Methodology ........................................................................................................................8 Signal Processing Overview ...............................................................................................9
ACOUSTIC RESULTS ..............................................................................................................10 Ambient Noise Conditions..................................................................................................10 Pile Extraction In-Water Noise .........................................................................................13 Pile Extraction Airborne Noise .........................................................................................17 Pile Driving In-Water Noise .............................................................................................20 Pile Driving Airborne Noise ..............................................................................................23
CONCLUSIONS .........................................................................................................................26
REFERENCES ............................................................................................................................28
Pier 6 Fender Pile Replacement Project Page 2
List of Tables Table 1: Equipment used for Sound Monitoring and Analysis Pile Driving Airborne Noise .........7 Table 2: Pile Extraction In-Water RMS Results Using Selectable High-Pass Filter ....................13 Table 3: Pile Extraction In-Water Maximum RMS Using Selectable High-Pass Filter ................14 Table 4: Pile Extraction Peak RMS Airborne Noise Levels .........................................................18 Table 5: Impact Pile-Driving In-Water Summary ........................................................................21 Table 6: Impact Pile-Driving Peak Airborne Results ....................................................................23
List of Figures Figure 1: Vicinity map of Pier 6 fender pile replacement project, Puget Sound Naval Shipyard and Bremerton, Washington ............................................................................................................3 Figure 2: Location of Pier 6 at PSNS/IMF pile driving activity ....................................................4 Figure 3: Location of the piles and measurement equipment setup for the Pier 6 fender pile replacement project ........................................................................................................................6 Figure 4: In-water one-third octave response for ambient tests ..................................................11 Figure 5: In-water minimum ambient condition time domain level (top) and peak narrowband response (bottom) ..........................................................................................................................11 Figure 6: Airborne one-third octave response for representative “quiet” ambient condition ....12 Figure 7: Pile 8 in-water extraction detail ...................................................................................14 Figure 8: In-Water One-third octave spectra for all excavated piles ..........................................15 Figure 9: Comparison of morning ambient OTO levels (blue) with afternoon levels (pink) .......16 Figure 10: In-water average extraction sound pressure levels compared to “quiet” ambient ....17 Figure 11: Extraction one-third octave airborne levels for all piles ............................................19 Figure 12: Extraction average airborne levels (blue) compared to quiet ambient level (orange)........................................................................................................................................................20 Figure 13: Pile 89 Impact Detail; Time Series (top), Peak, RMS, and SEL Levels (bottom) ......21 Figure 14: In-water one-third octave results for all pile impact event ........................................22 Figure 15: Unweighted Airborne Sound Level one-third octave levels for individual pile insertions .......................................................................................................................................24 Figure 16: Unweighted Airborne Sound Level one-third octave average for all pile insertions (pink curve, top) and lowest recorded ambient (purple curve, bottom) .......................................25
Pier 6 Fender Pile Replacement Project Page 3
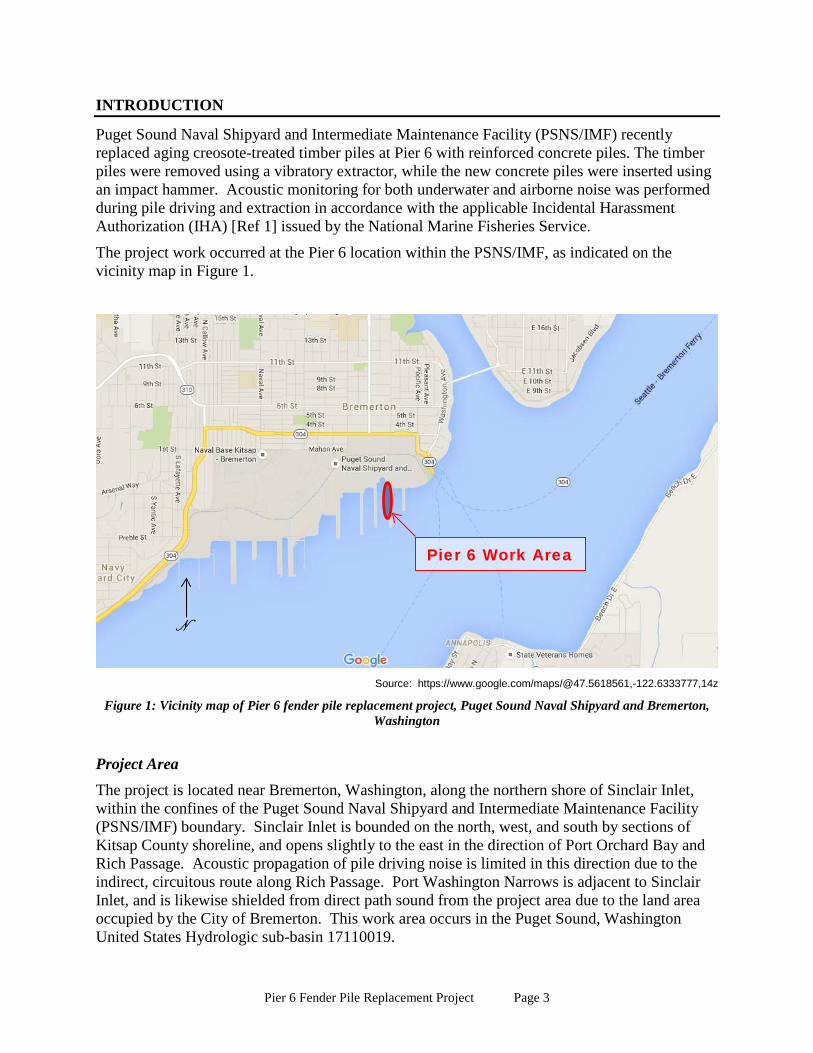
INTRODUCTION
Puget Sound Naval Shipyard and Intermediate Maintenance Facility (PSNS/IMF) recently replaced aging creosote-treated timber piles at Pier 6 with reinforced concrete piles. The timber piles were removed using a vibratory extractor, while the new concrete piles were inserted using an impact hammer. Acoustic monitoring for both underwater and airborne noise was performed during pile driving and extraction in accordance with the applicable Incidental Harassment Authorization (IHA) [Ref 1] issued by the National Marine Fisheries Service.
The project work occurred at the Pier 6 location within the PSNS/IMF, as indicated on the vicinity map in Figure 1.
Source: https://www.google.com/maps/@47.5618561,-122.6333777,14z
Figure 1: Vicinity map of Pier 6 fender pile replacement project, Puget Sound Naval Shipyard and Bremerton, Washington
Project Area The project is located near Bremerton, Washington, along the northern shore of Sinclair Inlet, within the confines of the Puget Sound Naval Shipyard and Intermediate Maintenance Facility (PSNS/IMF) boundary. Sinclair Inlet is bounded on the north, west, and south by sections of Kitsap County shoreline, and opens slightly to the east in the direction of Port Orchard Bay and Rich Passage. Acoustic propagation of pile driving noise is limited in this direction due to the indirect, circuitous route along Rich Passage. Port Washington Narrows is adjacent to Sinclair Inlet, and is likewise shielded from direct path sound from the project area due to the land area occupied by the City of Bremerton. This work area occurs in the Puget Sound, Washington United States Hydrologic sub-basin 17110019.
Pier 6 Work Area
N
Pier 6 Fender Pile Replacement Project Page 4
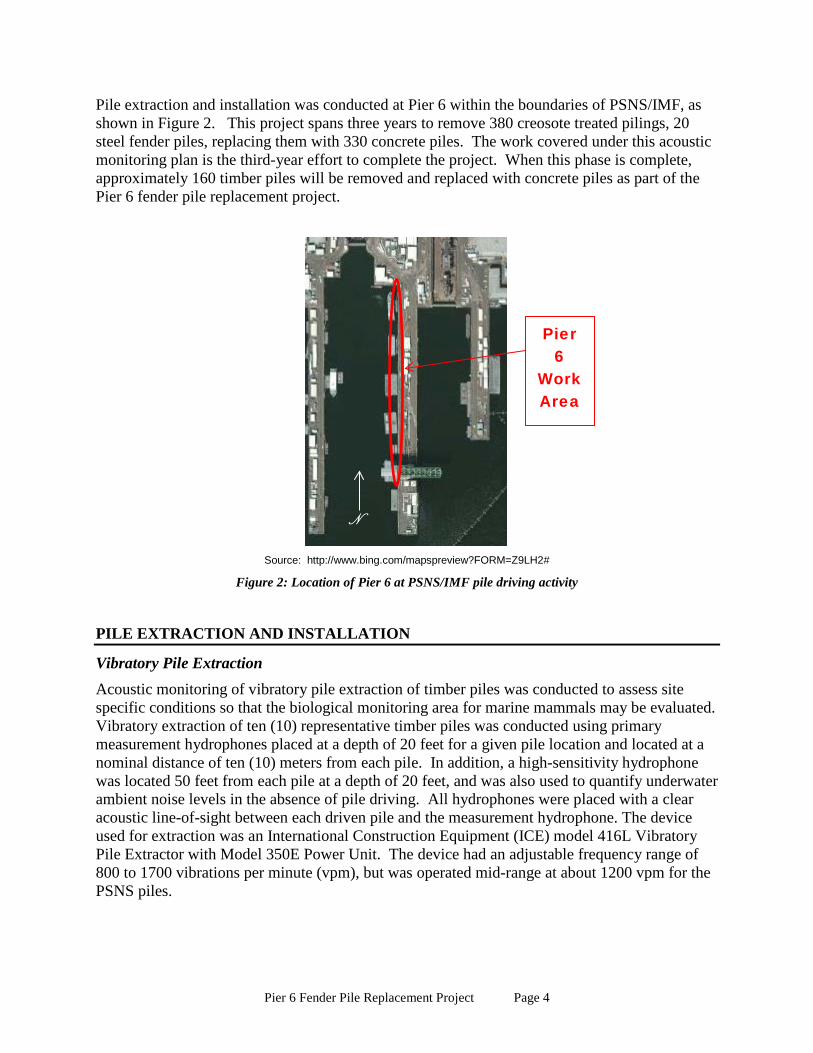
Pile extraction and installation was conducted at Pier 6 within the boundaries of PSNS/IMF, as shown in Figure 2. This project spans three years to remove 380 creosote treated pilings, 20 steel fender piles, replacing them with 330 concrete piles. The work covered under this acoustic monitoring plan is the third-year effort to complete the project. When this phase is complete, approximately 160 timber piles will be removed and replaced with concrete piles as part of the Pier 6 fender pile replacement project.
Source: http://www.bing.com/mapspreview?FORM=Z9LH2#
Figure 2: Location of Pier 6 at PSNS/IMF pile driving activity
PILE EXTRACTION AND INSTALLATION
Vibratory Pile Extraction Acoustic monitoring of vibratory pile extraction of timber piles was conducted to assess site specific conditions so that the biological monitoring area for marine mammals may be evaluated. Vibratory extraction of ten (10) representative timber piles was conducted using primary measurement hydrophones placed at a depth of 20 feet for a given pile location and located at a nominal distance of ten (10) meters from each pile. In addition, a high-sensitivity hydrophone was located 50 feet from each pile at a depth of 20 feet, and was also used to quantify underwater ambient noise levels in the absence of pile driving. All hydrophones were placed with a clear acoustic line-of-sight between each driven pile and the measurement hydrophone. The device used for extraction was an International Construction Equipment (ICE) model 416L Vibratory Pile Extractor with Model 350E Power Unit. The device had an adjustable frequency range of 800 to 1700 vibrations per minute (vpm), but was operated mid-range at about 1200 vpm for the PSNS piles.
Pier 6
Work Area
N
Pier 6 Fender Pile Replacement Project Page 5
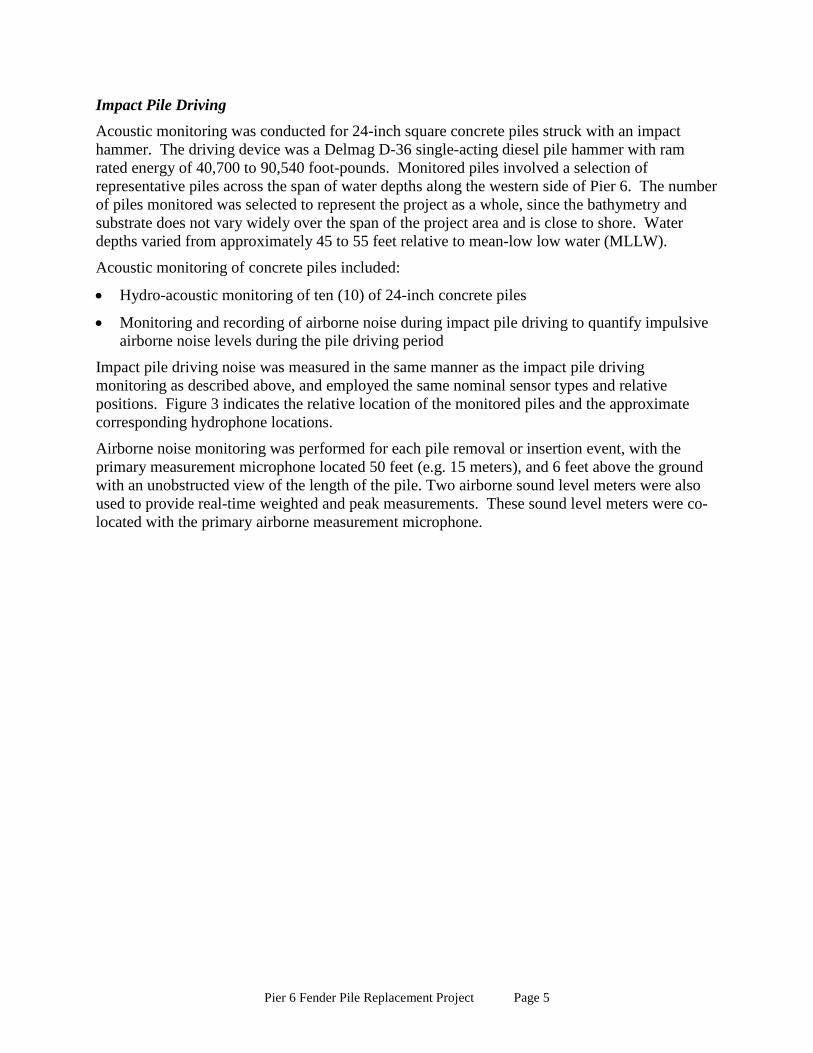
Impact Pile Driving Acoustic monitoring was conducted for 24-inch square concrete piles struck with an impact hammer. The driving device was a Delmag D-36 single-acting diesel pile hammer with ram rated energy of 40,700 to 90,540 foot-pounds. Monitored piles involved a selection of representative piles across the span of water depths along the western side of Pier 6. The number of piles monitored was selected to represent the project as a whole, since the bathymetry and substrate does not vary widely over the span of the project area and is close to shore. Water depths varied from approximately 45 to 55 feet relative to mean-low low water (MLLW). Acoustic monitoring of concrete piles included:
• Hydro-acoustic monitoring of ten (10) of 24-inch concrete piles
• Monitoring and recording of airborne noise during impact pile driving to quantify impulsive airborne noise levels during the pile driving period
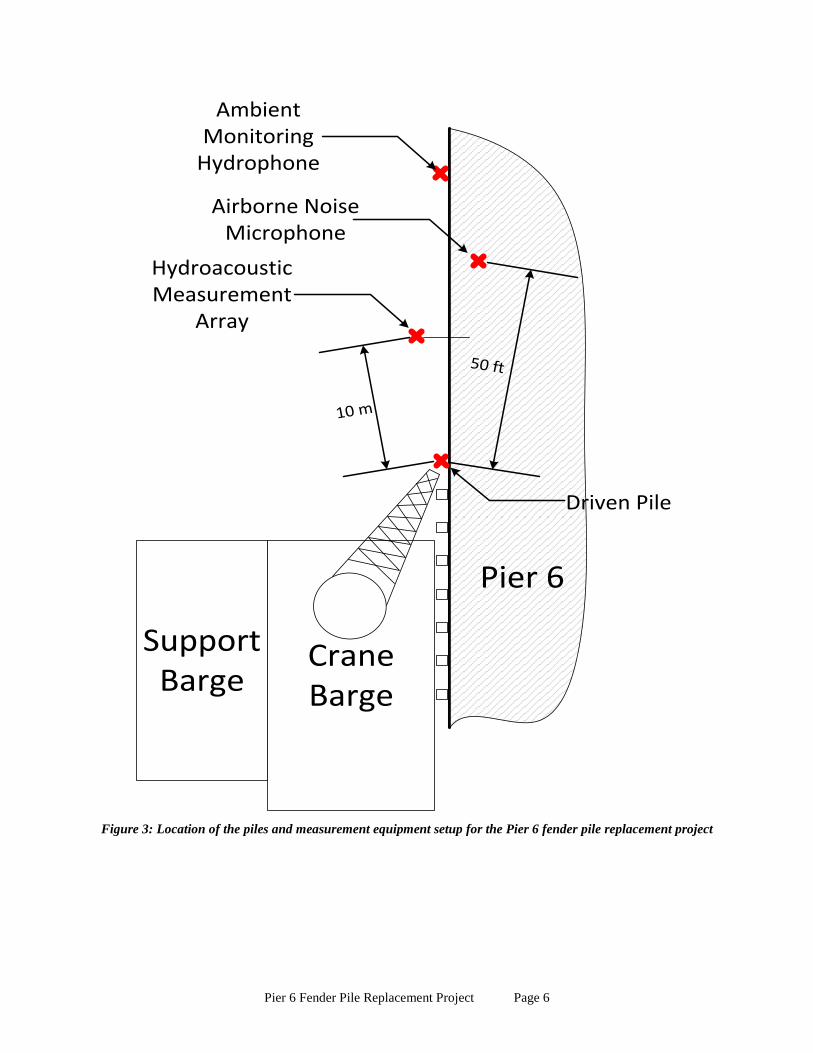
Impact pile driving noise was measured in the same manner as the impact pile driving monitoring as described above, and employed the same nominal sensor types and relative positions. Figure 3 indicates the relative location of the monitored piles and the approximate corresponding hydrophone locations.
Airborne noise monitoring was performed for each pile removal or insertion event, with the primary measurement microphone located 50 feet (e.g. 15 meters), and 6 feet above the ground with an unobstructed view of the length of the pile. Two airborne sound level meters were also used to provide real-time weighted and peak measurements. These sound level meters were co-located with the primary airborne measurement microphone.
Pier 6 Fender Pile Replacement Project Page 6
Crane Barge
Support Barge
10 m
50 ft
Hydroacoustic Measurement
Array
Airborne Noise Microphone
Driven Pile
Pier 6
Ambient Monitoring
Hydrophone
Figure 3: Location of the piles and measurement equipment setup for the Pier 6 fender pile replacement project
Pier 6 Fender Pile Replacement Project Page 7
ACOUSTIC MONITORING
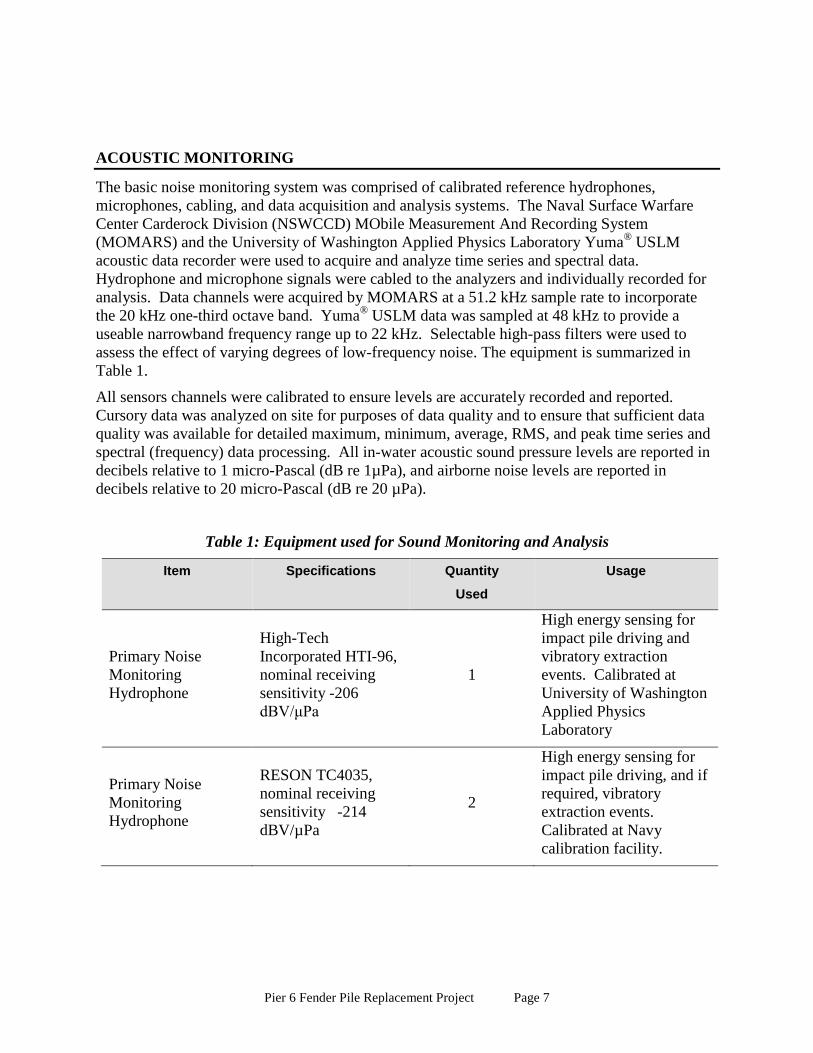
The basic noise monitoring system was comprised of calibrated reference hydrophones, microphones, cabling, and data acquisition and analysis systems. The Naval Surface Warfare Center Carderock Division (NSWCCD) MObile Measurement And Recording System (MOMARS) and the University of Washington Applied Physics Laboratory Yuma® USLM acoustic data recorder were used to acquire and analyze time series and spectral data. Hydrophone and microphone signals were cabled to the analyzers and individually recorded for analysis. Data channels were acquired by MOMARS at a 51.2 kHz sample rate to incorporate the 20 kHz one-third octave band. Yuma® USLM data was sampled at 48 kHz to provide a useable narrowband frequency range up to 22 kHz. Selectable high-pass filters were used to assess the effect of varying degrees of low-frequency noise. The equipment is summarized in Table 1.
All sensors channels were calibrated to ensure levels are accurately recorded and reported. Cursory data was analyzed on site for purposes of data quality and to ensure that sufficient data quality was available for detailed maximum, minimum, average, RMS, and peak time series and spectral (frequency) data processing. All in-water acoustic sound pressure levels are reported in decibels relative to 1 micro-Pascal (dB re 1µPa), and airborne noise levels are reported in decibels relative to 20 micro-Pascal (dB re 20 µPa).
Table 1: Equipment used for Sound Monitoring and Analysis
Item
Specifications
Quantity
Used
Usage
Primary Noise Monitoring Hydrophone
High-Tech Incorporated HTI-96, nominal receiving sensitivity -206 dBV/μPa
1
High energy sensing for impact pile driving and vibratory extraction events. Calibrated at University of Washington Applied Physics Laboratory
Primary Noise Monitoring Hydrophone
RESON TC4035, nominal receiving sensitivity -214 dBV/µPa
2
High energy sensing for impact pile driving, and if required, vibratory extraction events. Calibrated at Navy calibration facility.
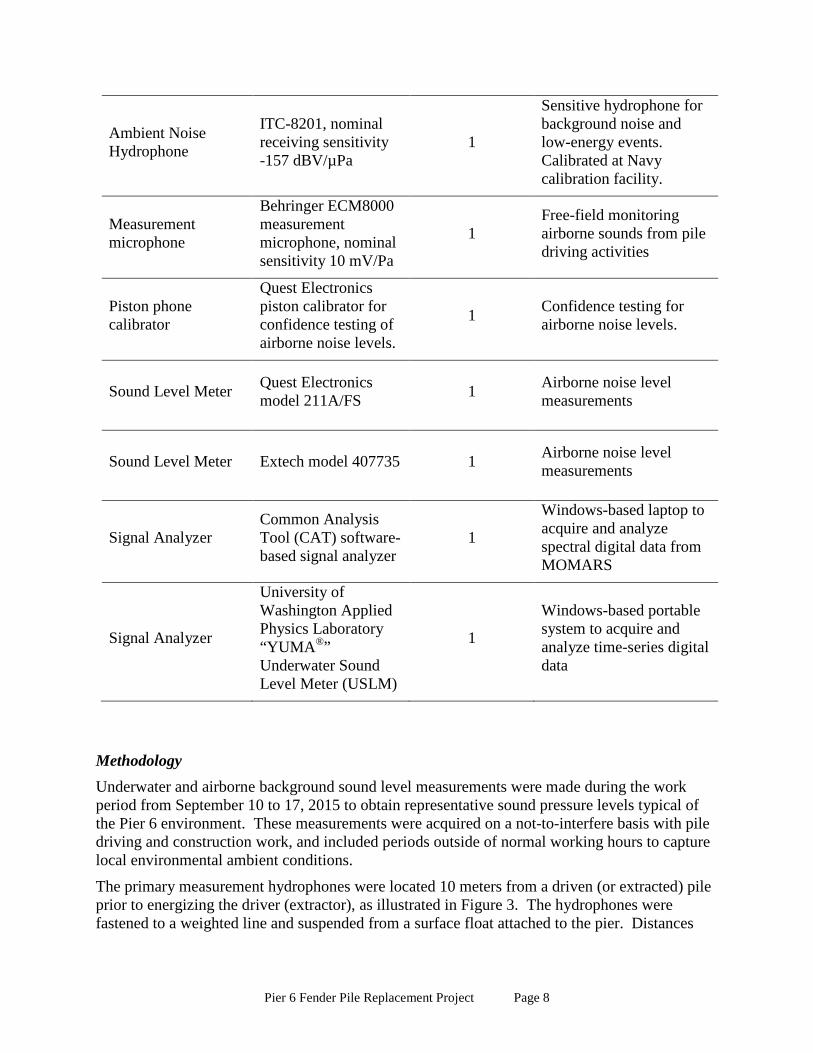
Pier 6 Fender Pile Replacement Project Page 8
Ambient Noise Hydrophone
ITC-8201, nominal receiving sensitivity -157 dBV/µPa
1
Sensitive hydrophone for background noise and low-energy events. Calibrated at Navy calibration facility.
Measurement microphone
Behringer ECM8000 measurement microphone, nominal sensitivity 10 mV/Pa
1 Free-field monitoring airborne sounds from pile driving activities
Piston phone calibrator
Quest Electronics piston calibrator for confidence testing of airborne noise levels.
1 Confidence testing for airborne noise levels.
Sound Level Meter Quest Electronics model 211A/FS 1 Airborne noise level
measurements
Sound Level Meter Extech model 407735 1 Airborne noise level measurements
Signal Analyzer Common Analysis Tool (CAT) software-based signal analyzer
1
Windows-based laptop to acquire and analyze spectral digital data from MOMARS
Signal Analyzer
University of Washington Applied Physics Laboratory “YUMA®” Underwater Sound Level Meter (USLM)
1
Windows-based portable system to acquire and analyze time-series digital data
Methodology Underwater and airborne background sound level measurements were made during the work period from September 10 to 17, 2015 to obtain representative sound pressure levels typical of the Pier 6 environment. These measurements were acquired on a not-to-interfere basis with pile driving and construction work, and included periods outside of normal working hours to capture local environmental ambient conditions.
The primary measurement hydrophones were located 10 meters from a driven (or extracted) pile prior to energizing the driver (extractor), as illustrated in Figure 3. The hydrophones were fastened to a weighted line and suspended from a surface float attached to the pier. Distances
Pier 6 Fender Pile Replacement Project Page 9
were measured using a tape measure. A clear acoustic path (line-of-sight) between the pile and the hydrophone(s) was established for each measurement.
Hydrophone calibrations were checked at the beginning of each day using an electrical-inject methodology. A signal consisting of one-third octave center frequency reference levels was injected into the hydrophones, which was then transmitted along the cable, signal conditioner and data recorder. Tests acquired with the recording equipment ensured that correct calibration levels were being recorded. Microphone calibration was verified each day using a Quest piston phone calibrator, which outputs a known sound pressure level of 110 dB referenced to 20 micro-Pascals.
Pile driving activity was coordinated between an NSWCCD acoustics engineer and the pile- driving contractor. Once sensors were placed and the recording started, pile driving (or extraction) was initiated. Underwater sound levels were continuously monitored during the entire duration of each pile being driven. Broadband time-series and one-third octave spectra were processed on-site to verify data quality and ensure noise levels were within the expected range of values (maximum peak and root-mean-square (RMS) values). Short and long-term RMS average values were observed for impact driving and vibratory extraction events, respectively. For vibratory extraction events, maximum RMS noise levels were obtained for 10-second averages for each pile in four selectable filter ranges corresponding to specific marine mammal hearing ranges, and peak maximum (RMS 90% energy levels) were obtained for impact pile driving events.
Airborne noise data was processed over the range of 20 Hz to 20 kHz for pile extraction and insertion. A- and C-weighted RMS levels were continuously observed, and unweighted one-third octave levels were also observed during the data acquisition period.
Signal Processing Overview Due to the time-varying nature of the signals resulting from pile extraction and installation, several methods were used to report noise measurements, including Root-Mean-Square (RMS) levels, Sound Exposure Levels (SEL), and one-third octave and narrowband spectral data:
• RMS level is the mean-square pressure level of the pile driving noise, which are obtained by calculating the mean of the sum of squared values for the duration of the pile driving event, and subsequently taking the square root. Long-term RMS averages over seconds/minutes are appropriate for relative steady-state noise, such as vibrational pile driving or extraction events, whereas short term RMS measurements are taken of the highest 90% energy of an impact pile driving event, corresponding to the range of 5% to 95% during which the pulse occurs. For vibrational pile driving, the USLM data acquisition unit acquired 5 second back-to-back RMS averages, which were then averaged over the duration of each pile-driving event to establish the per-pile average RMS noise level. For impact events, individual per-strike RMS measurements were taken, and then averaged over a pile to determine average overall impact RMS level. Maximum, or worst-case, RMS levels for each pile were also reported.
• Sound Exposure Level (SEL) is a measure that is indicative of the biological effect of acoustic energy. It is the decibel level of the time integral of the squared-instantaneous sound pressure, normalized to a one second period. Cumulative SEL (unit: dB re 1 μPa2-
Pier 6 Fender Pile Replacement Project Page 10
sec) can estimated by adding 10 times the logarithm of the number of impacts during an event to the average SEL single-strike level. For this monitoring project, per-strike SEL values were measured individually, and the overall SEL value was established by averaging all individual SEL measured values over a given pile.
• One-third octave (OTO) and narrowband spectra are used to represent frequency domain measurements. Integration of broadband sound pressure results in a mean pressure-squared value of the sound power, or “pressure spectral density” per unit Hertz. One-third octave frequency bins feature a proportional bandwidth that is approximately 23% of the bin center frequency. As an example, for the 100 Hz one-third octave bin, the bandwidth is 23 Hz and extends from about 89 Hz to 112 Hz.
The Pascal (a unit of pressure equal to one newton applied over an area of one square meter) is used as the acoustic energy reference unit. Stated measurements are relative to one micro-Pascal (μPa) for in-water measurements, or twenty micro-Pascals for airborne measurements.
Airborne noise was analyzed with real-time sound level meters using both A-weighted and C-weighted filtering. RMS measurements were analyzed for “fast” response (125 msec) and “slow” (1 sec) meter integration time segments. Airborne one-third octave spectral data were also acquired during impact pile driving, and compared to the background noise spectra. Unless otherwise indicated, airborne noise levels in this report represent average Leq sound levels. One-third octave airborne data collected for pile installations or extractions used unweighted filters.
ACOUSTIC RESULTS
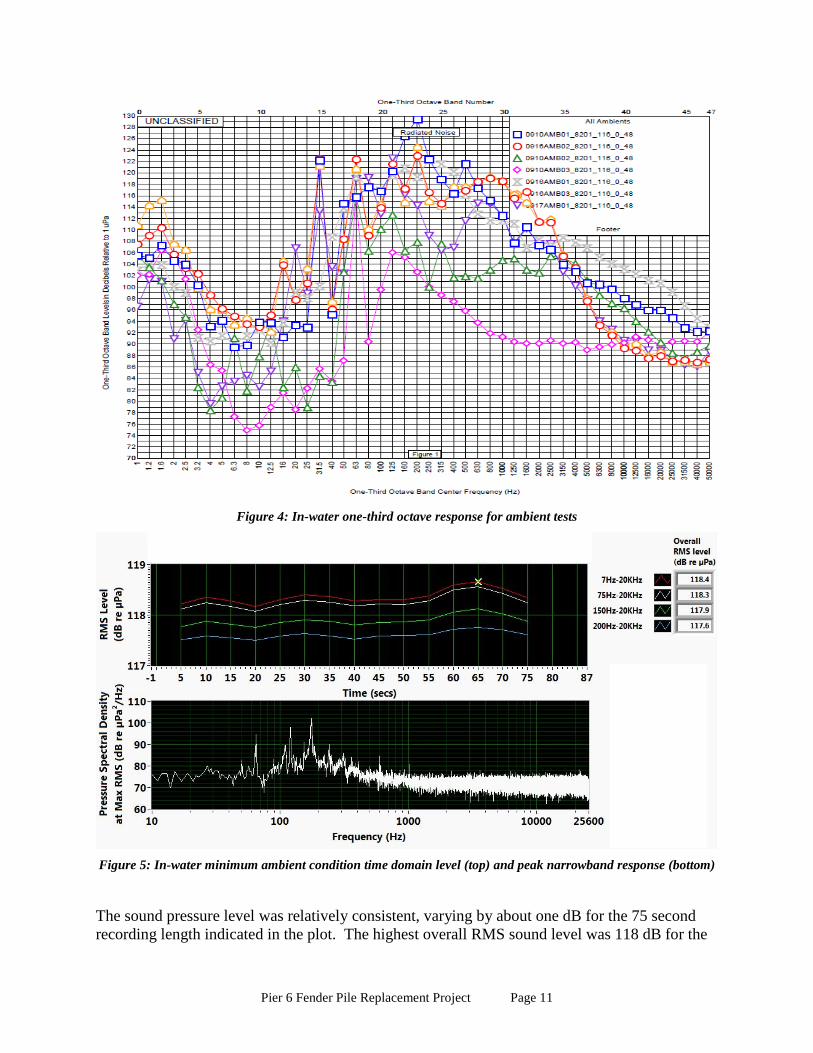
Ambient Noise Conditions Ambient noise recordings were acquired early morning prior to equipment start-up, occasionally between extraction/insertion evolutions, and in the evening after the securing the equipment. The levels varied greatly during the three days of pile extraction and insertion, as is indicated by representative ambient in-water one-third octave response levels in Figure 4. Factors affecting the ambient levels included small boat operations, ferries, and shipyard pier activities such as grinding welding, and vehicle and crane movements.
The minimum amplitude acoustic ambient response (pink curve) was obtained on a day after the contractors and day-shift shipyard workers had exited the work site, and prior to commencement of pier activities by shipyard swing-shift employees. This contrasts with the maximum ambient level (blue curve) which occurred earlier on the same day. The minimum ambient condition was notable not only due to lack of shipyard work activity, but also because of the absence of visible boat traffic in the shipyard environment or across Sinclair Inlet at the Port Orchard marina, or the presence of ferries at nearby terminals in Bremerton. The minimum condition is used in the report as a representative quiet condition. Insufficient data were acquired during off-shift periods to statistically determine 50% cumulative probability function (CDF) noise levels at Pier 6. Measured underwater daytime levels varied from 118 (minimum or “quiet” ambient) to 132 dB (7 to 20 kHz), with a mean value of 128 dB re 1 µPa.
Pier 6 Fender Pile Replacement Project Page 11
Figure 4: In-water one-third octave response for ambient tests
Figure 5: In-water minimum ambient condition time domain level (top) and peak narrowband response (bottom)
The sound pressure level was relatively consistent, varying by about one dB for the 75 second recording length indicated in the plot. The highest overall RMS sound level was 118 dB for the
Pier 6 Fender Pile Replacement Project Page 12
7 Hz to 20 kHz bandwidth. Consequently, the average RMS level of approximately 118 dB would appear to exemplify a relatively quiet acoustic environment for the area of interest. The 60 Hz tone and electrical harmonics on the spectral plot were considered to be a result of several electrical transformer stations located on the pier. The minimum ambient condition was exceptional, as the other ambient recordings included transient noise phenomena such as engine start-ups, crane movements, and work boat noise.
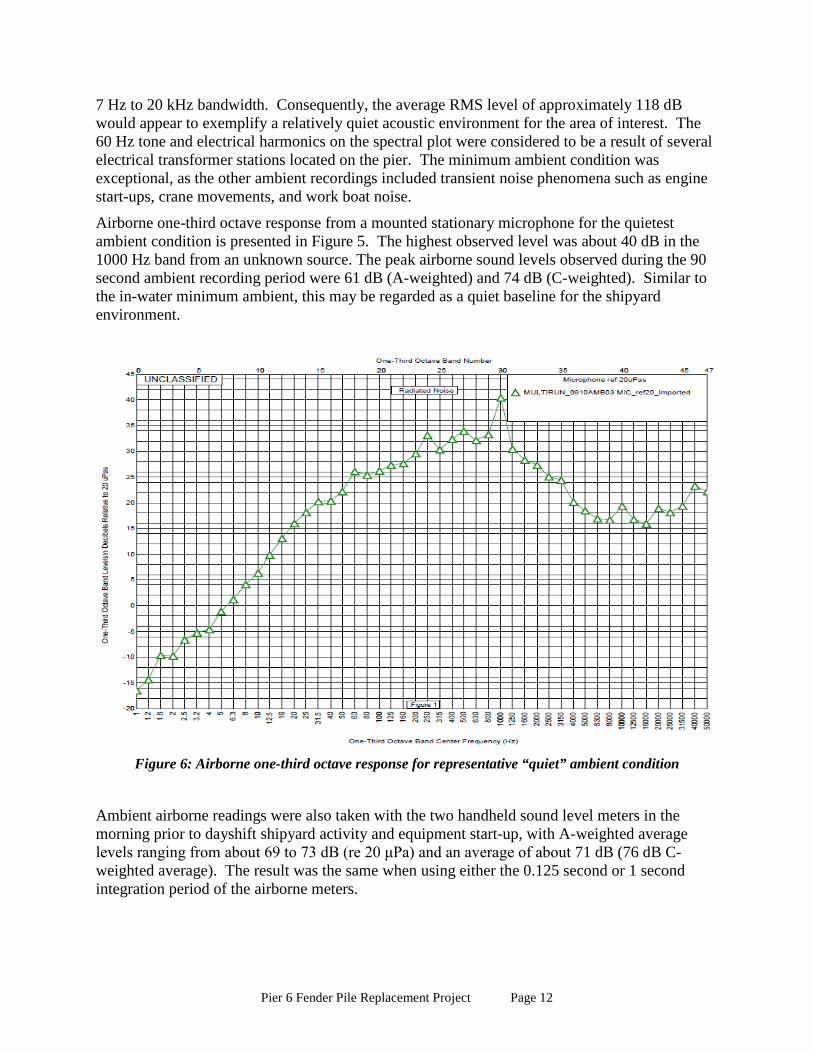
Airborne one-third octave response from a mounted stationary microphone for the quietest ambient condition is presented in Figure 5. The highest observed level was about 40 dB in the 1000 Hz band from an unknown source. The peak airborne sound levels observed during the 90 second ambient recording period were 61 dB (A-weighted) and 74 dB (C-weighted). Similar to the in-water minimum ambient, this may be regarded as a quiet baseline for the shipyard environment.
Figure 6: Airborne one-third octave response for representative “quiet” ambient condition
Ambient airborne readings were also taken with the two handheld sound level meters in the morning prior to dayshift shipyard activity and equipment start-up, with A-weighted average levels ranging from about 69 to 73 dB (re 20 μPa) and an average of about 71 dB (76 dB C-weighted average). The result was the same when using either the 0.125 second or 1 second integration period of the airborne meters.
Pier 6 Fender Pile Replacement Project Page 13
Pile Extraction In-Water Noise A vibrating pile extractor was used to remove 10 creosote-treated timber piles on September 10, 2015. Pile extraction resulted in maximum SPL values 10 m (32.8 ft) from each pile ranging from approximately 138 to 158 dB (re 1 μPa) over the 7 Hz to 20 kHz bandwidth, based on post-processed wav files collected from the University of Washington Applied Physics Laboratory Yuma® USLM acoustic data recorder. Table 2 provides a summary of results for the average RMS value in each of four analysis bandwidths, and the vibratory duration for each event. In certain instances a pile required multiple efforts for removal; therefore “Pile 2/Event 2” represents the second effort to remove the second pile that was extracted on that day. Maximum RMS values for these pile extraction events for maximum 10-second averages are summarized in Table 3. Values in this table represent the highest 10 second period in each of four analysis bandwidths.
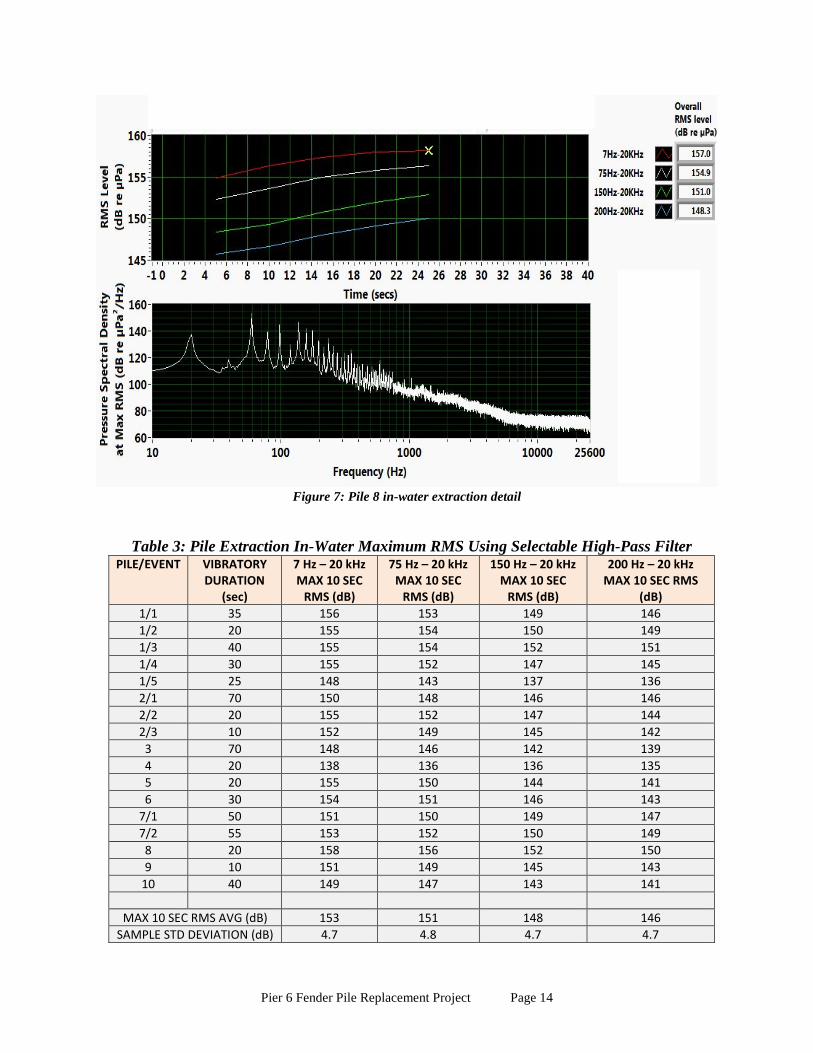
The average overall RMS level for all of the piling extractions was 152 dB (sample standard deviation of 5.1) using the 7 Hz to 20 kHz bandwidth. RMS levels and a frequency domain plot taken at the highest overall RMS level are graphically illustrated in Figure 7 for the extraction of pile 8, the event with the highest acoustic pressure level amplitude. The RMS level of the event increased from about 155 dB to 158 dB over a time period of about 20 seconds. The RMS values in Figure 8 represent five-second averages. The spectrum features large amplitude components at about 20 Hz (vibratory extractor fundamental frequency) and 60 Hz (electrical noise from nearby transformers), followed by a 10 Hz and 20 Hz harmonic series that decreases in amplitude with increasing frequency. These frequency components were common to the other pile extraction spectra.
Table 2: Pile Extraction In-Water RMS Results Using Selectable High-Pass Filter
PILE/EVENT VIBRATORY DURATION
(sec)
7 Hz – 20 kHz RMS LEVEL
(dB)
75 Hz – 20 kHz RMS LEVEL
(dB)
150 Hz – 20 kHz RMS LEVEL
(dB)
200 Hz – 20 kHz RMS LEVEL
(dB) 1/1 35 150 148 144 142 1/2 20 154 152 149 148 1/3 40 153 153 150 149 1/4 30 154 151 146 144 1/5 25 142 139 136 135 2/1 70 148 146 144 143 2/2 20 153 150 145 143 2/3 10 152 149 144 142
3 70 146 144 140 137 4 20 138 136 135 135 5 20 154 149 143 140 6 30 150 147 142 140
7/1 50 149 148 147 145 7/2 55 152 151 149 148
8 20 157 155 151 148 9 10 150 148 144 142
10 40 144 142 138 136
OVERALL RMS AVERAGE (dB) 152 150 146 144 SAMPLE STD DEVIATION (dB) 5.1 5.1 4.8 4.6
Pier 6 Fender Pile Replacement Project Page 14
Figure 7: Pile 8 in-water extraction detail
Table 3: Pile Extraction In-Water Maximum RMS Using Selectable High-Pass Filter PILE/EVENT VIBRATORY
DURATION (sec)
7 Hz – 20 kHz MAX 10 SEC
RMS (dB)
75 Hz – 20 kHz MAX 10 SEC
RMS (dB)
150 Hz – 20 kHz MAX 10 SEC
RMS (dB)
200 Hz – 20 kHz MAX 10 SEC RMS
(dB) 1/1 35 156 153 149 146 1/2 20 155 154 150 149 1/3 40 155 154 152 151 1/4 30 155 152 147 145 1/5 25 148 143 137 136 2/1 70 150 148 146 146 2/2 20 155 152 147 144 2/3 10 152 149 145 142 3 70 148 146 142 139 4 20 138 136 136 135 5 20 155 150 144 141 6 30 154 151 146 143
7/1 50 151 150 149 147 7/2 55 153 152 150 149 8 20 158 156 152 150 9 10 151 149 145 143
10 40 149 147 143 141
MAX 10 SEC RMS AVG (dB) 153 151 148 146 SAMPLE STD DEVIATION (dB) 4.7 4.8 4.7 4.7
Pier 6 Fender Pile Replacement Project Page 15
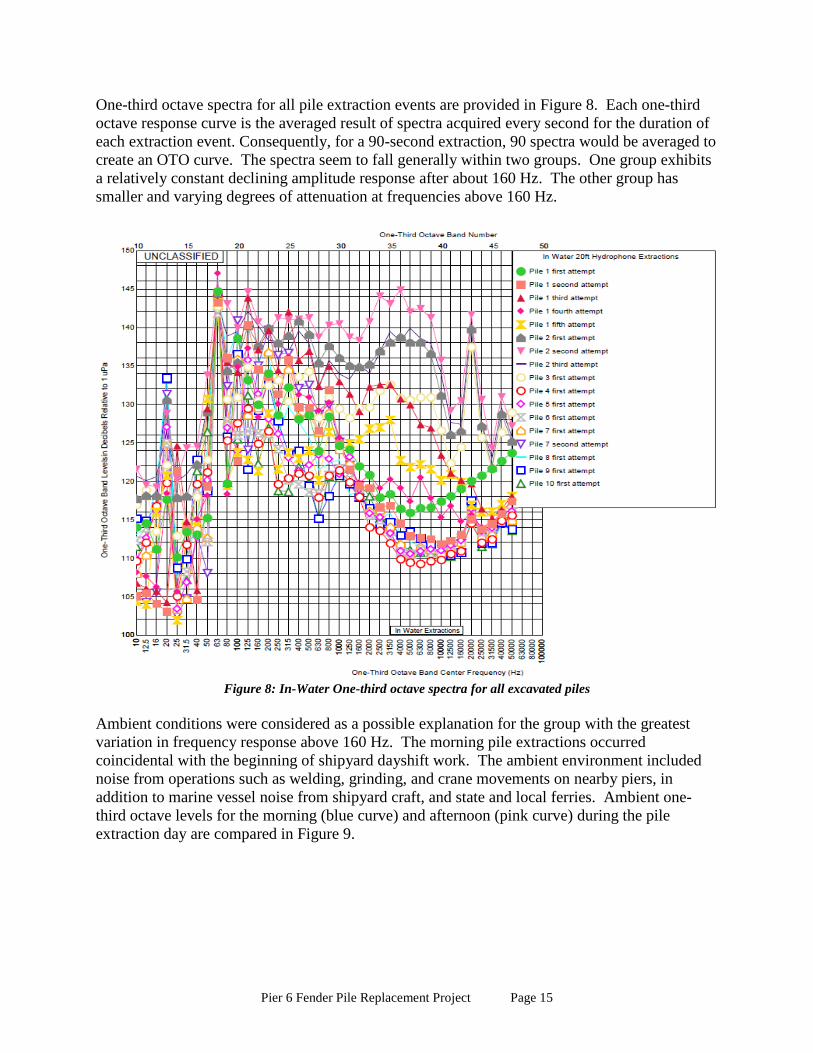
One-third octave spectra for all pile extraction events are provided in Figure 8. Each one-third octave response curve is the averaged result of spectra acquired every second for the duration of each extraction event. Consequently, for a 90-second extraction, 90 spectra would be averaged to create an OTO curve. The spectra seem to fall generally within two groups. One group exhibits a relatively constant declining amplitude response after about 160 Hz. The other group has smaller and varying degrees of attenuation at frequencies above 160 Hz.
Figure 8: In-Water One-third octave spectra for all excavated piles
Ambient conditions were considered as a possible explanation for the group with the greatest variation in frequency response above 160 Hz. The morning pile extractions occurred coincidental with the beginning of shipyard dayshift work. The ambient environment included noise from operations such as welding, grinding, and crane movements on nearby piers, in addition to marine vessel noise from shipyard craft, and state and local ferries. Ambient one-third octave levels for the morning (blue curve) and afternoon (pink curve) during the pile extraction day are compared in Figure 9.
Pier 6 Fender Pile Replacement Project Page 16
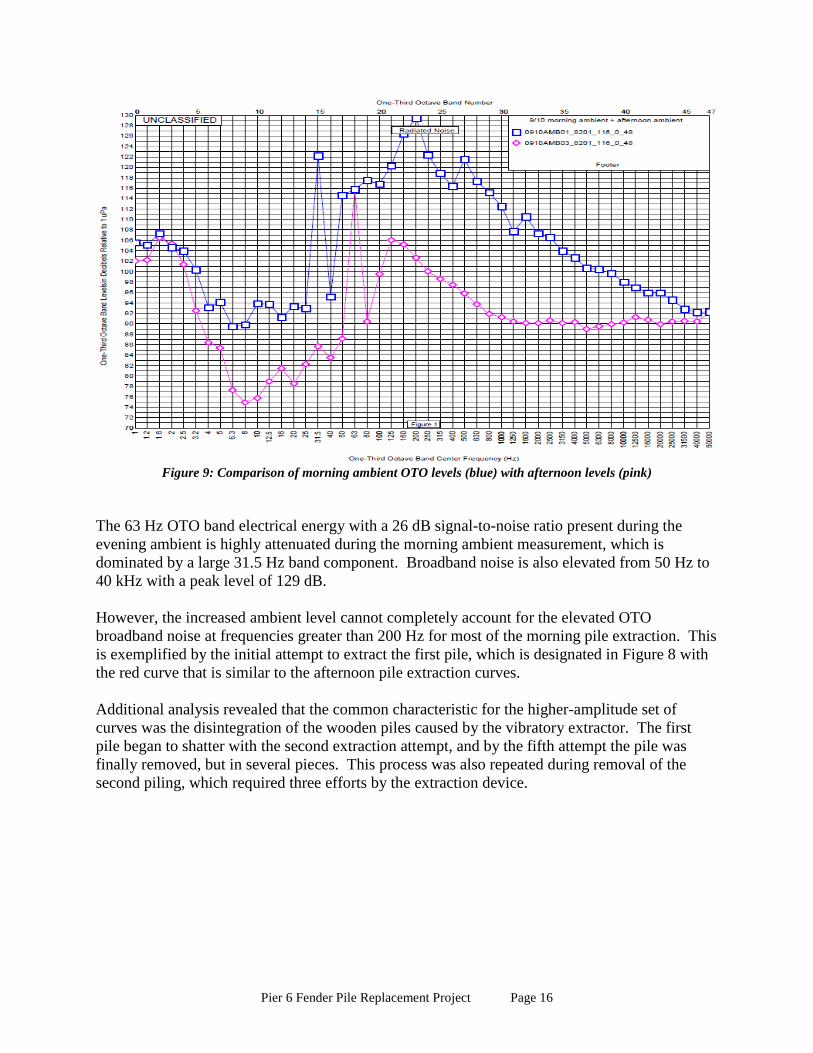
Figure 9: Comparison of morning ambient OTO levels (blue) with afternoon levels (pink)
The 63 Hz OTO band electrical energy with a 26 dB signal-to-noise ratio present during the evening ambient is highly attenuated during the morning ambient measurement, which is dominated by a large 31.5 Hz band component. Broadband noise is also elevated from 50 Hz to 40 kHz with a peak level of 129 dB. However, the increased ambient level cannot completely account for the elevated OTO broadband noise at frequencies greater than 200 Hz for most of the morning pile extraction. This is exemplified by the initial attempt to extract the first pile, which is designated in Figure 8 with the red curve that is similar to the afternoon pile extraction curves. Additional analysis revealed that the common characteristic for the higher-amplitude set of curves was the disintegration of the wooden piles caused by the vibratory extractor. The first pile began to shatter with the second extraction attempt, and by the fifth attempt the pile was finally removed, but in several pieces. This process was also repeated during removal of the second piling, which required three efforts by the extraction device.
Pier 6 Fender Pile Replacement Project Page 17
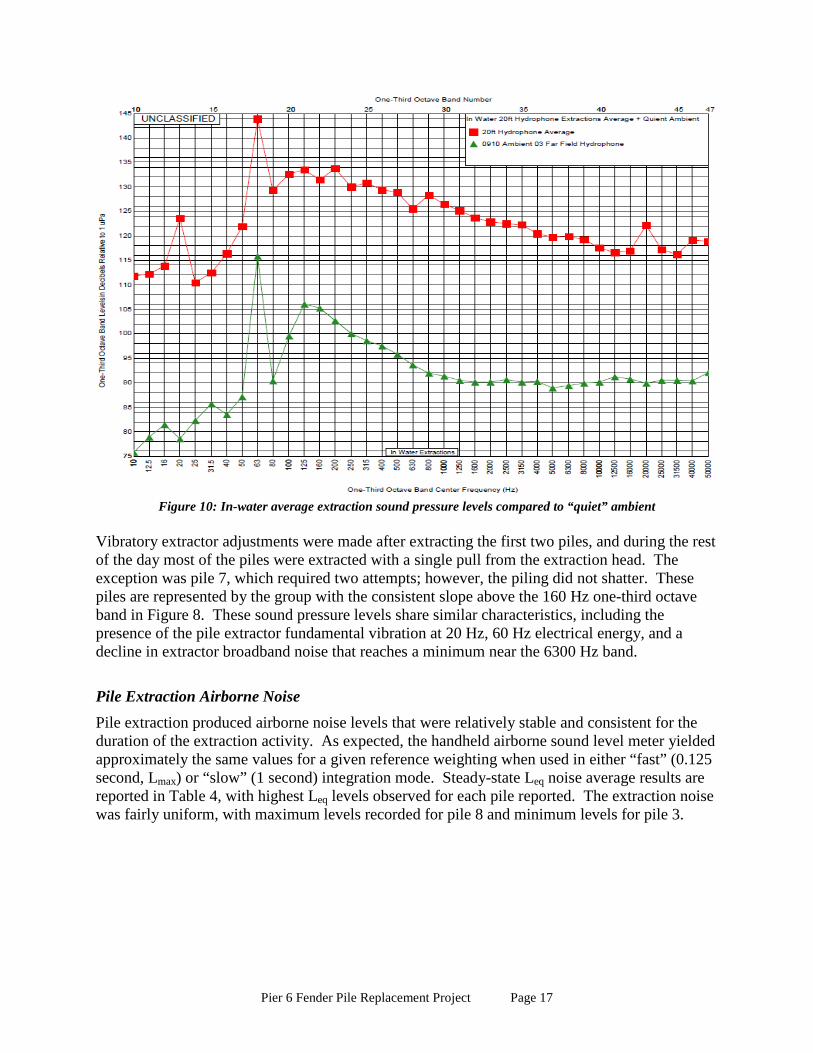
Figure 10: In-water average extraction sound pressure levels compared to “quiet” ambient
Vibratory extractor adjustments were made after extracting the first two piles, and during the rest of the day most of the piles were extracted with a single pull from the extraction head. The exception was pile 7, which required two attempts; however, the piling did not shatter. These piles are represented by the group with the consistent slope above the 160 Hz one-third octave band in Figure 8. These sound pressure levels share similar characteristics, including the presence of the pile extractor fundamental vibration at 20 Hz, 60 Hz electrical energy, and a decline in extractor broadband noise that reaches a minimum near the 6300 Hz band.
Pile Extraction Airborne Noise Pile extraction produced airborne noise levels that were relatively stable and consistent for the duration of the extraction activity. As expected, the handheld airborne sound level meter yielded approximately the same values for a given reference weighting when used in either “fast” (0.125 second, Lmax) or “slow” (1 second) integration mode. Steady-state Leq noise average results are reported in Table 4, with highest Leq levels observed for each pile reported. The extraction noise was fairly uniform, with maximum levels recorded for pile 8 and minimum levels for pile 3.

Pier 6 Fender Pile Replacement Project Page 18
Table 4: Pile Extraction Peak RMS Airborne Noise Levels
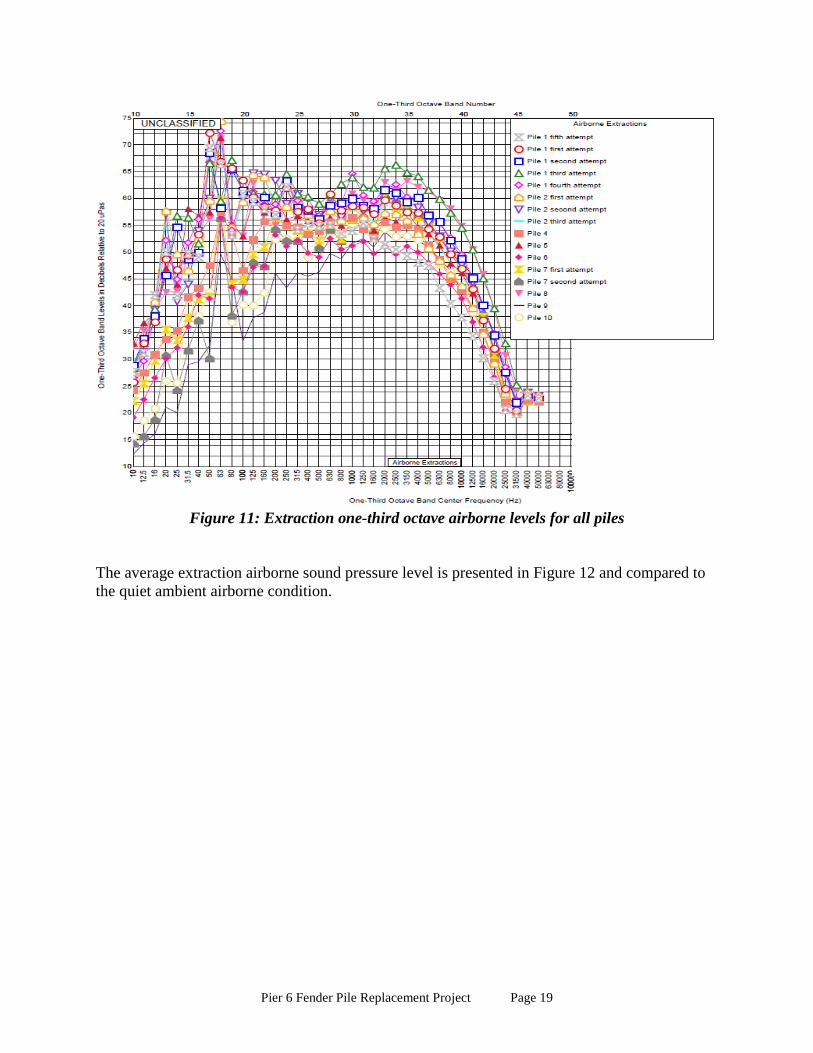
One-third octave airborne levels varied throughout the analysis range by approximately 20 dB for all piles extracted (Figure 11). This observation is likely due to the intermittent nature of the one-third octave recordings which were not edited to select loudest intervals. Note that the airborne sound pressure level curves are roughly the same shape compared to the in-water levels illustrated in Figure 6. Therefore, the in-water variation in broadband noise above 160 Hz for the piles that shattered upon removal did not appear to be a major factor for the airborne data.
PILE/EVENT A-WEIGHTING Leq (dB)
C-WEIGHTING Leq (dB)
1/1 84 93 1/2 84 93 1/3 82 92 1/4 80 90 1/5 79 89 2/1 84 92 2/2 84 92 2/3 83 92 3 76 88 4 81 89 5 83 92 6 82 91
7/1 85 94 7/2 85 94 8 88 97 9 84 94
10 83 95 AVERAGE 83 92
STD DEVIATION 2.8 2.4
Pier 6 Fender Pile Replacement Project Page 19
Figure 11: Extraction one-third octave airborne levels for all piles
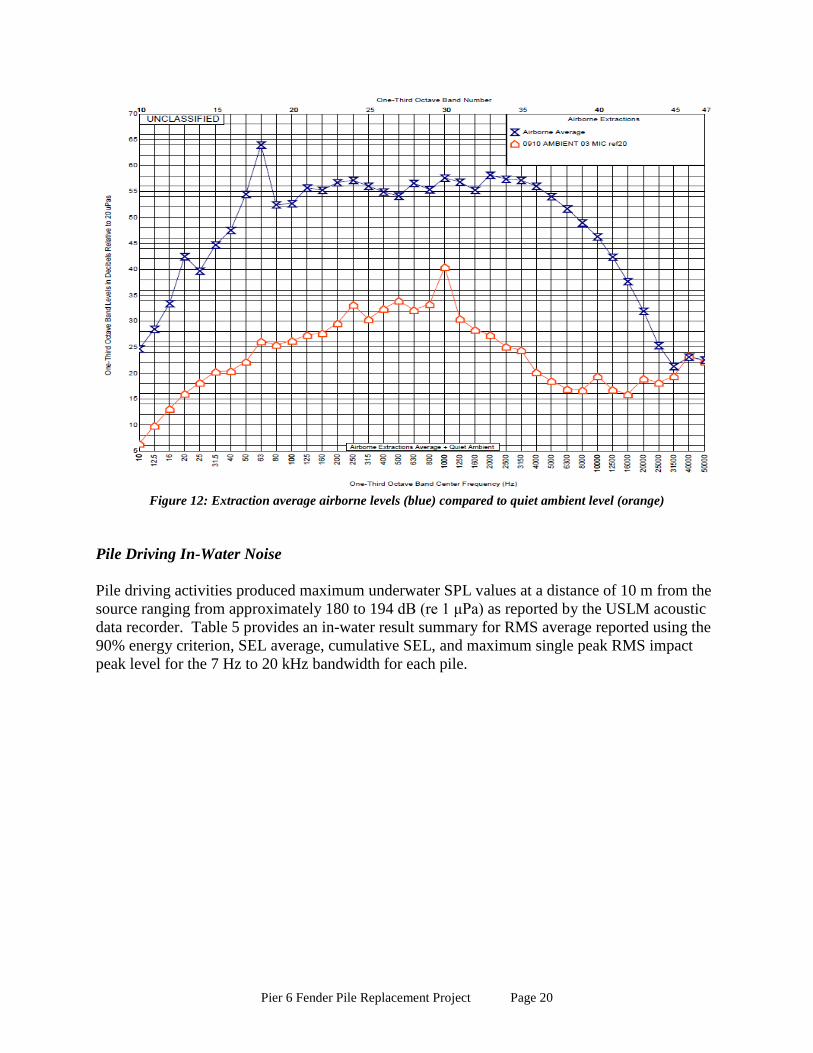
The average extraction airborne sound pressure level is presented in Figure 12 and compared to the quiet ambient airborne condition.
Pier 6 Fender Pile Replacement Project Page 20
Figure 12: Extraction average airborne levels (blue) compared to quiet ambient level (orange)
Pile Driving In-Water Noise Pile driving activities produced maximum underwater SPL values at a distance of 10 m from the source ranging from approximately 180 to 194 dB (re 1 μPa) as reported by the USLM acoustic data recorder. Table 5 provides an in-water result summary for RMS average reported using the 90% energy criterion, SEL average, cumulative SEL, and maximum single peak RMS impact peak level for the 7 Hz to 20 kHz bandwidth for each pile.
Pier 6 Fender Pile Replacement Project Page 21
Table 5: Impact Pile-Driving In-Water Summary
PILE ID # NUMBER of
IMPACTS RMS AVERAGE
(dB) SEL AVERAGE
(dB) CUMULATIVE
SEL (dB)
MAX PEAK LEVEL (dB)
94 144 178 164 185 187 93 170 178 165 187 188 92 218 180 166 190 189 91 200 177 167 190 190 90 200 180 167 189 190 89 126 183 170 191 194
106 28 172 161 176 186 105 36 173 163 178 184 104 115 170 165 185 186 103 10 168 159 169 180
OVERALL AVG LEVEL (dB) 178 166 187 189
SAMPLE STD DEVIATION (dB) 4.9 3.2 7.3 3.8
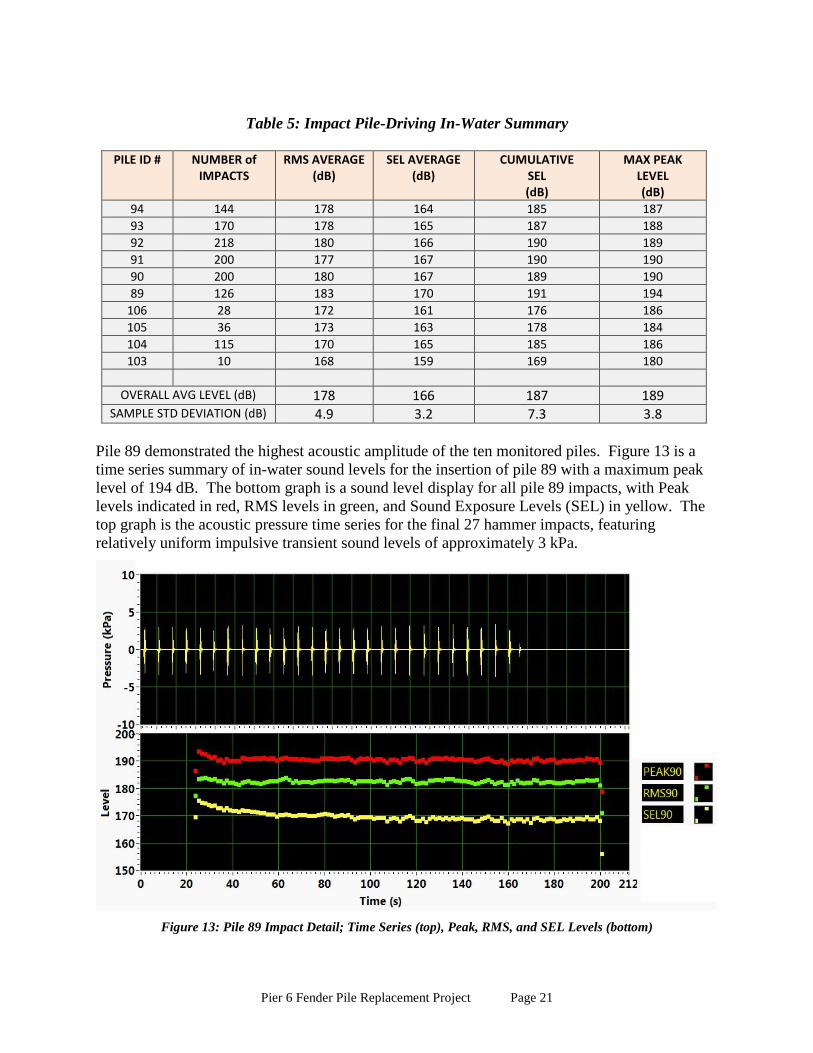
Pile 89 demonstrated the highest acoustic amplitude of the ten monitored piles. Figure 13 is a time series summary of in-water sound levels for the insertion of pile 89 with a maximum peak level of 194 dB. The bottom graph is a sound level display for all pile 89 impacts, with Peak levels indicated in red, RMS levels in green, and Sound Exposure Levels (SEL) in yellow. The top graph is the acoustic pressure time series for the final 27 hammer impacts, featuring relatively uniform impulsive transient sound levels of approximately 3 kPa.
Figure 13: Pile 89 Impact Detail; Time Series (top), Peak, RMS, and SEL Levels (bottom)
Pier 6 Fender Pile Replacement Project Page 22
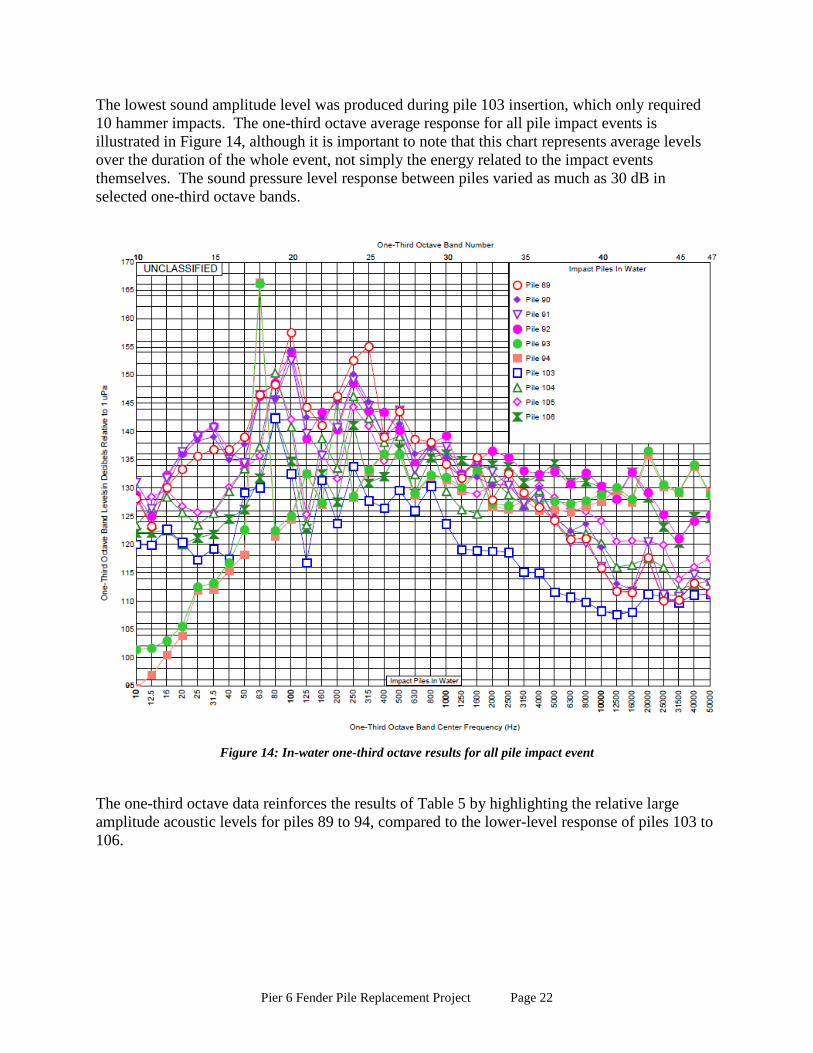
The lowest sound amplitude level was produced during pile 103 insertion, which only required 10 hammer impacts. The one-third octave average response for all pile impact events is illustrated in Figure 14, although it is important to note that this chart represents average levels over the duration of the whole event, not simply the energy related to the impact events themselves. The sound pressure level response between piles varied as much as 30 dB in selected one-third octave bands.
Figure 14: In-water one-third octave results for all pile impact event
The one-third octave data reinforces the results of Table 5 by highlighting the relative large amplitude acoustic levels for piles 89 to 94, compared to the lower-level response of piles 103 to 106.
Pier 6 Fender Pile Replacement Project Page 23
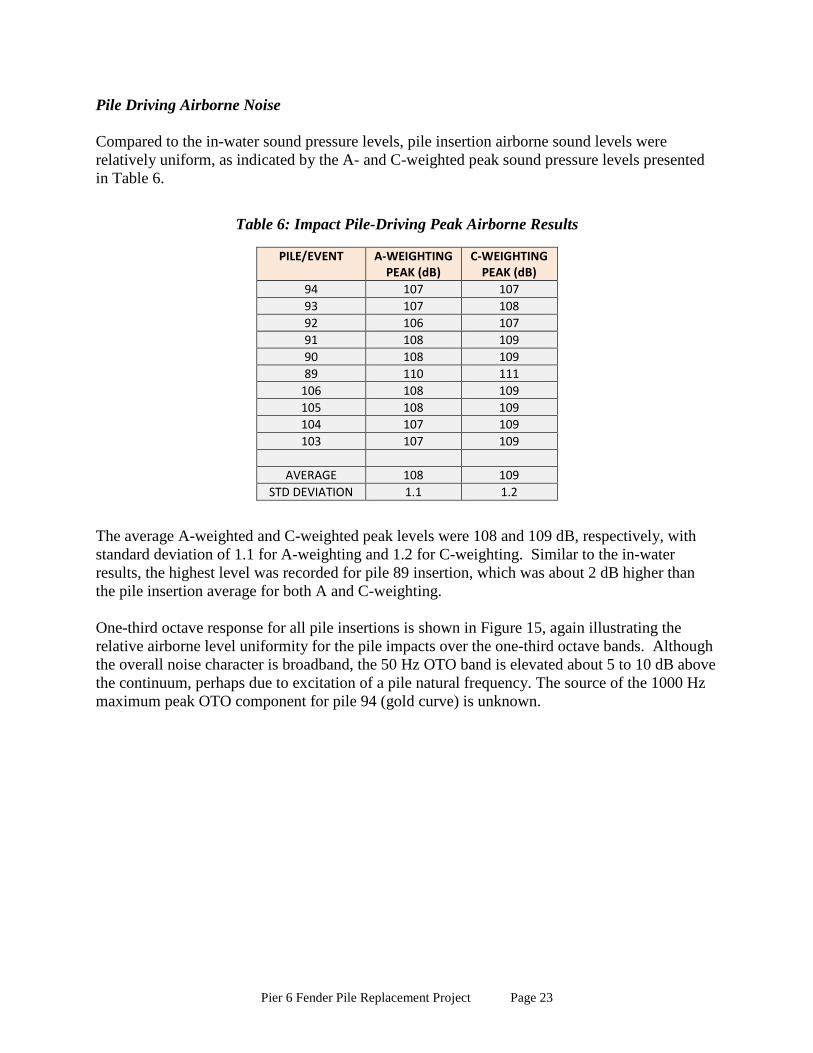
Pile Driving Airborne Noise Compared to the in-water sound pressure levels, pile insertion airborne sound levels were relatively uniform, as indicated by the A- and C-weighted peak sound pressure levels presented in Table 6.
Table 6: Impact Pile-Driving Peak Airborne Results
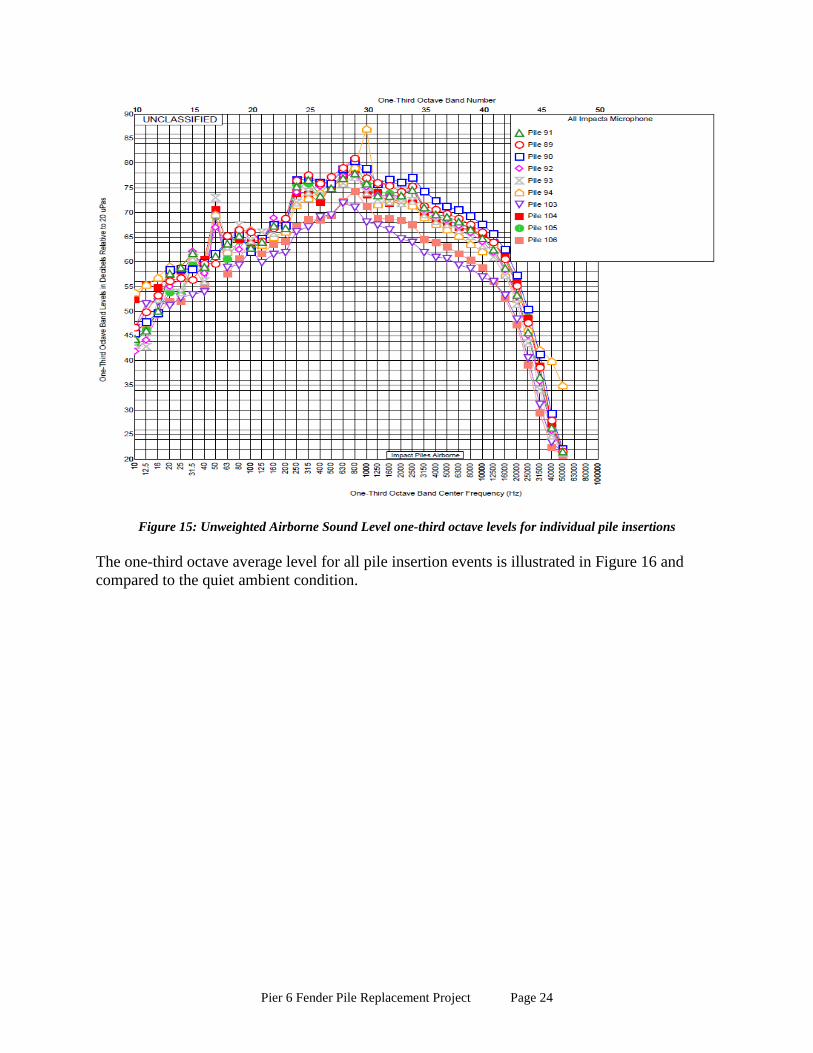
The average A-weighted and C-weighted peak levels were 108 and 109 dB, respectively, with standard deviation of 1.1 for A-weighting and 1.2 for C-weighting. Similar to the in-water results, the highest level was recorded for pile 89 insertion, which was about 2 dB higher than the pile insertion average for both A and C-weighting. One-third octave response for all pile insertions is shown in Figure 15, again illustrating the relative airborne level uniformity for the pile impacts over the one-third octave bands. Although the overall noise character is broadband, the 50 Hz OTO band is elevated about 5 to 10 dB above the continuum, perhaps due to excitation of a pile natural frequency. The source of the 1000 Hz maximum peak OTO component for pile 94 (gold curve) is unknown.
PILE/EVENT A-WEIGHTING PEAK (dB)
C-WEIGHTING PEAK (dB)
94 107 107 93 107 108 92 106 107 91 108 109 90 108 109 89 110 111
106 108 109 105 108 109 104 107 109 103 107 109
AVERAGE 108 109
STD DEVIATION 1.1 1.2
Pier 6 Fender Pile Replacement Project Page 24
Figure 15: Unweighted Airborne Sound Level one-third octave levels for individual pile insertions The one-third octave average level for all pile insertion events is illustrated in Figure 16 and compared to the quiet ambient condition.
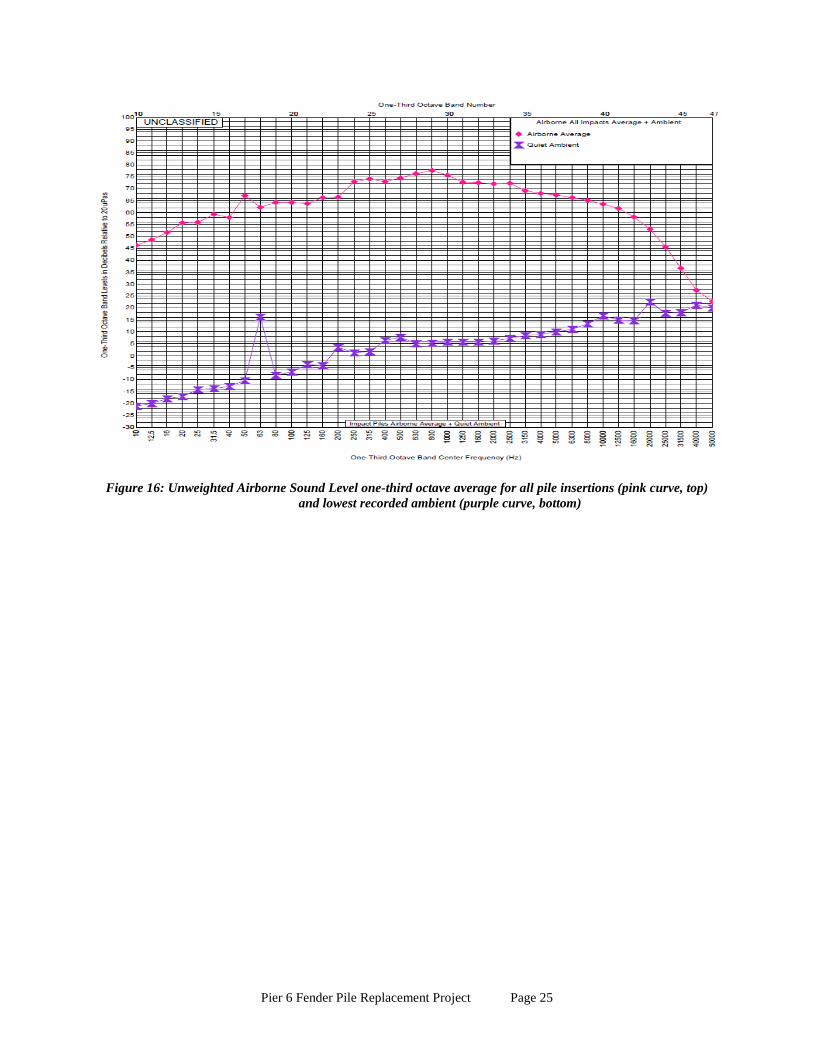
Pier 6 Fender Pile Replacement Project Page 25
Figure 16: Unweighted Airborne Sound Level one-third octave average for all pile insertions (pink curve, top) and lowest recorded ambient (purple curve, bottom)
Pier 6 Fender Pile Replacement Project Page 26
CONCLUSIONS
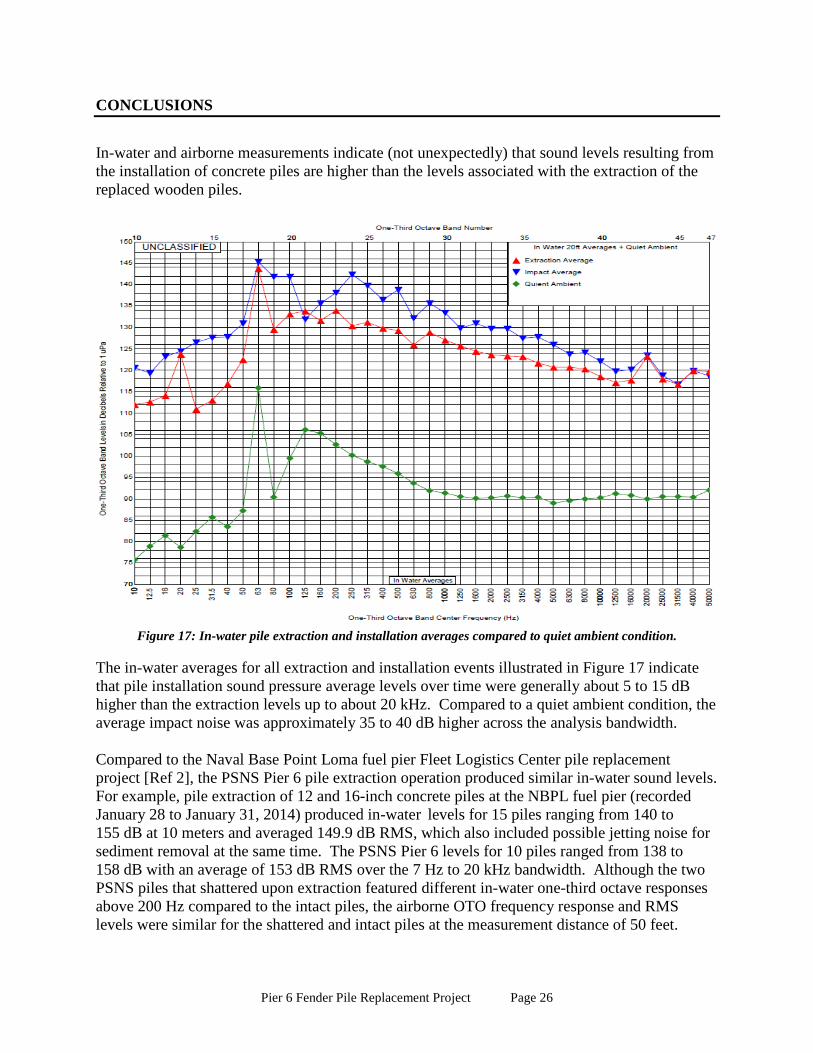
In-water and airborne measurements indicate (not unexpectedly) that sound levels resulting from the installation of concrete piles are higher than the levels associated with the extraction of the replaced wooden piles.
Figure 17: In-water pile extraction and installation averages compared to quiet ambient condition.
The in-water averages for all extraction and installation events illustrated in Figure 17 indicate that pile installation sound pressure average levels over time were generally about 5 to 15 dB higher than the extraction levels up to about 20 kHz. Compared to a quiet ambient condition, the average impact noise was approximately 35 to 40 dB higher across the analysis bandwidth. Compared to the Naval Base Point Loma fuel pier Fleet Logistics Center pile replacement project [Ref 2], the PSNS Pier 6 pile extraction operation produced similar in-water sound levels. For example, pile extraction of 12 and 16-inch concrete piles at the NBPL fuel pier (recorded January 28 to January 31, 2014) produced in-water levels for 15 piles ranging from 140 to 155 dB at 10 meters and averaged 149.9 dB RMS, which also included possible jetting noise for sediment removal at the same time. The PSNS Pier 6 levels for 10 piles ranged from 138 to 158 dB with an average of 153 dB RMS over the 7 Hz to 20 kHz bandwidth. Although the two PSNS piles that shattered upon extraction featured different in-water one-third octave responses above 200 Hz compared to the intact piles, the airborne OTO frequency response and RMS levels were similar for the shattered and intact piles at the measurement distance of 50 feet.
Pier 6 Fender Pile Replacement Project Page 27
In-water pile impact sound pressure levels at PSNS Pier 6 were generally of lower magnitude compared to Naval Base Point Loma, with a PSNS maximum SPL average of 189 dB versus 199.1 dB at Point Loma. Consequently, airborne levels were also higher at Point Loma, reaching an A-weighted maximum of about 116 dB compared to 110 dB at PSNS. In addition, in-water, one-third octave response for the Point Loma operation peaked in the 1.25 kHz band compared to OTO 800 Hz band at PSNS, but this may have been a result of differences in piling sizes, hammer and pile cap hardware type, or even sediment conditions at the two locations; PSNS piles were 24 inches in diameter compared to 30 and 36-inch piles at Point Loma. For both in-water and airborne measurements, the hammer impacts for each installed piling produced relatively uniform sound pressure amplitudes. In comparison to marine mammal injury and disturbance thresholds, the following conclusions are made: Airborne Noise: For extraction of timber piles, at distances less than 19.2 meters from a driven pile, harbor seals could have likely exceeded the haul-out threshold of 90 dB rms (unweighted), and pinnipeds could have exceed the threshold at distances of less than 6 meters, assuming a 6 dB per doubling of distance propagation loss in air (20∙log10(distance)) without any interposing structures between the pile and listening harbor seal. For impact driven 24-inch concrete piles, harbor seals would likely exceed haul-out threshold at a distances less than 135 meters from the pile, and pinnipeds would likely exceed haul-out threshold at distances less than 43 meters from a pile. Underwater Vibratory Noise (non-pulsed sounds): In all cases, cetaceans, pinnipeds, and harbor seals could have exceeded the Level B disturbance threshold during vibratory pile extraction. However, to put this into perspective, the quiet ambient at PSNS was measured at 118 dB, thus right at the disturbance threshold, even absent of any pile driving noise whatsoever. During vibratory extraction, at no time did any event exceed the Level A injury threshold at a distance of 10 meters or more. Assuming a 15∙log10(distance) propagation loss for practical spreading, these levels would not even be exceeded 1 meter from the pile. Underwater Impact Noise (pulsed sounds): Using the overall average RMS level for impact noise (178 dB re 1µPa at 10 meters), Level B disturbance threshold could have been exceeded during impact pile driving for cetaceans, pinnipeds, and harbor seals at distances less than 158 meters from the driven pile, assuming a 15∙log10(distance) propagation loss for practical spreading. Level A injury threshold of 180 dB RMS would be expected at a distance of 7 meters from the pile, and the threshold of 190 dB RMS would be expected at a distance of less than 2 meters from the pile, thus extremely unlikely that Level A injury would have occurred during impact pile driving, since no SPLs over the Level A injury threshold were observed at distances greater than 10 meters.
Pier 6 Fender Pile Replacement Project Page 28
REFERENCES
[1] D.S. Wieting – Incidental Harassment Authorization, United States Department of
Commerce National Oceanic and Atmospheric Administration, Silver Spring, MD, 28 August 2015
[2] NAVFAC Southwest – Naval Base Point Loma Fleet Logistics Center Fuel Pier
Replacement Project: Acoustic, Marine Mammal, Green Sea Turtle, and California Least Tern Monitoring Report, 2014.